Home
Classification
Maps
Graphs
About
Suggested citation: The Dickinson Climate Classification: A Taxonomic Thermal–Hydrological Partition of Climate State Space
[Preprint]. Zenodo.
https://doi.org/10.5281/zenodo.18857604
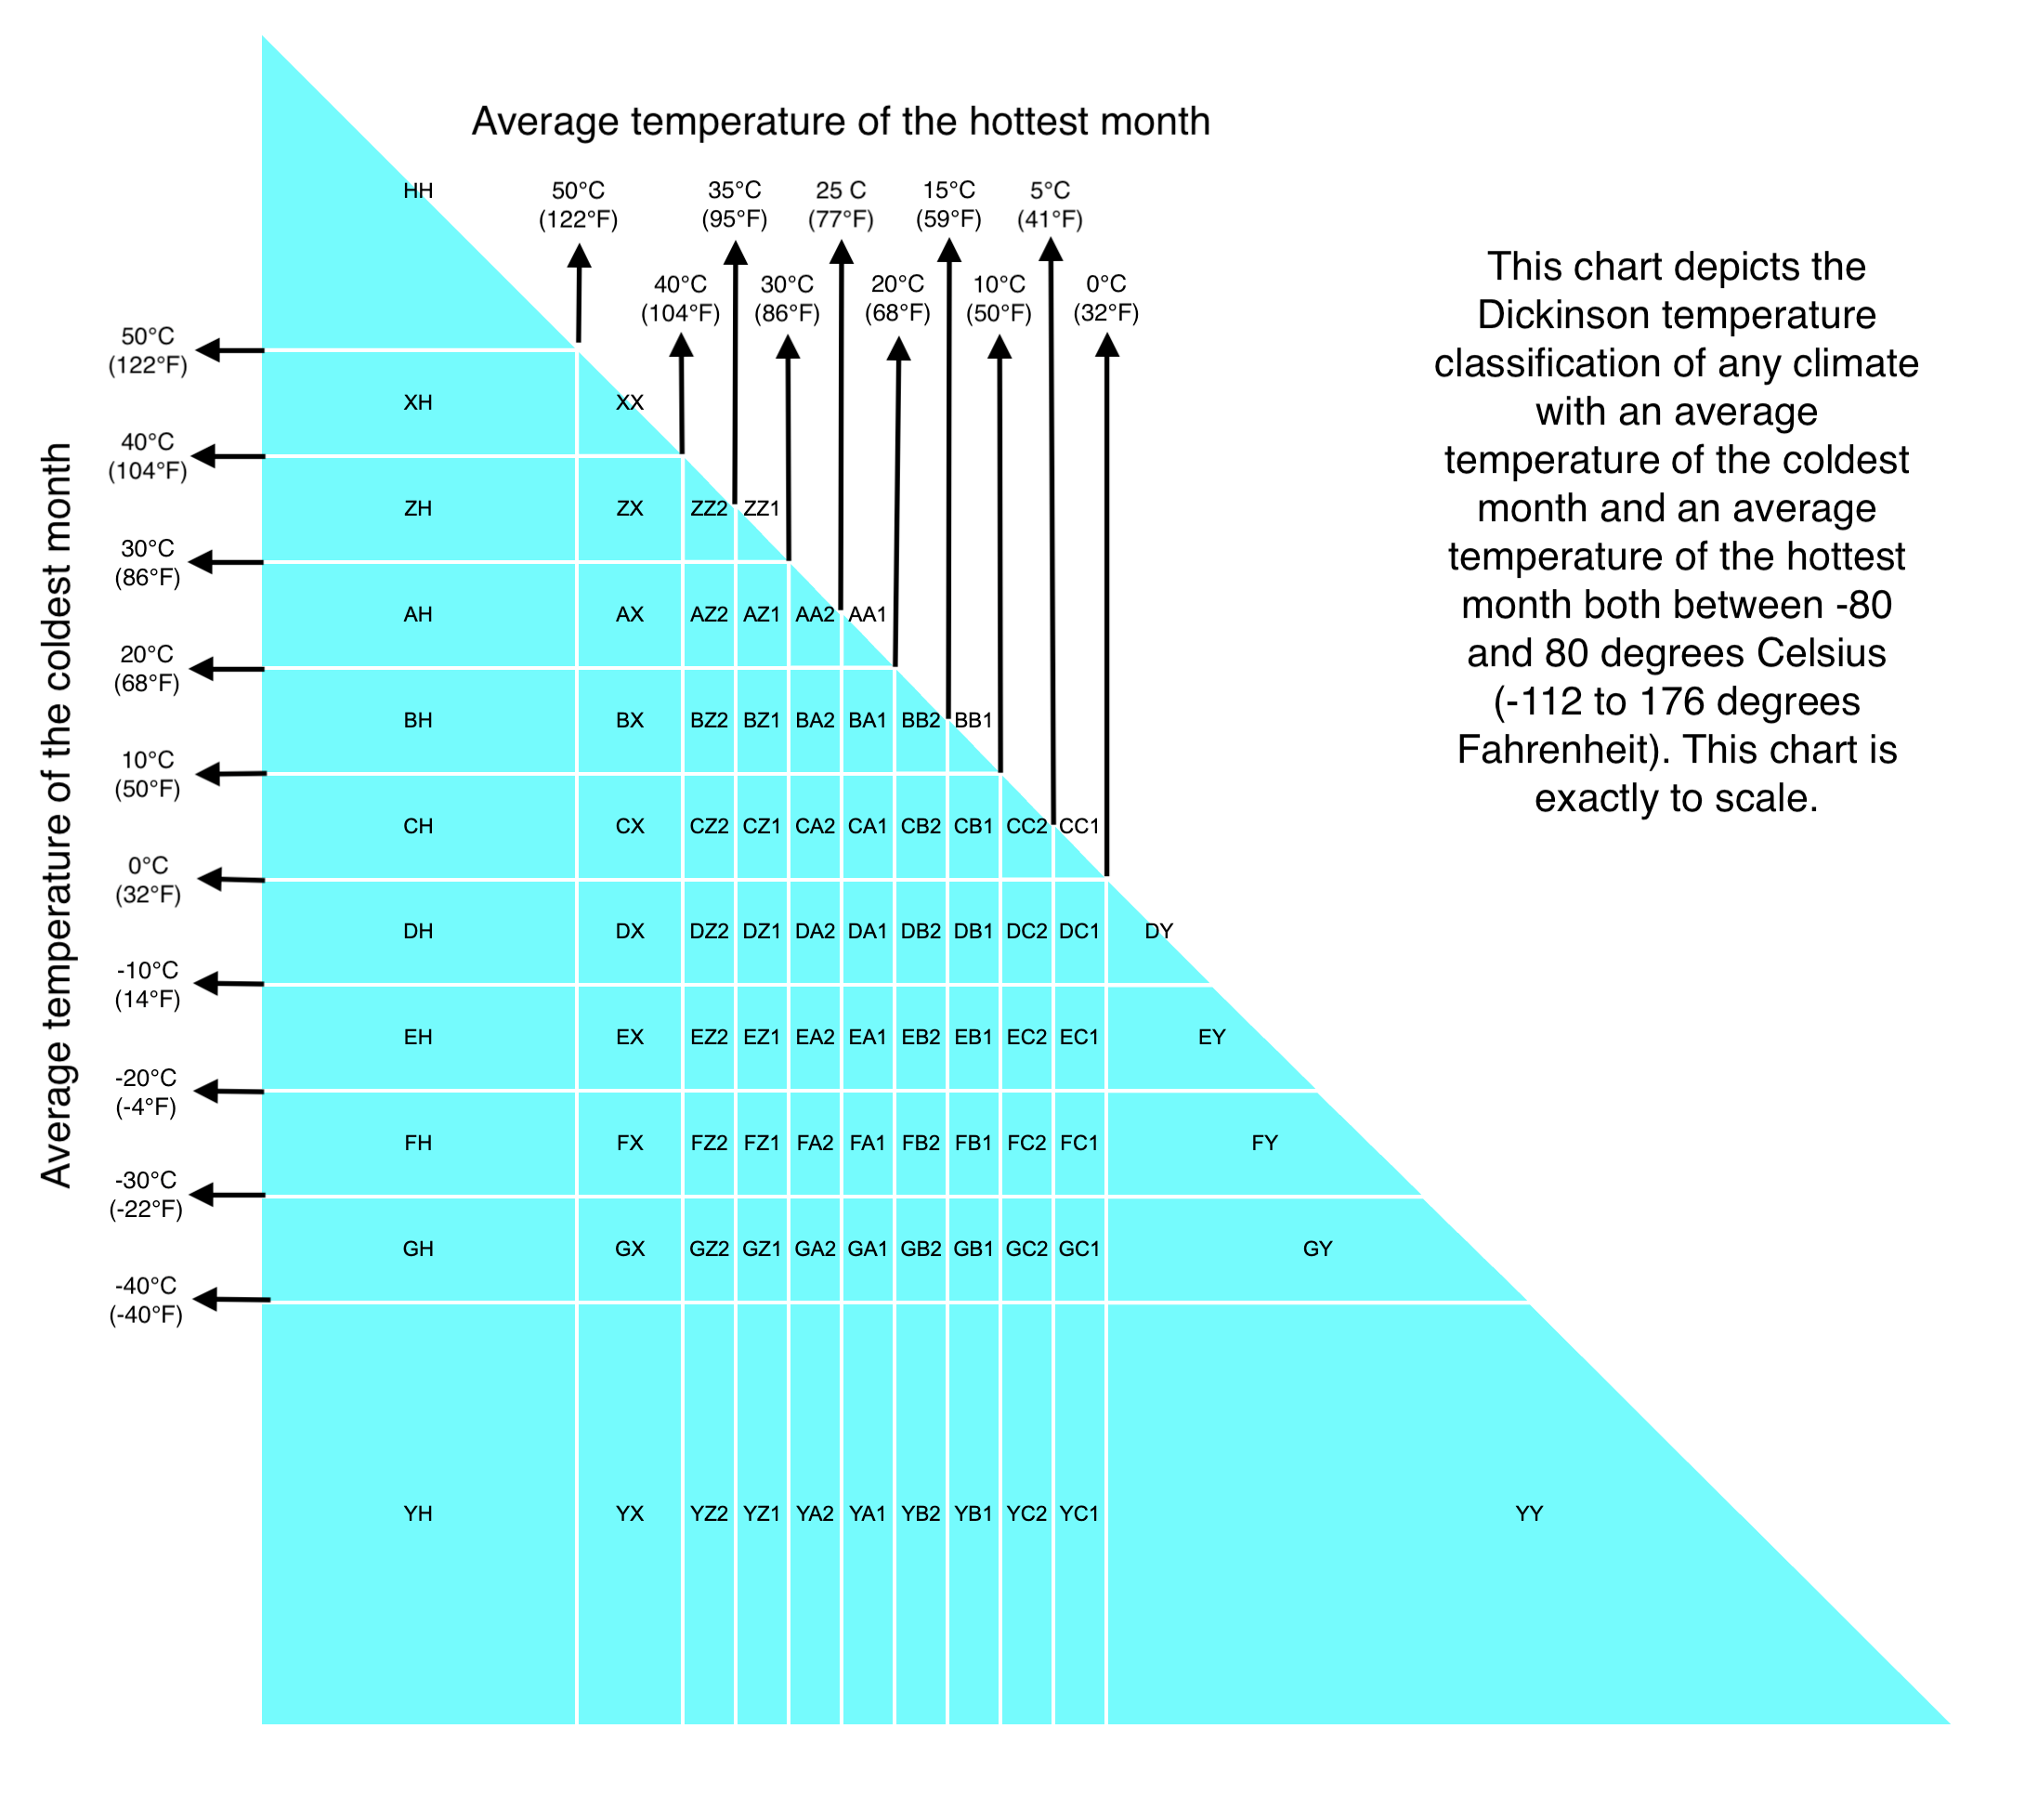
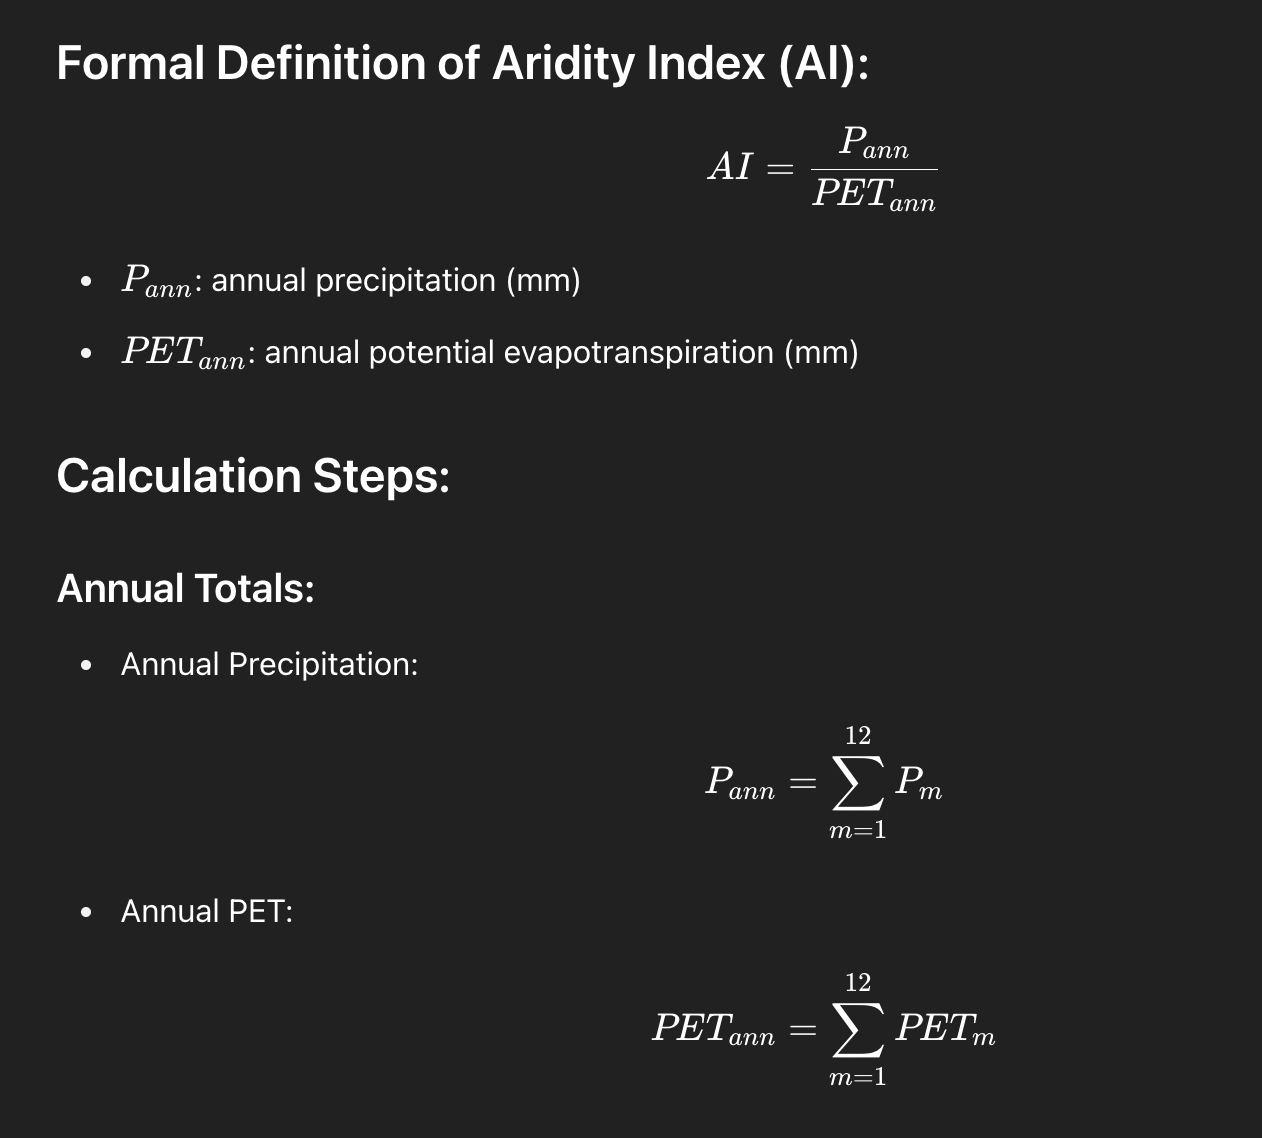
Supplemental Figure: Dickinson Temperature Classification Supplemental Figure: Dickinson Aridity Index (modified from UNEP aridity index) Supplemental Figure: Precise Aridity Data of Selected Cities within the Astronomical Tropics in the 1981-2010 Normals
x-axis: % of precipitation during the 6 consecutive rainiest months
50%
60%
70%
80%
90%
100%
Supplemental Figure: Precise Aridity Data of Selected Extratropical Cities in the 1981-2010 Normals
x-axis: % of precipitation during the 6 months of highest insolation
Supplemental Figure: Hottest and Coldest Month Means of Selected Cities in the 1981-2010 Normals (unless otherwise noted)
x-axis: average temperature of hottest month in Celsius