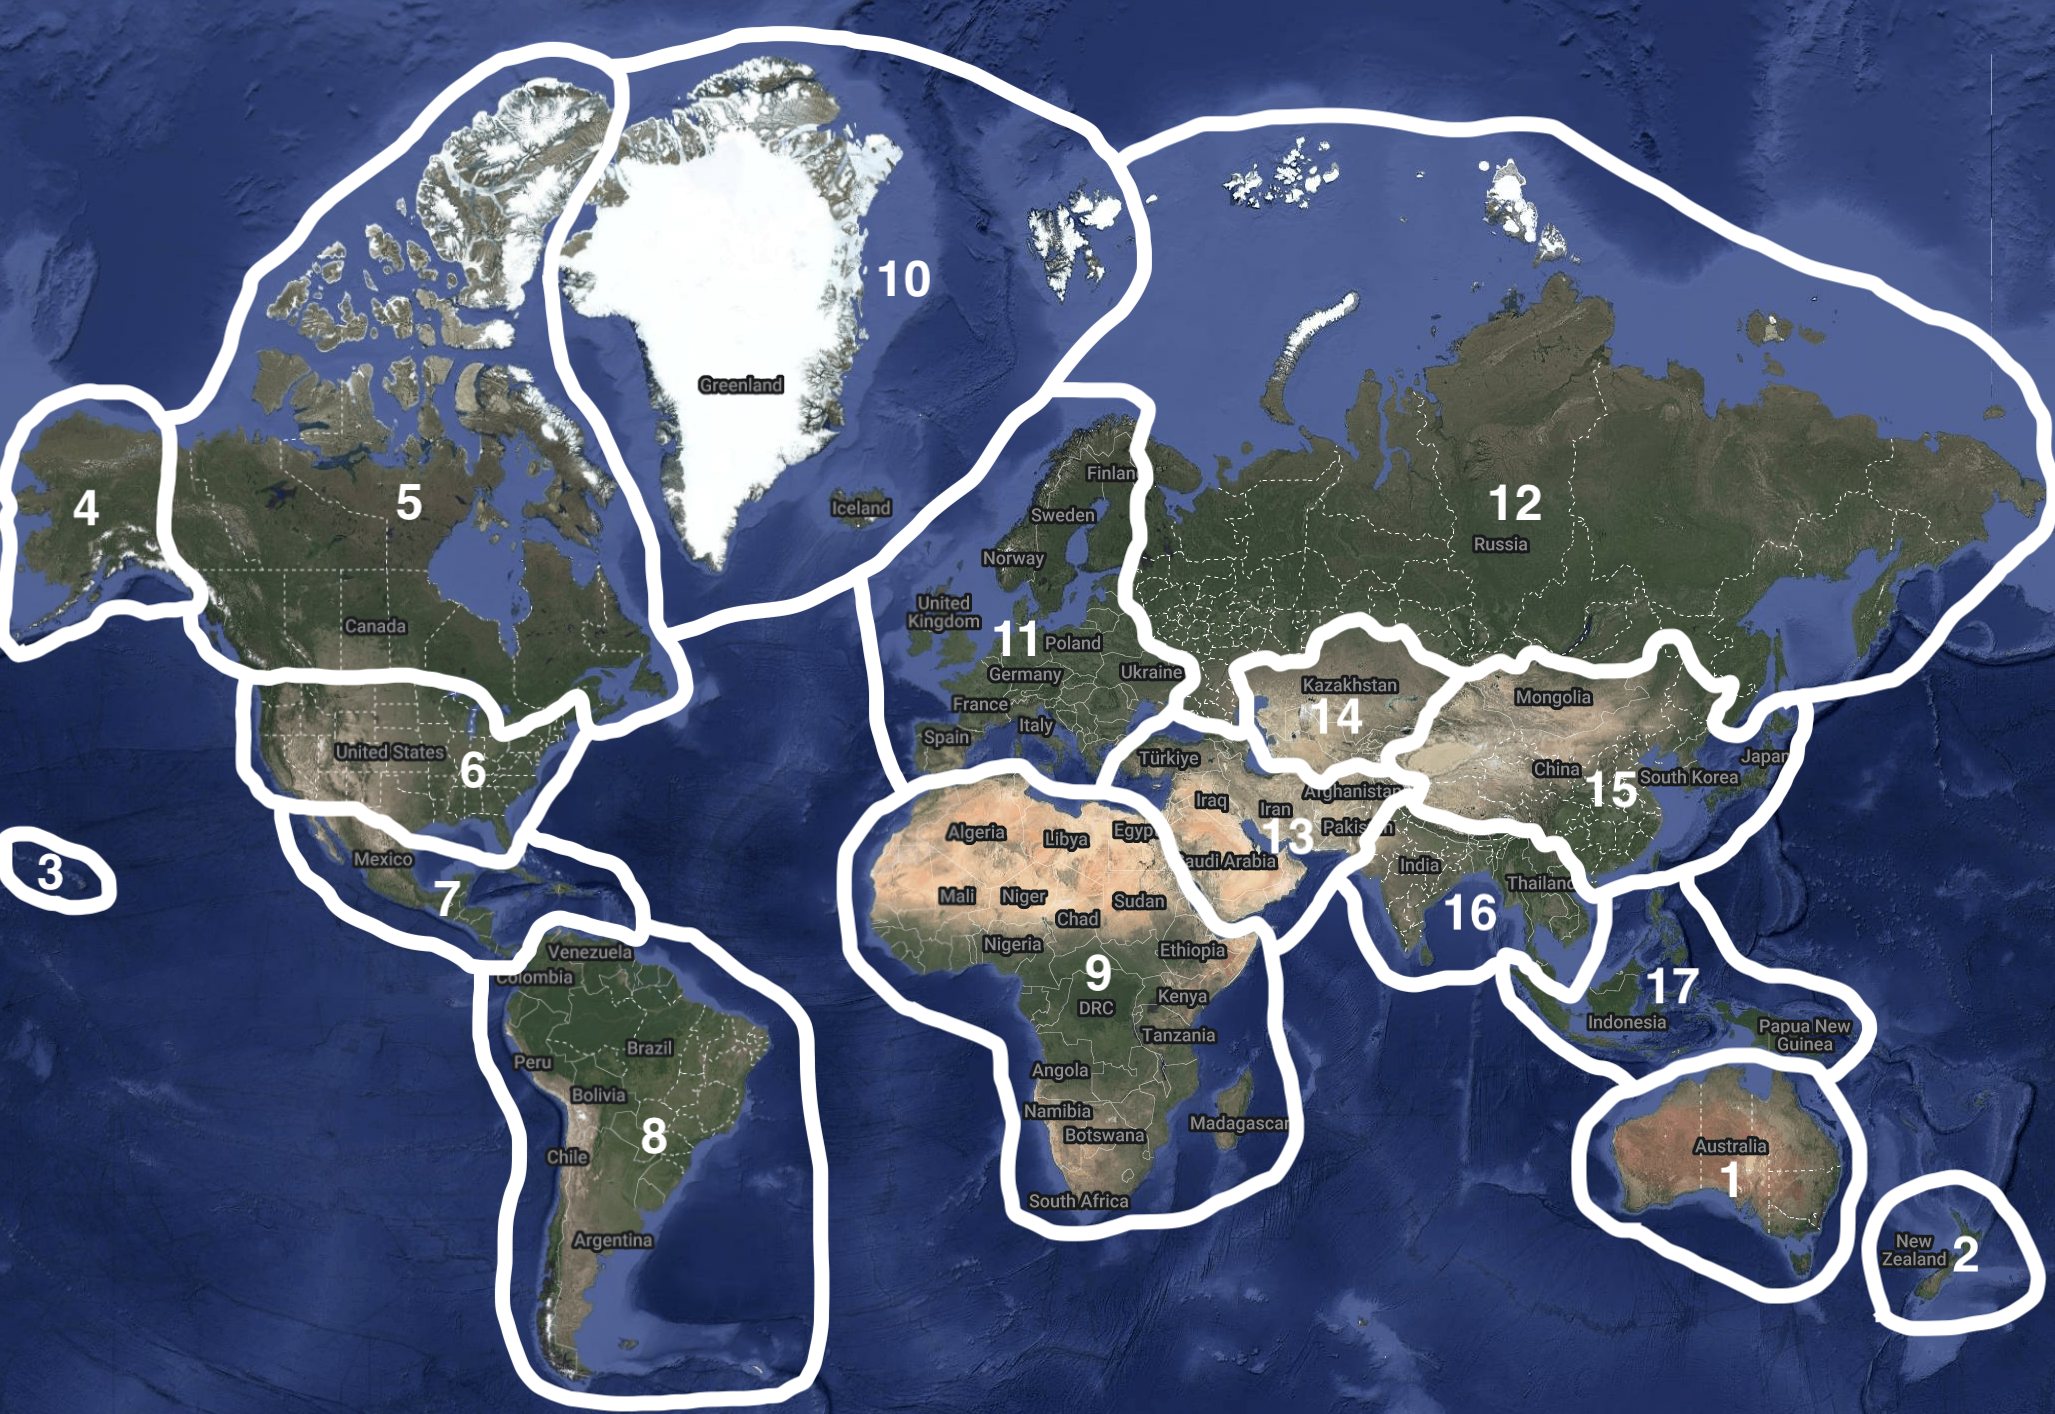
The maps on this page consist of classification maps, winter maps, aridity maps, summer maps, and aridity index (P/PET) maps, in that order. In the Dickinson system, each classification can be factored into 2 or 3 aspects of climate (depending on if aridity is defined) that are each measured independently of one another, and thus each aspect is mapped as well, following the full classification maps. Within each set of maps, global maps are presented first. 17 regions are then shown in the order listed below. When dividing locations into different regions, geographic coherence was prioritized over political exactness.
Note: many classification maps are still in the process of being labeled. However, all other maps are complete.
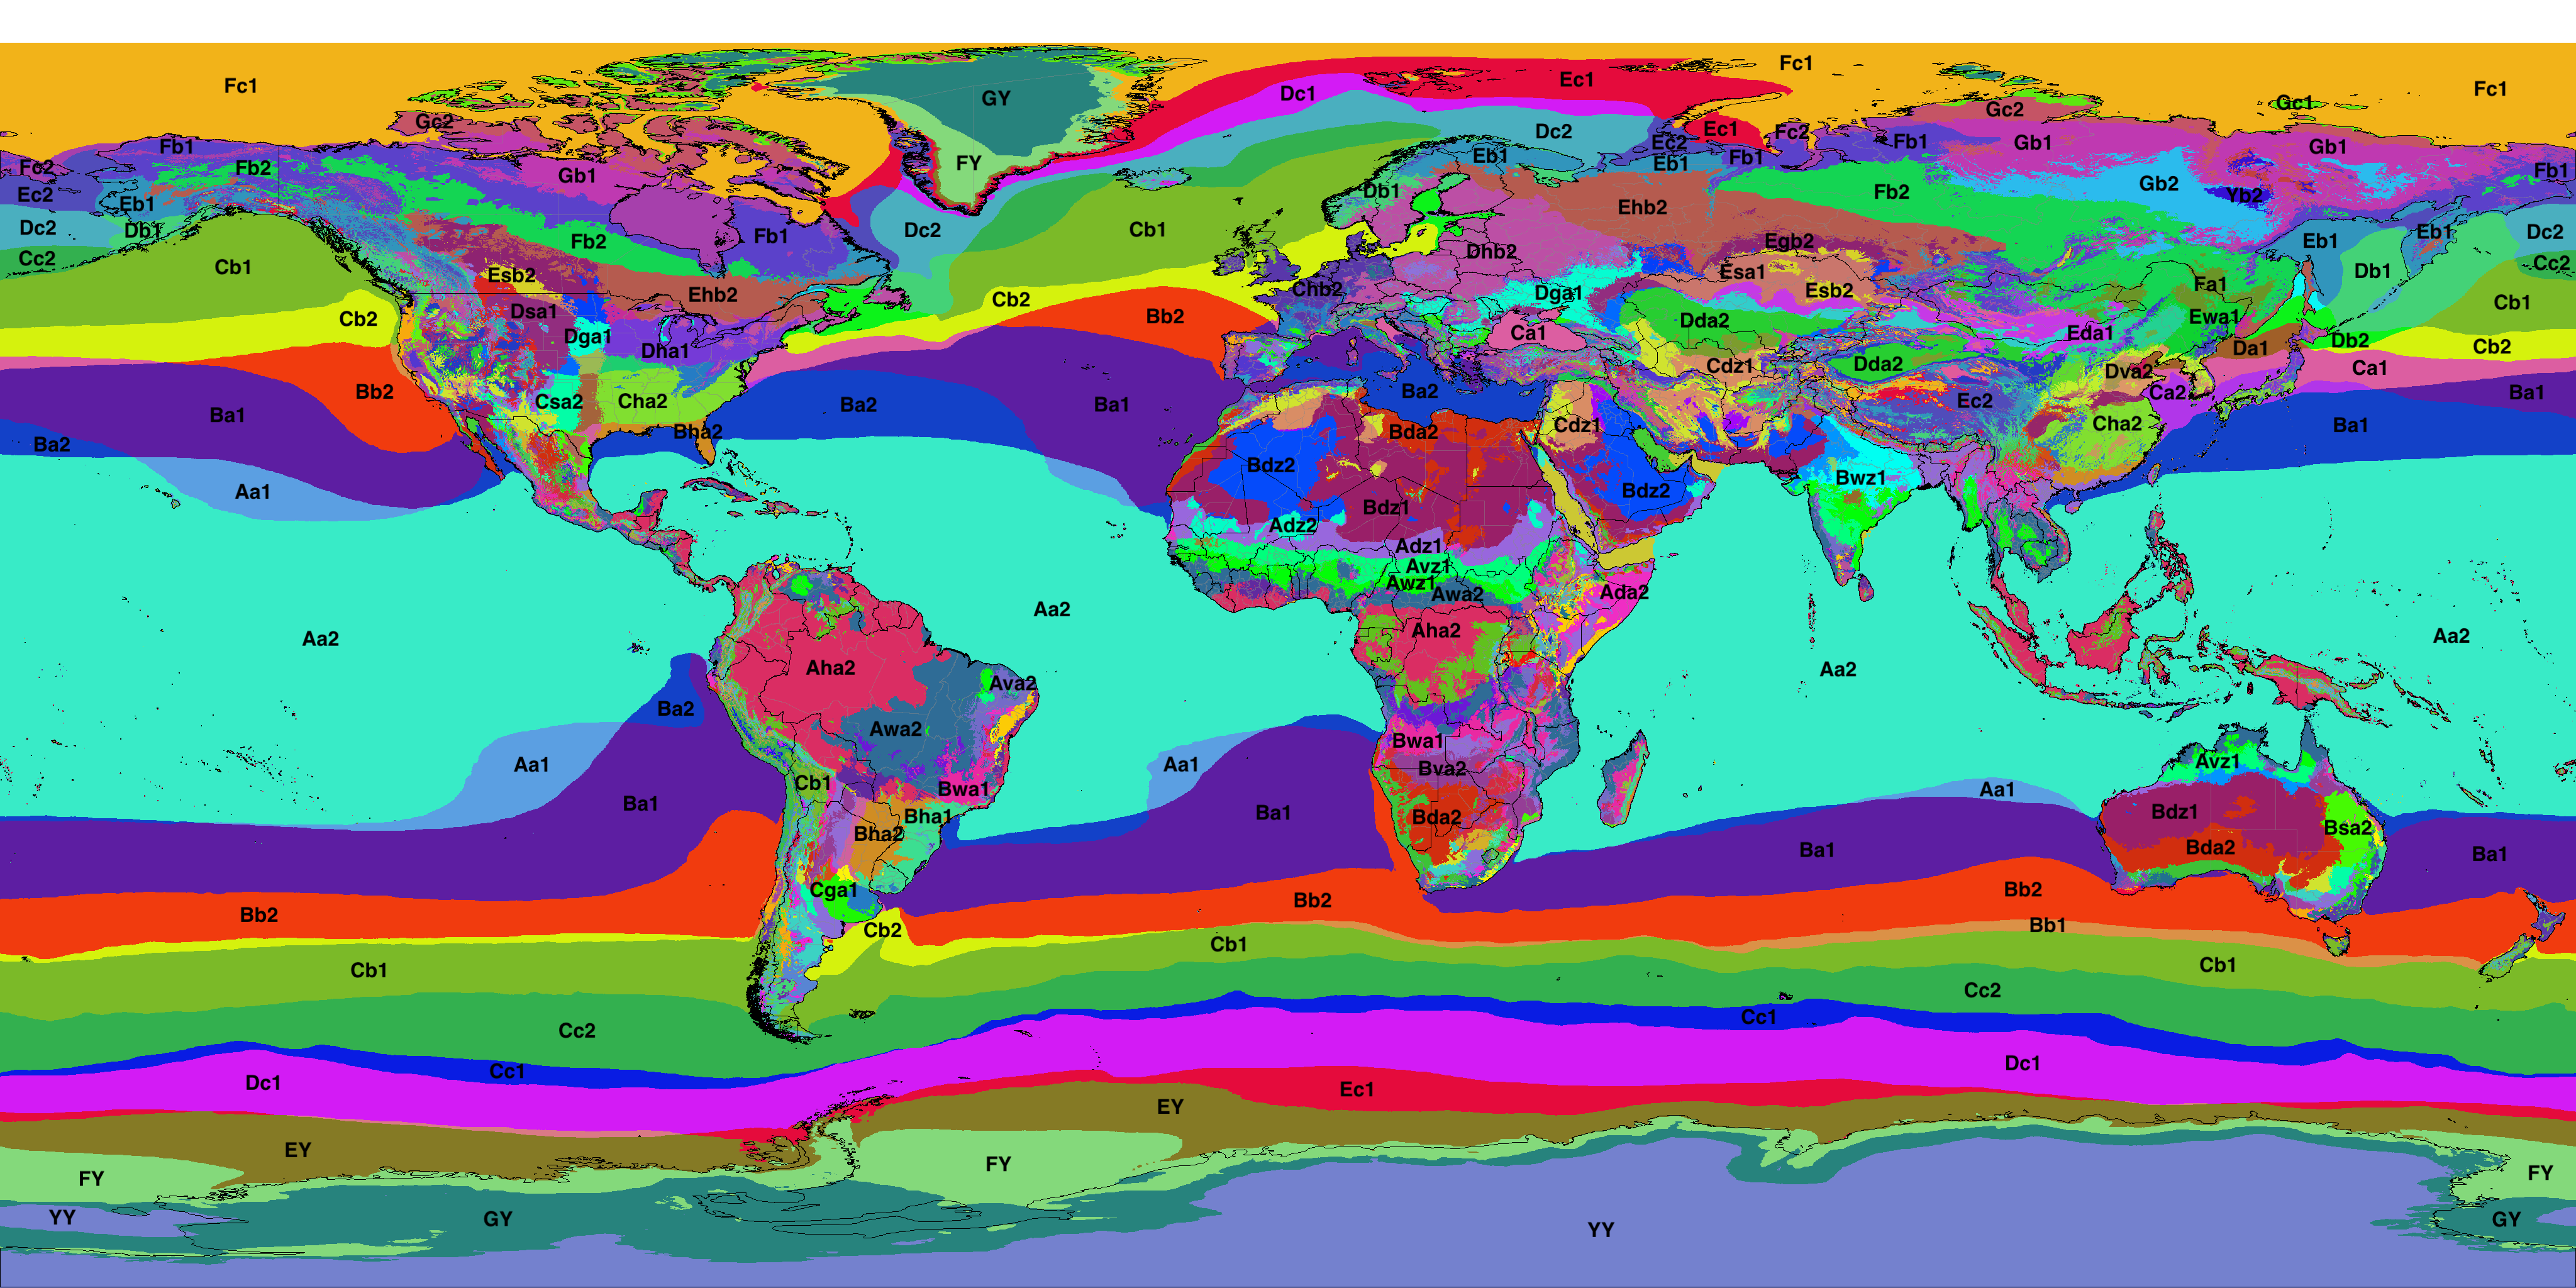
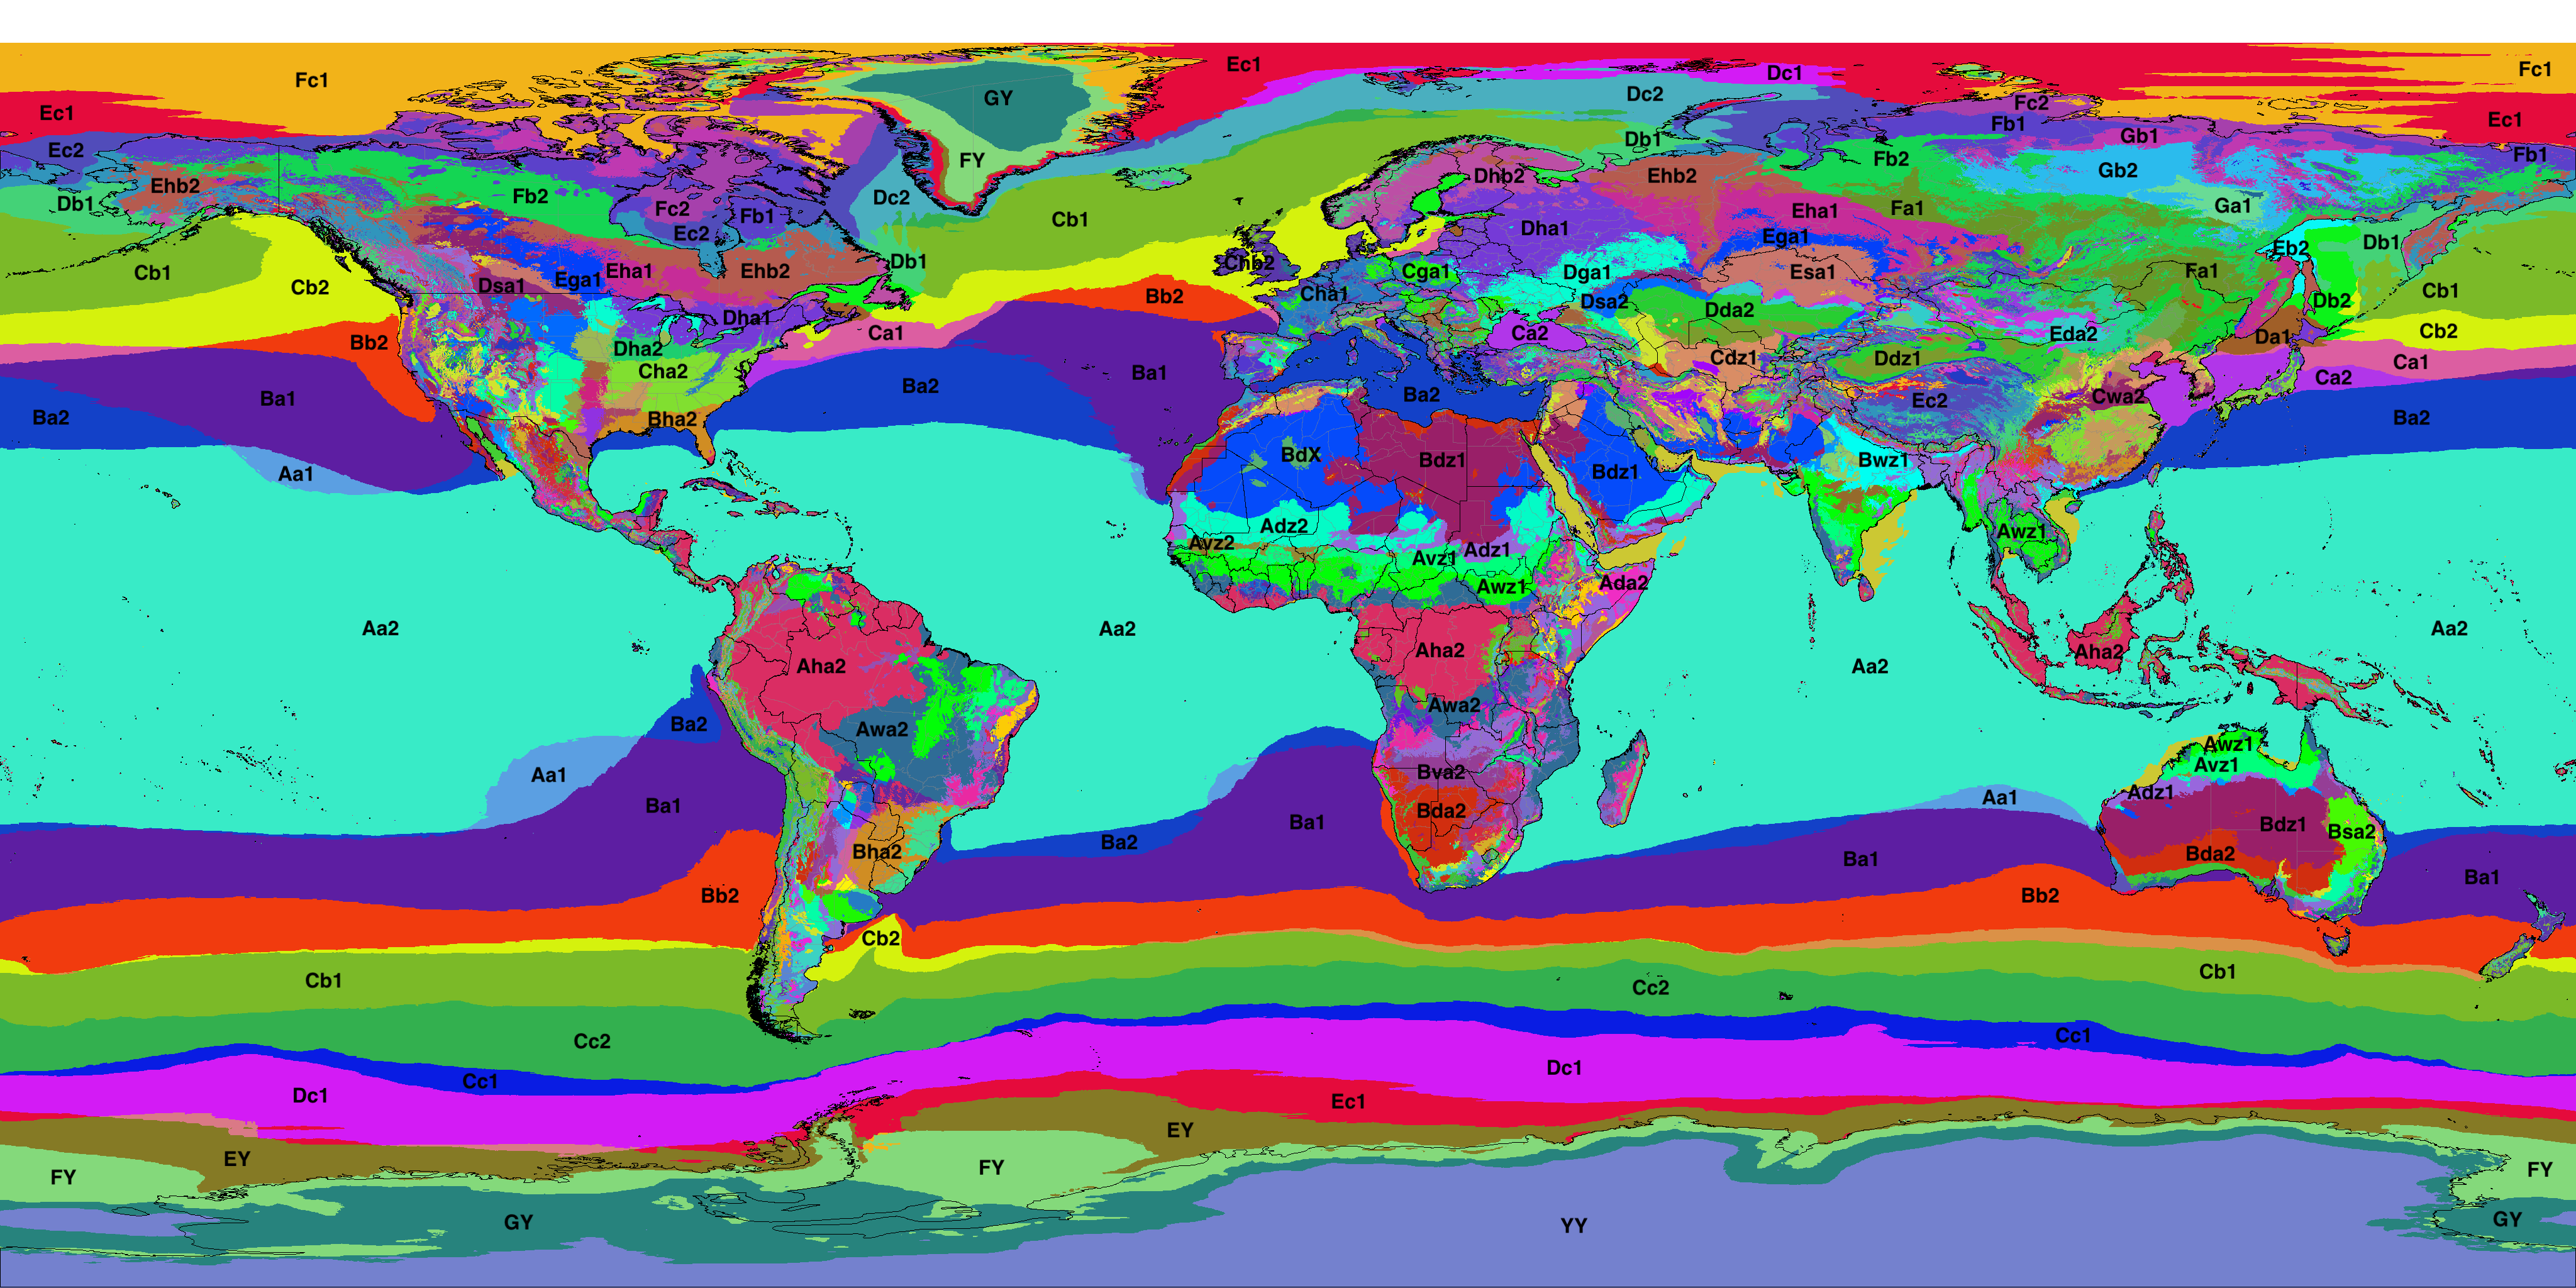
Global distribution of classifications (projections are SSP5-8.5 high emissions normals)
Note: Due to the complexity of the system, only the most common climates in each map are labeled.
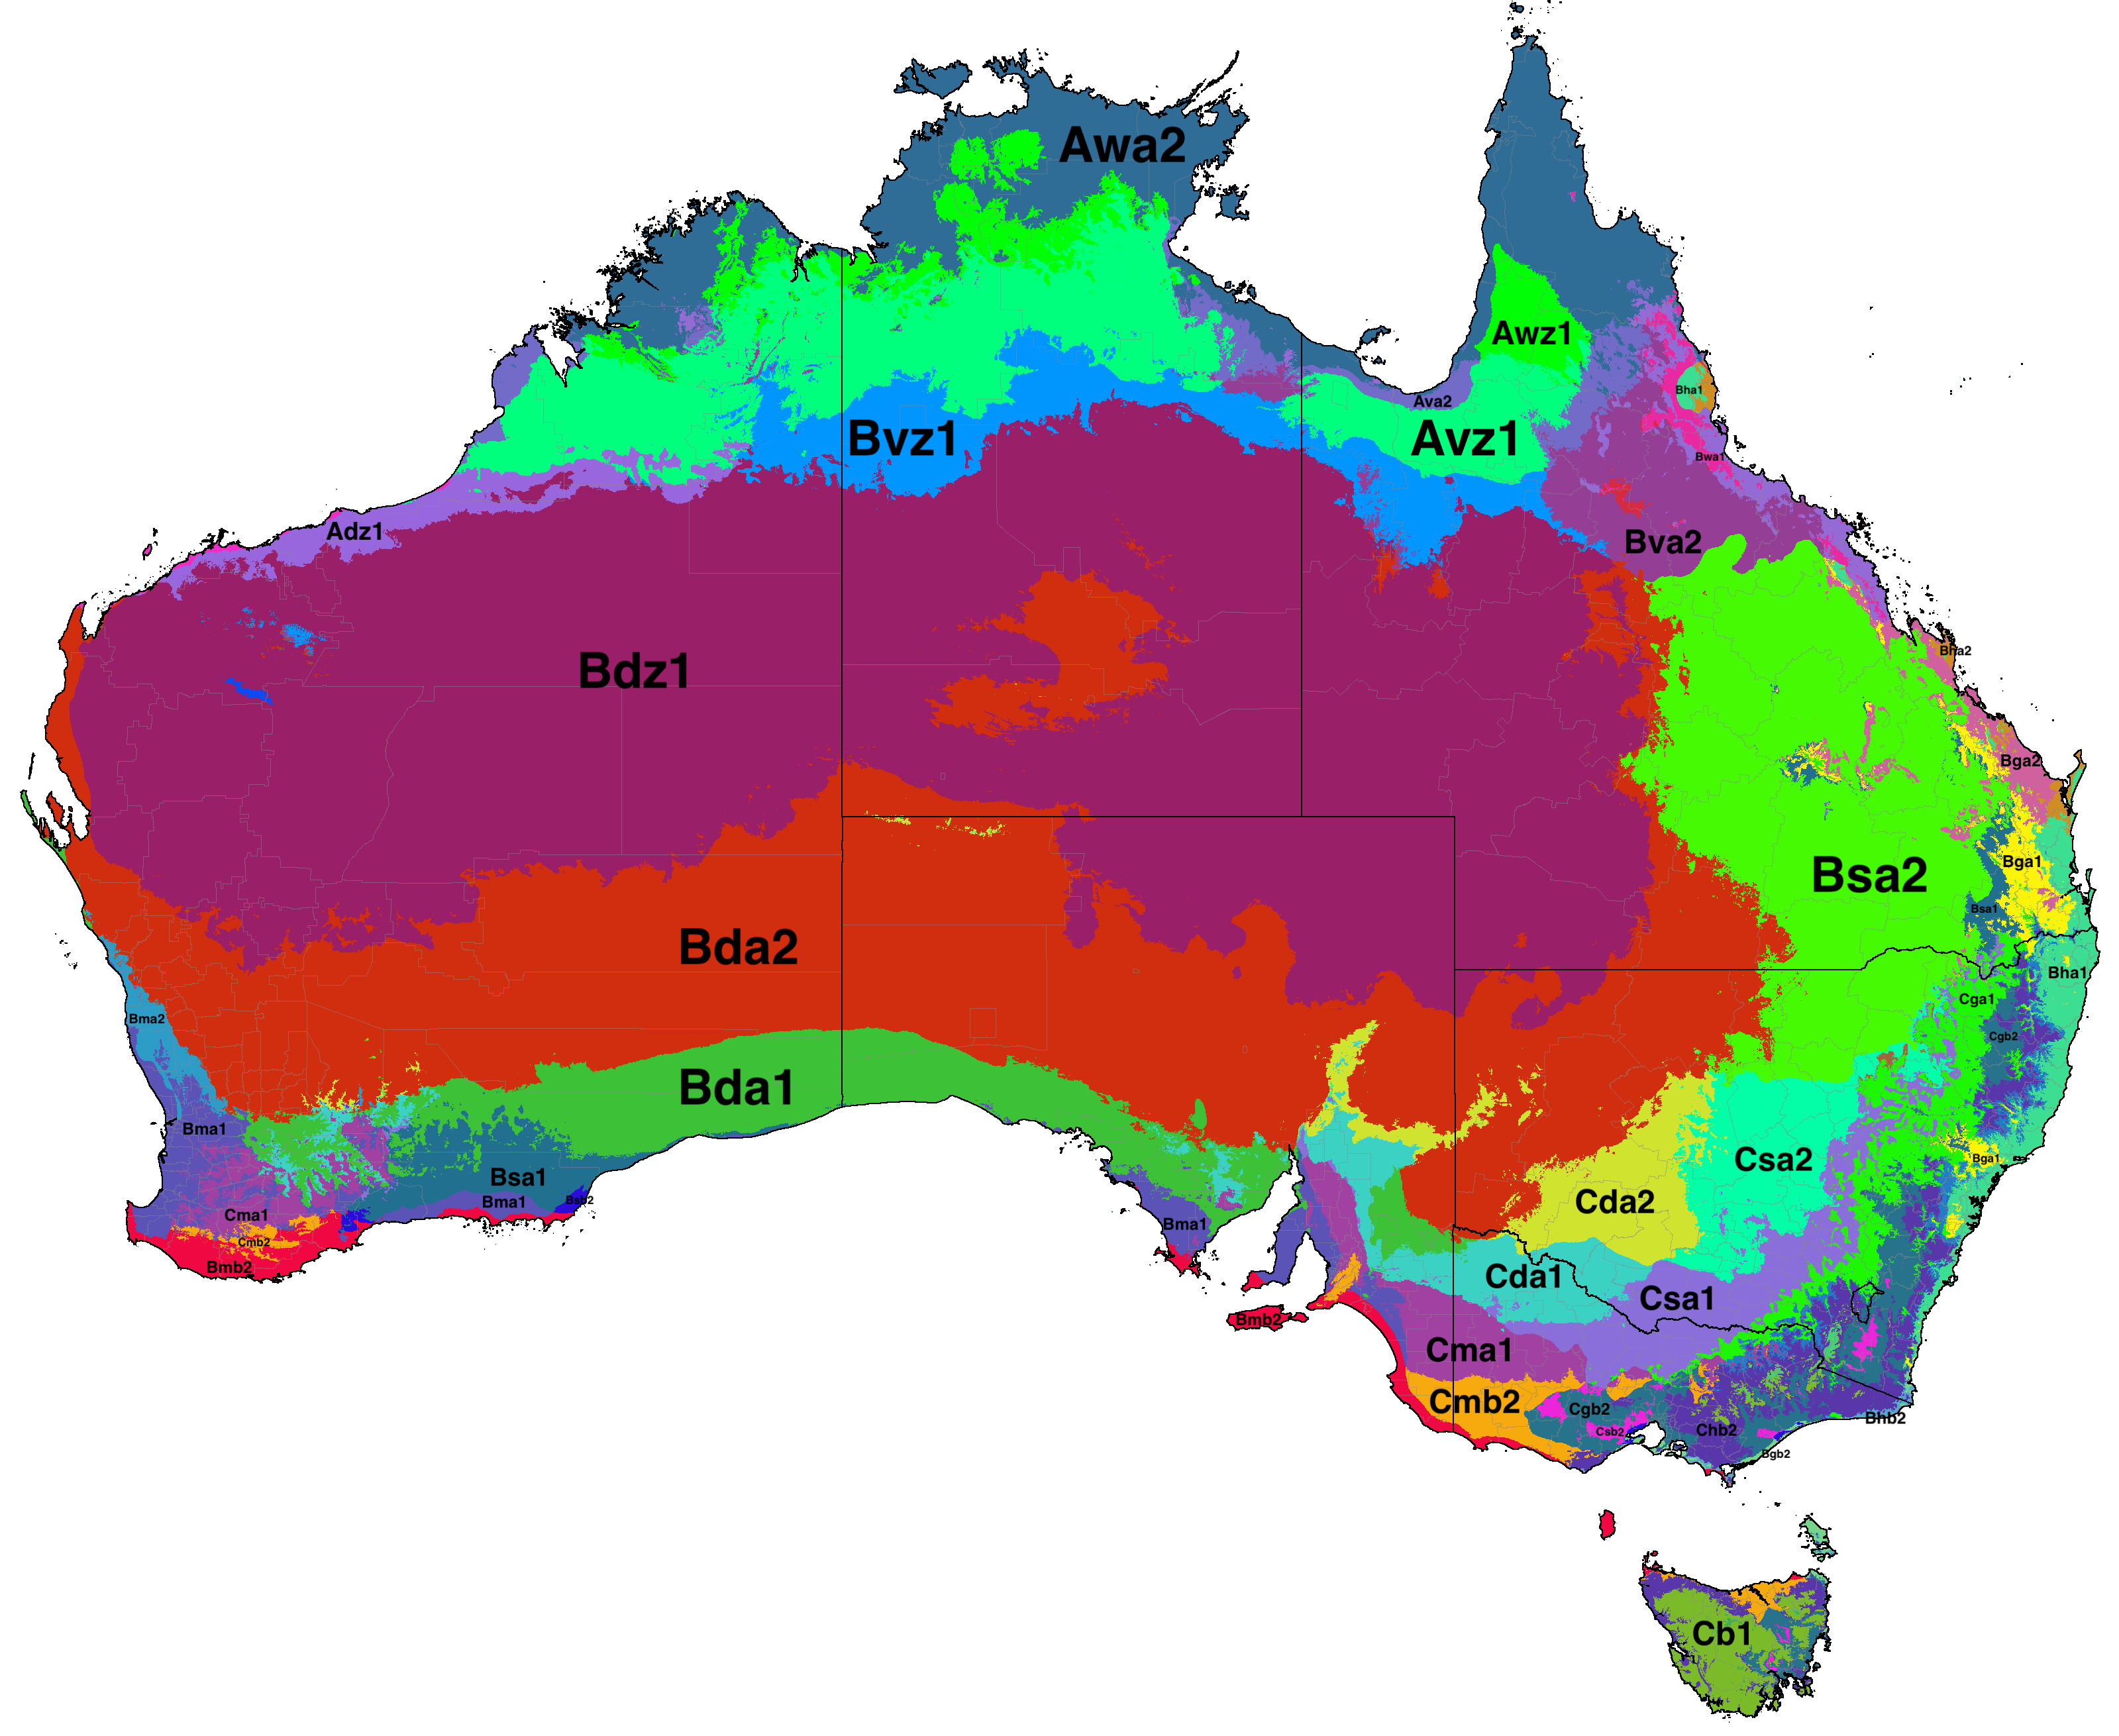
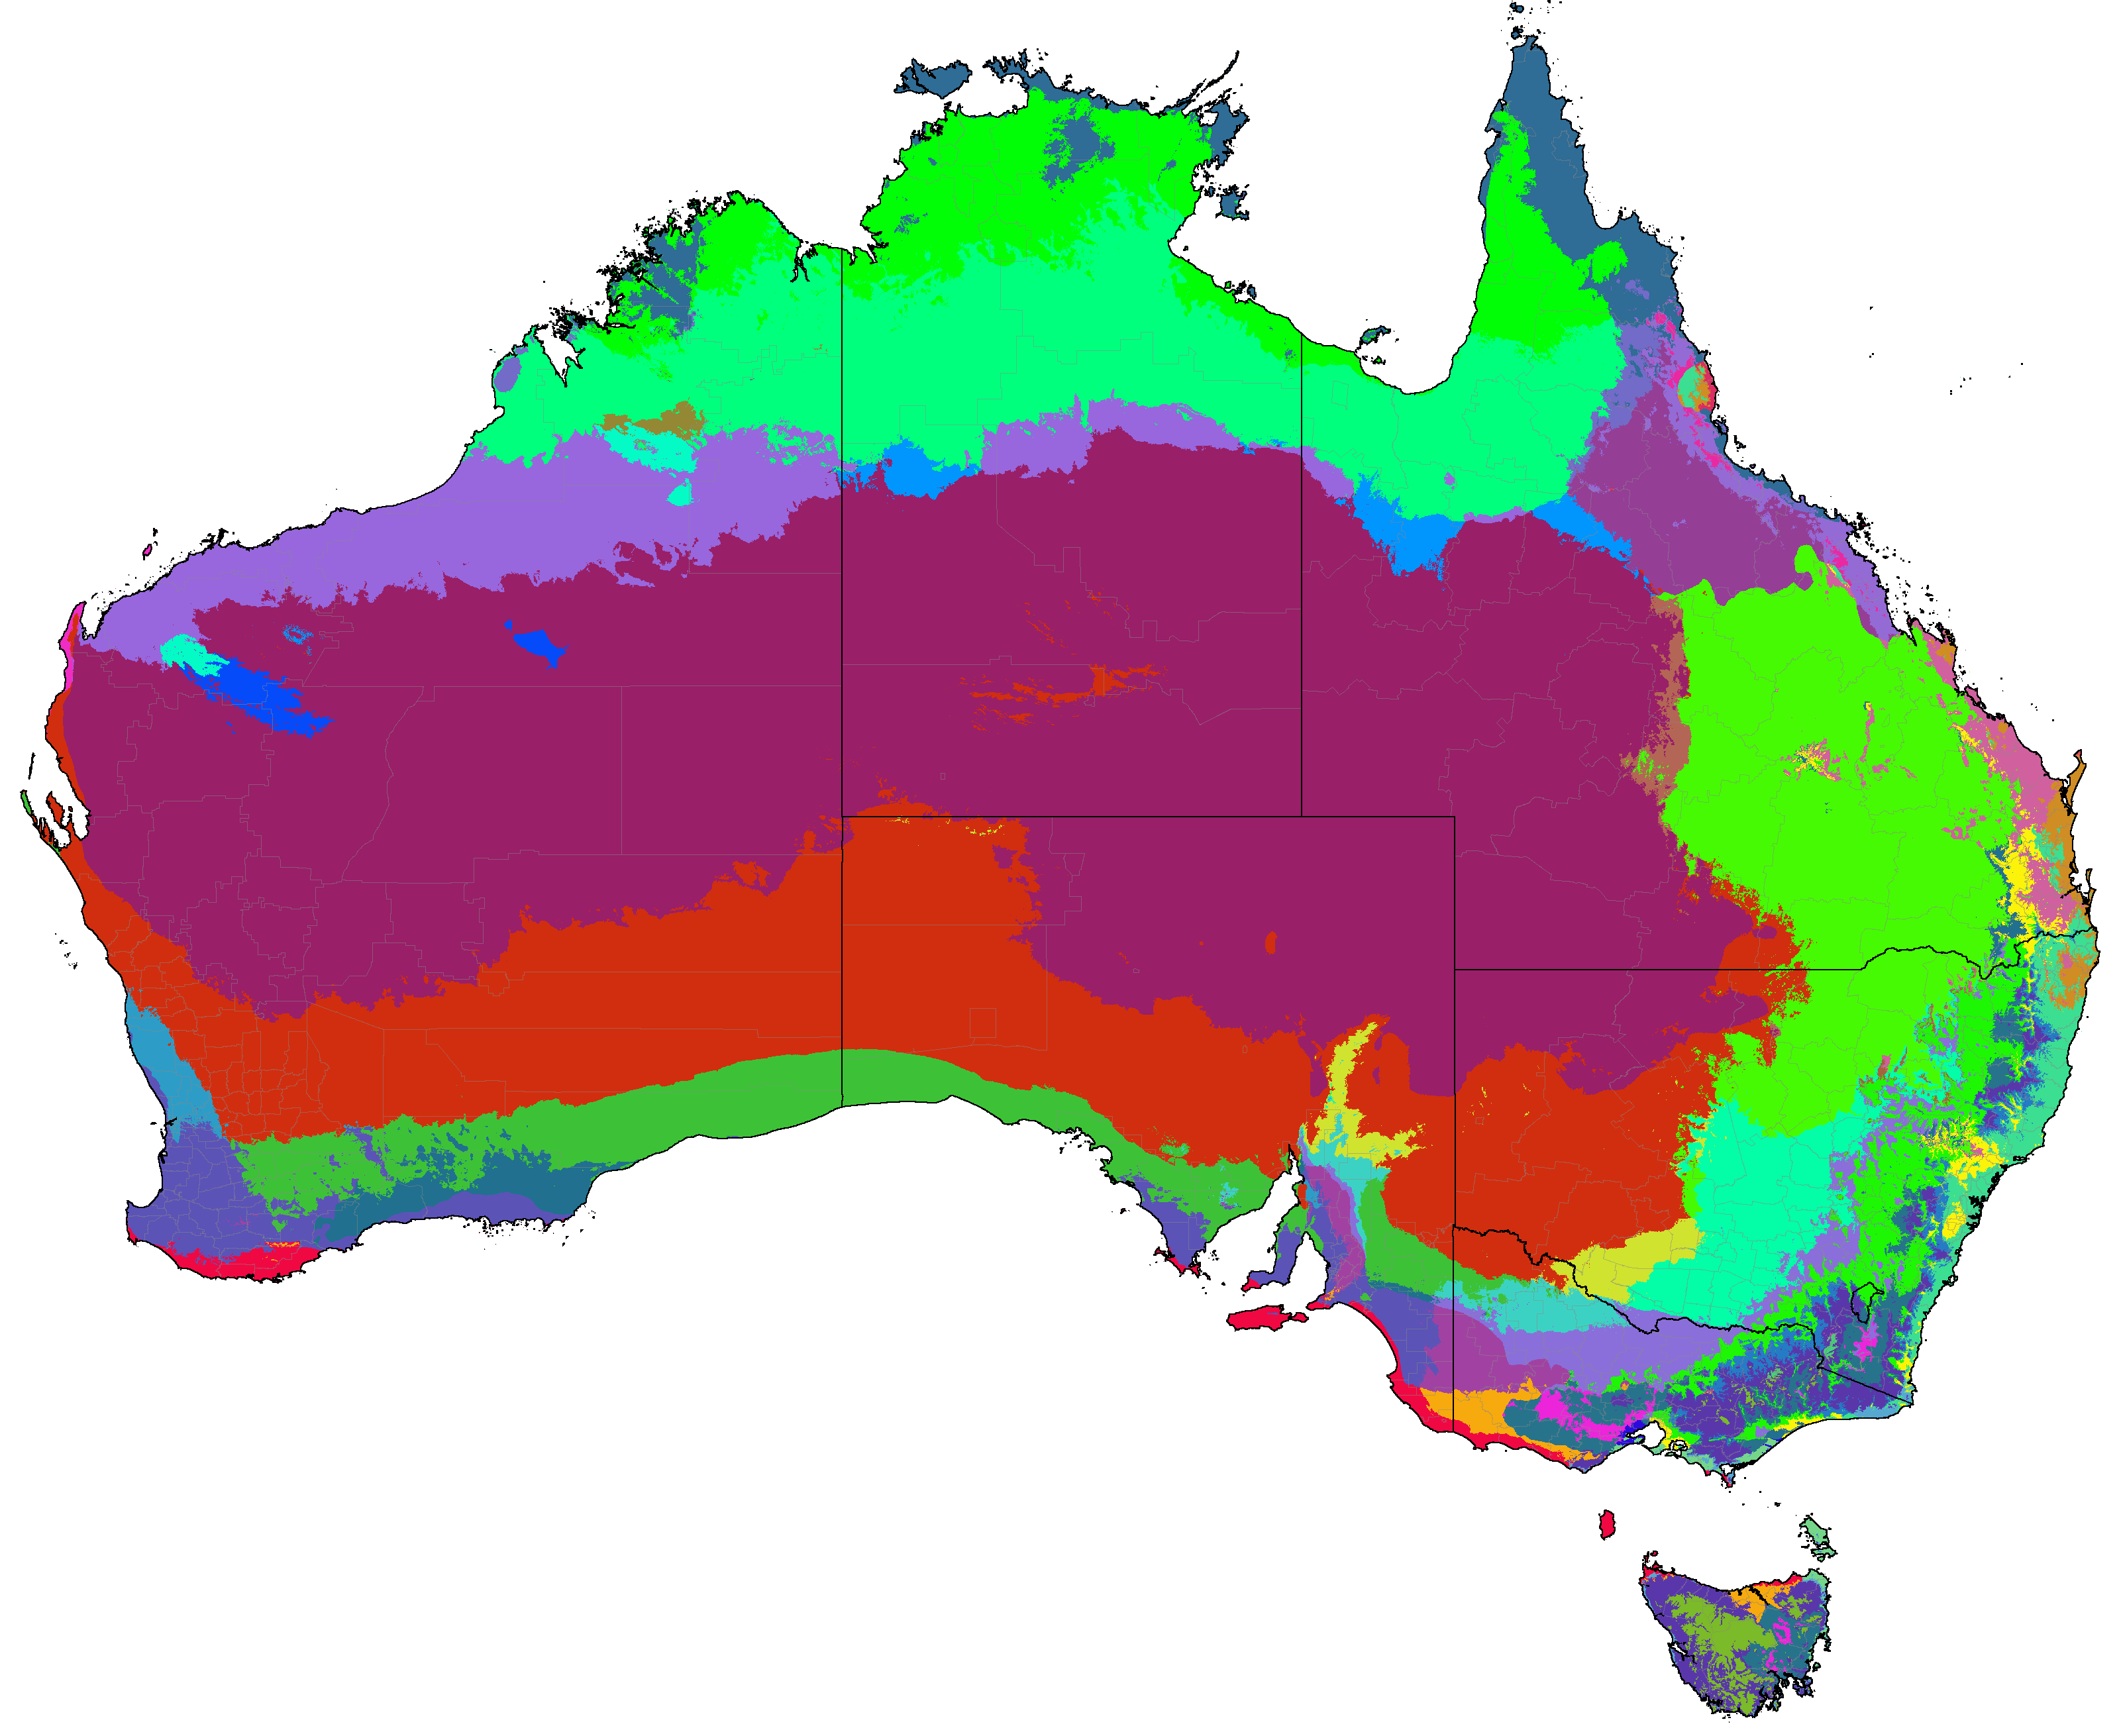
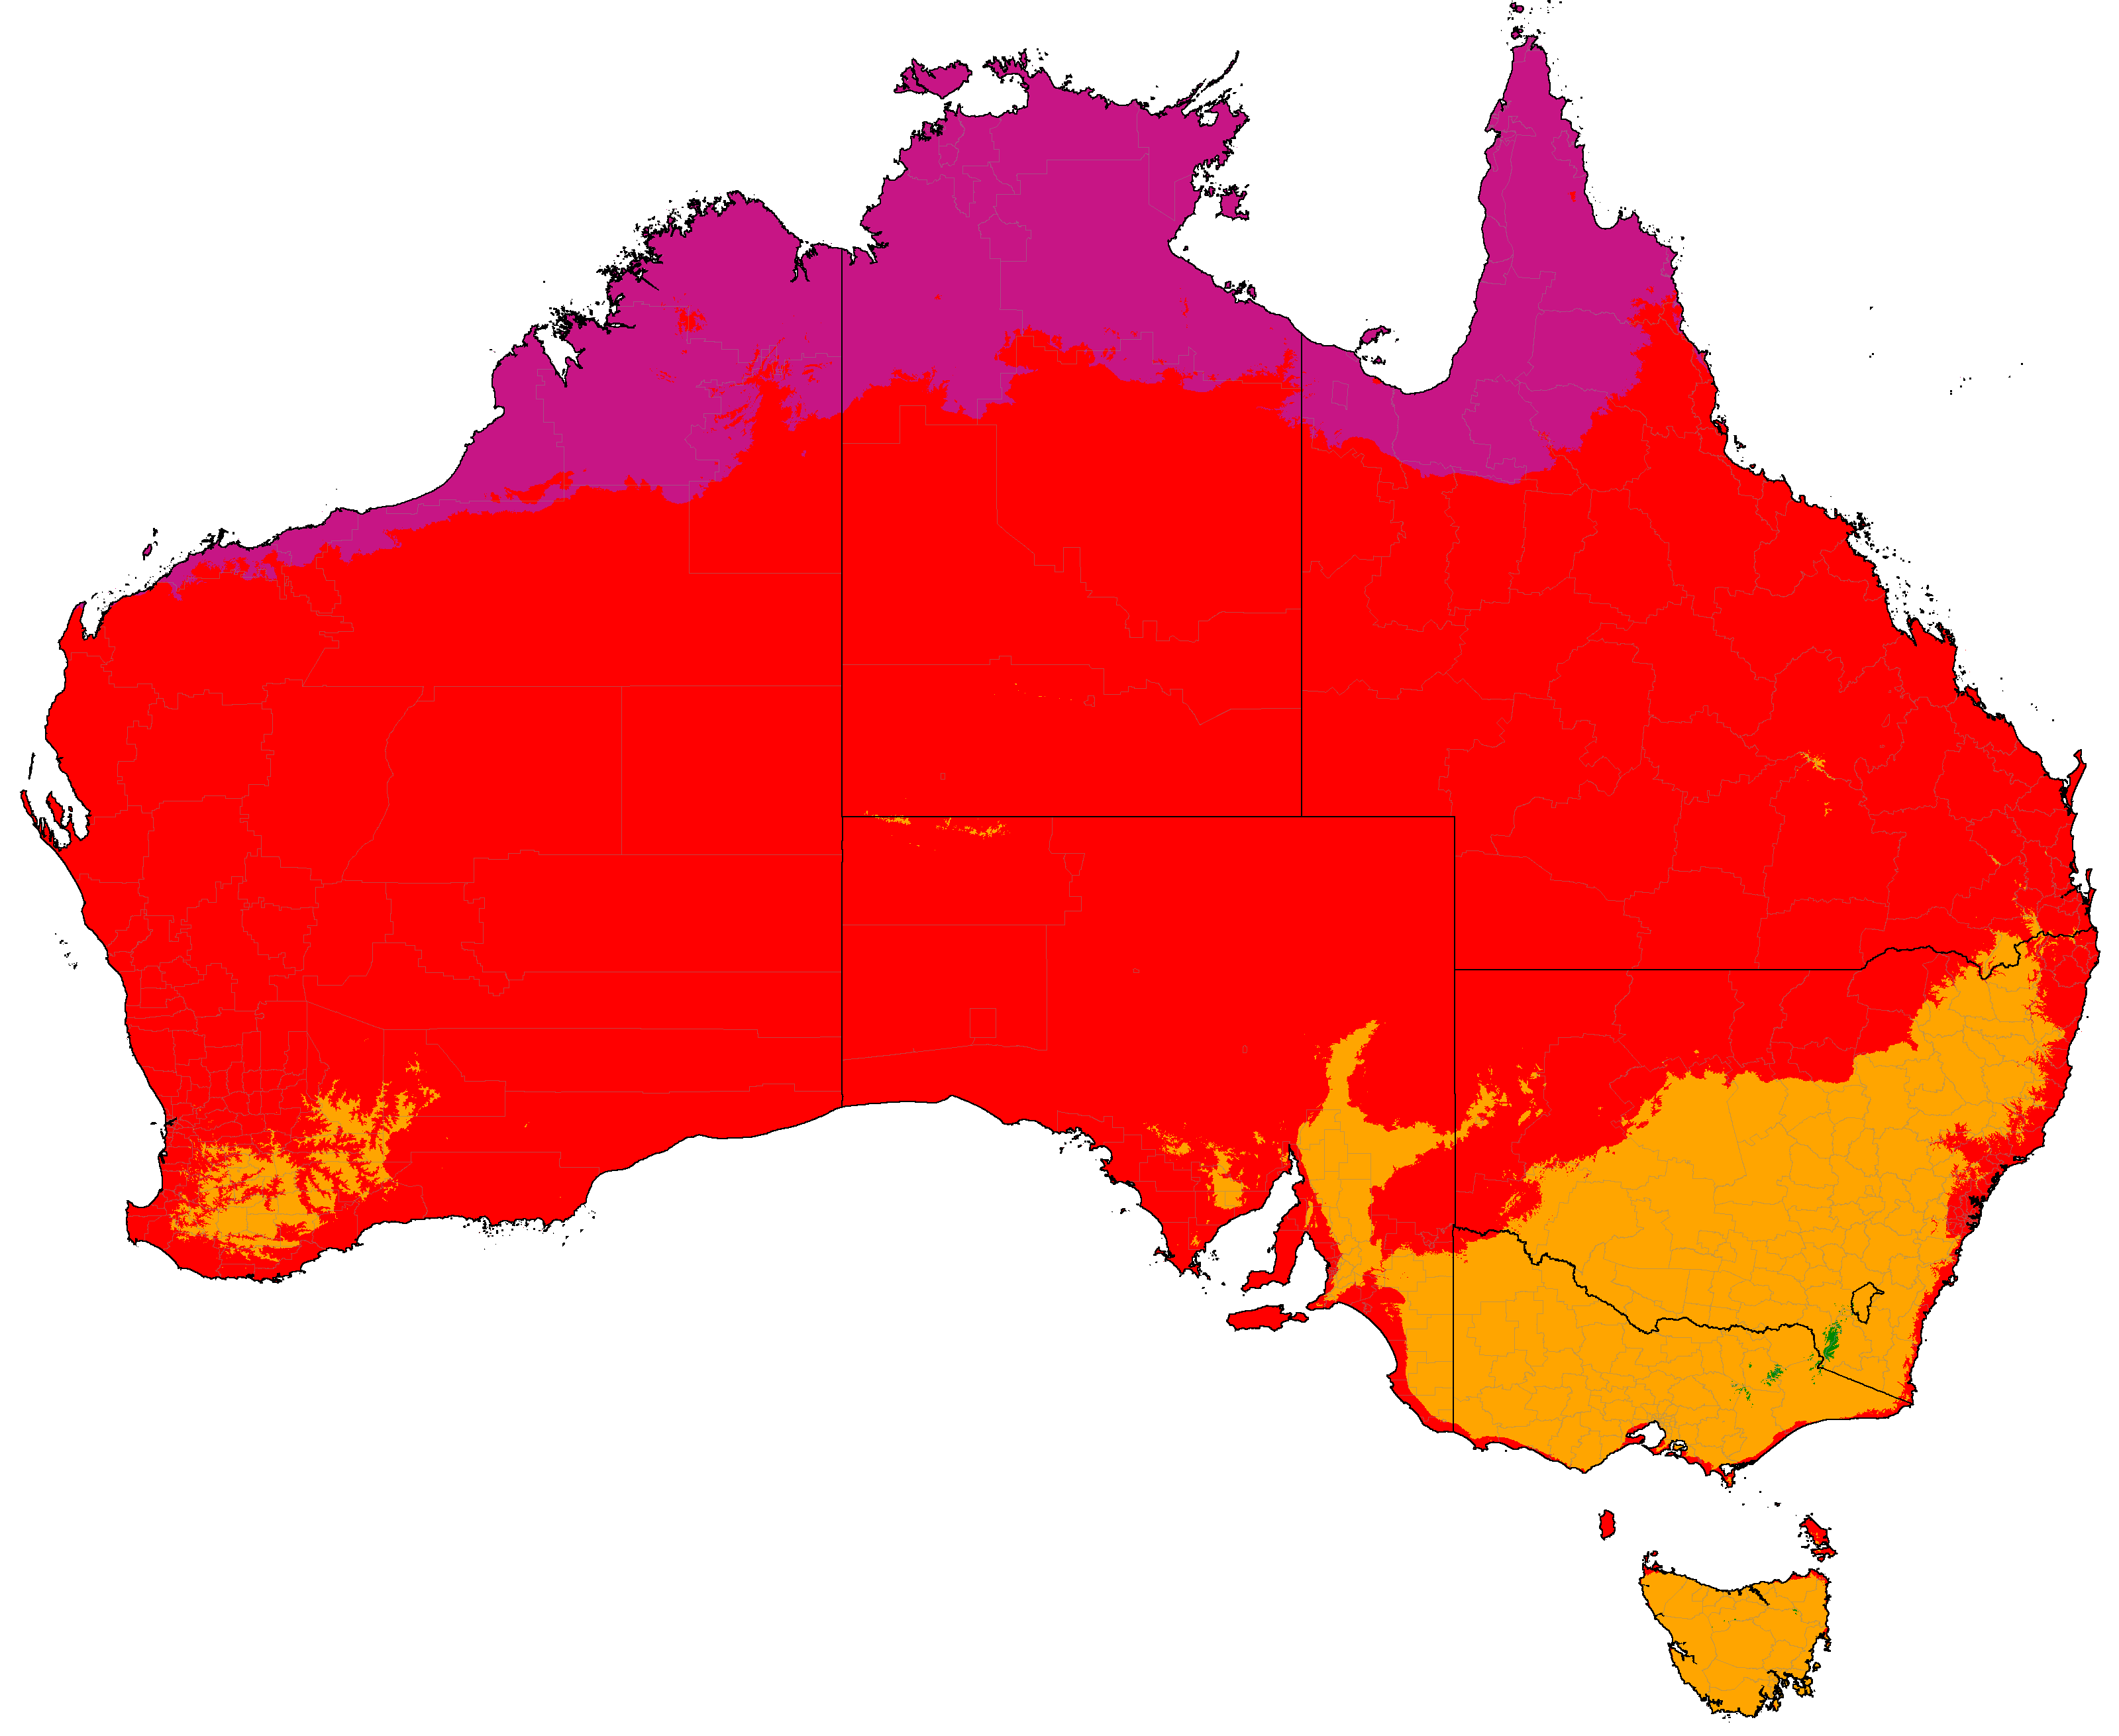
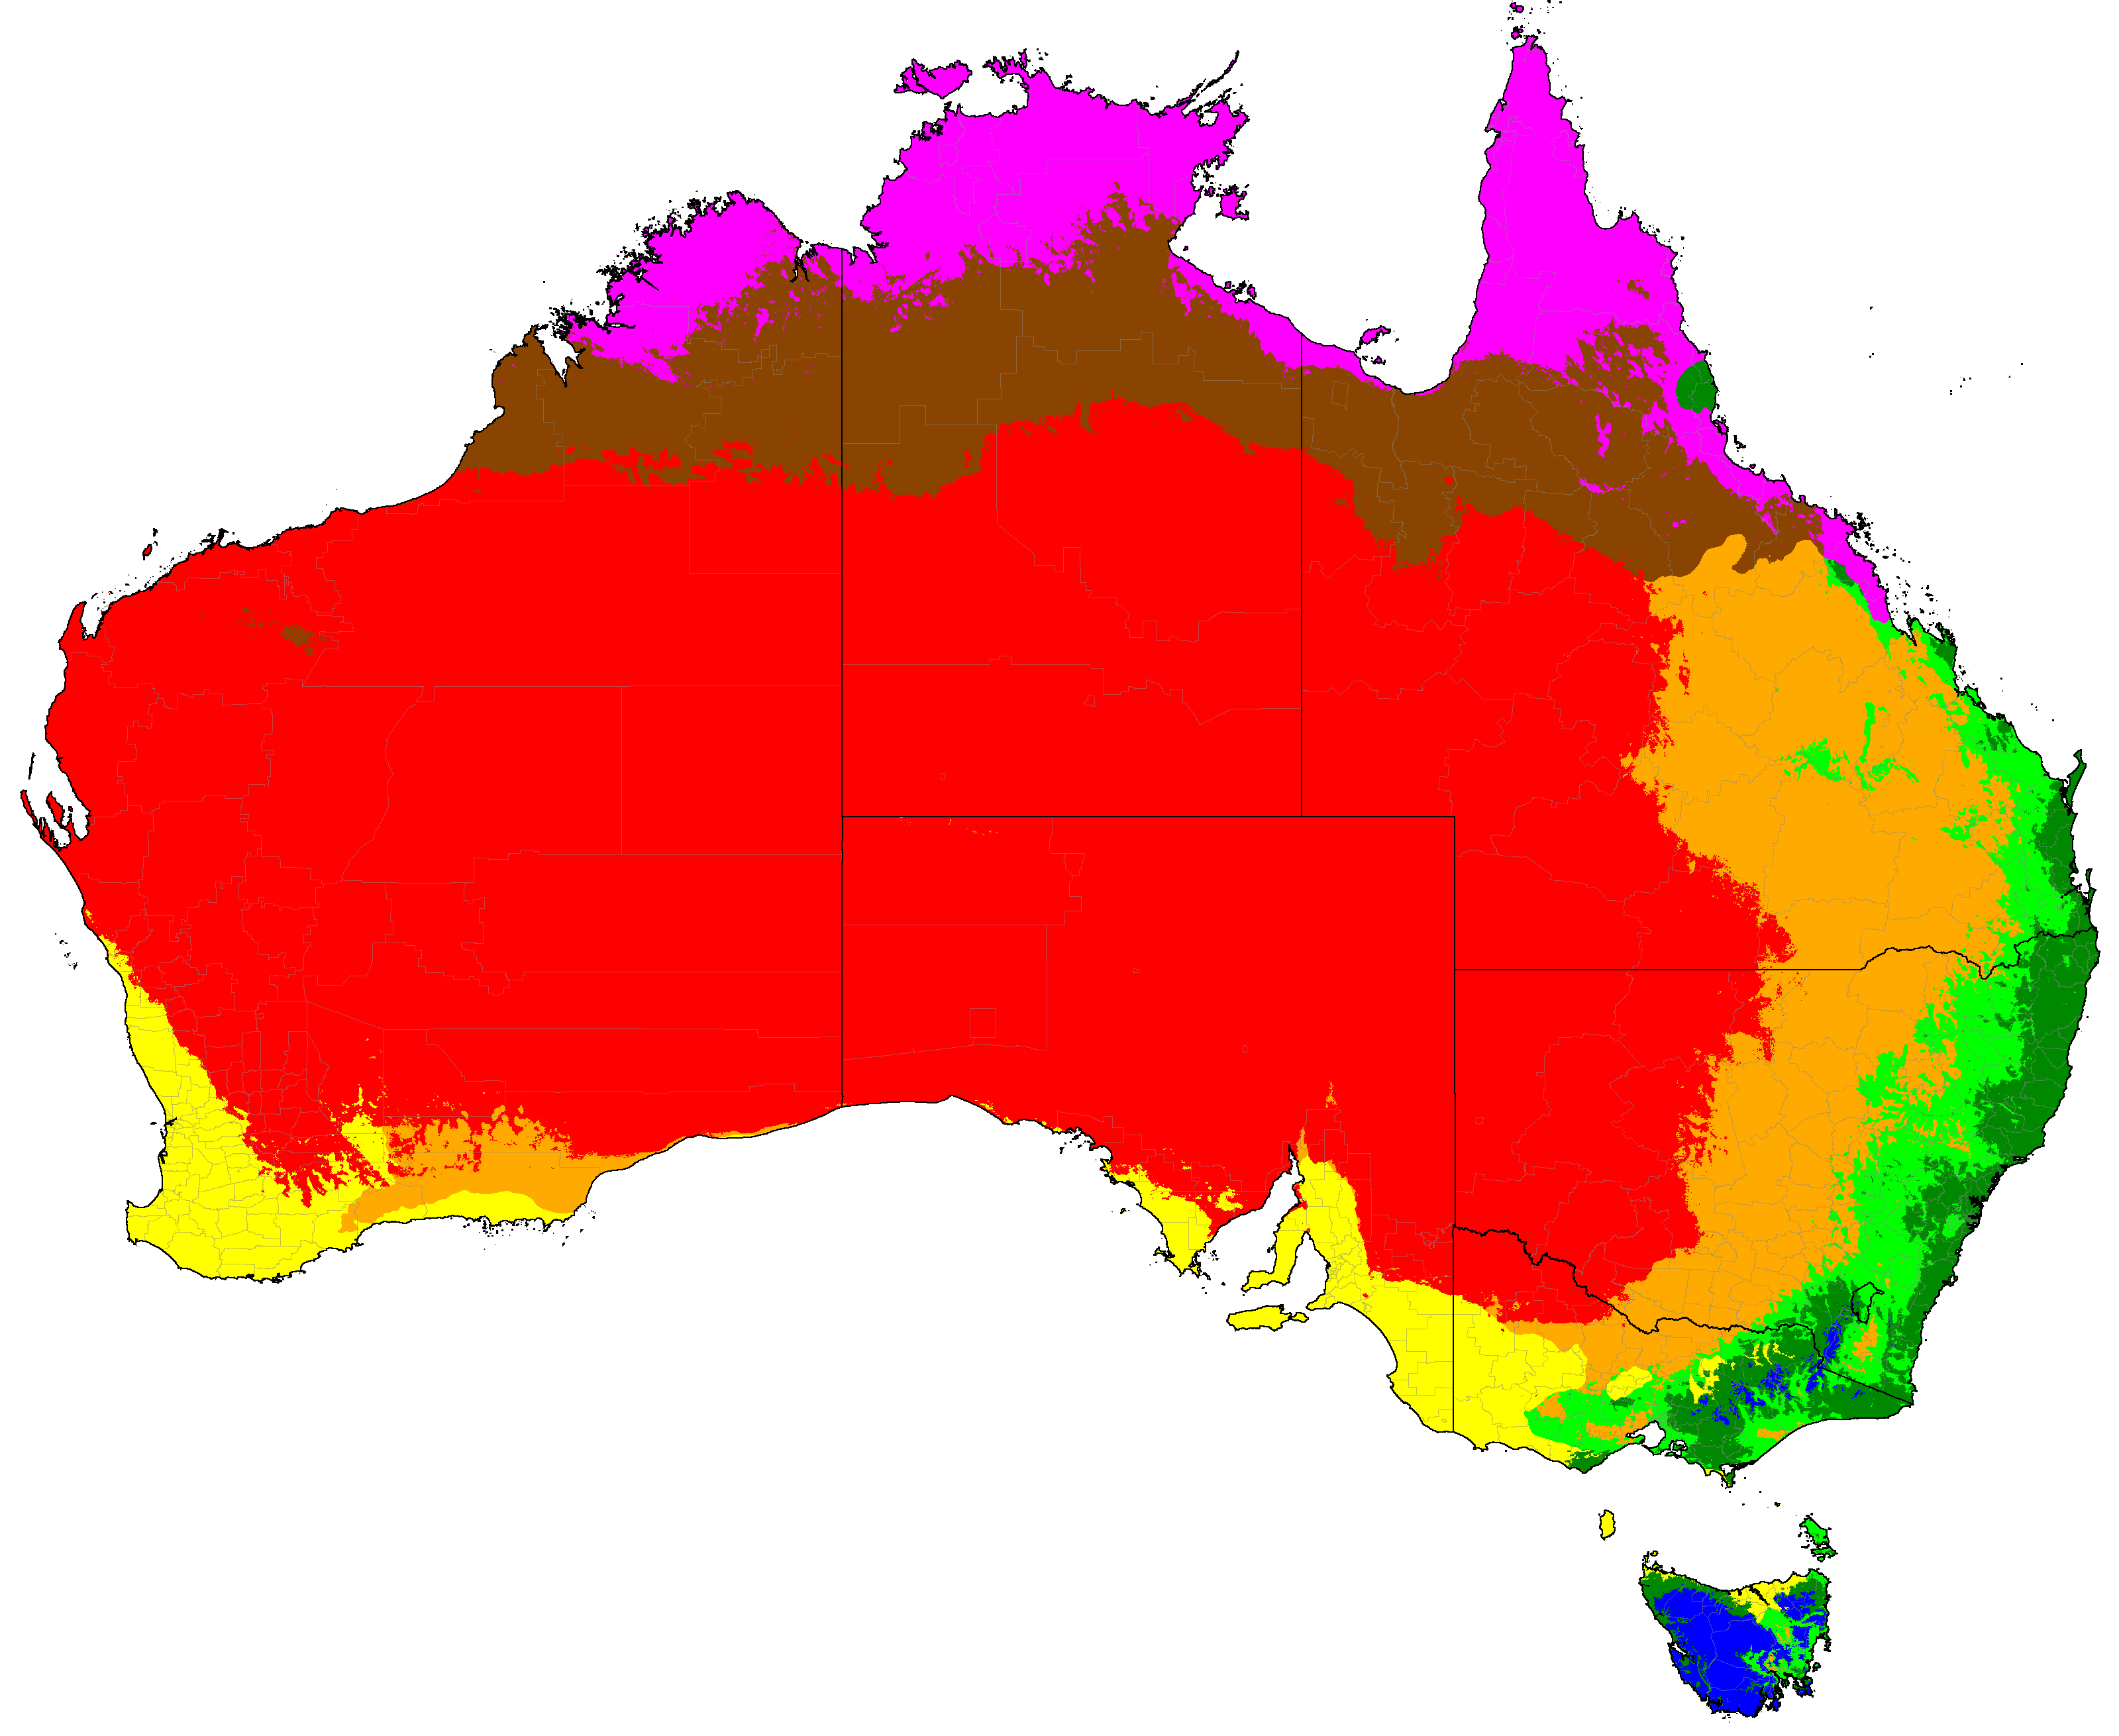
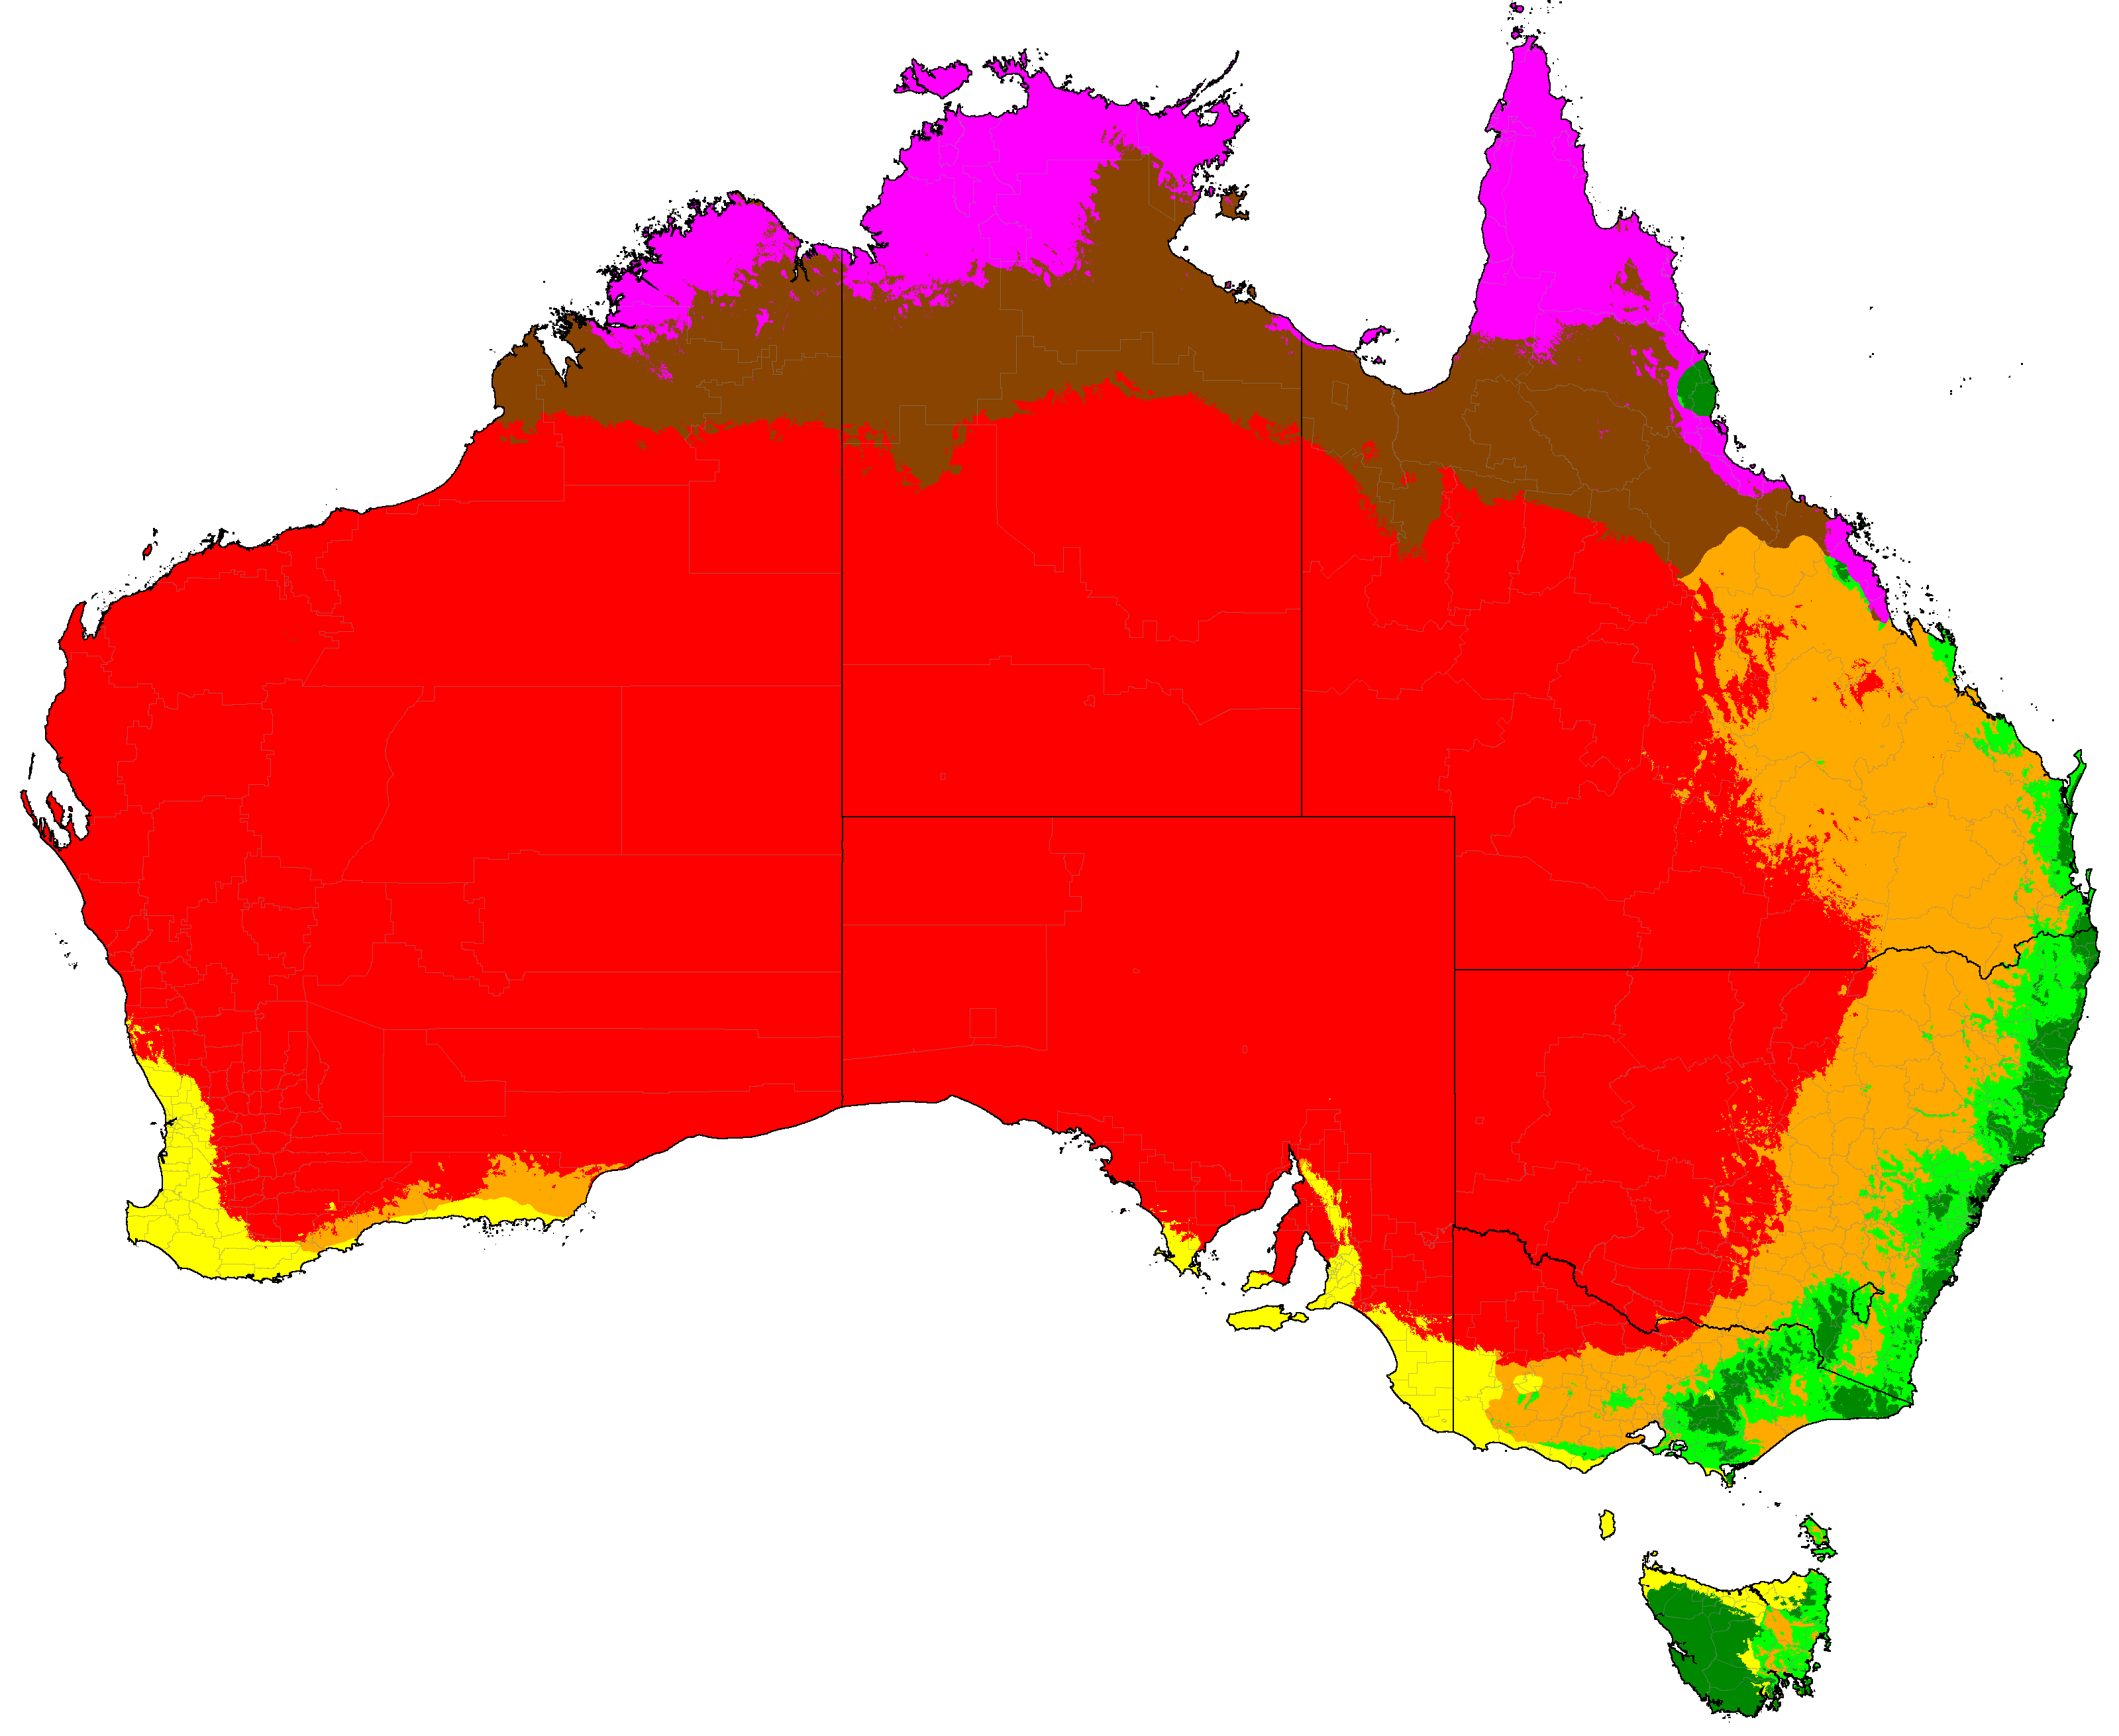
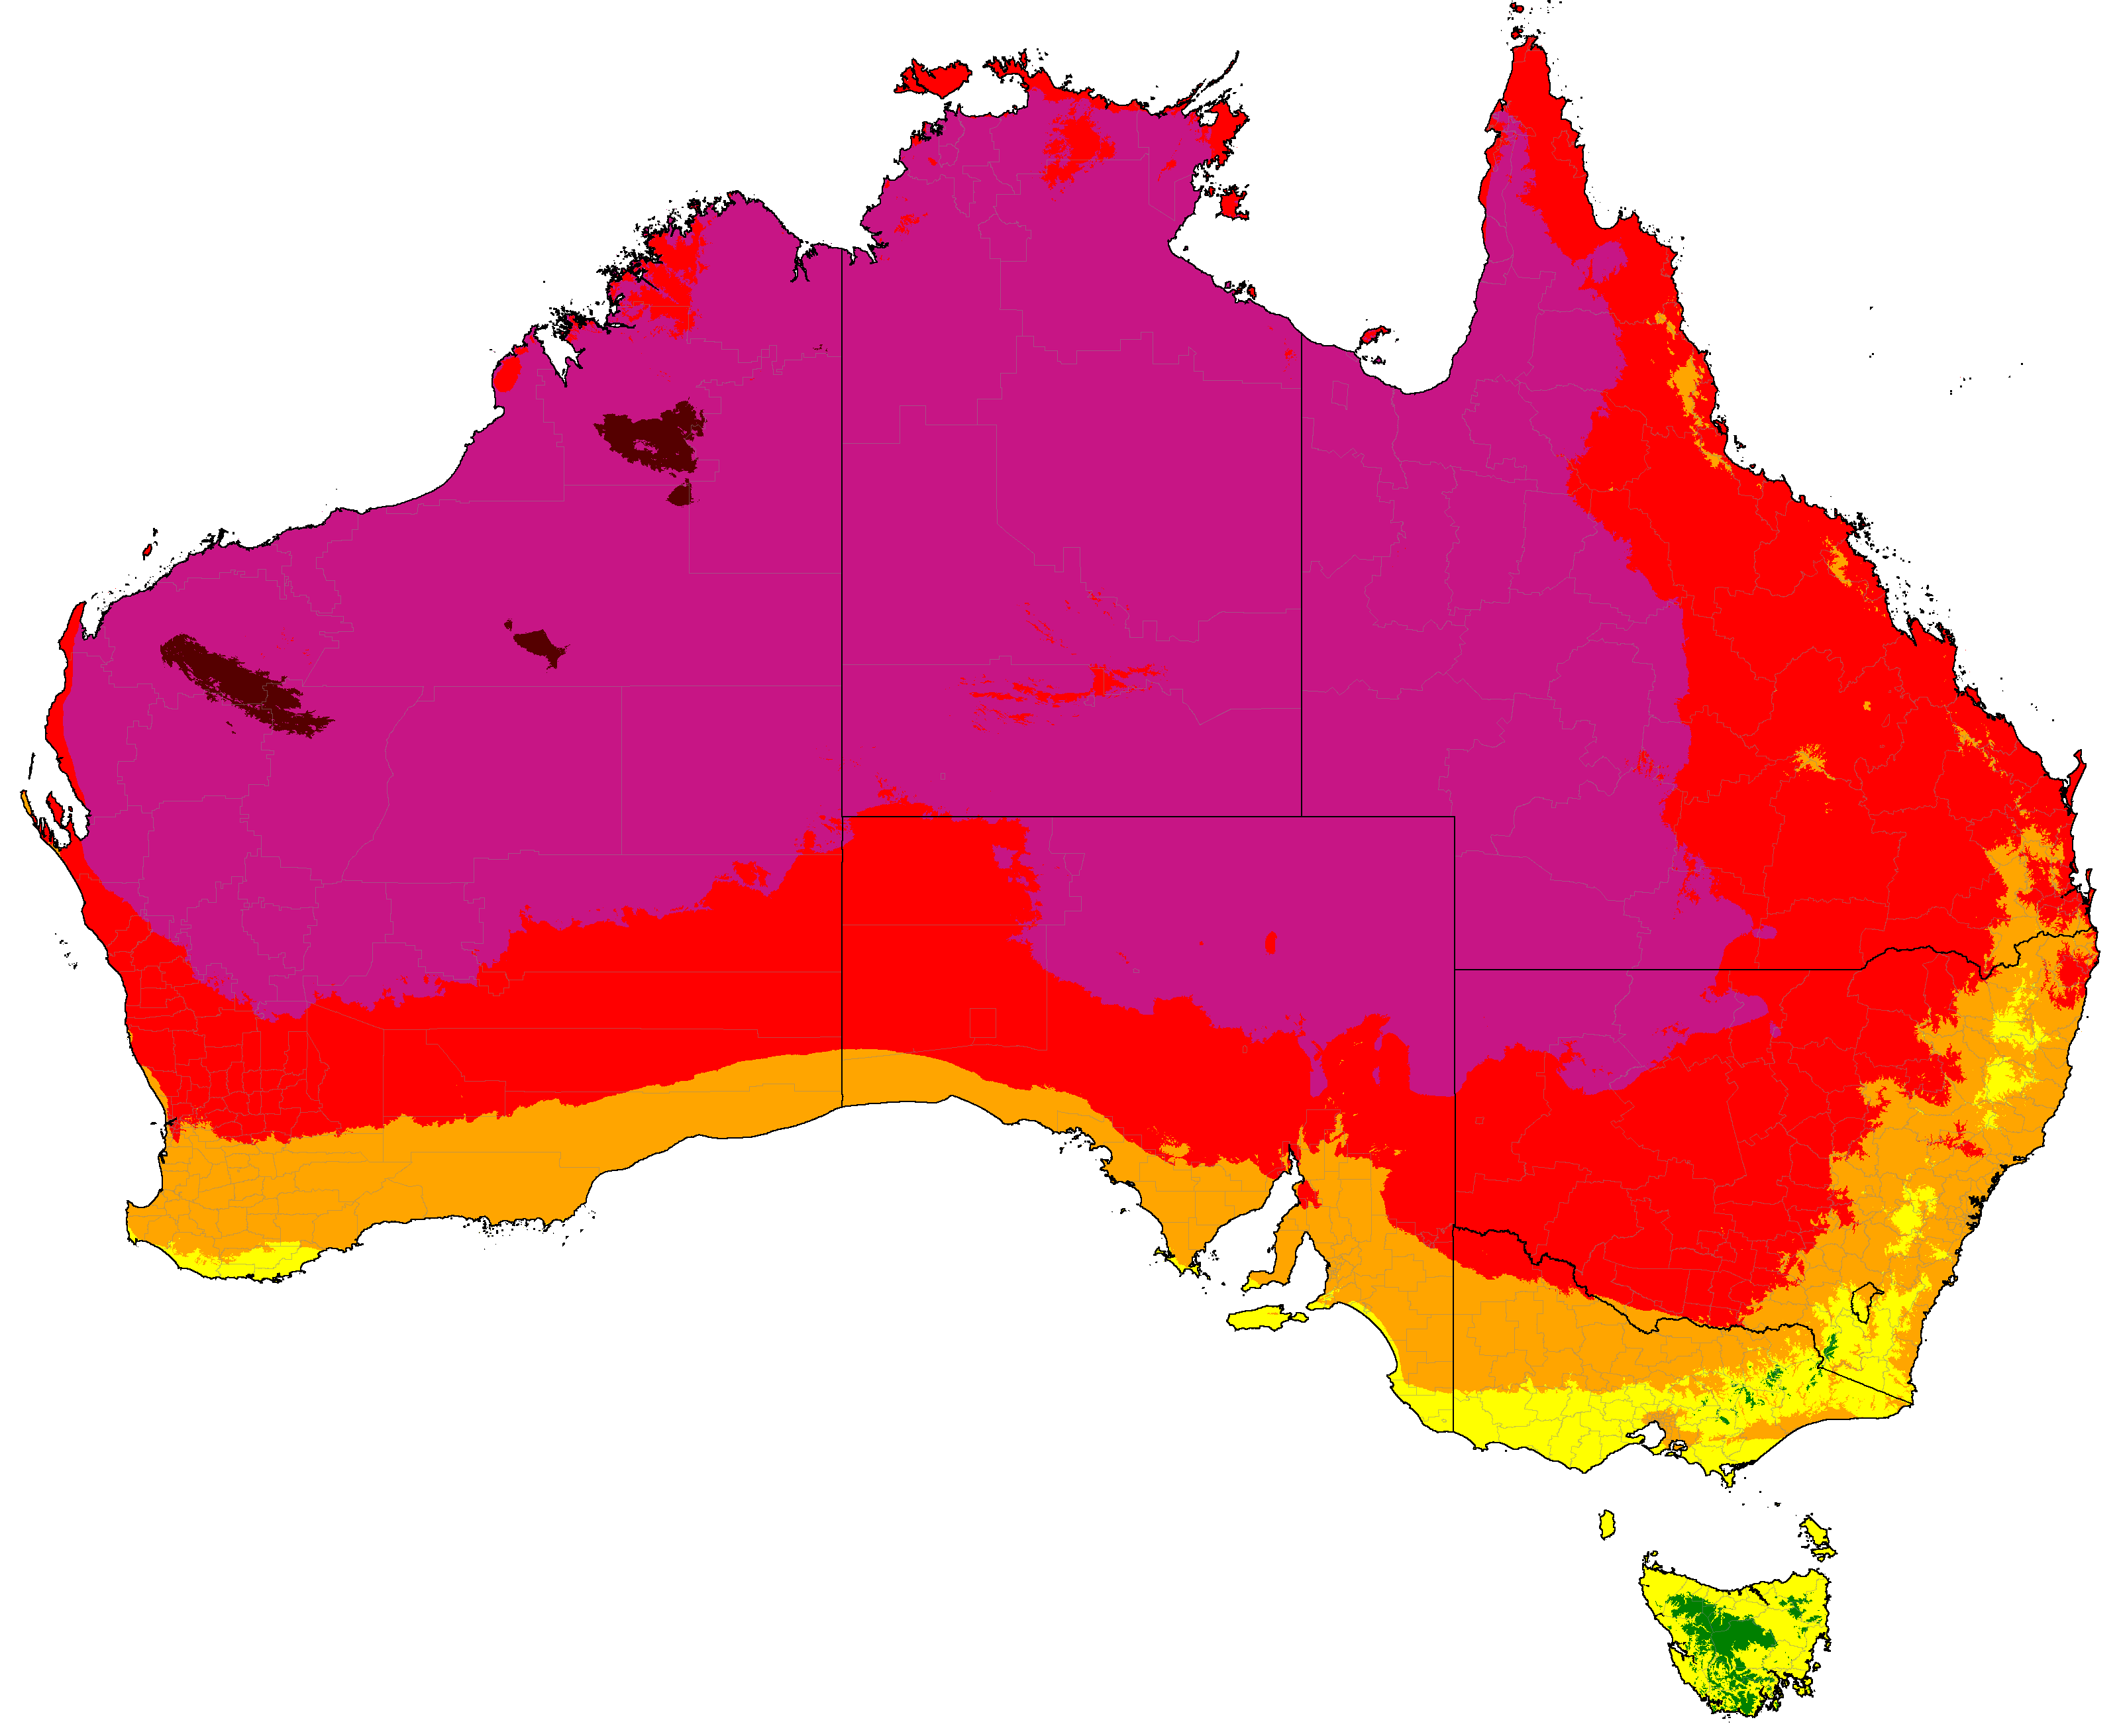
Australia distribution of classifications (projections are SSP5-8.5 high emissions normals)
Note: Due to the complexity of the system, only the most common climates in each map are labeled.
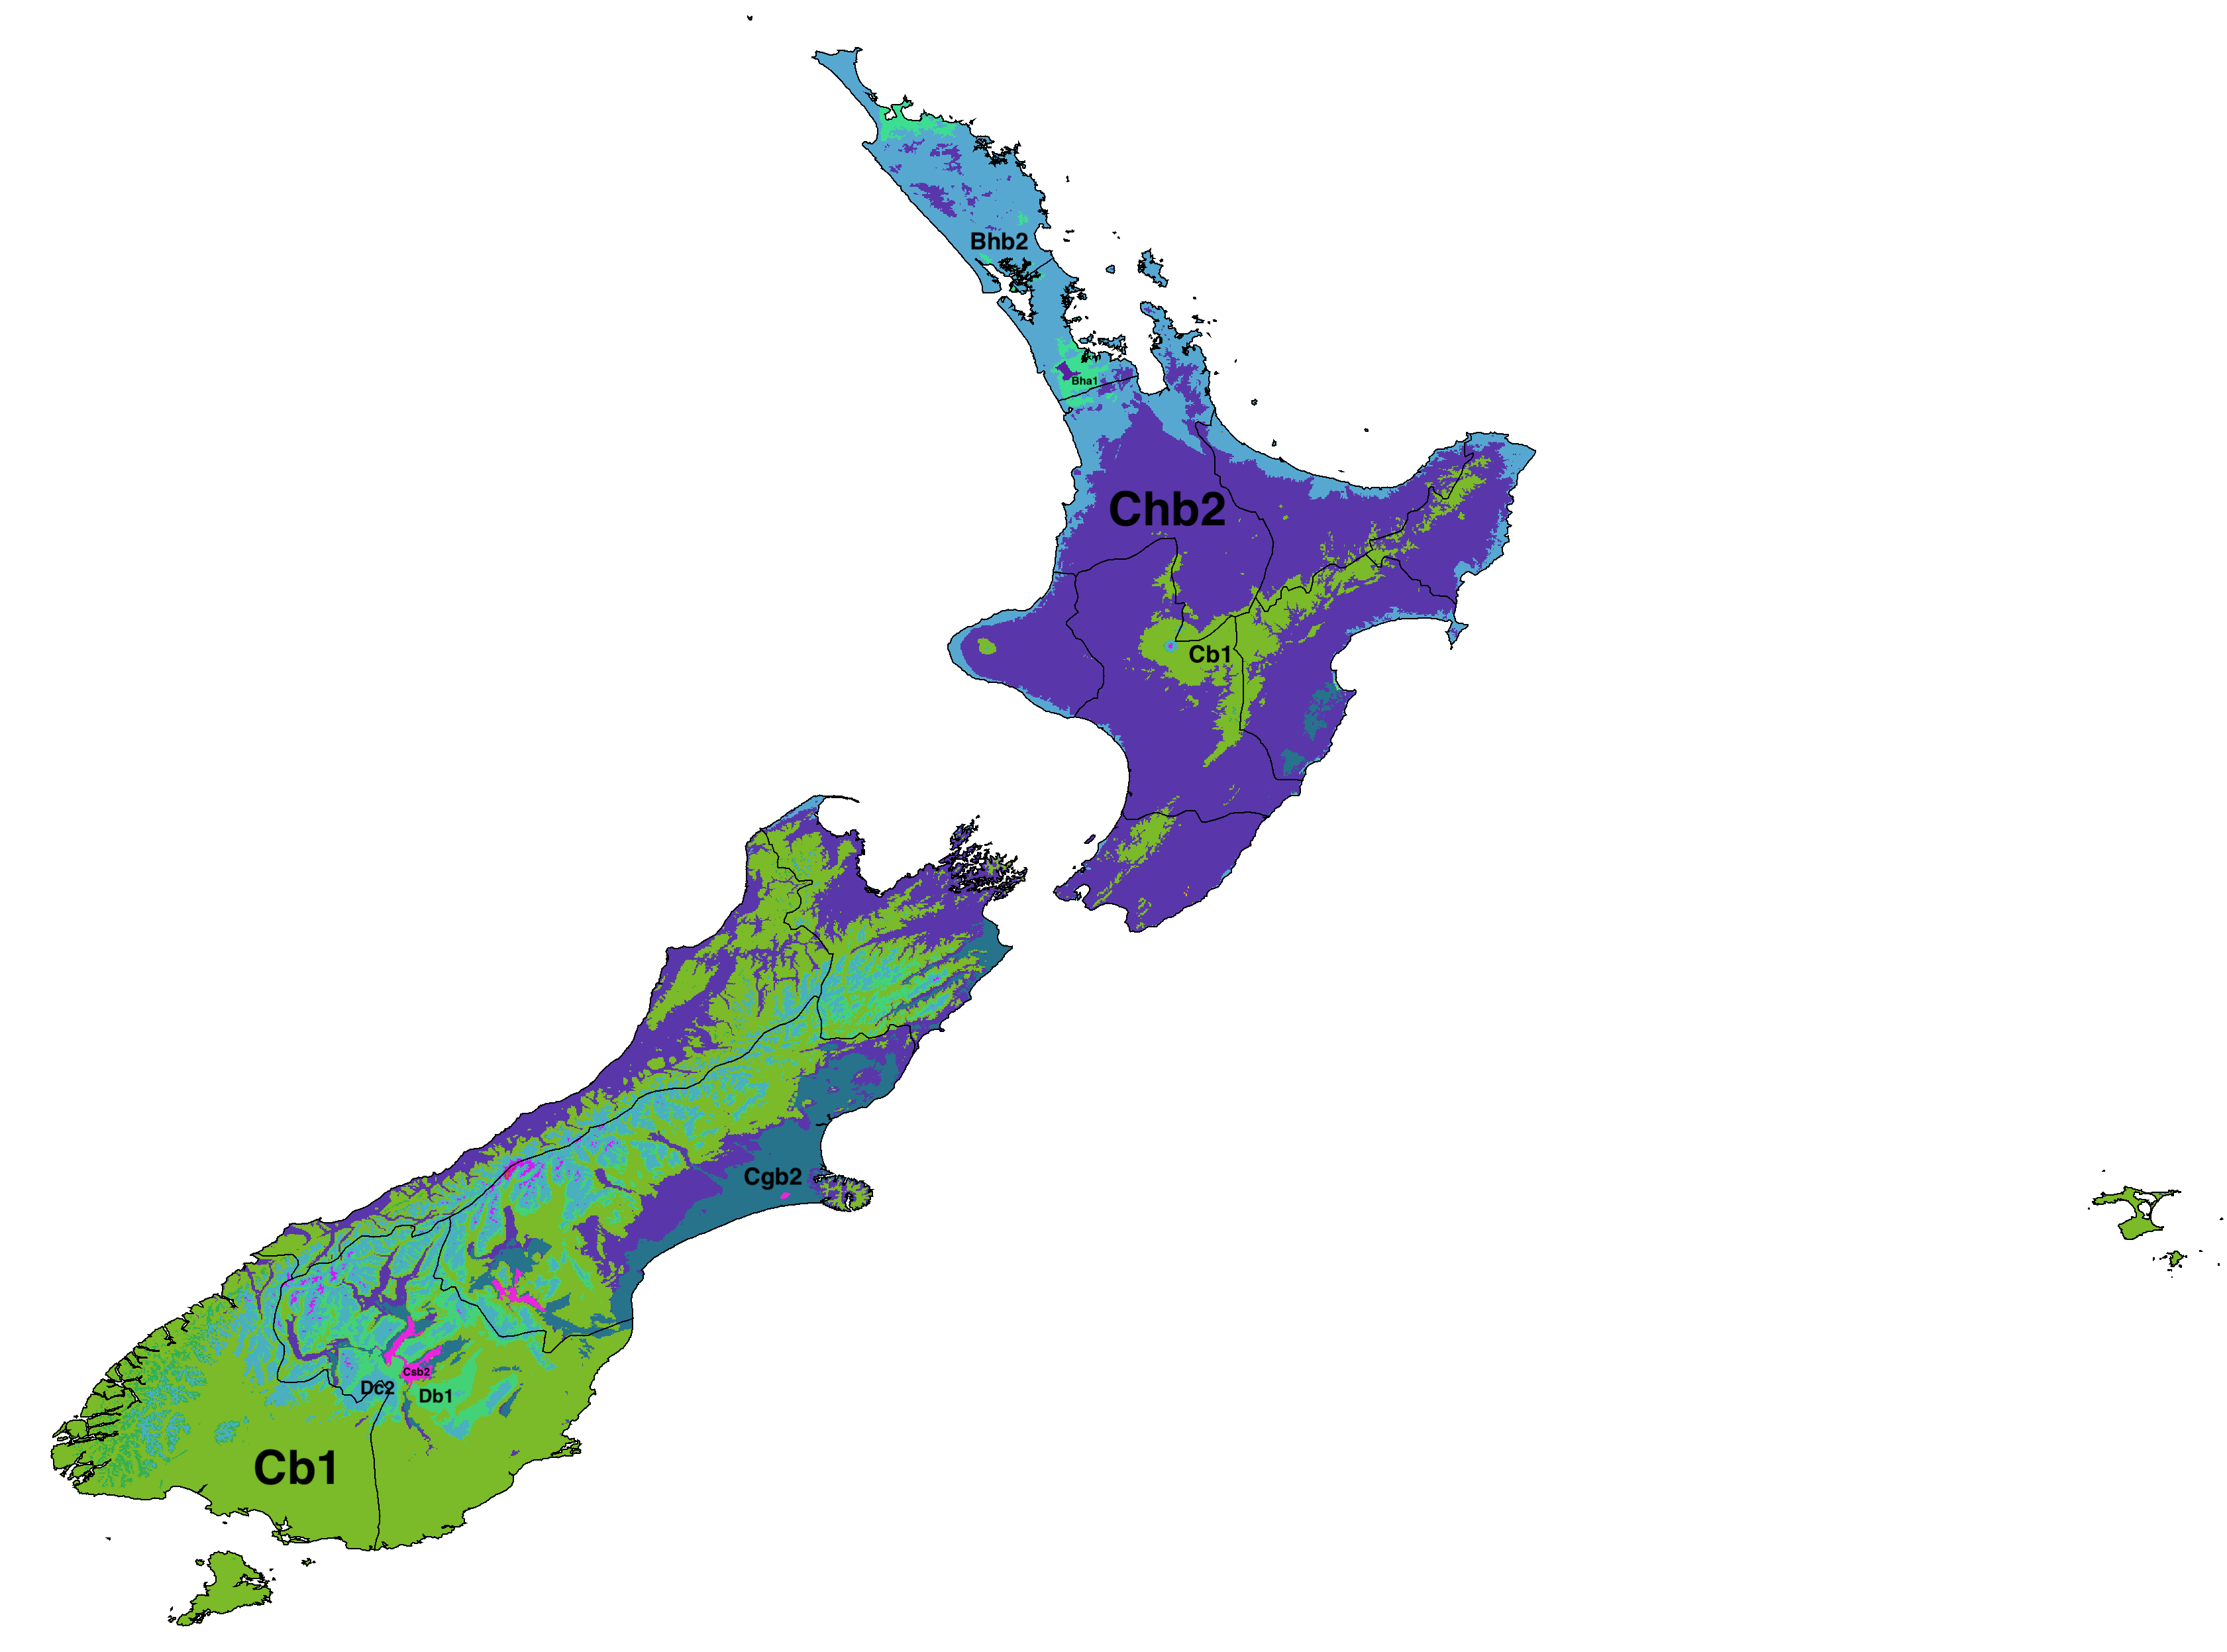
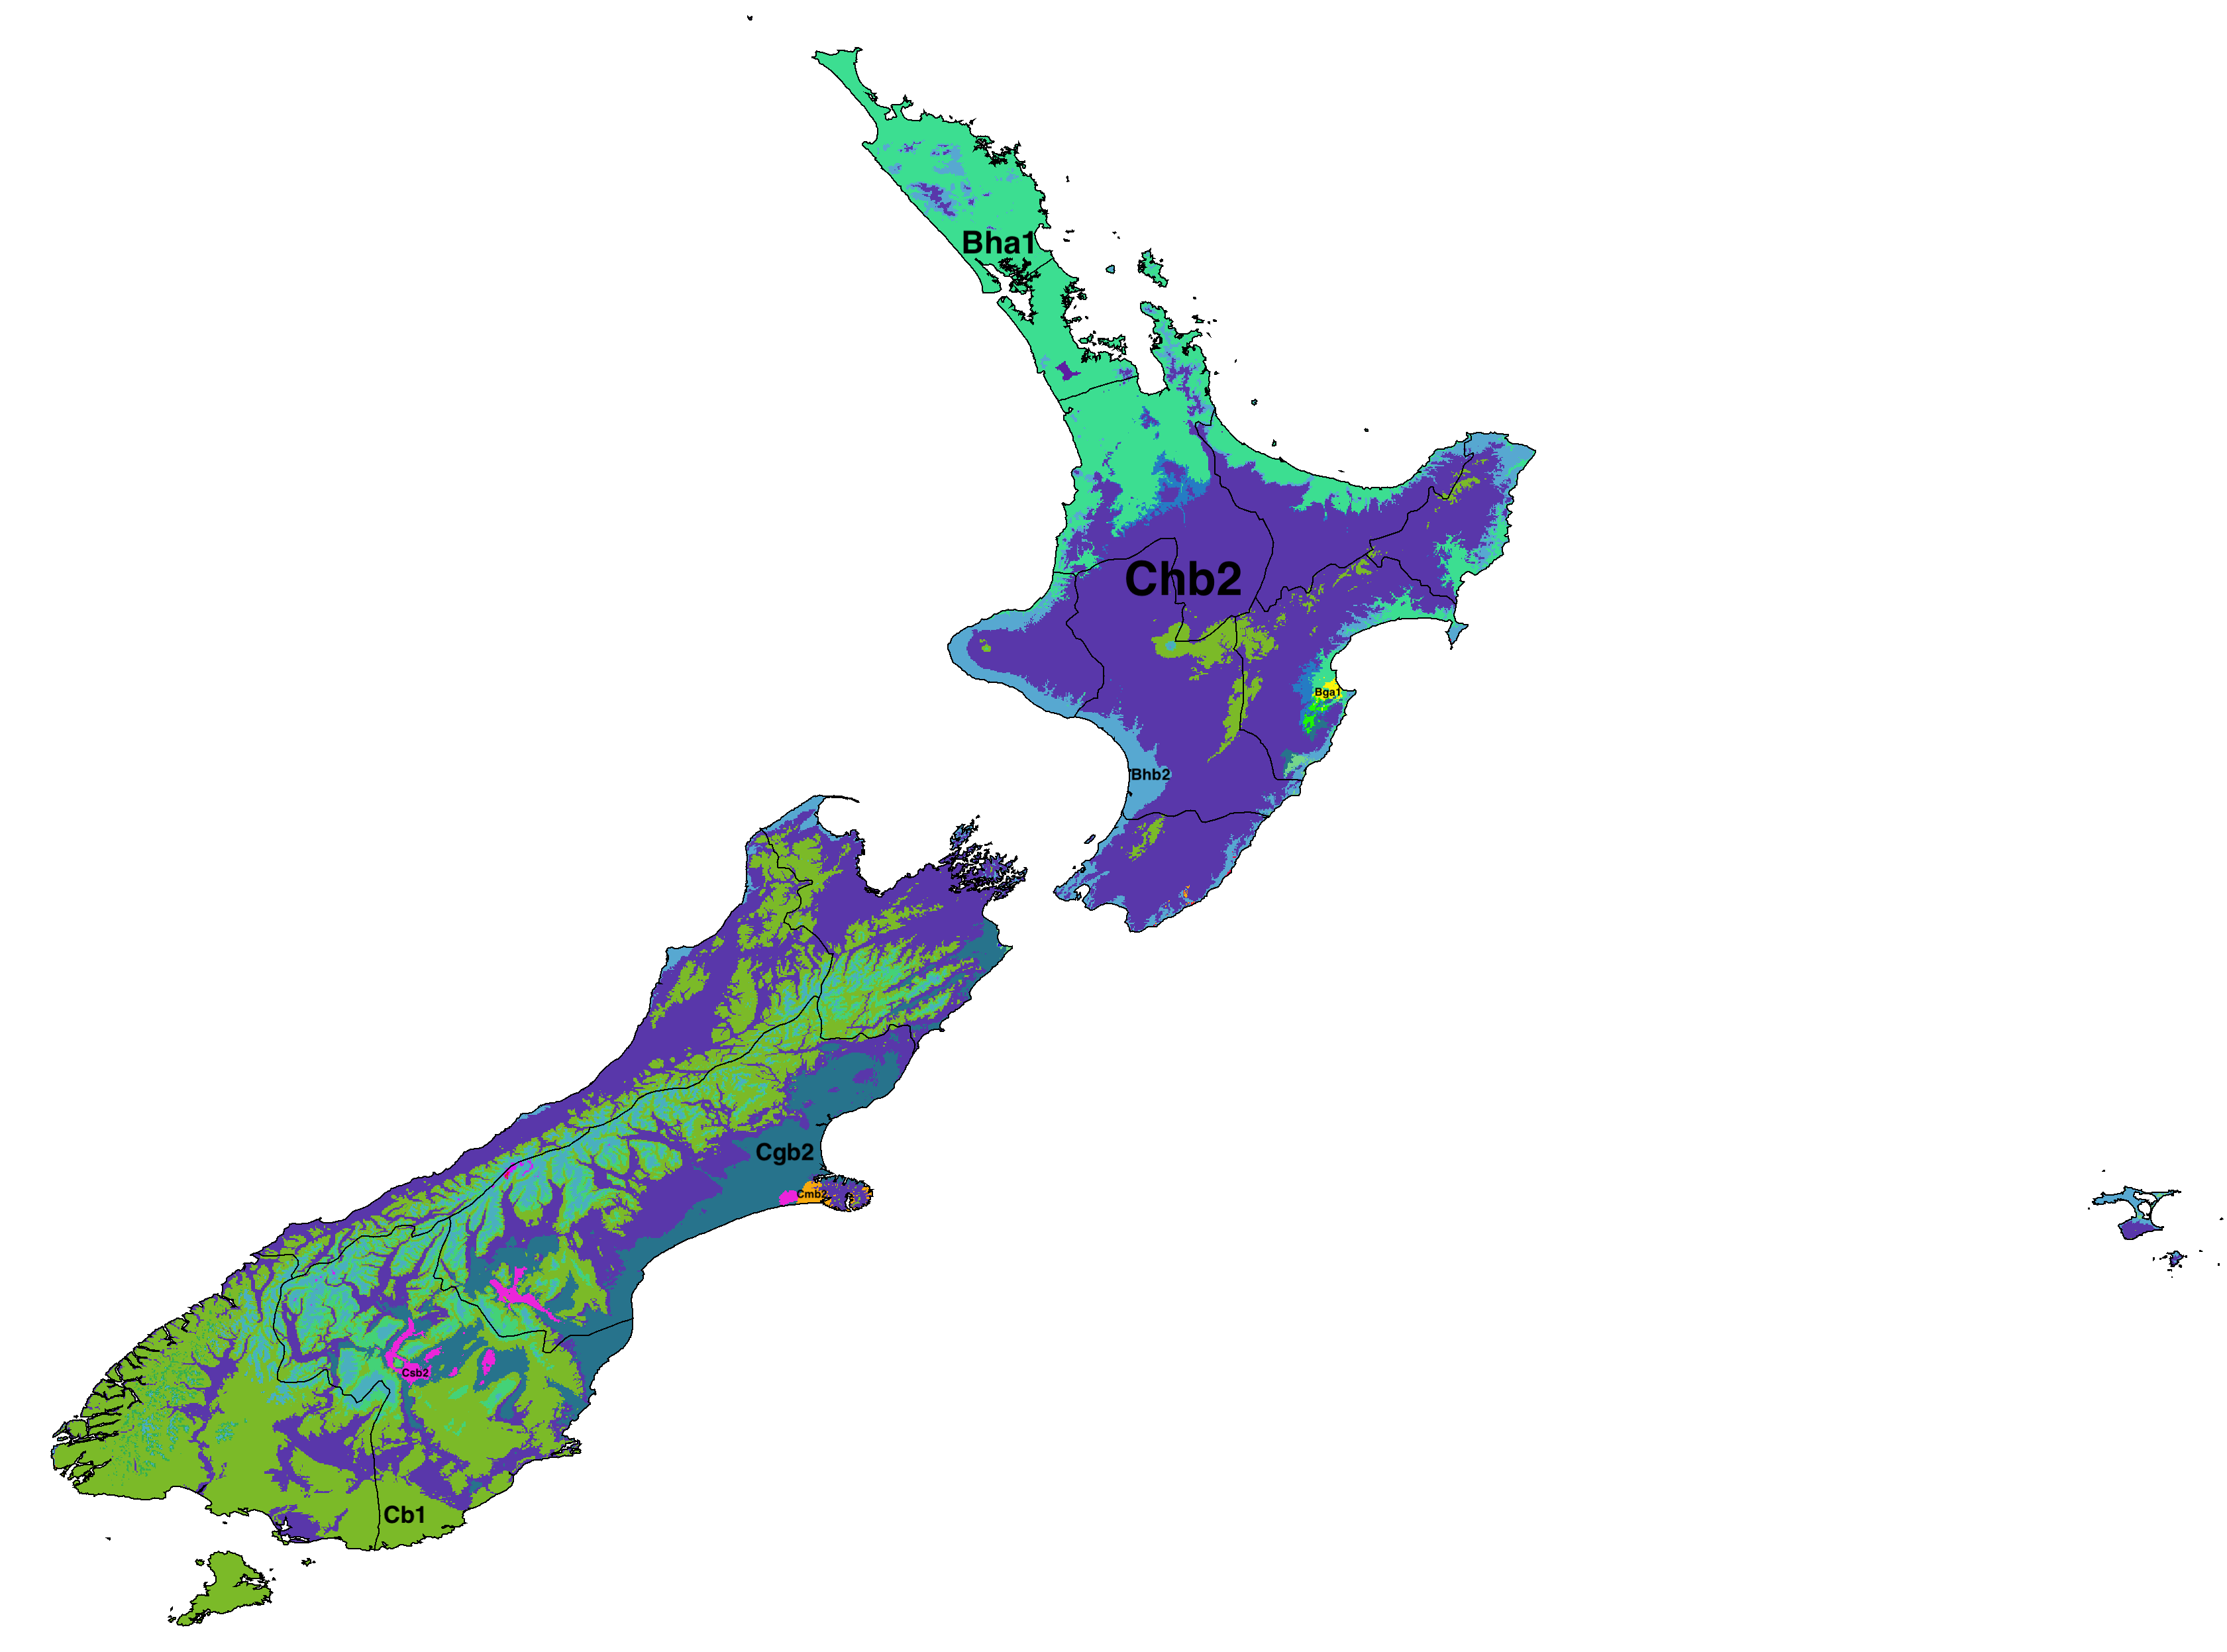
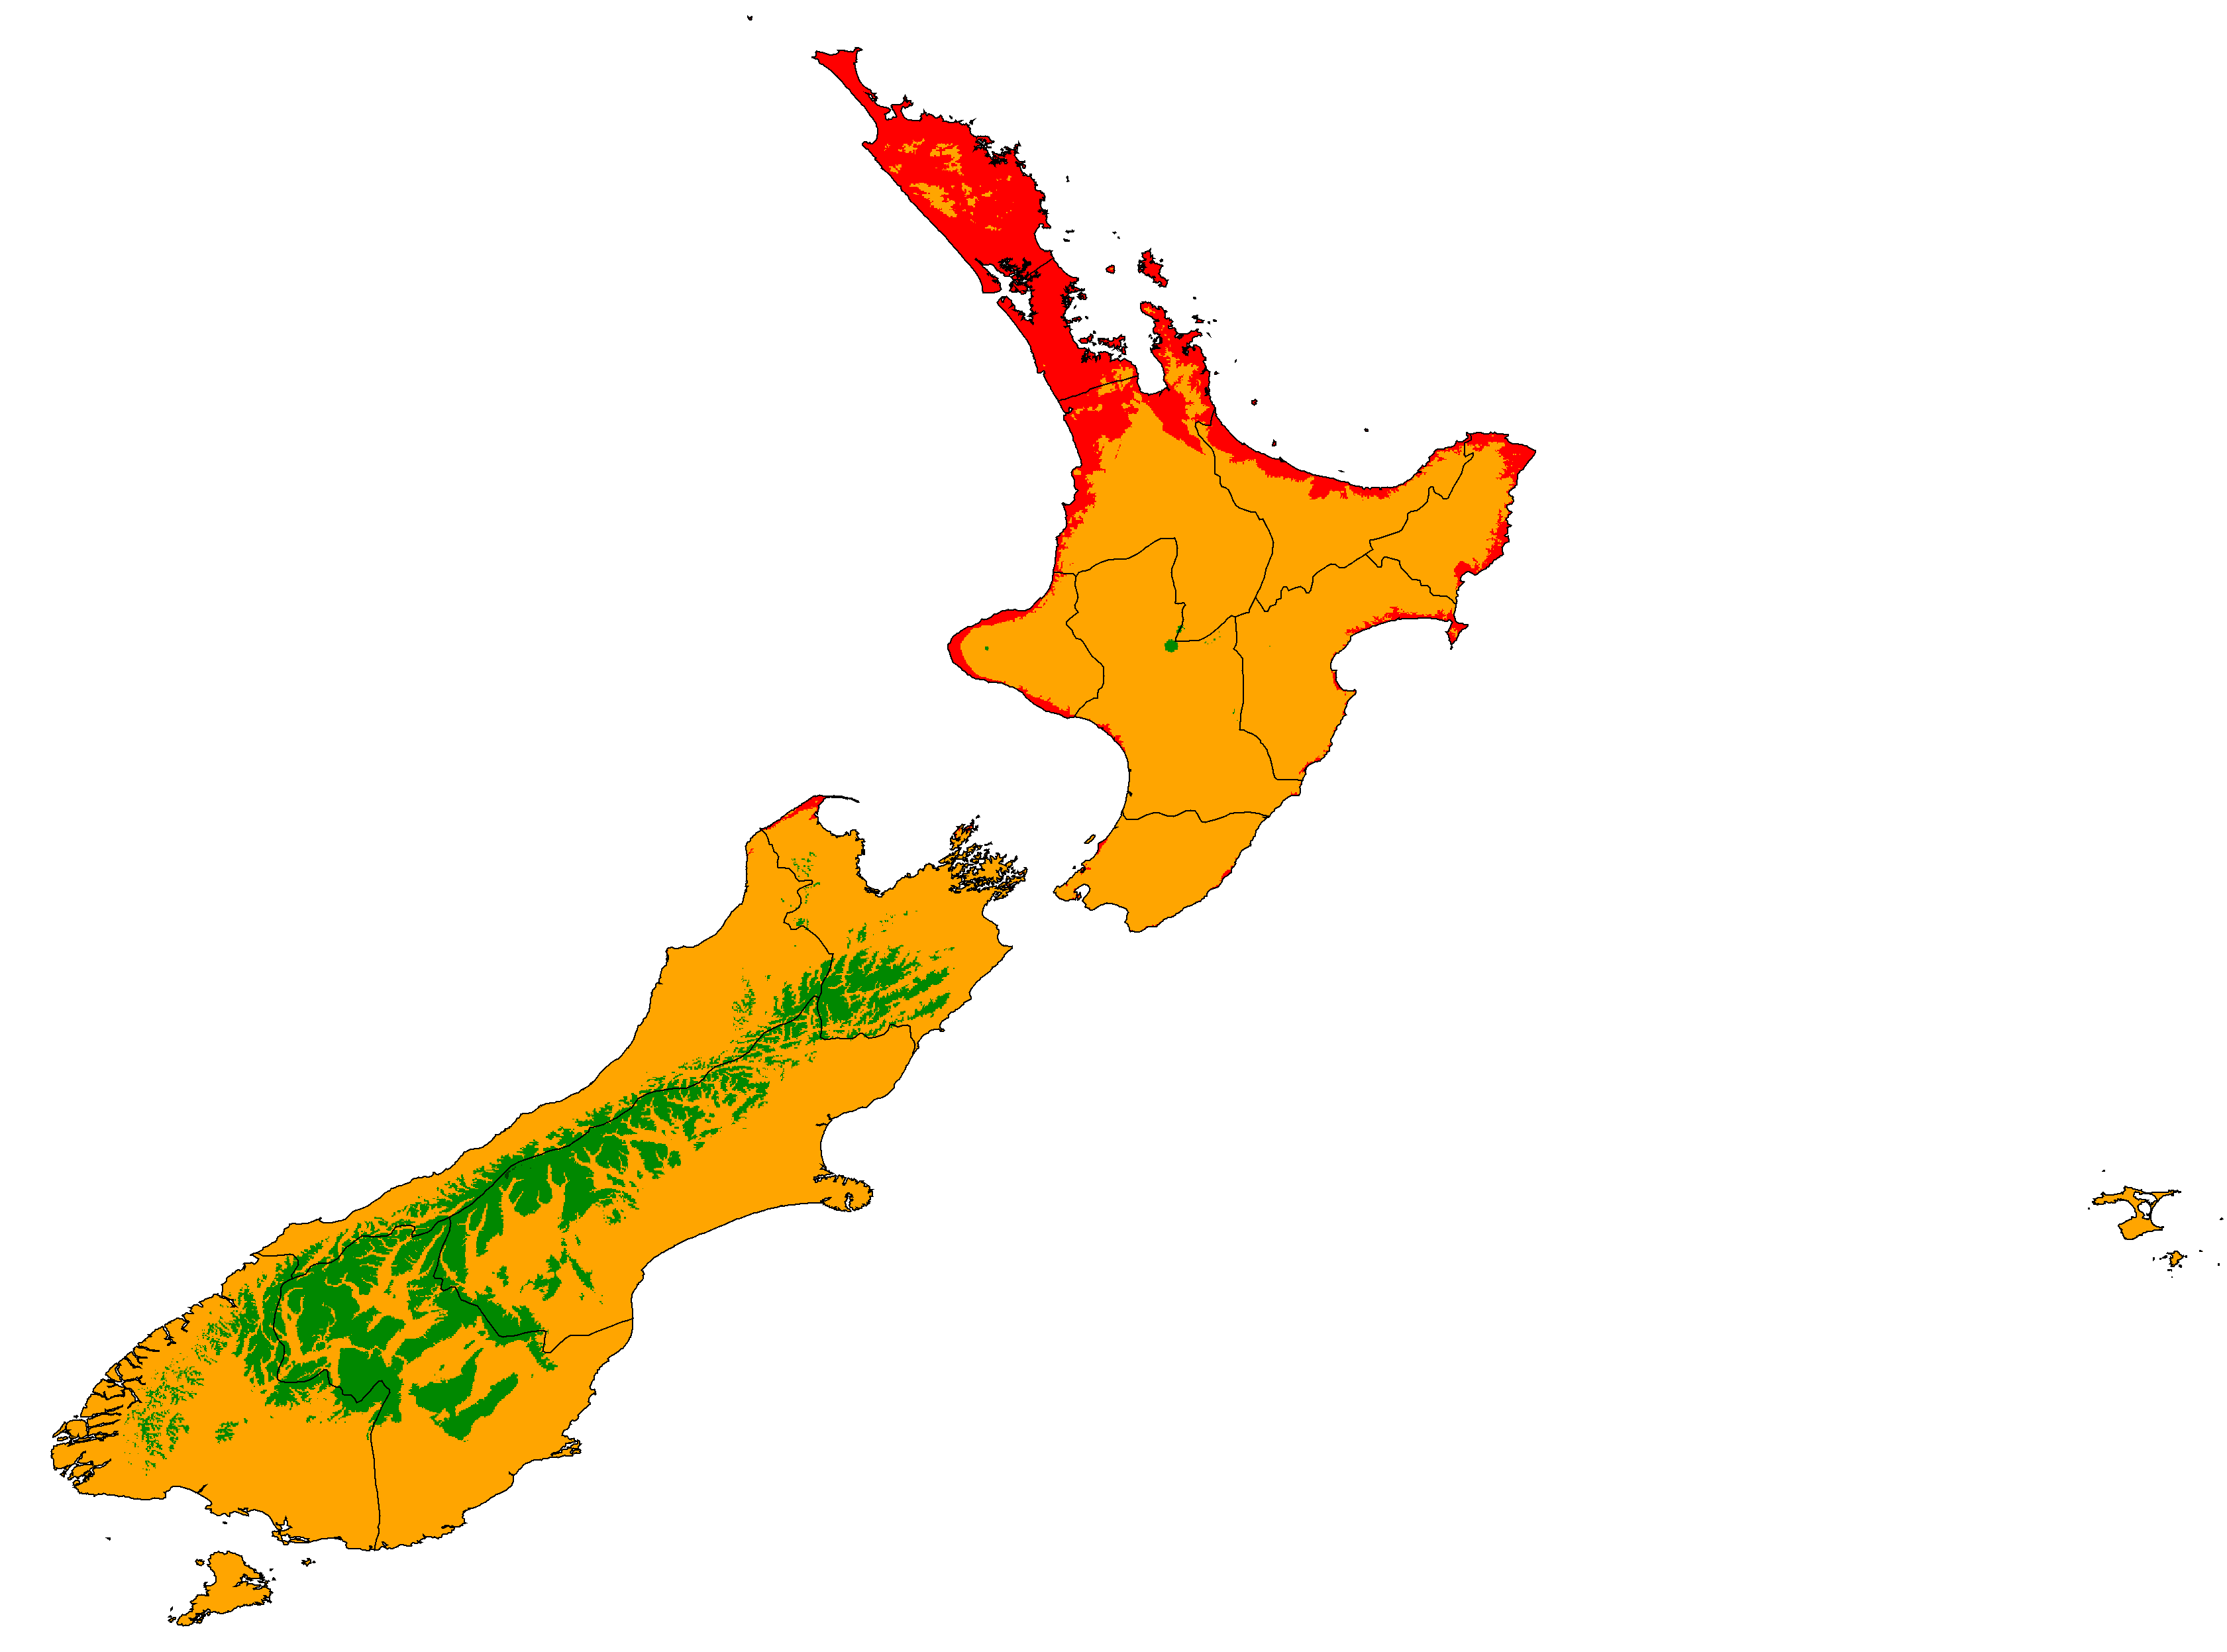
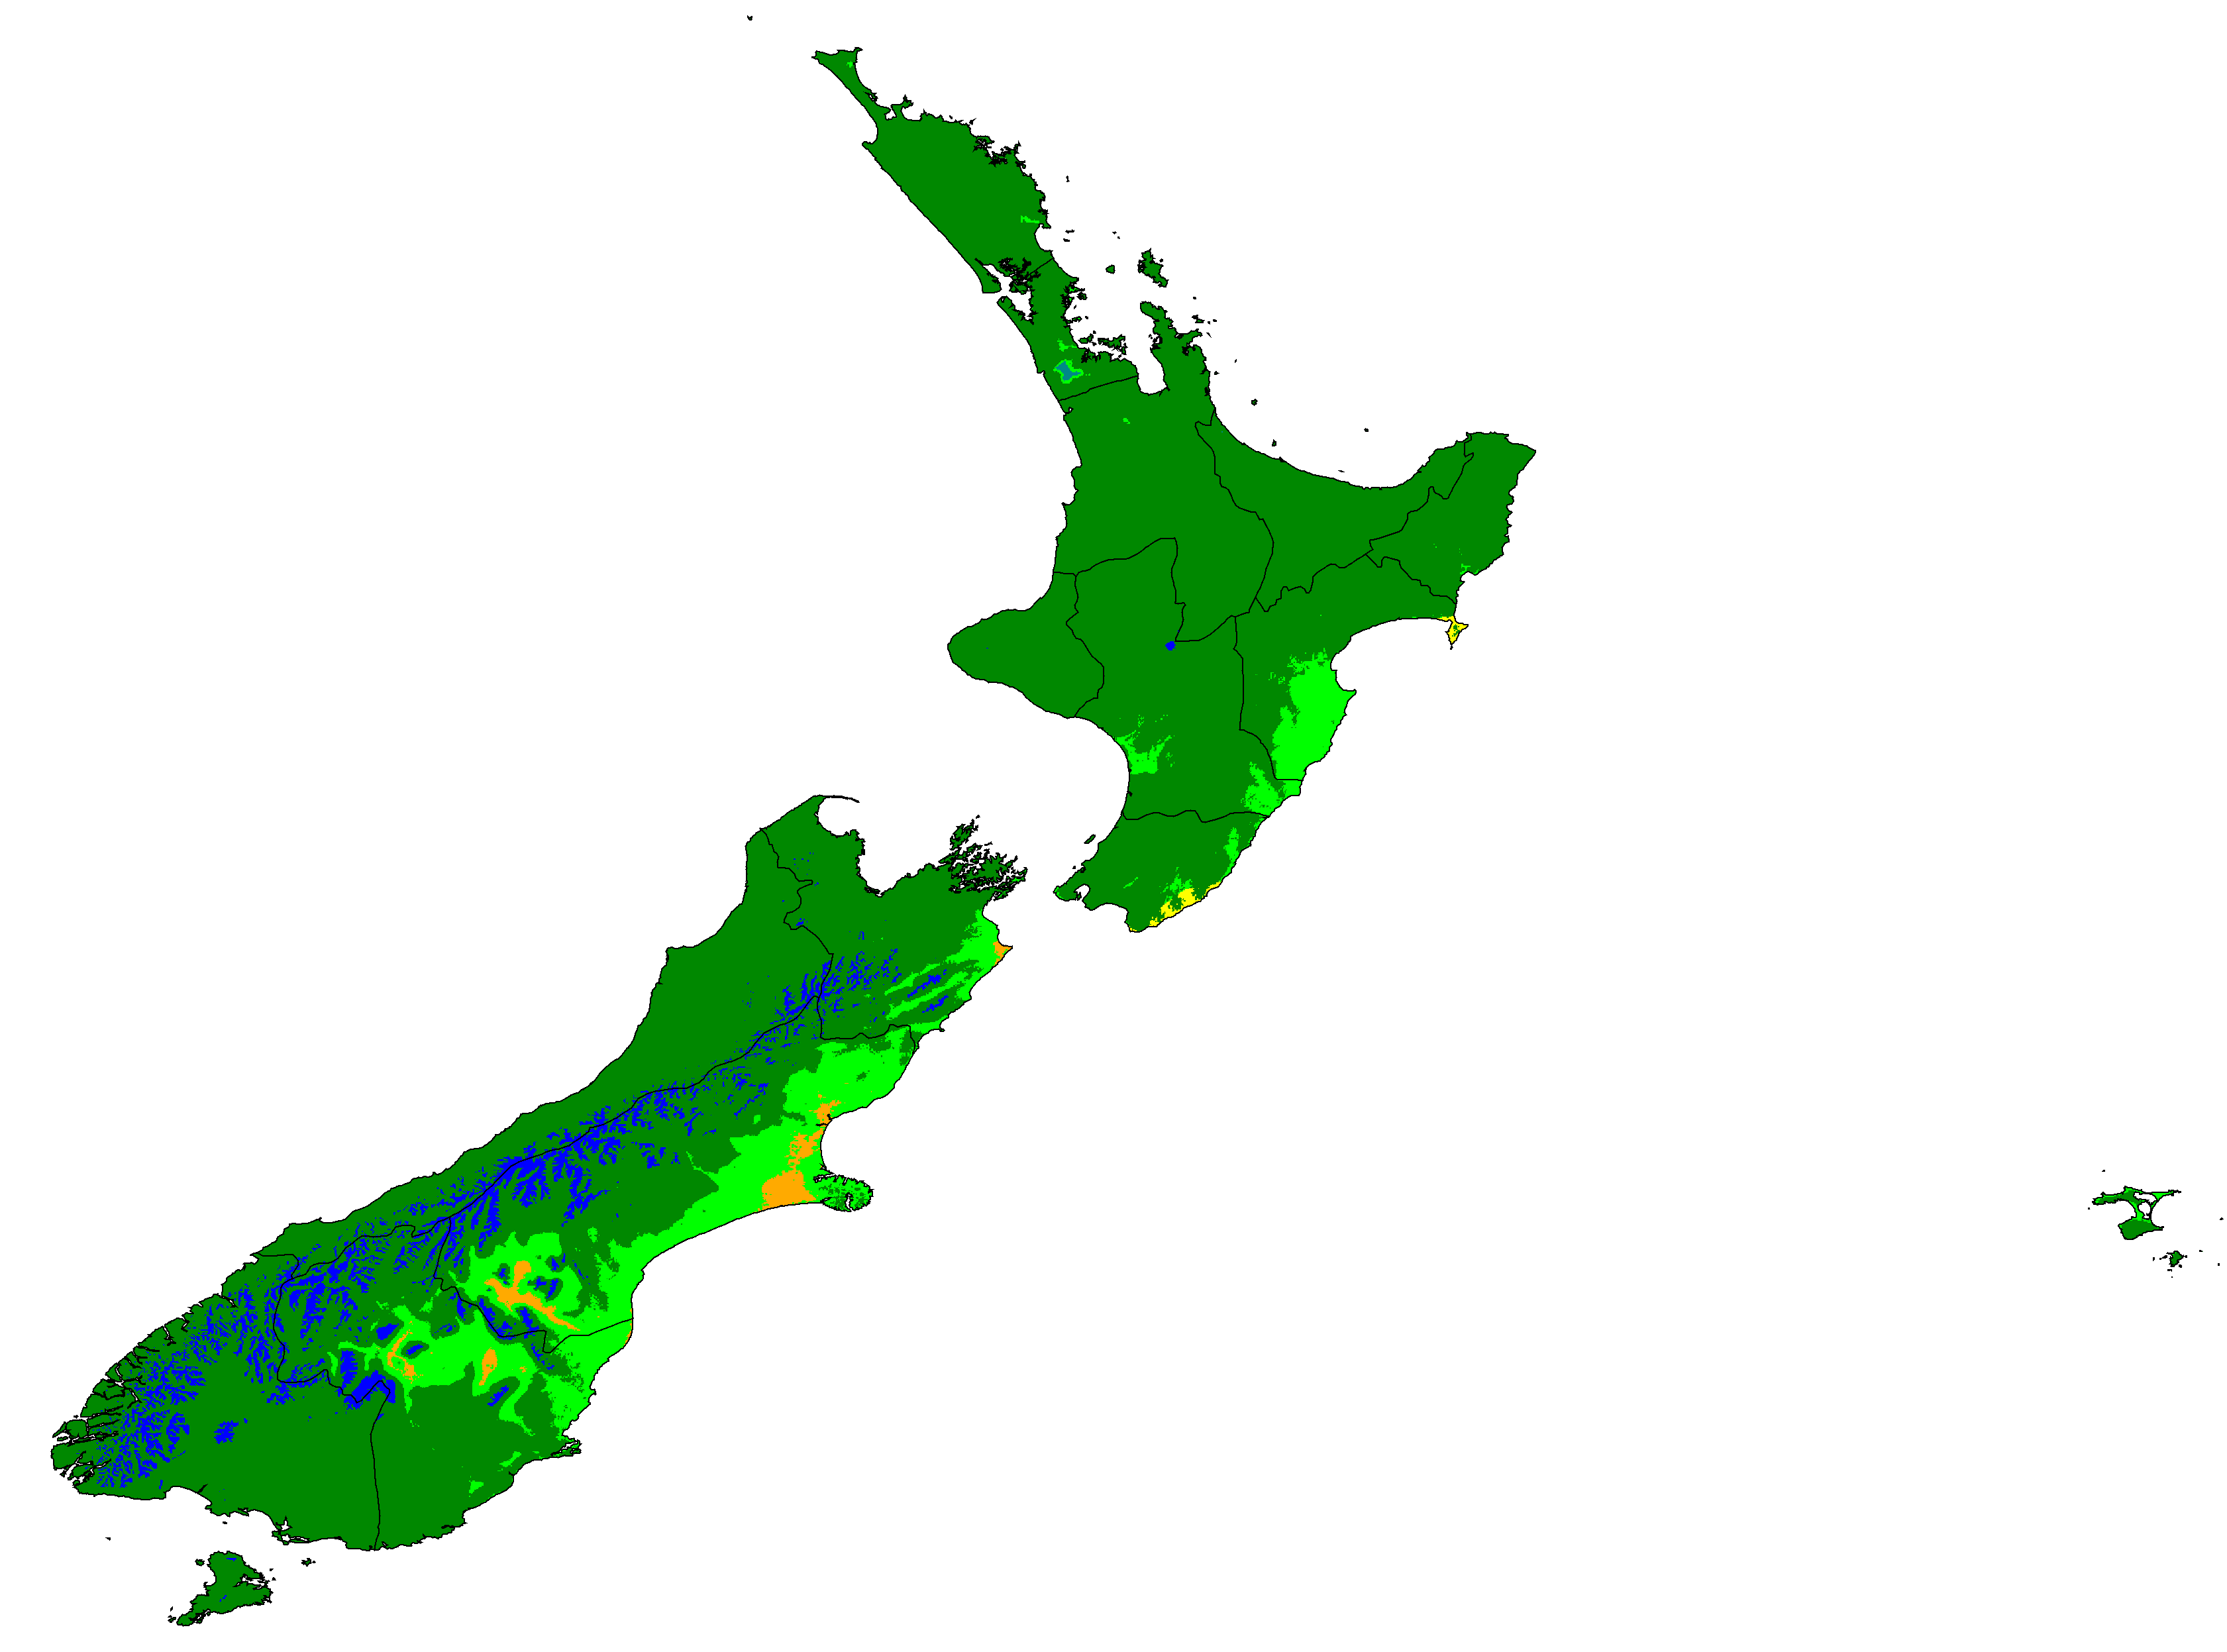
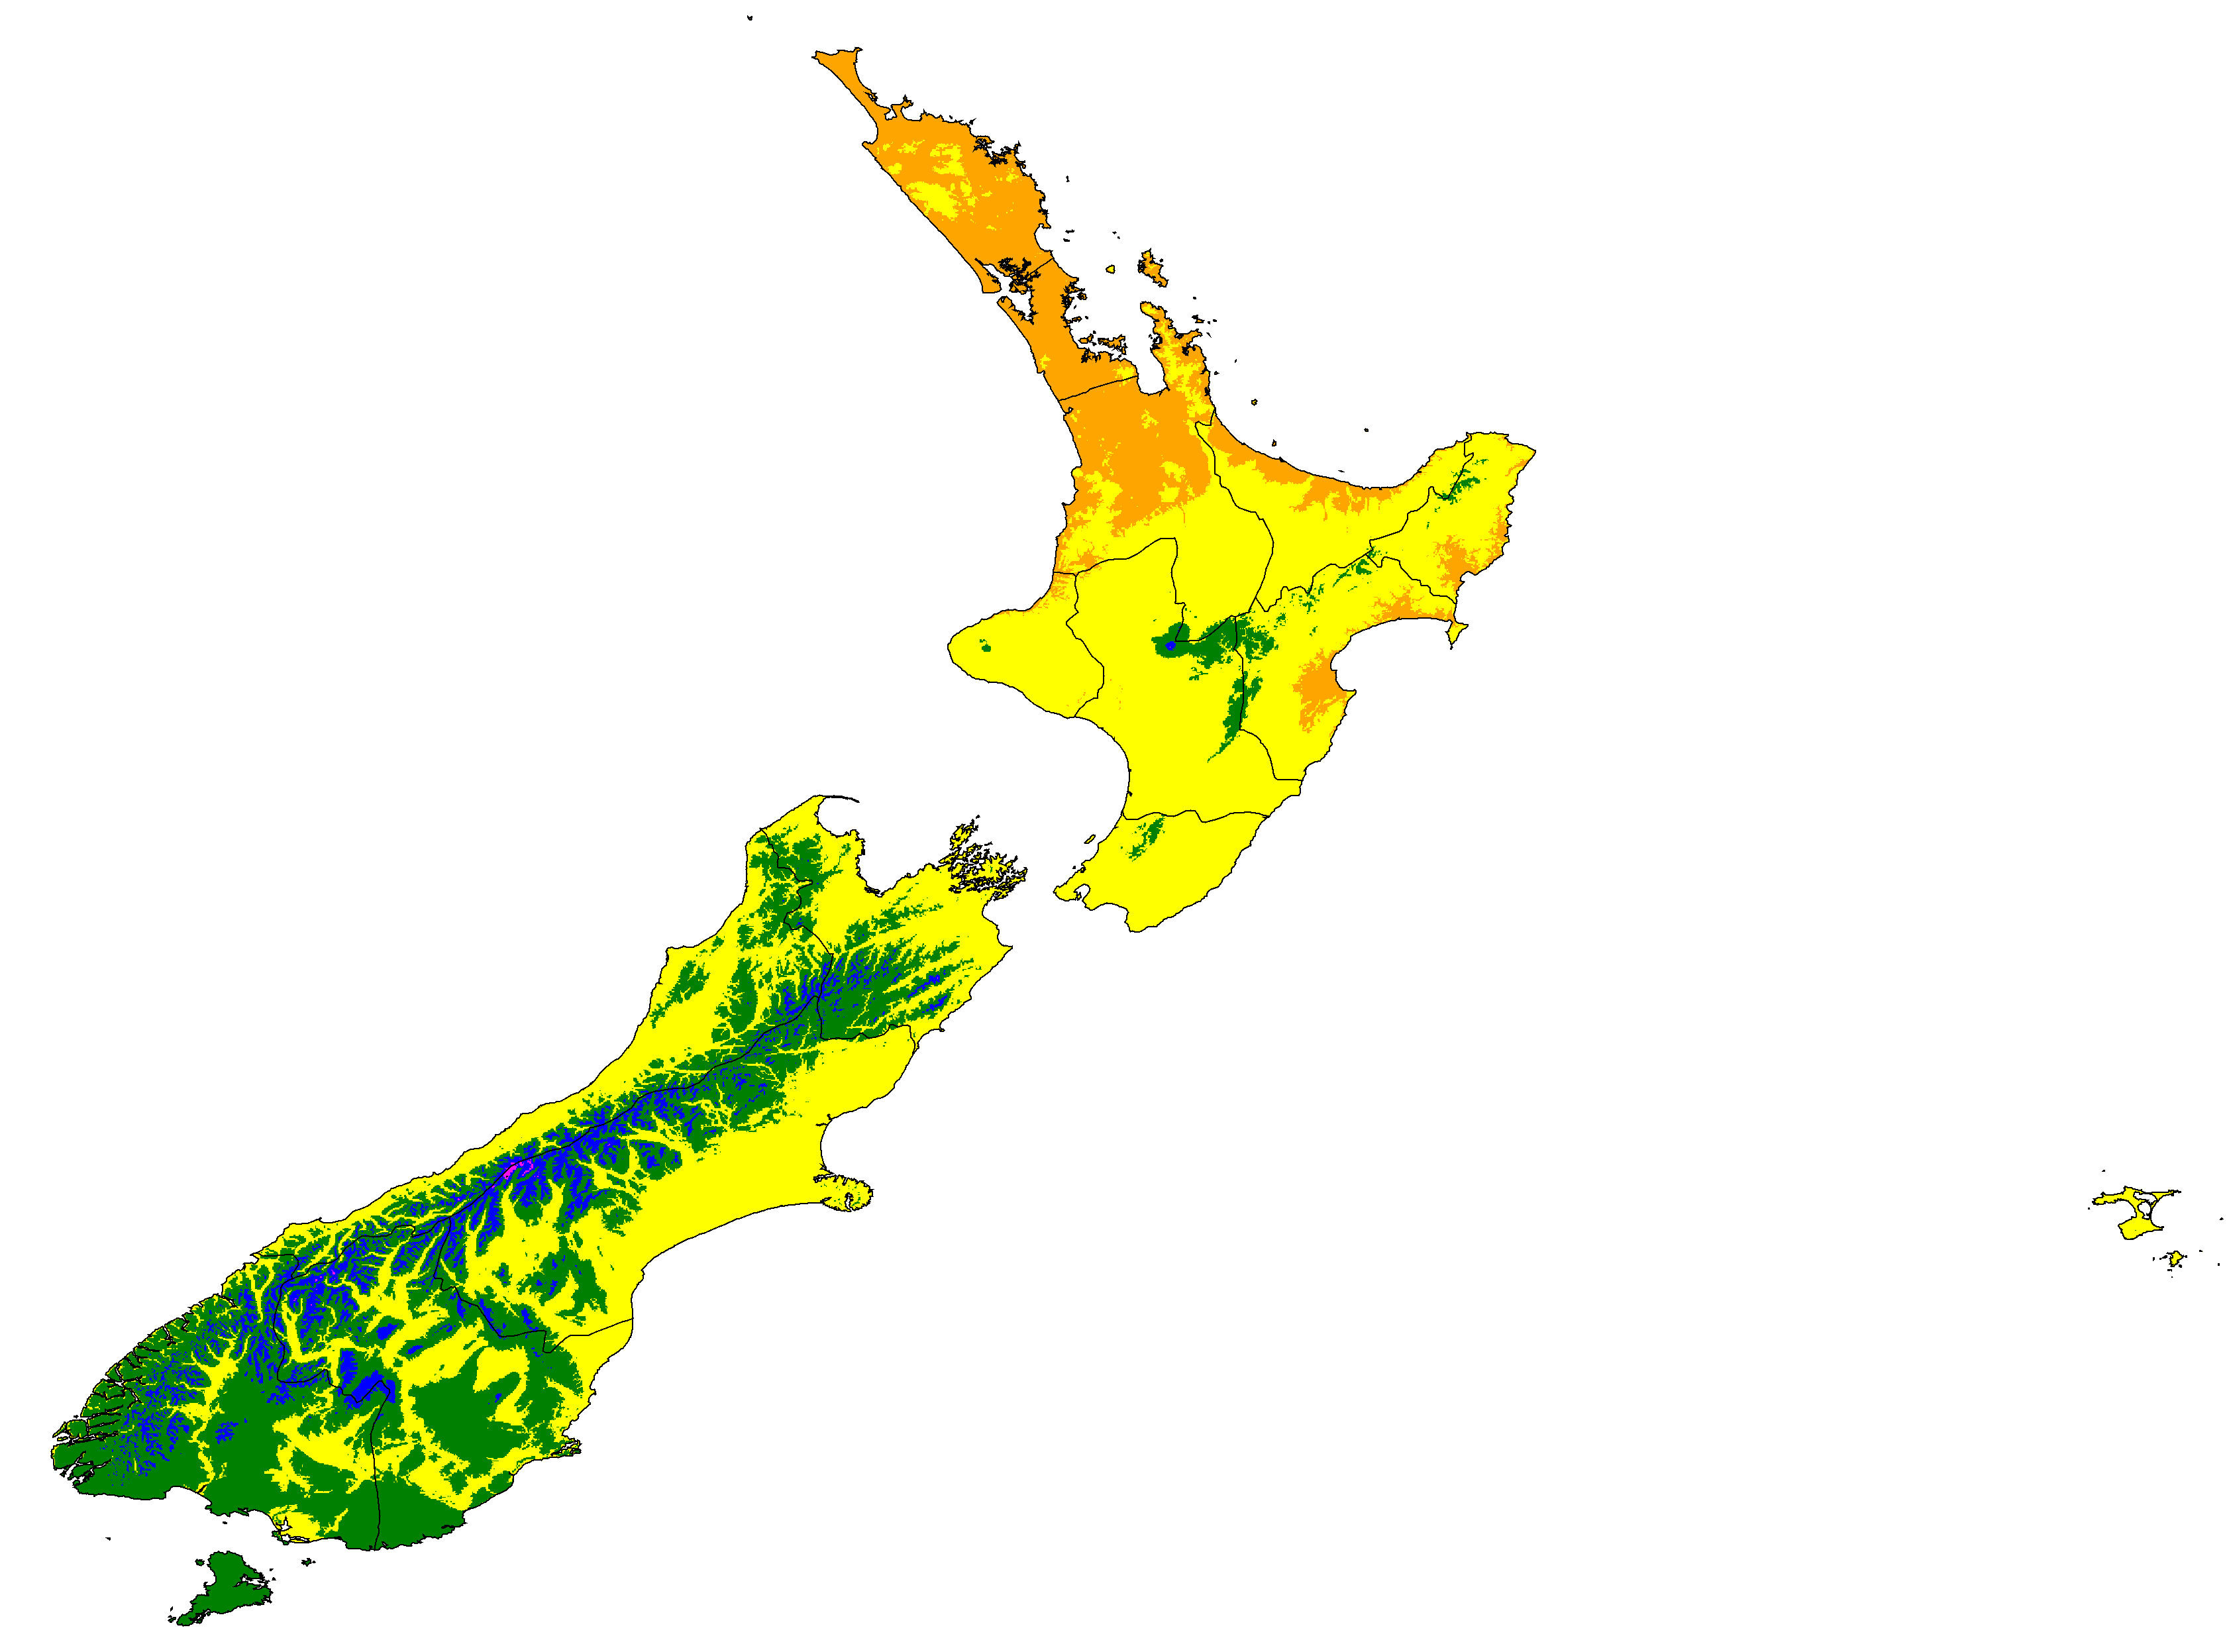
New Zealand distribution of classifications (projections are SSP5-8.5 high emissions normals)
Note: Due to the complexity of the system, only the most common climates in each map are labeled.
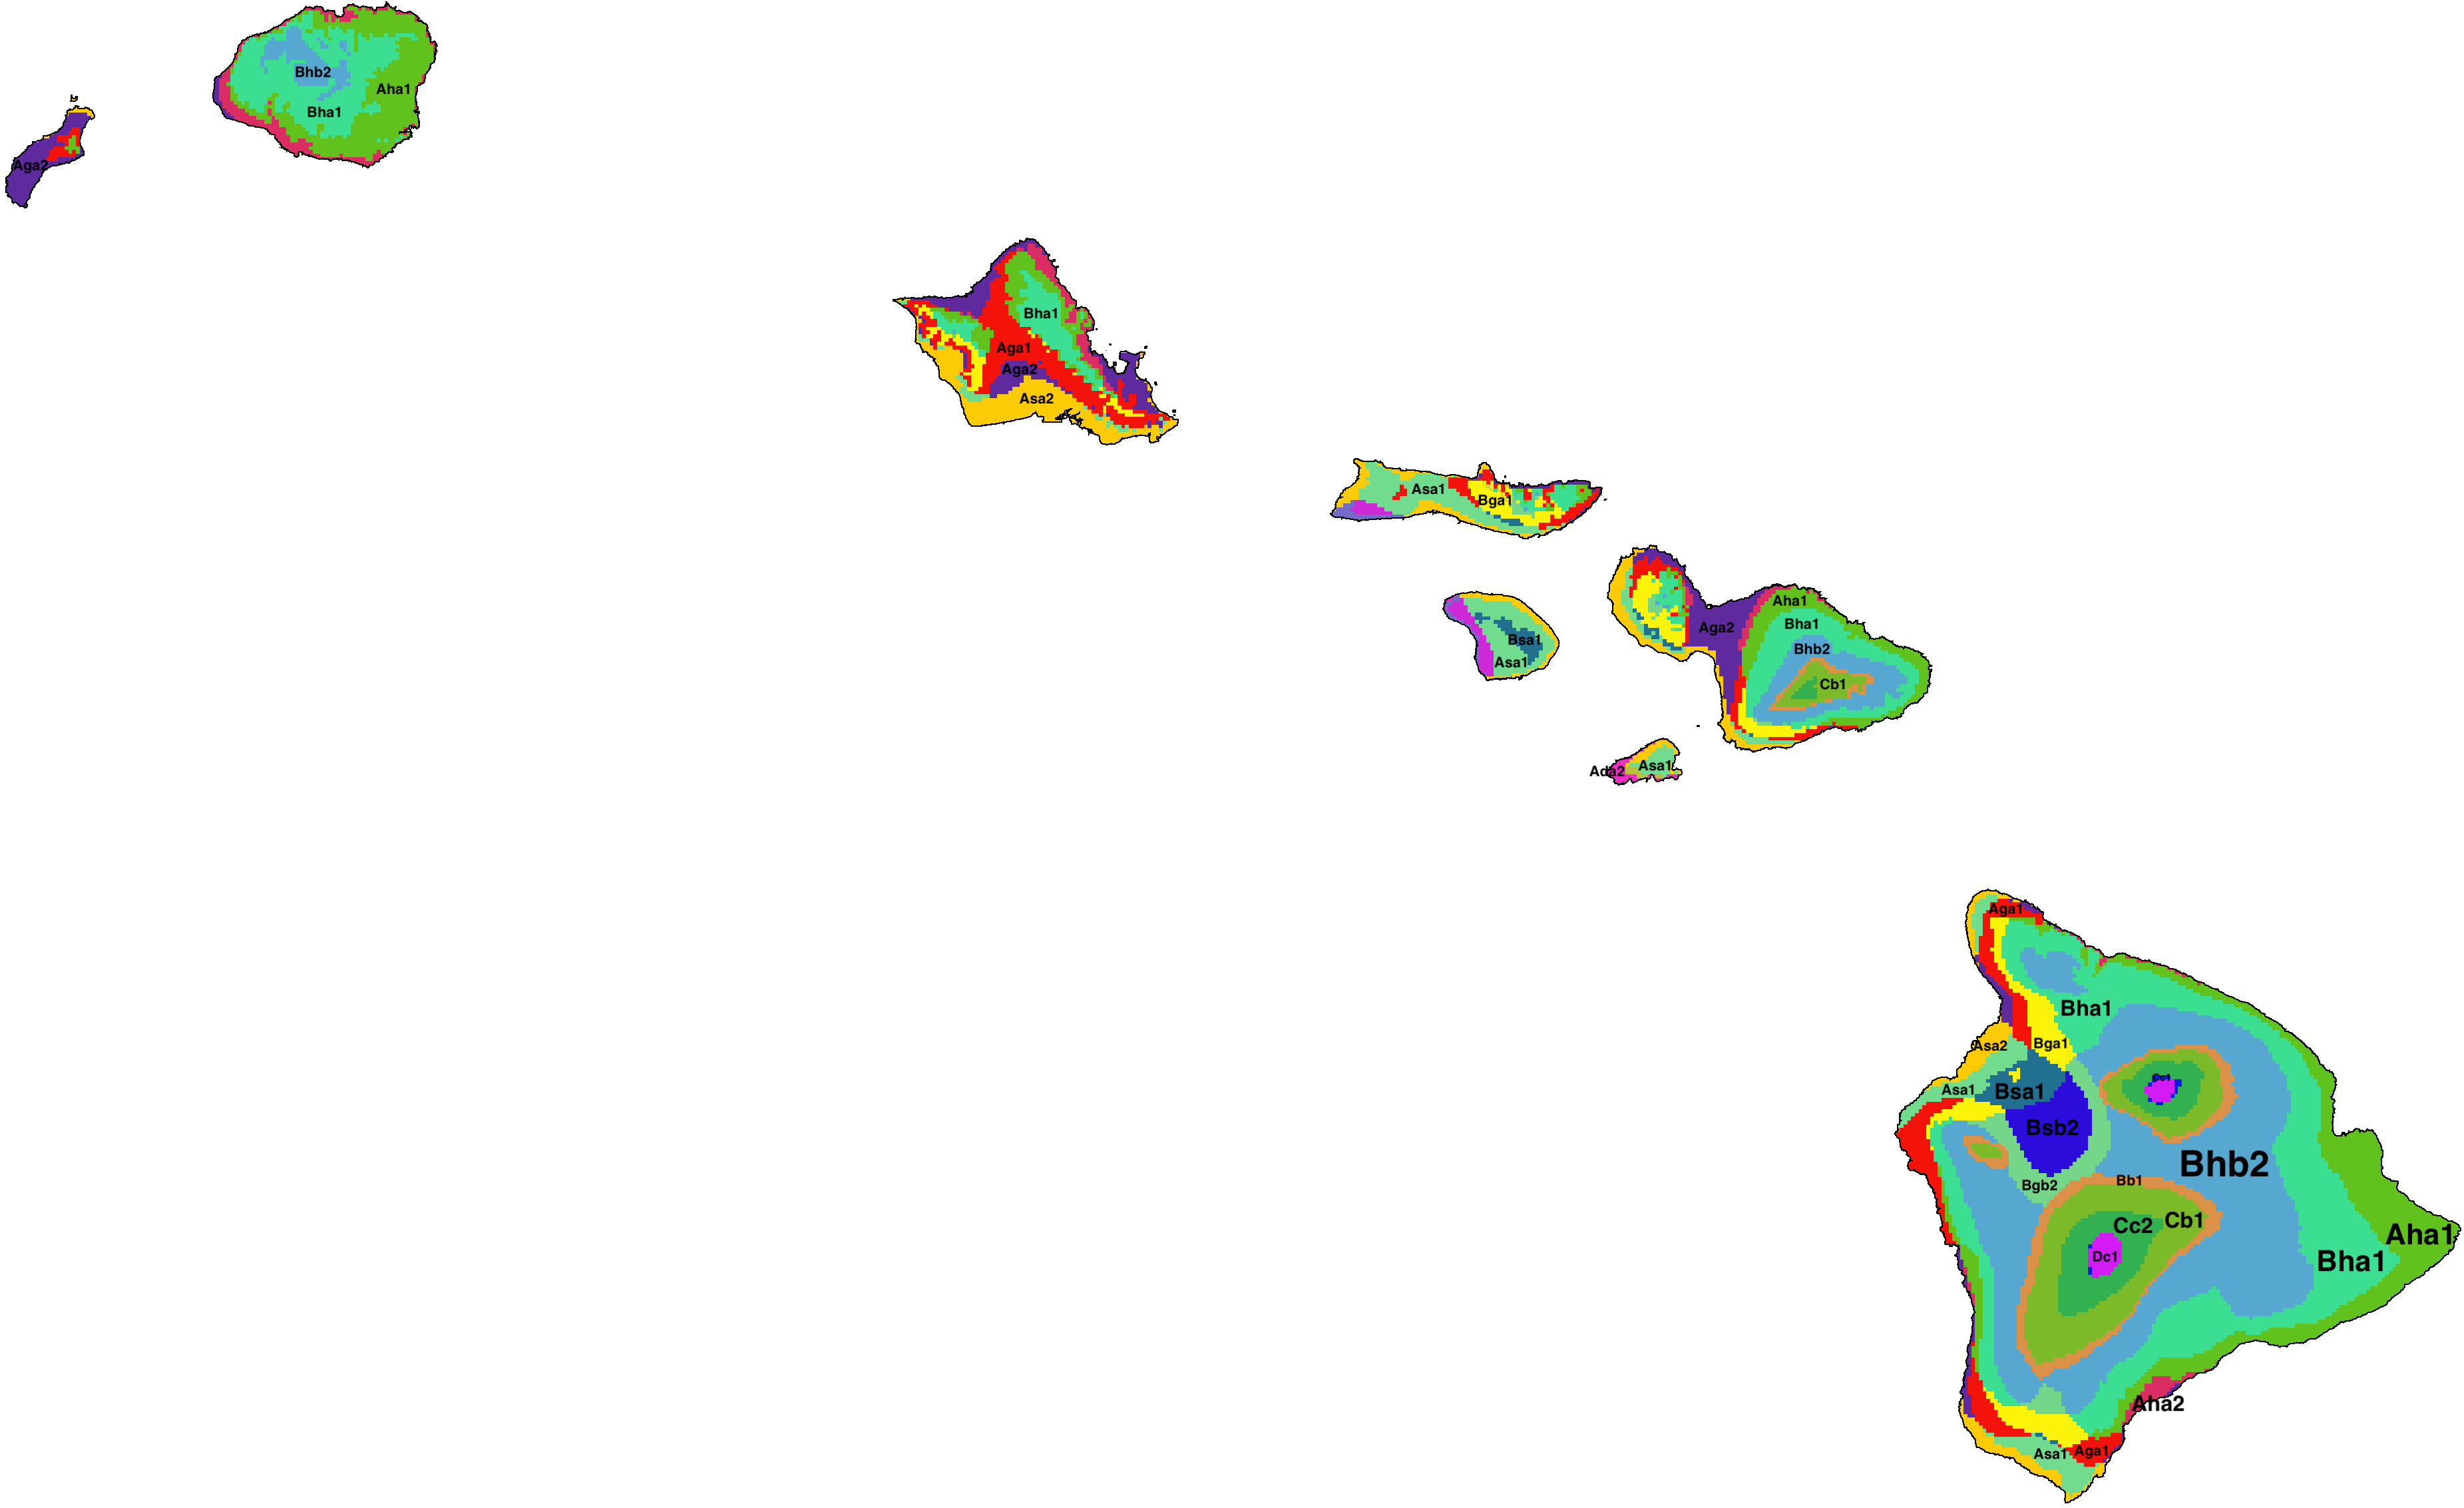
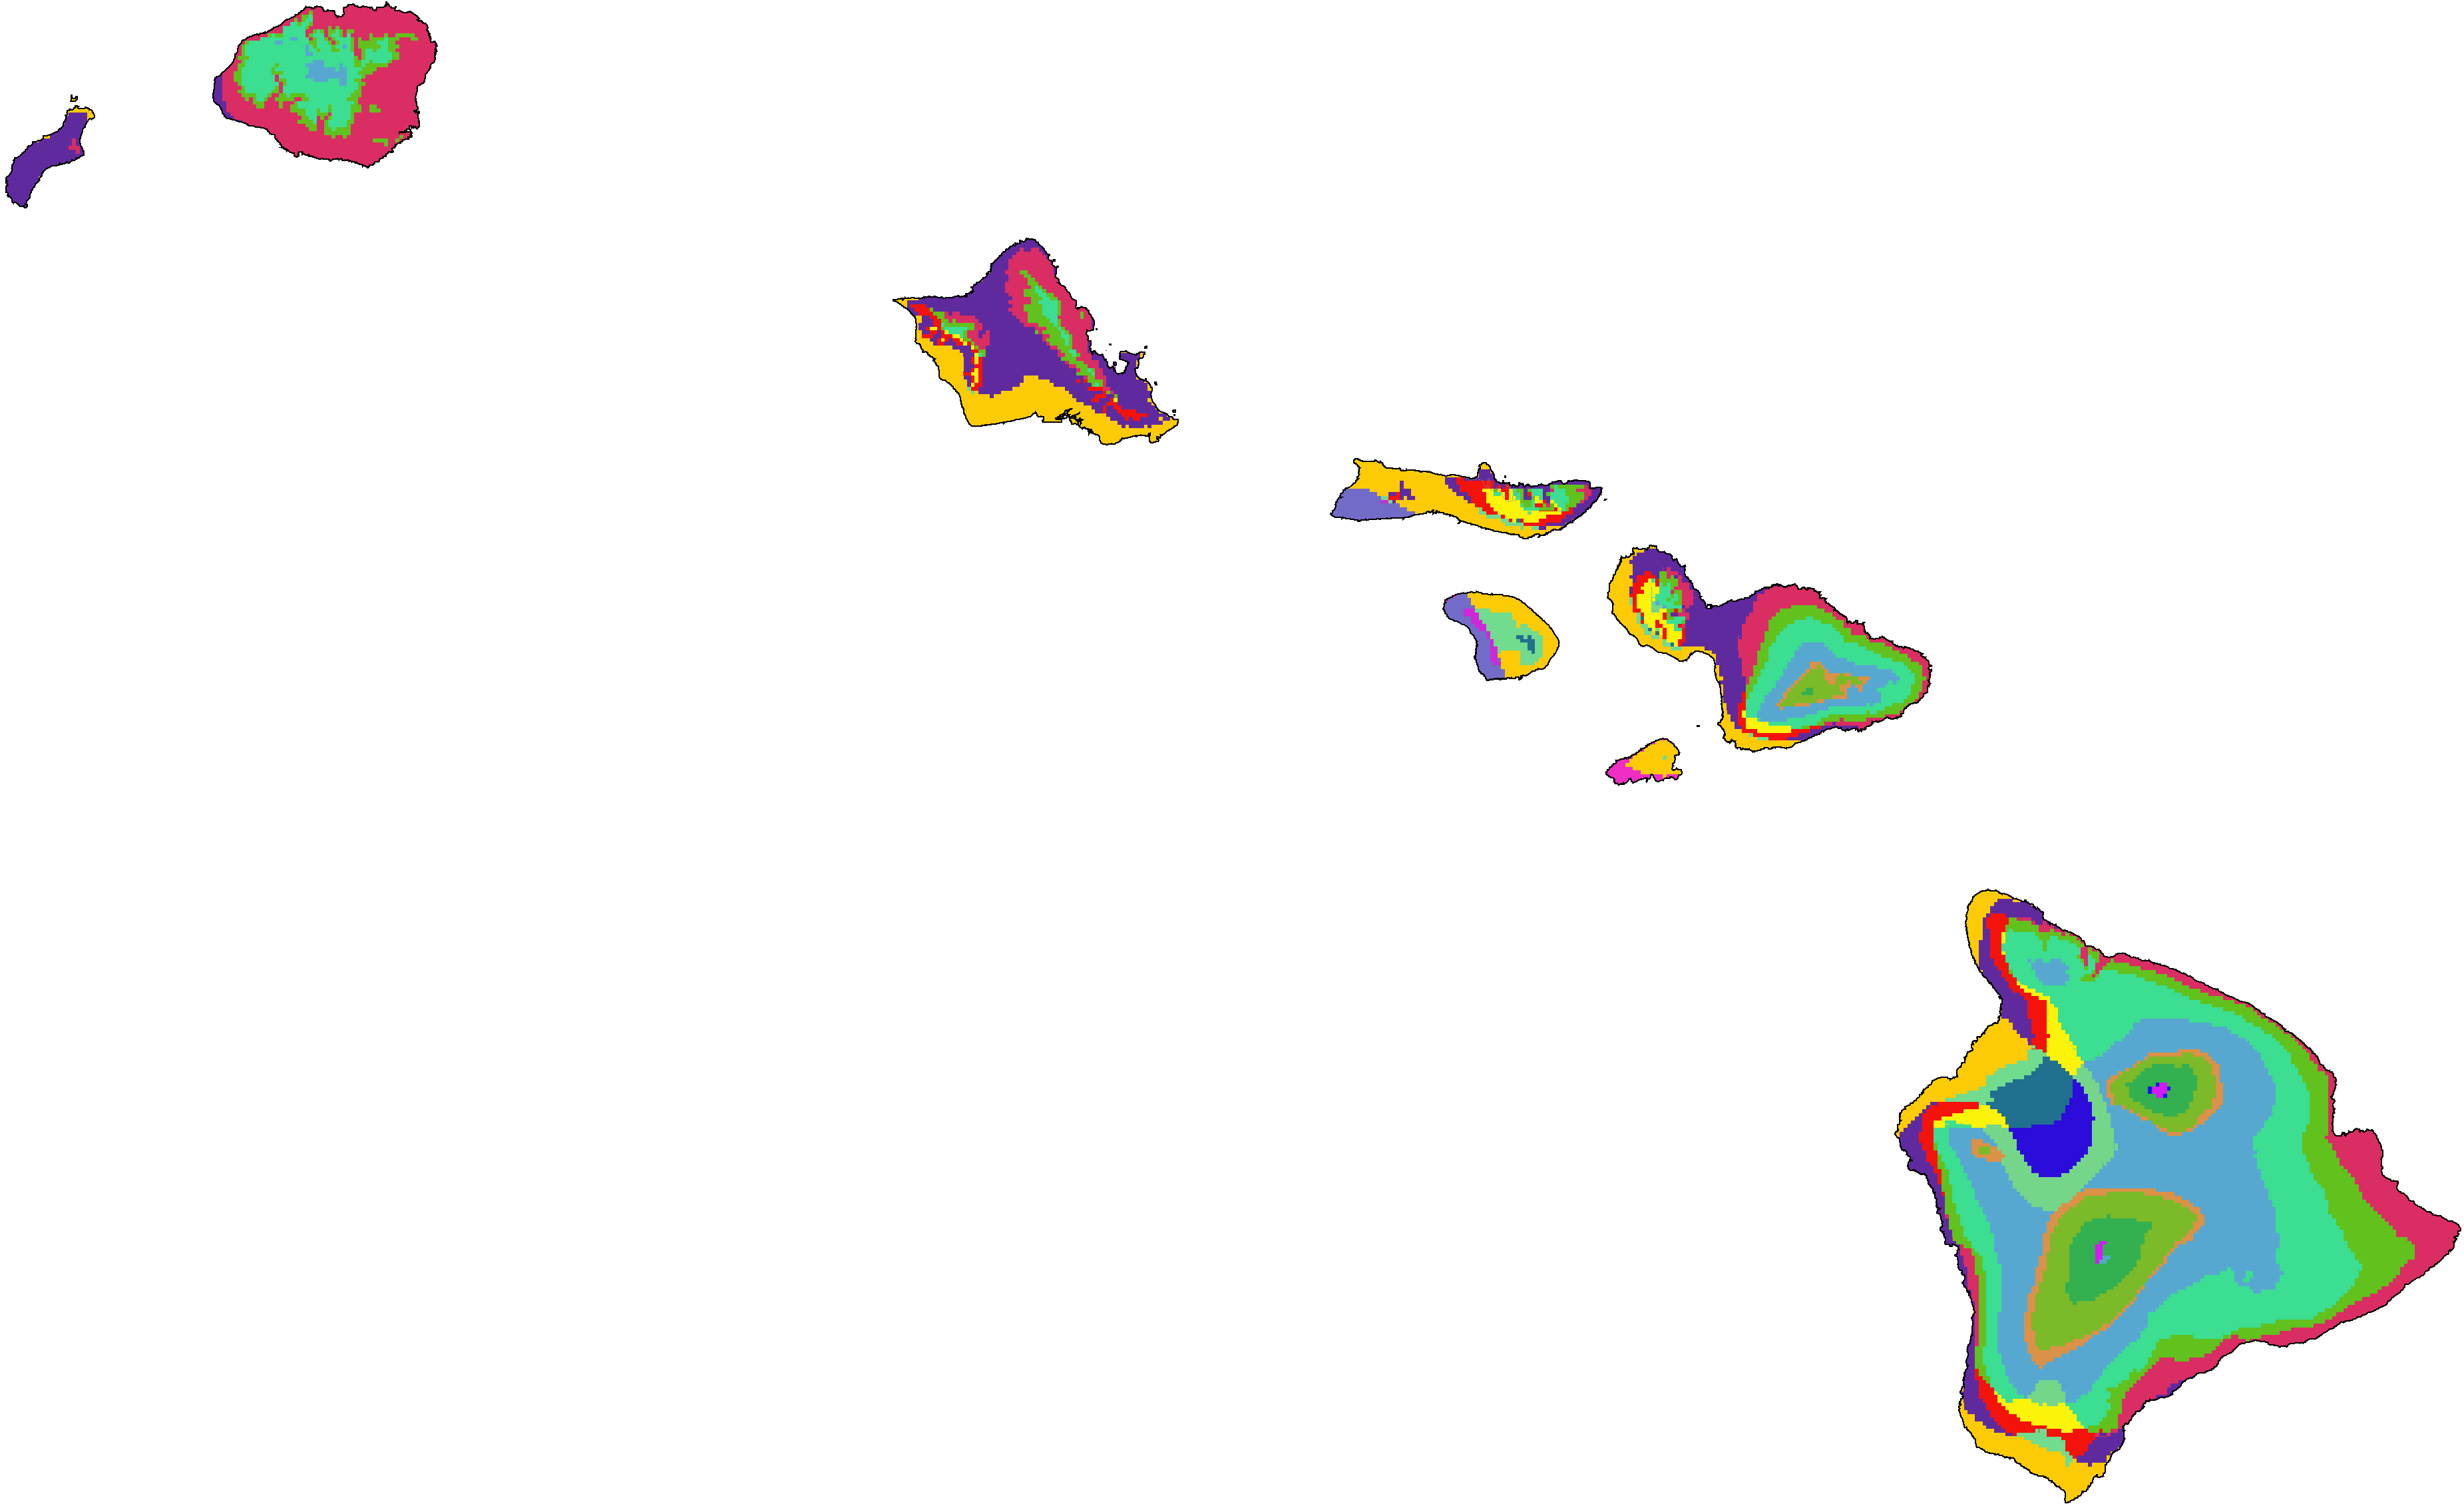
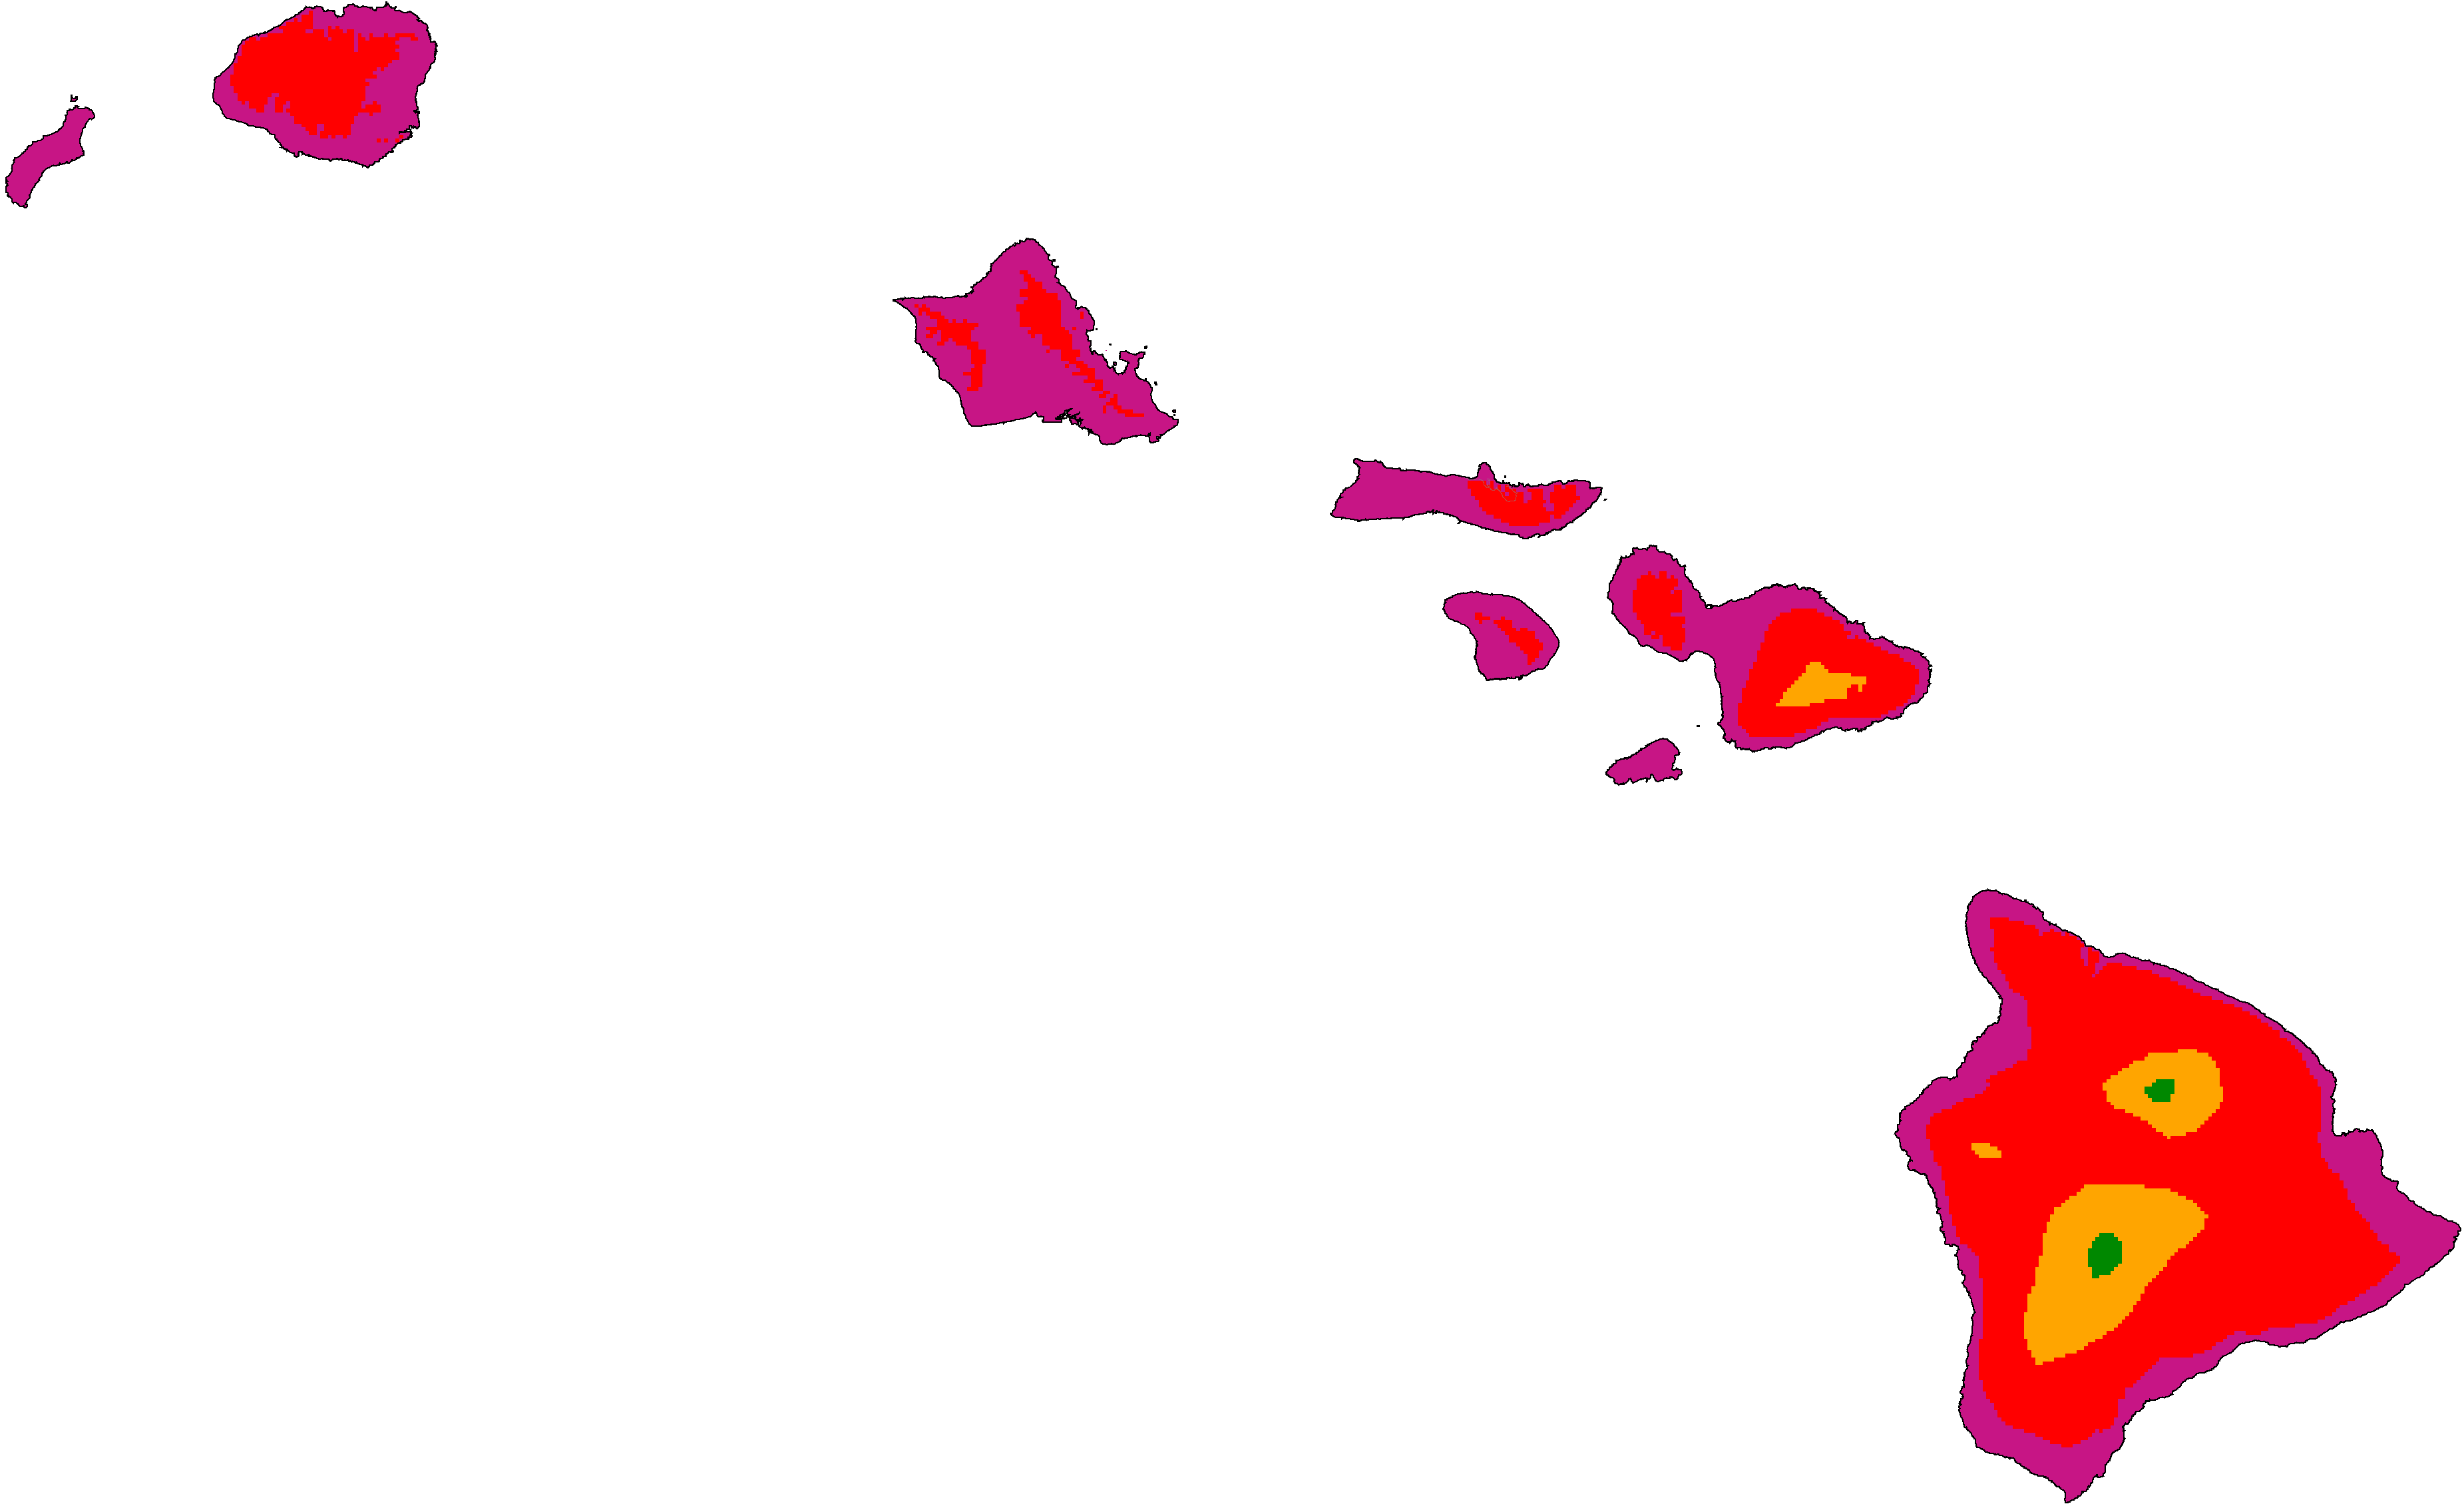
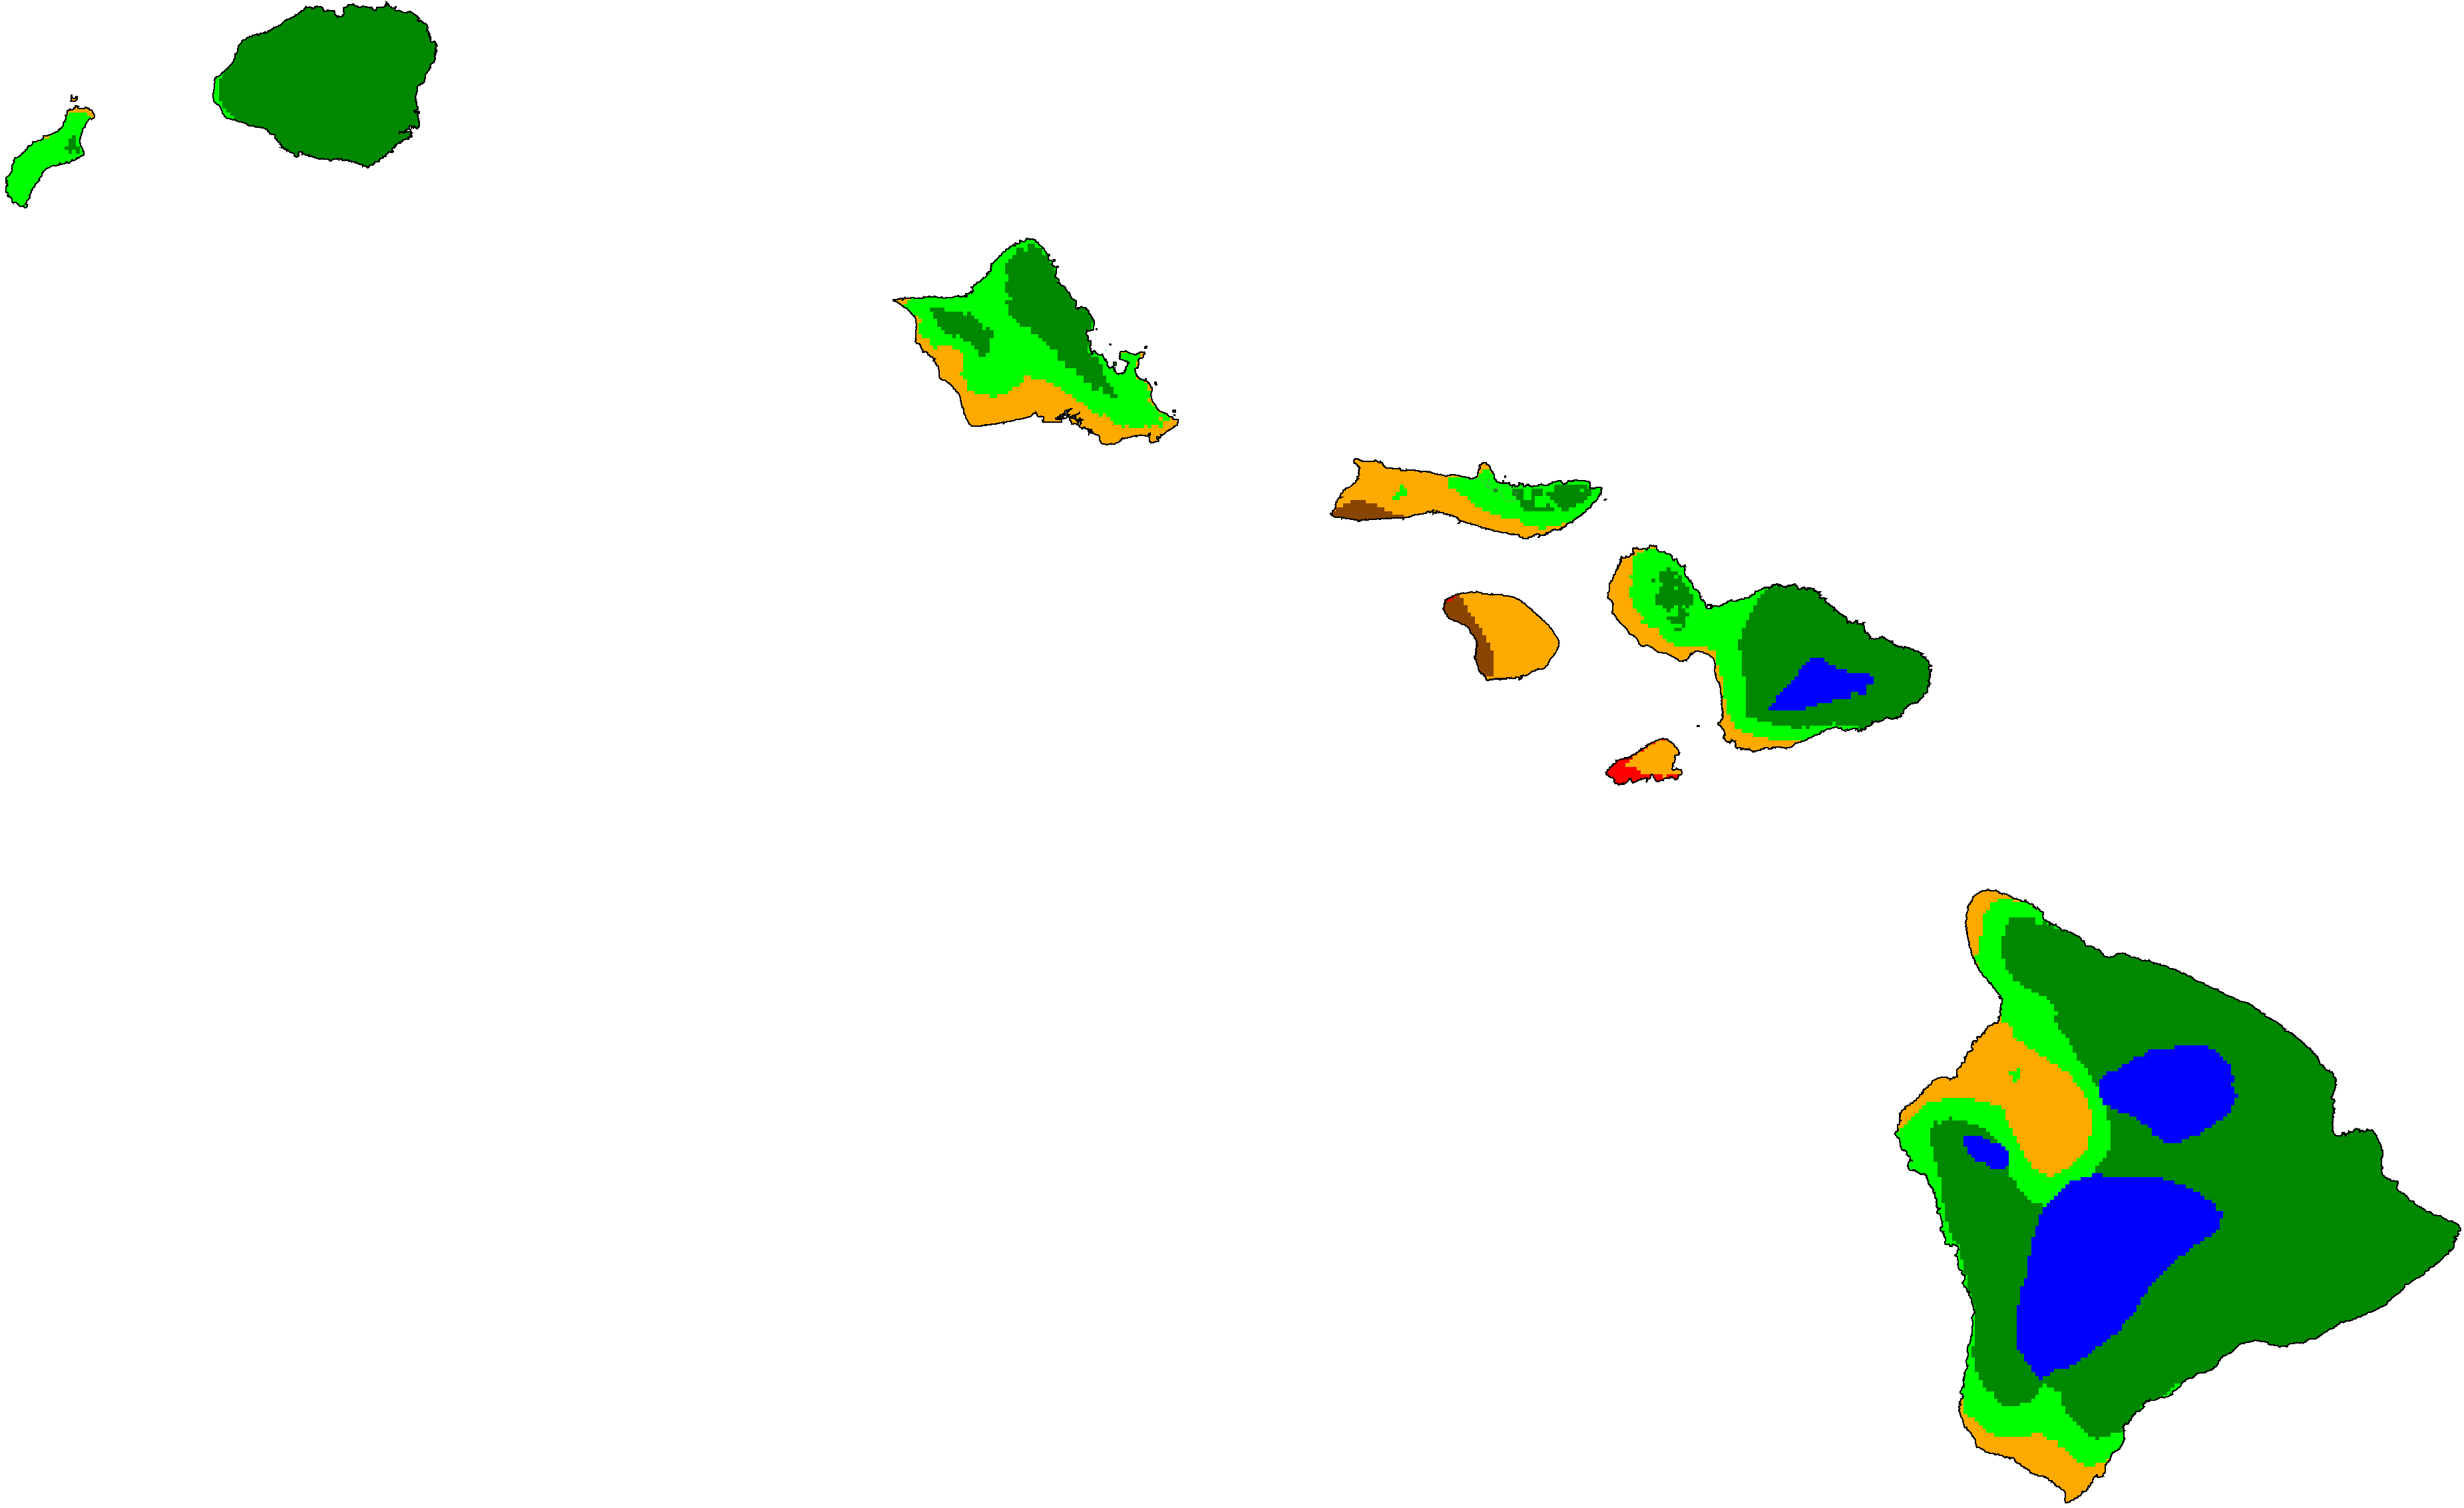
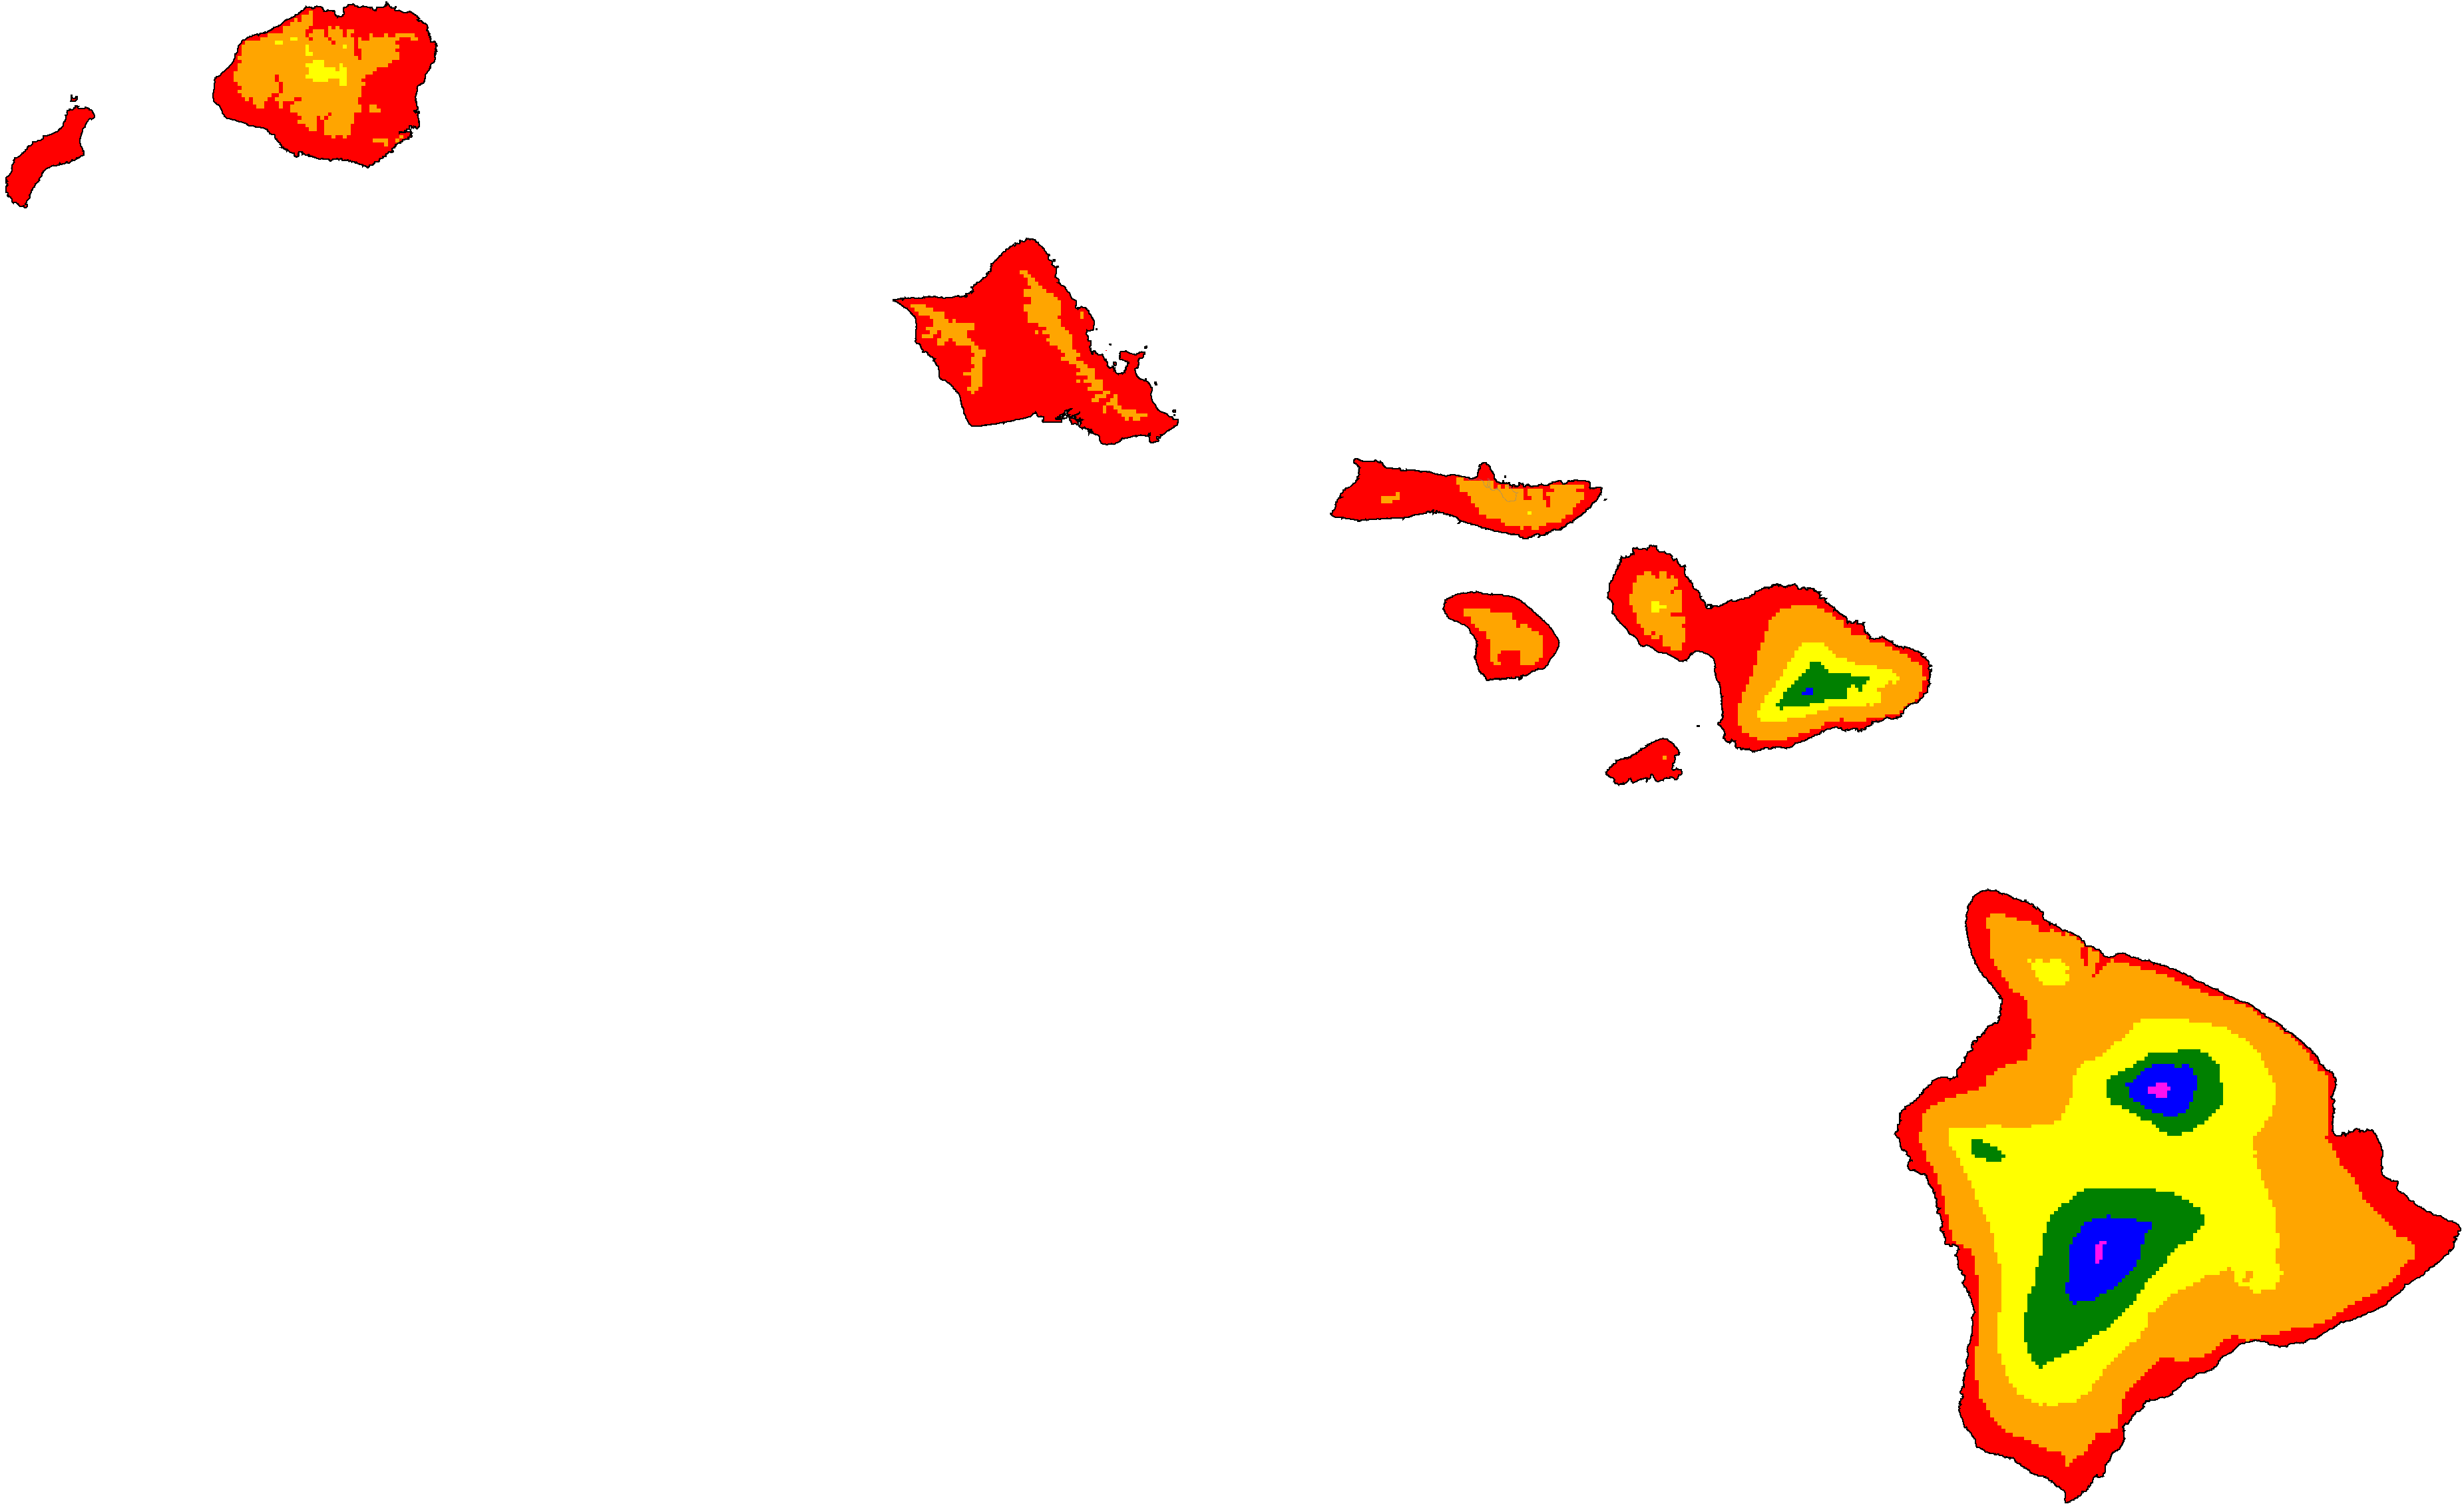
Hawaii distribution of classifications (projections are SSP5-8.5 high emissions normals)
Note: Due to the complexity of the system, only the most common climates in each map are labeled.
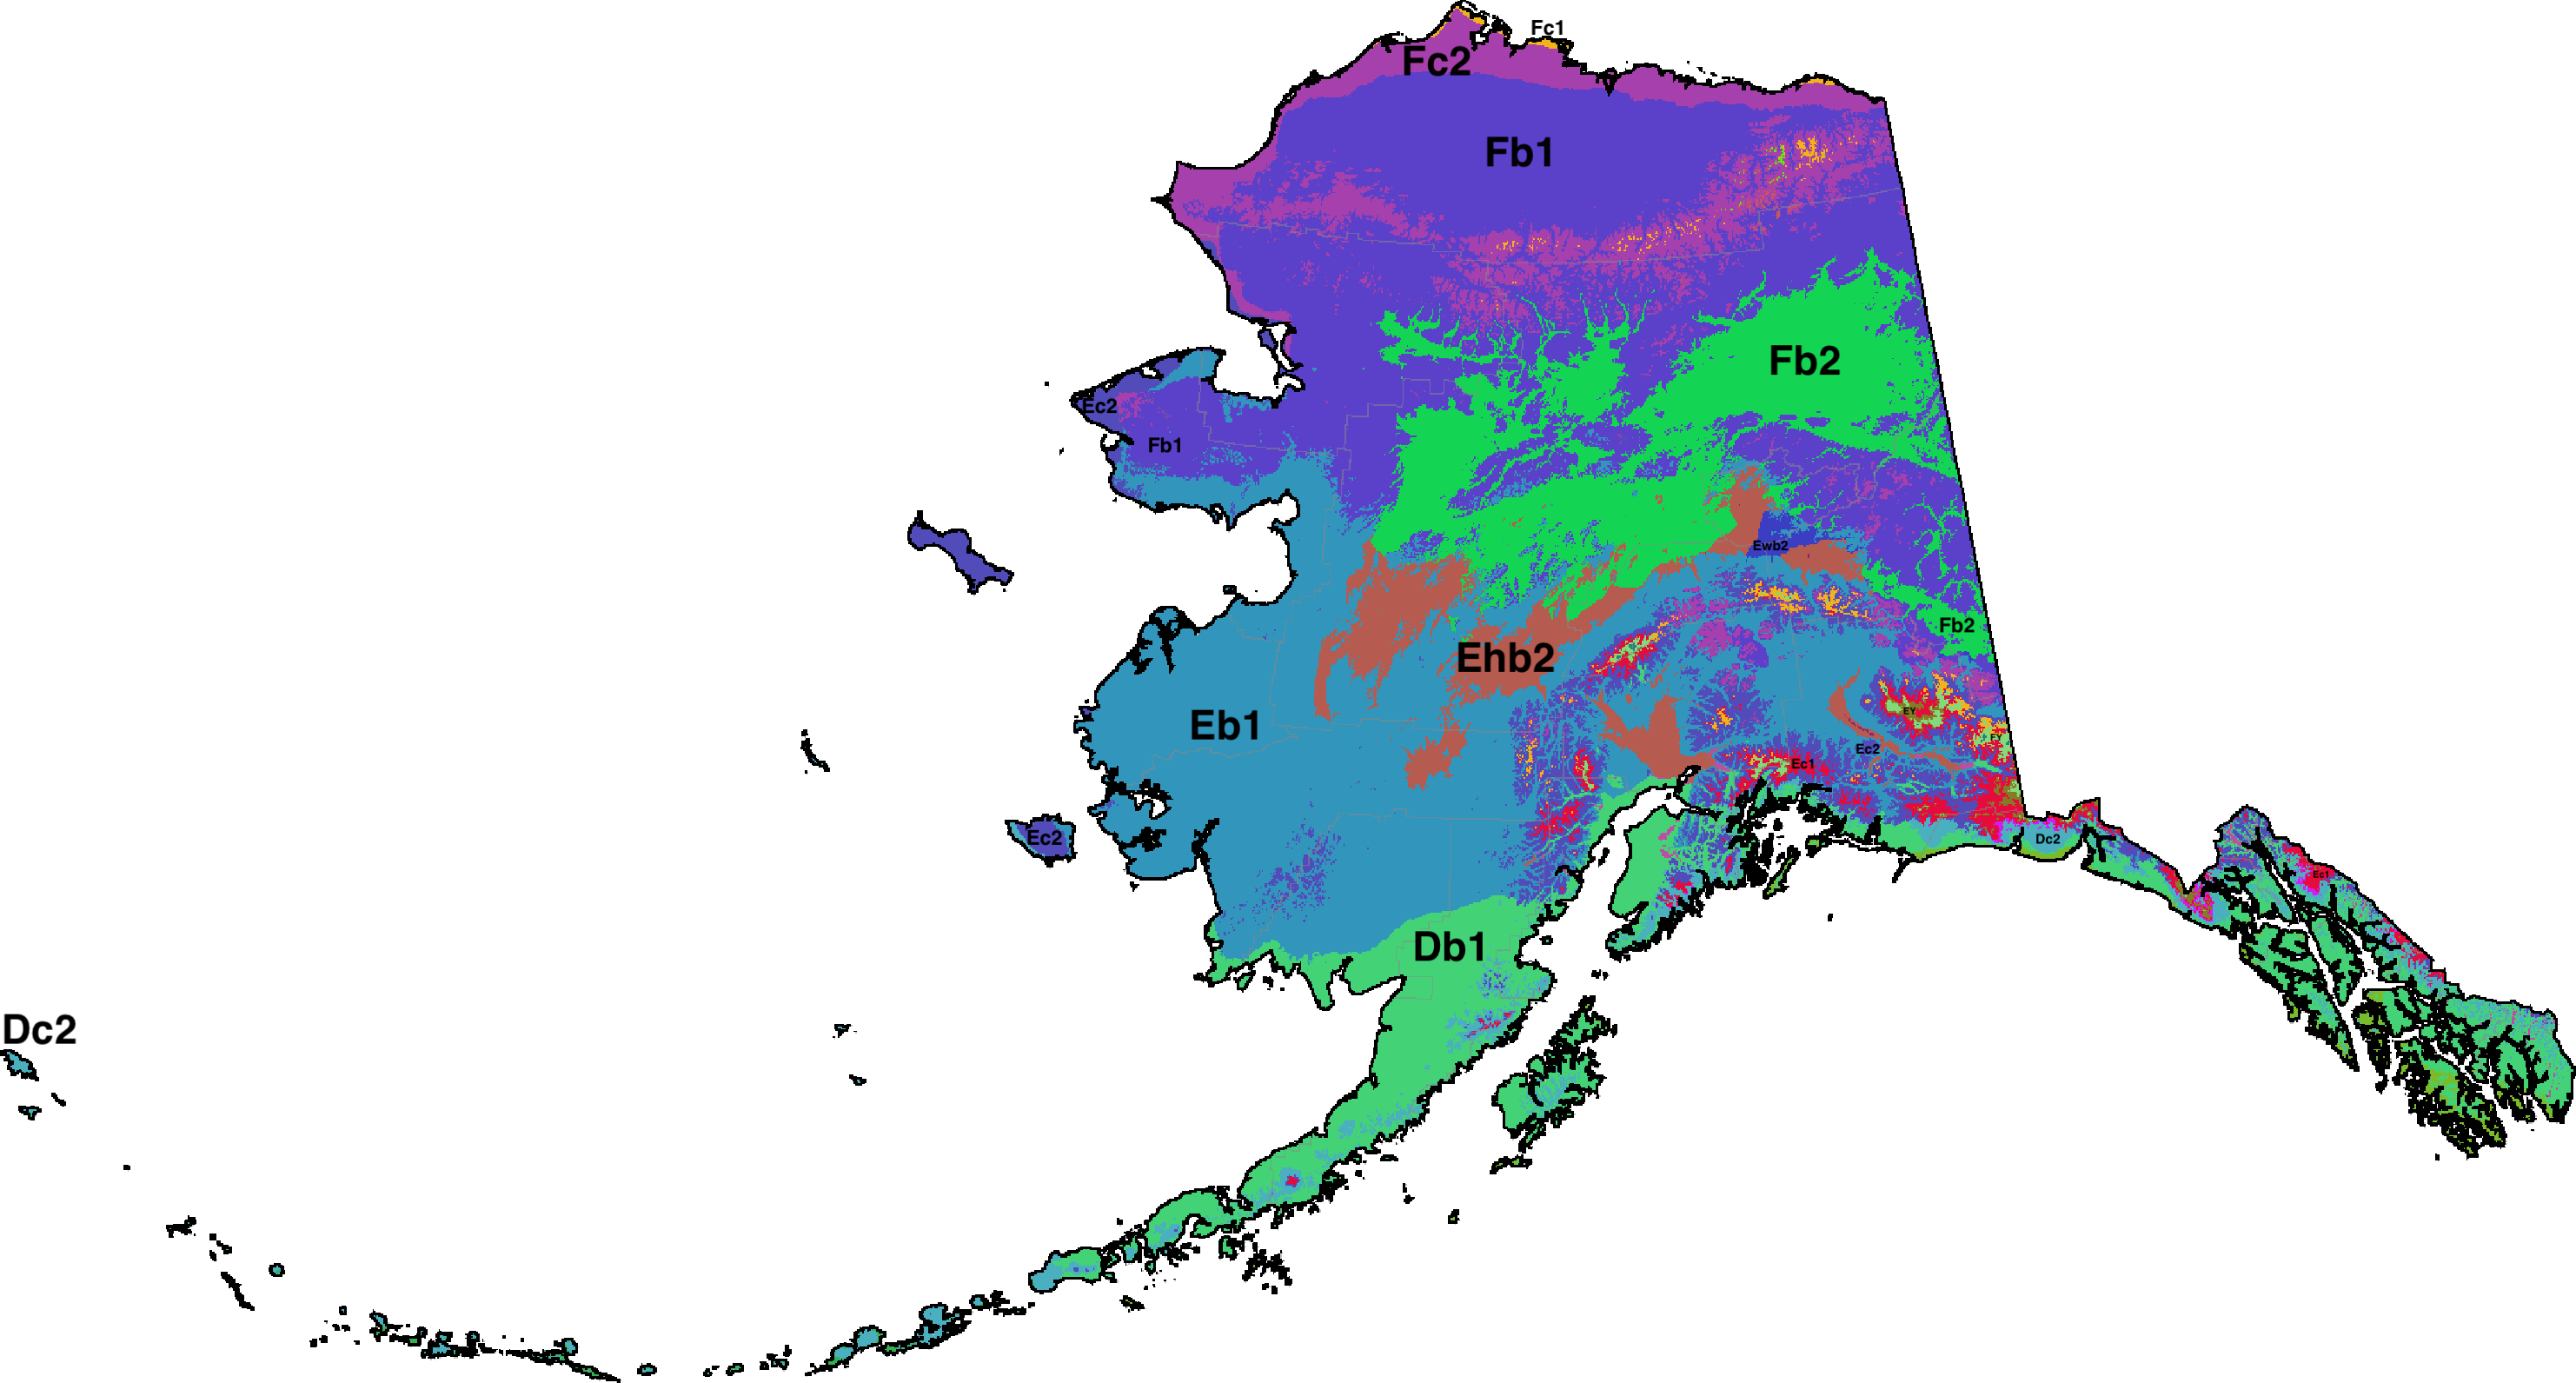
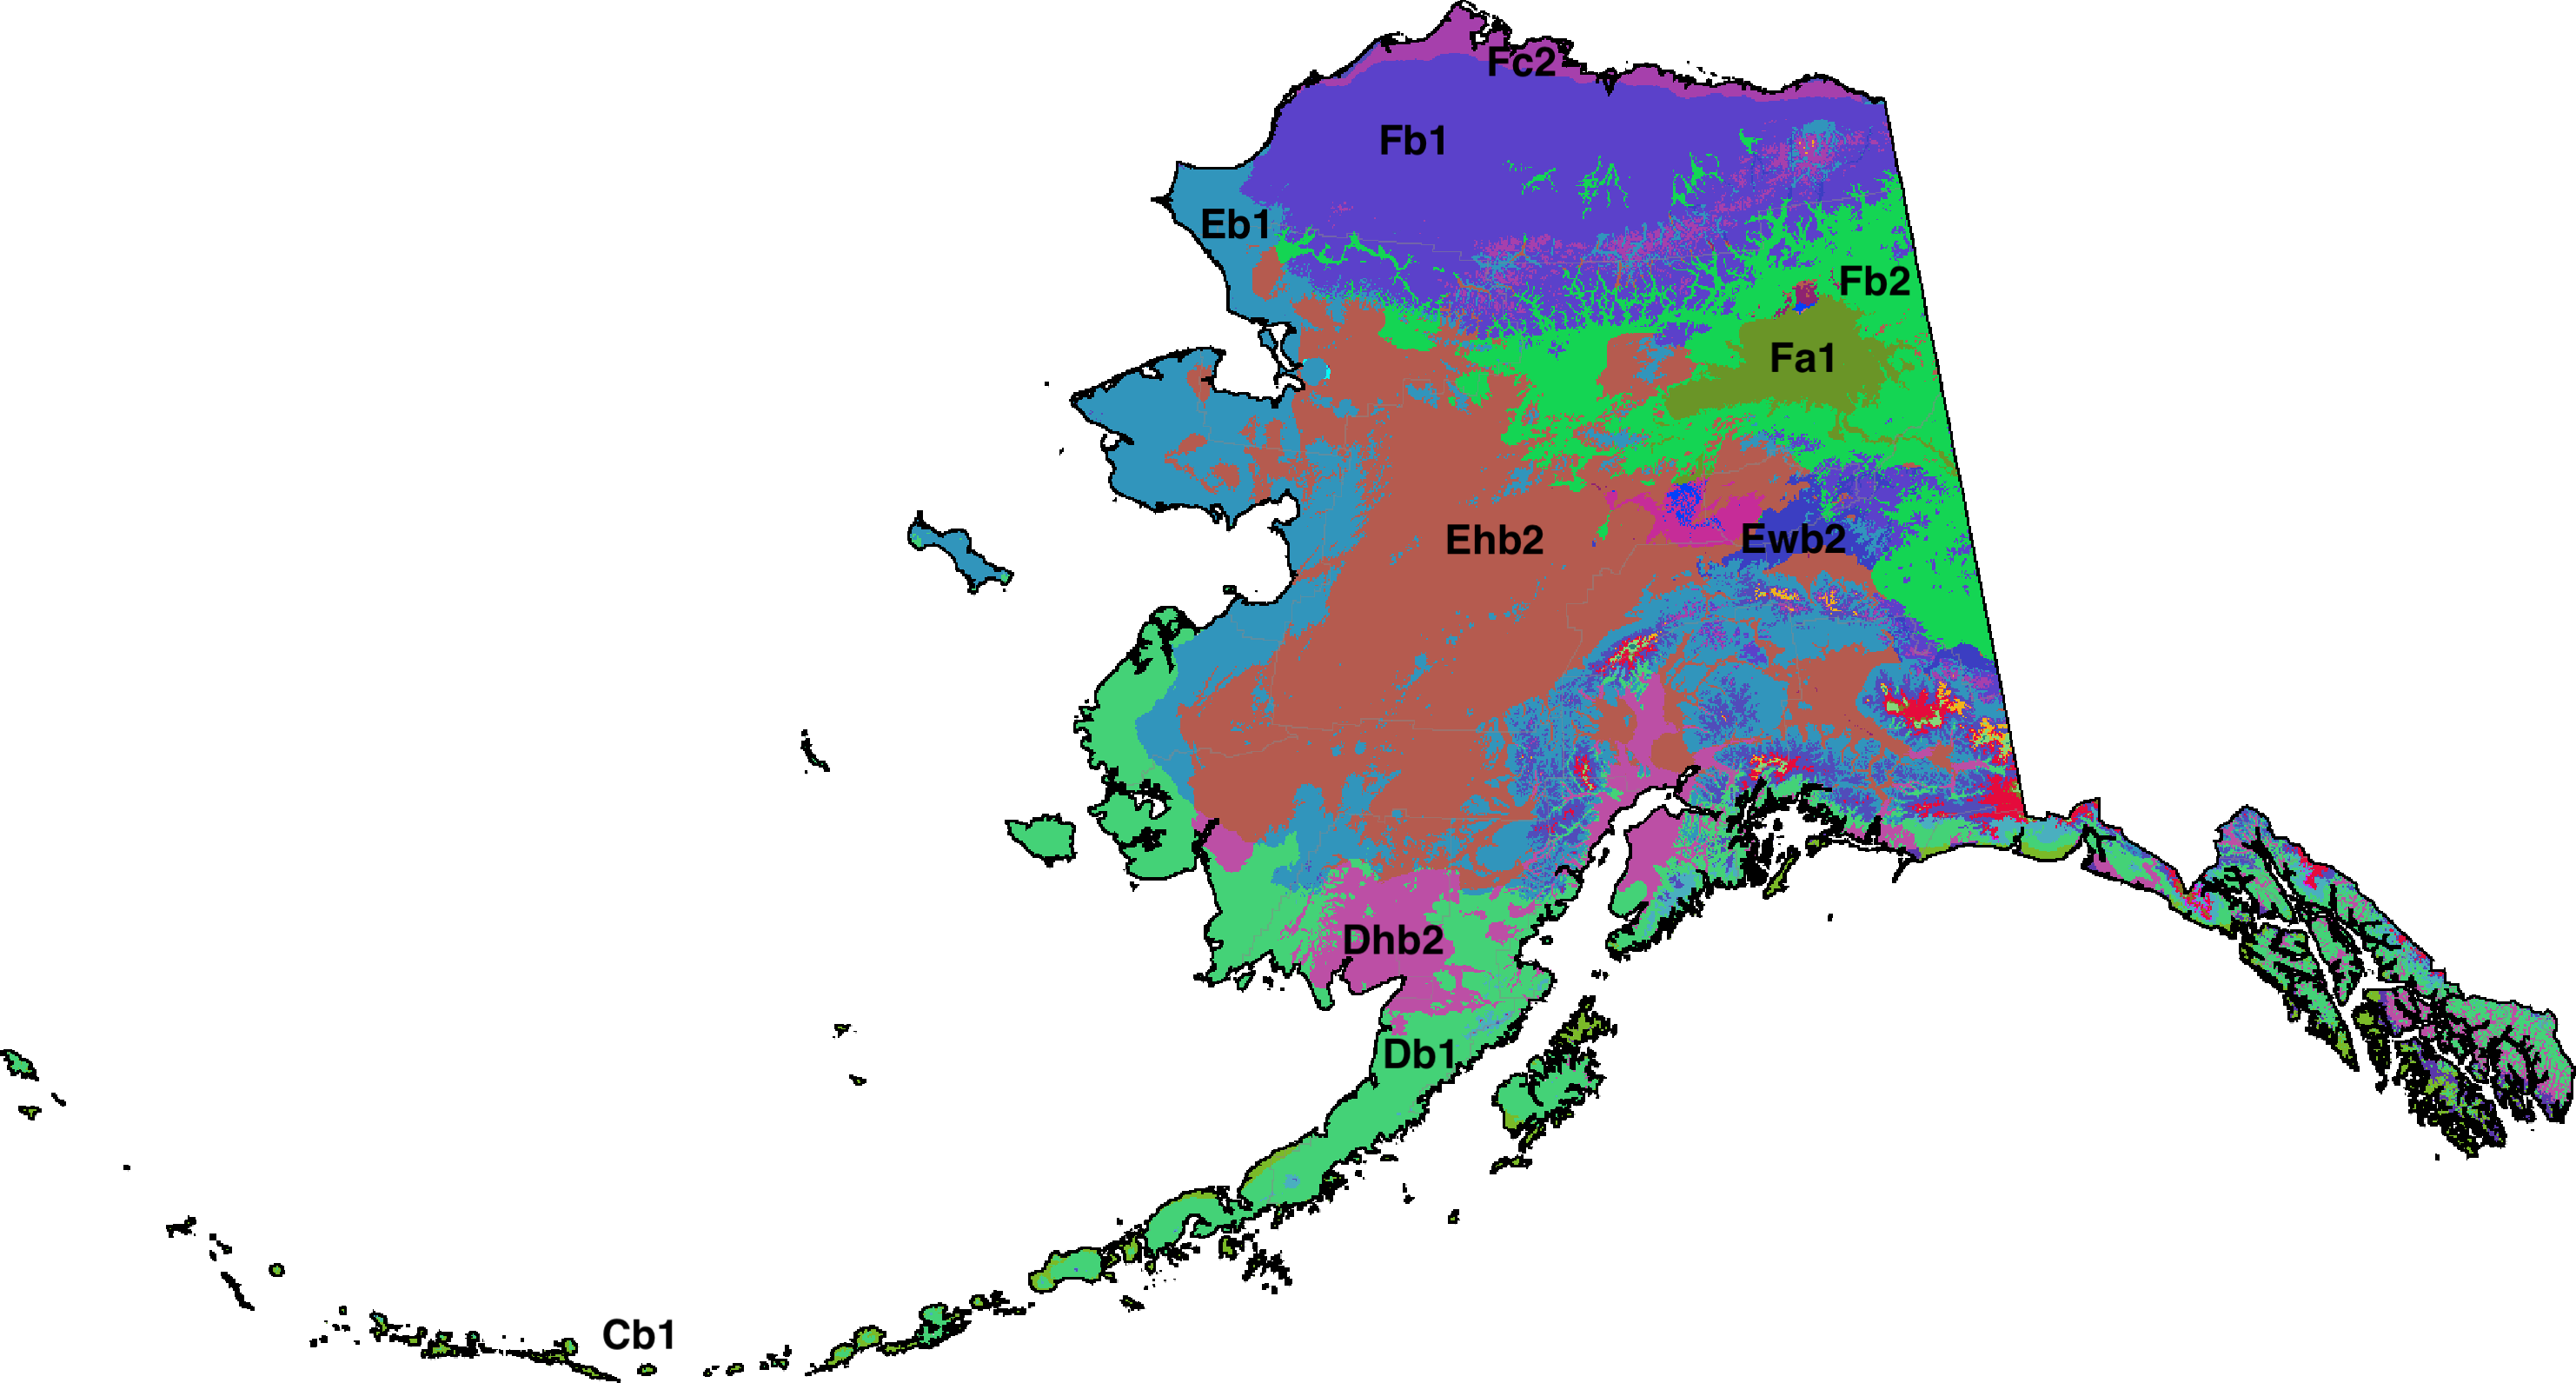
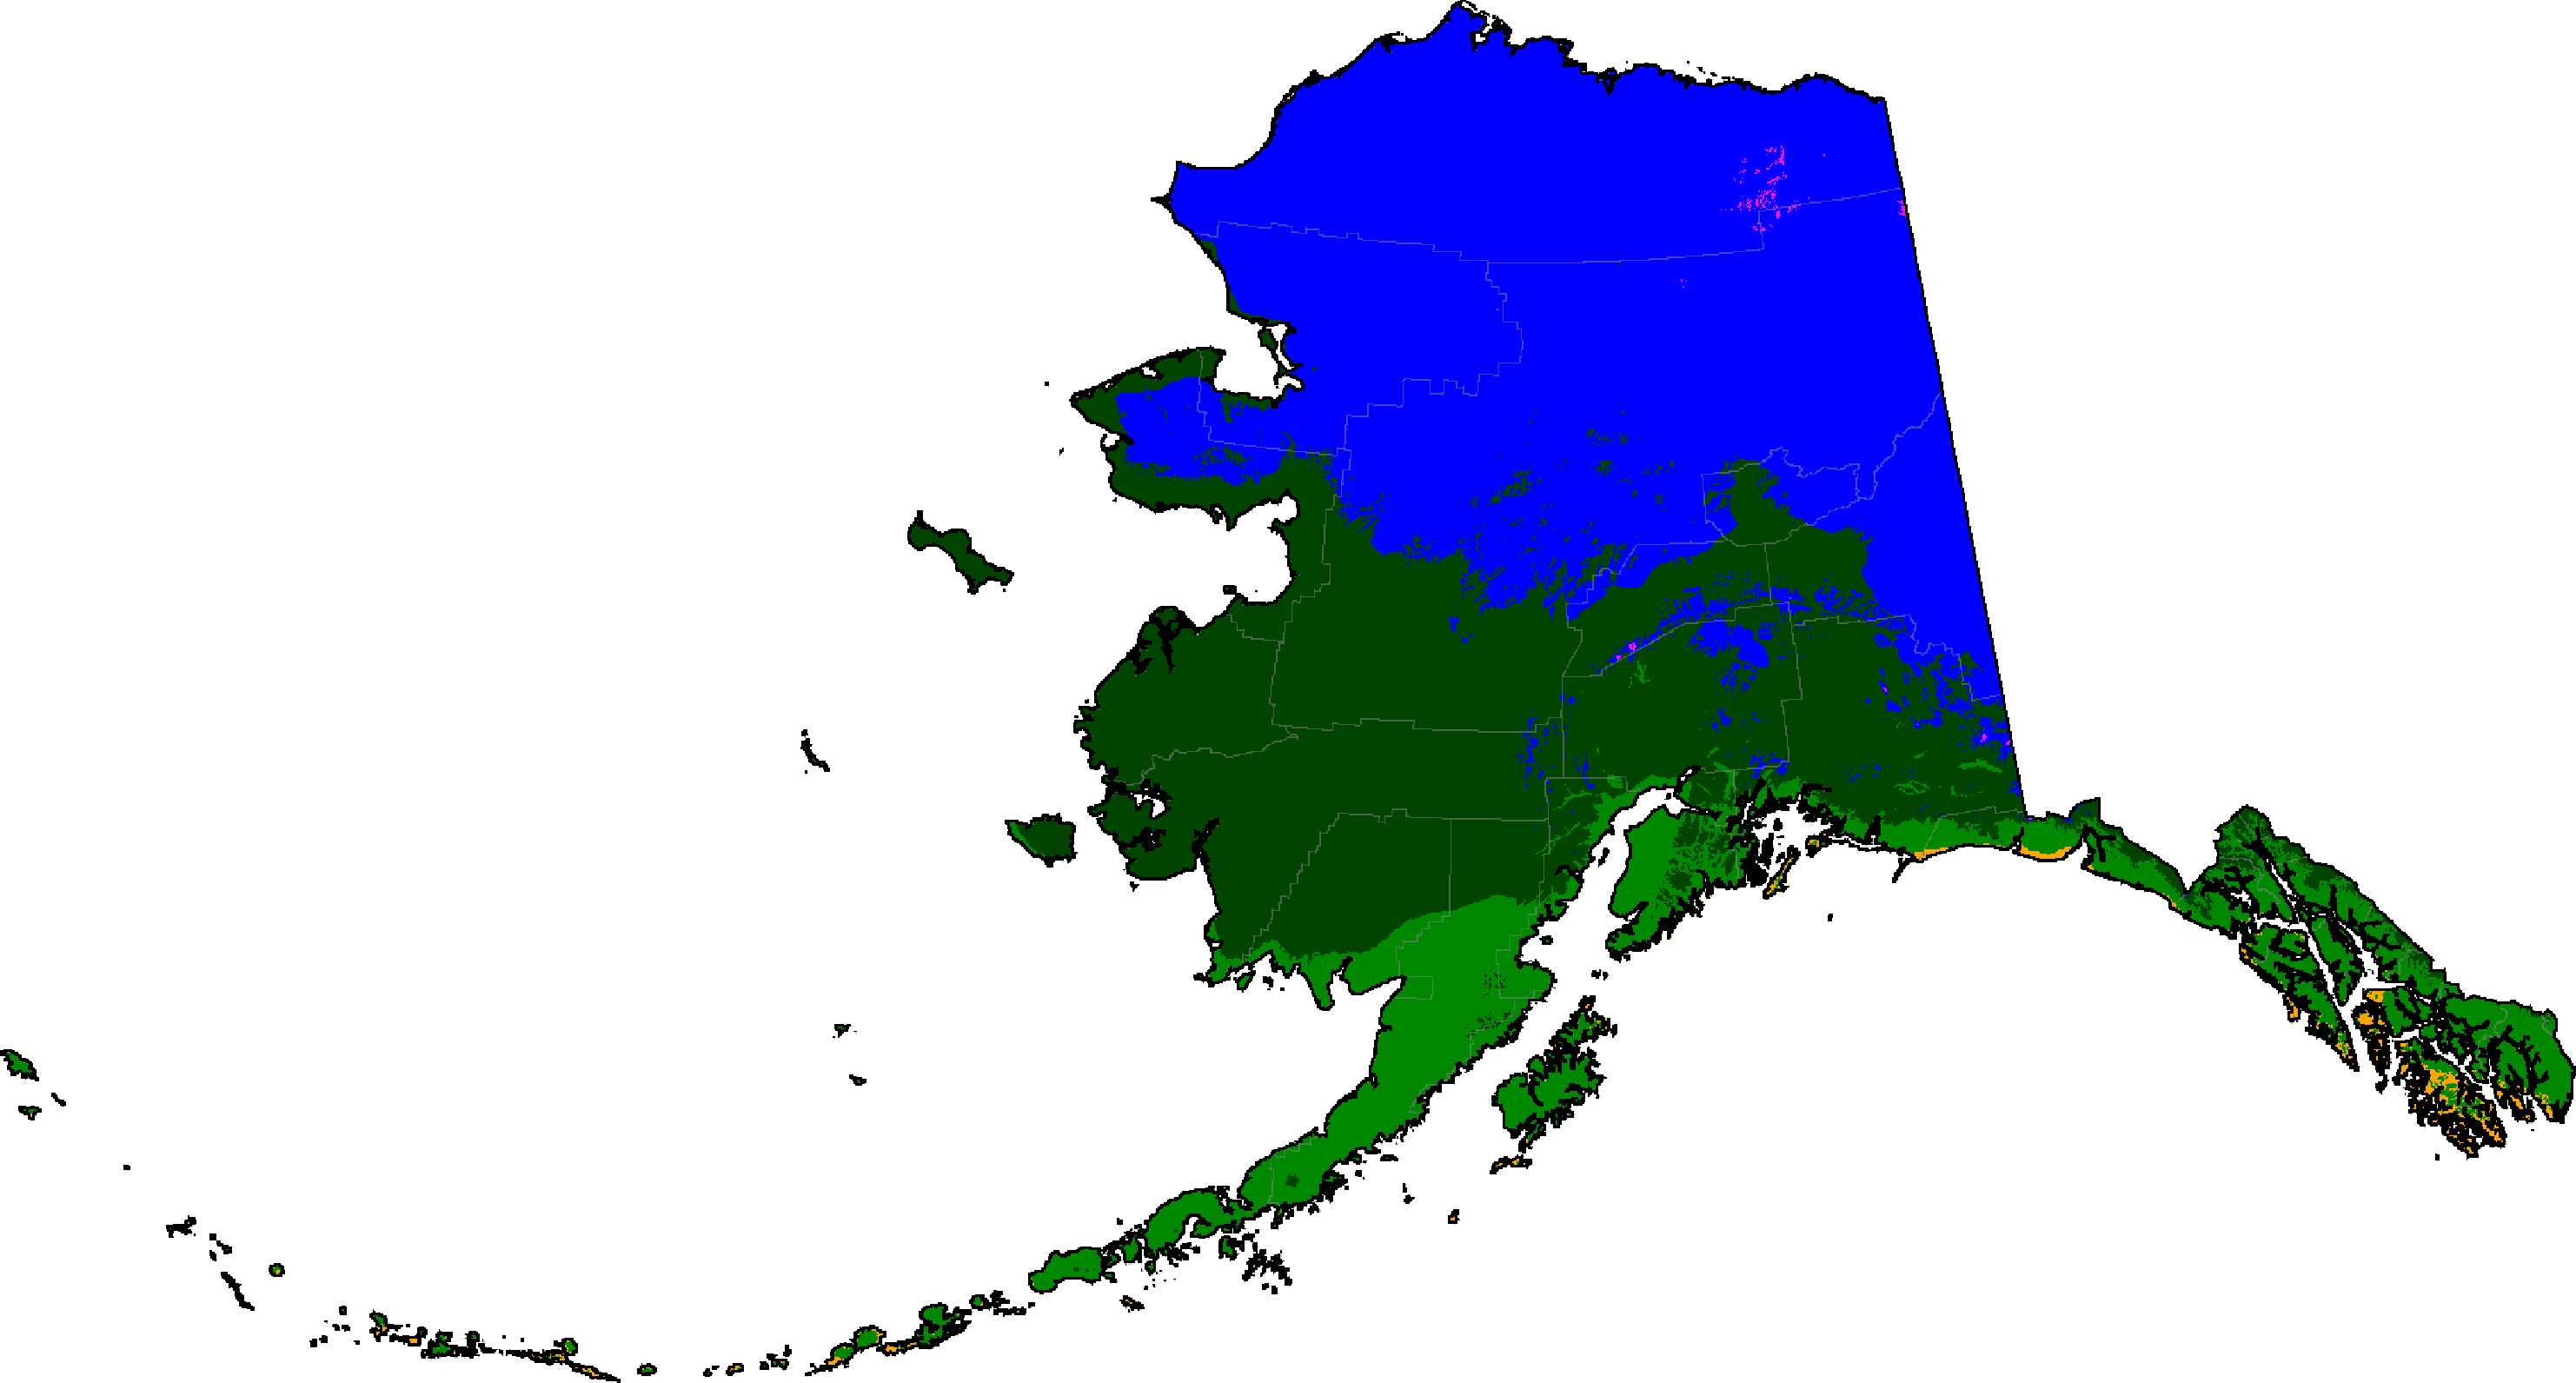
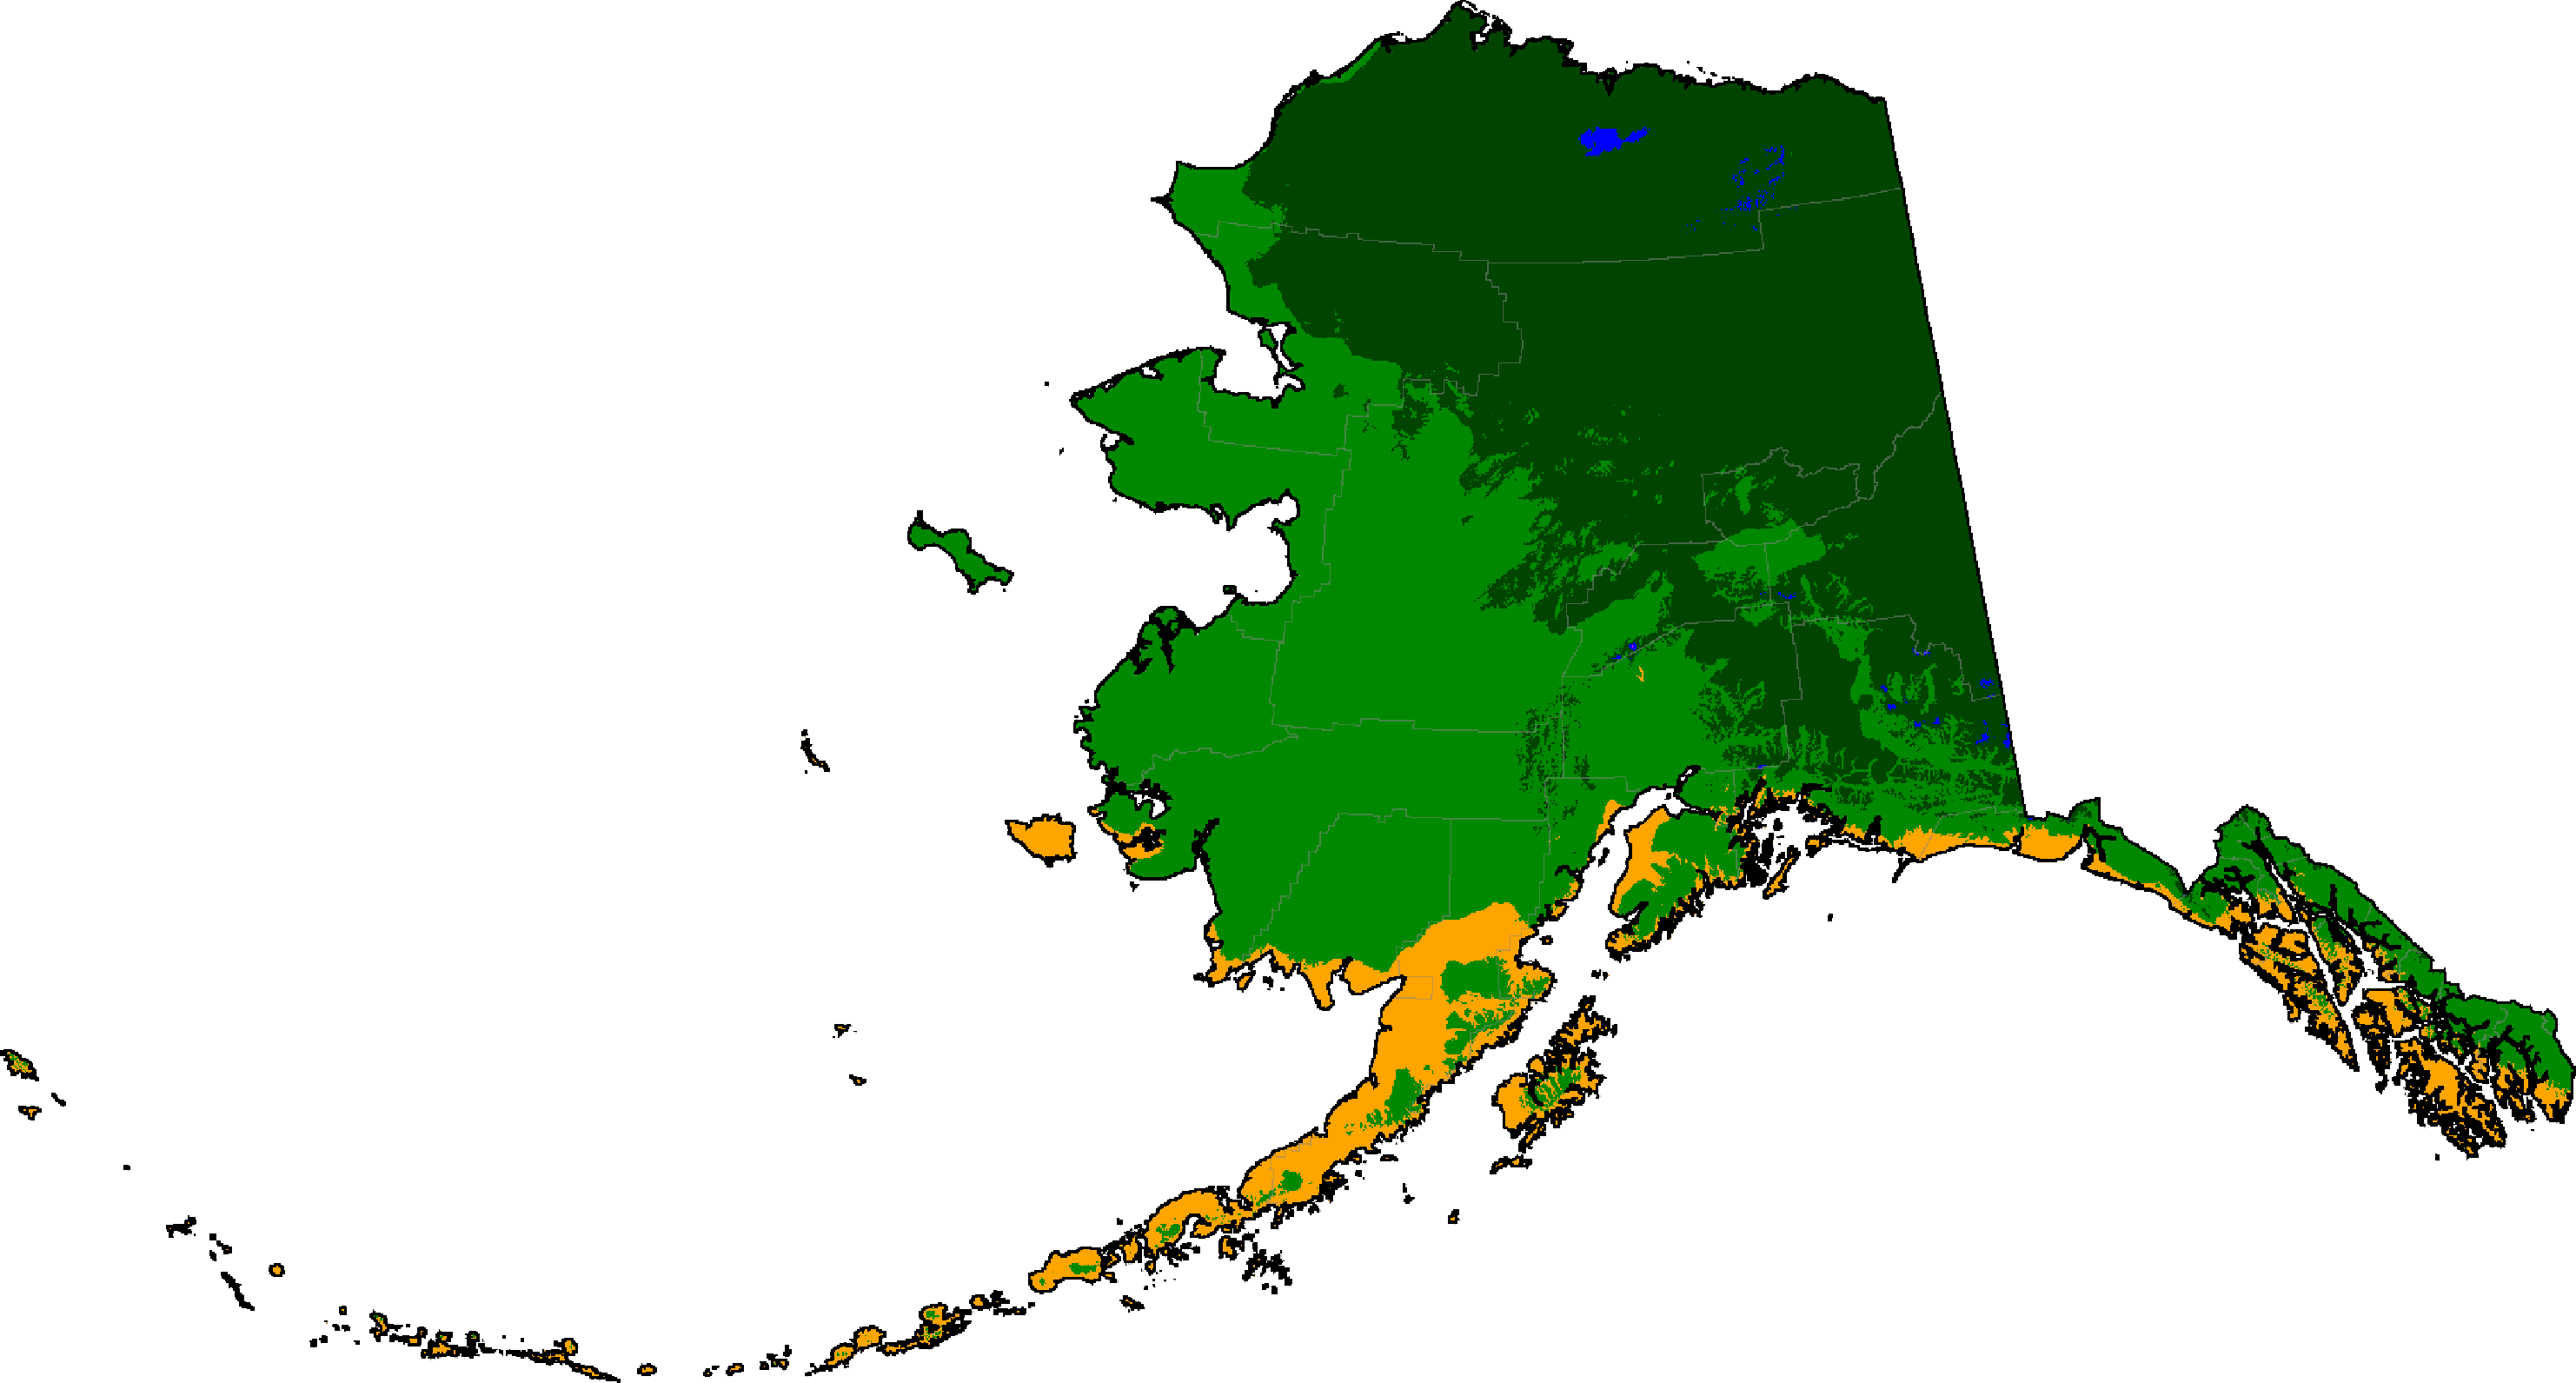
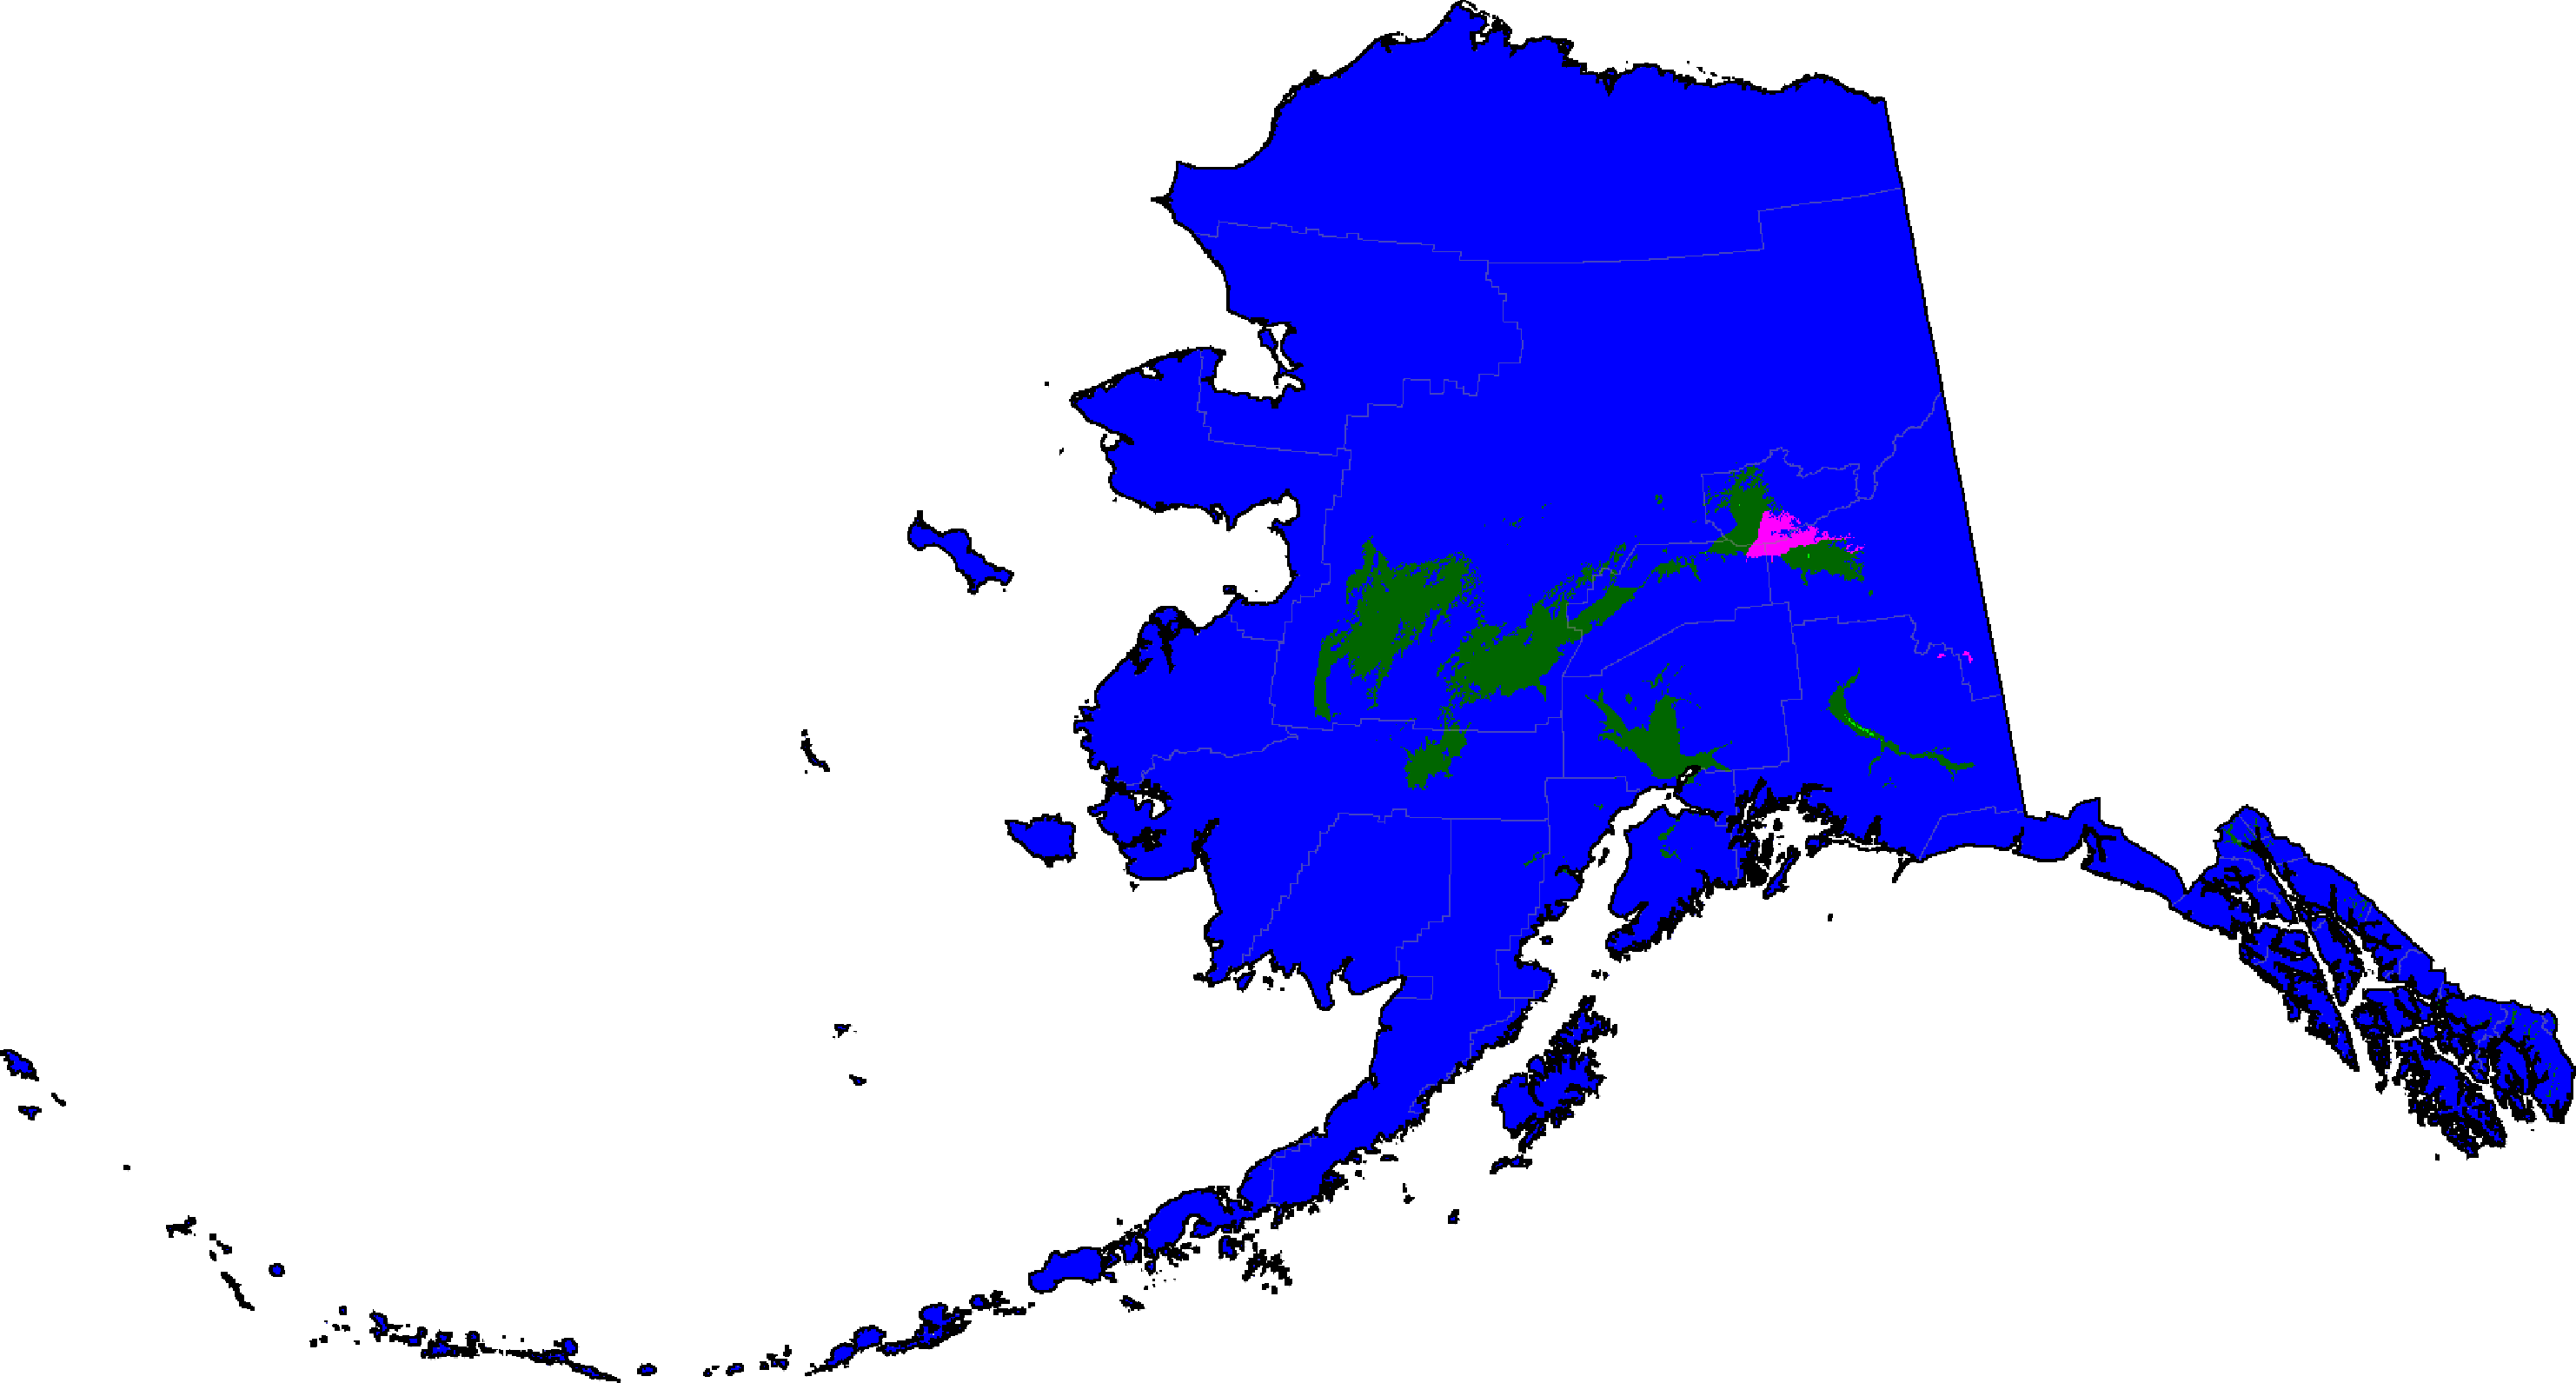
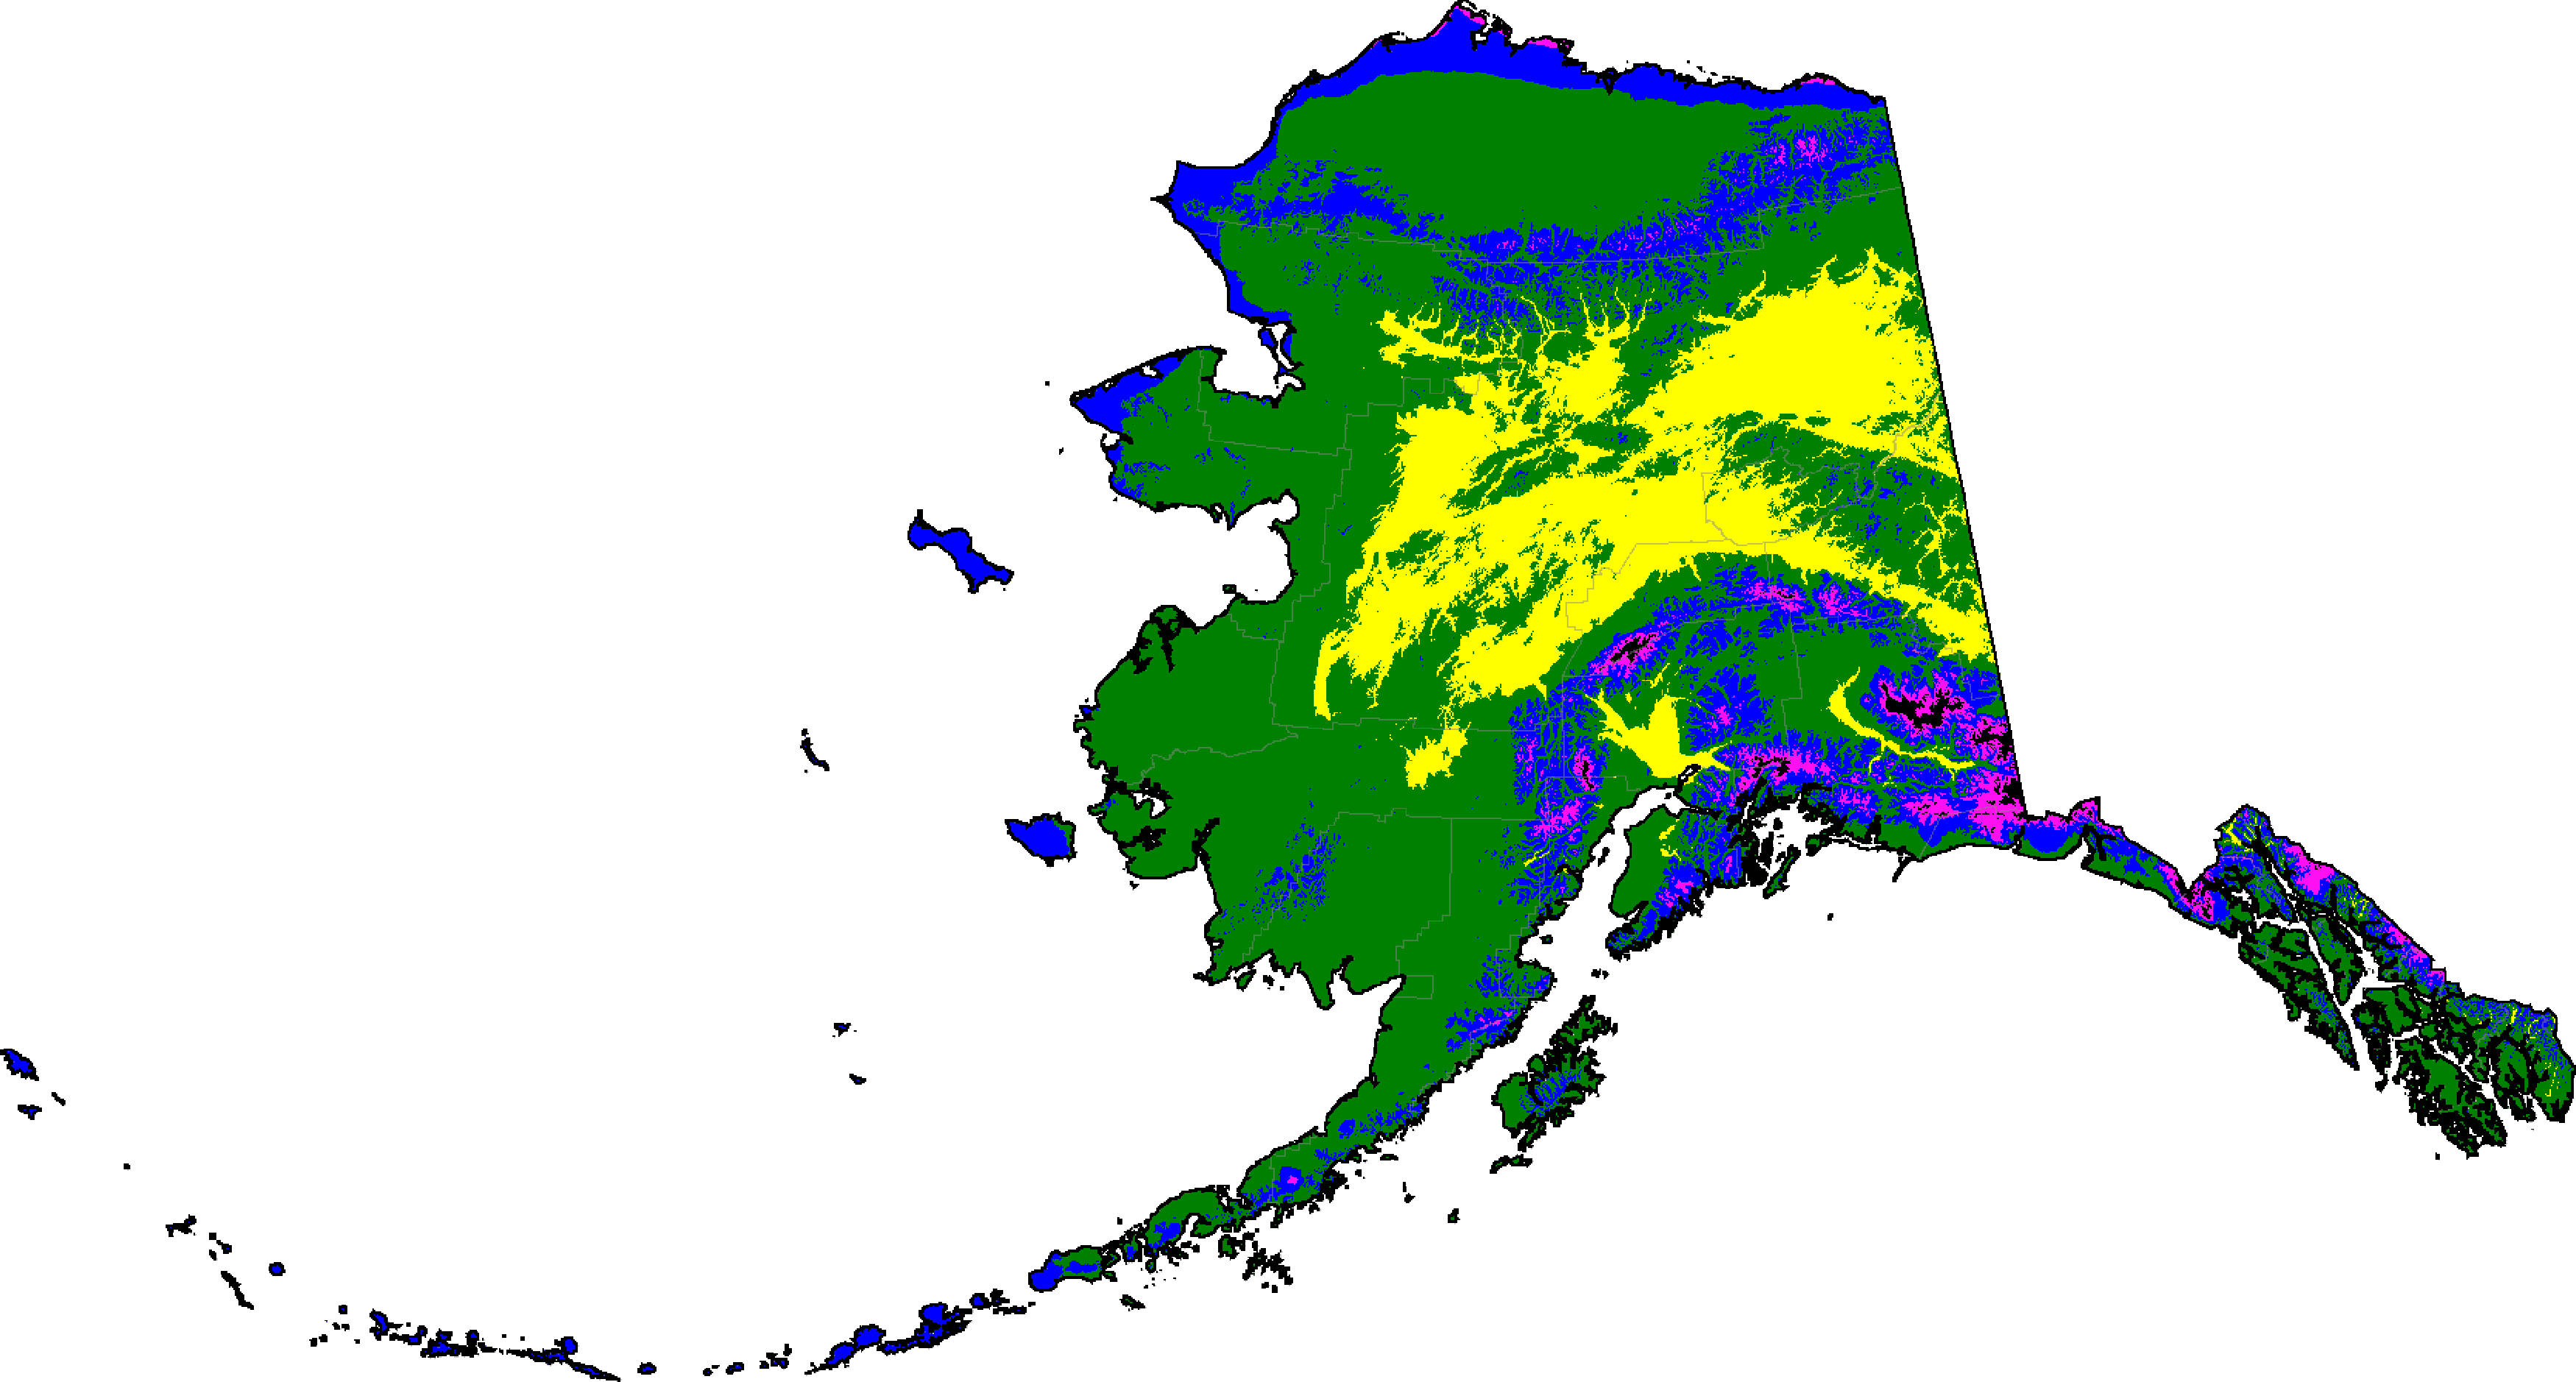
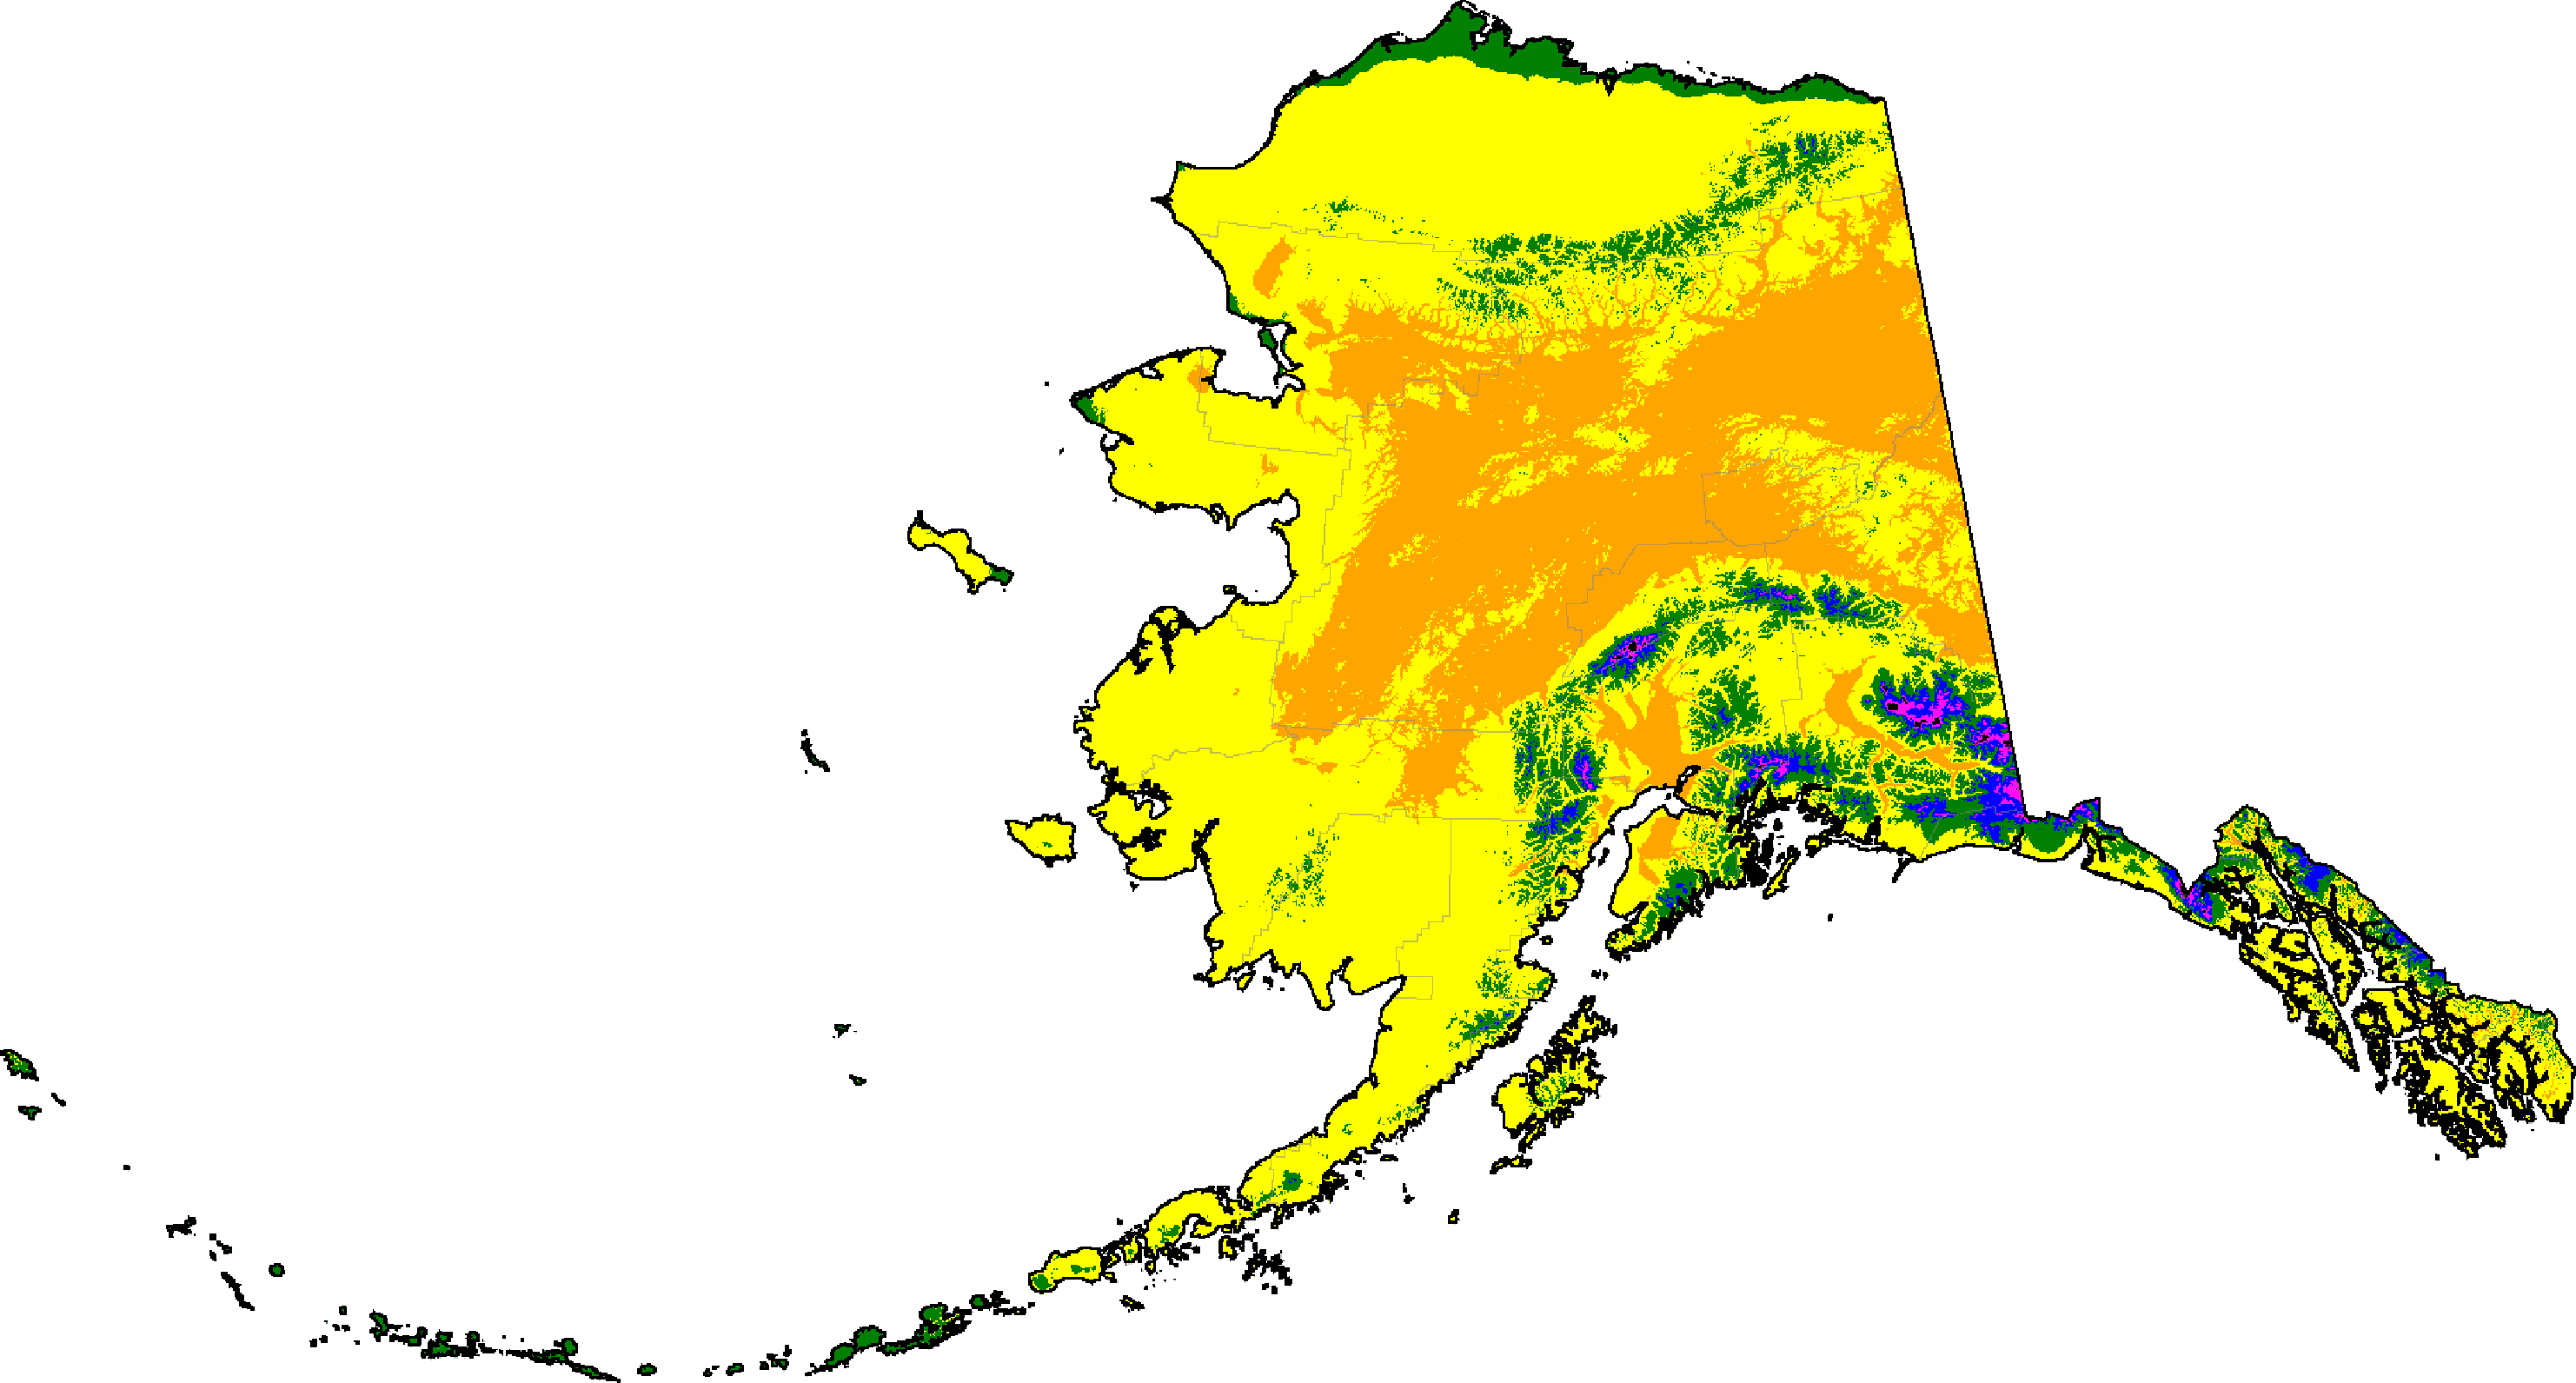
Alaska distribution of classifications (projections are SSP5-8.5 high emissions normals)
Note: Due to the complexity of the system, only the most common climates in each map are labeled.
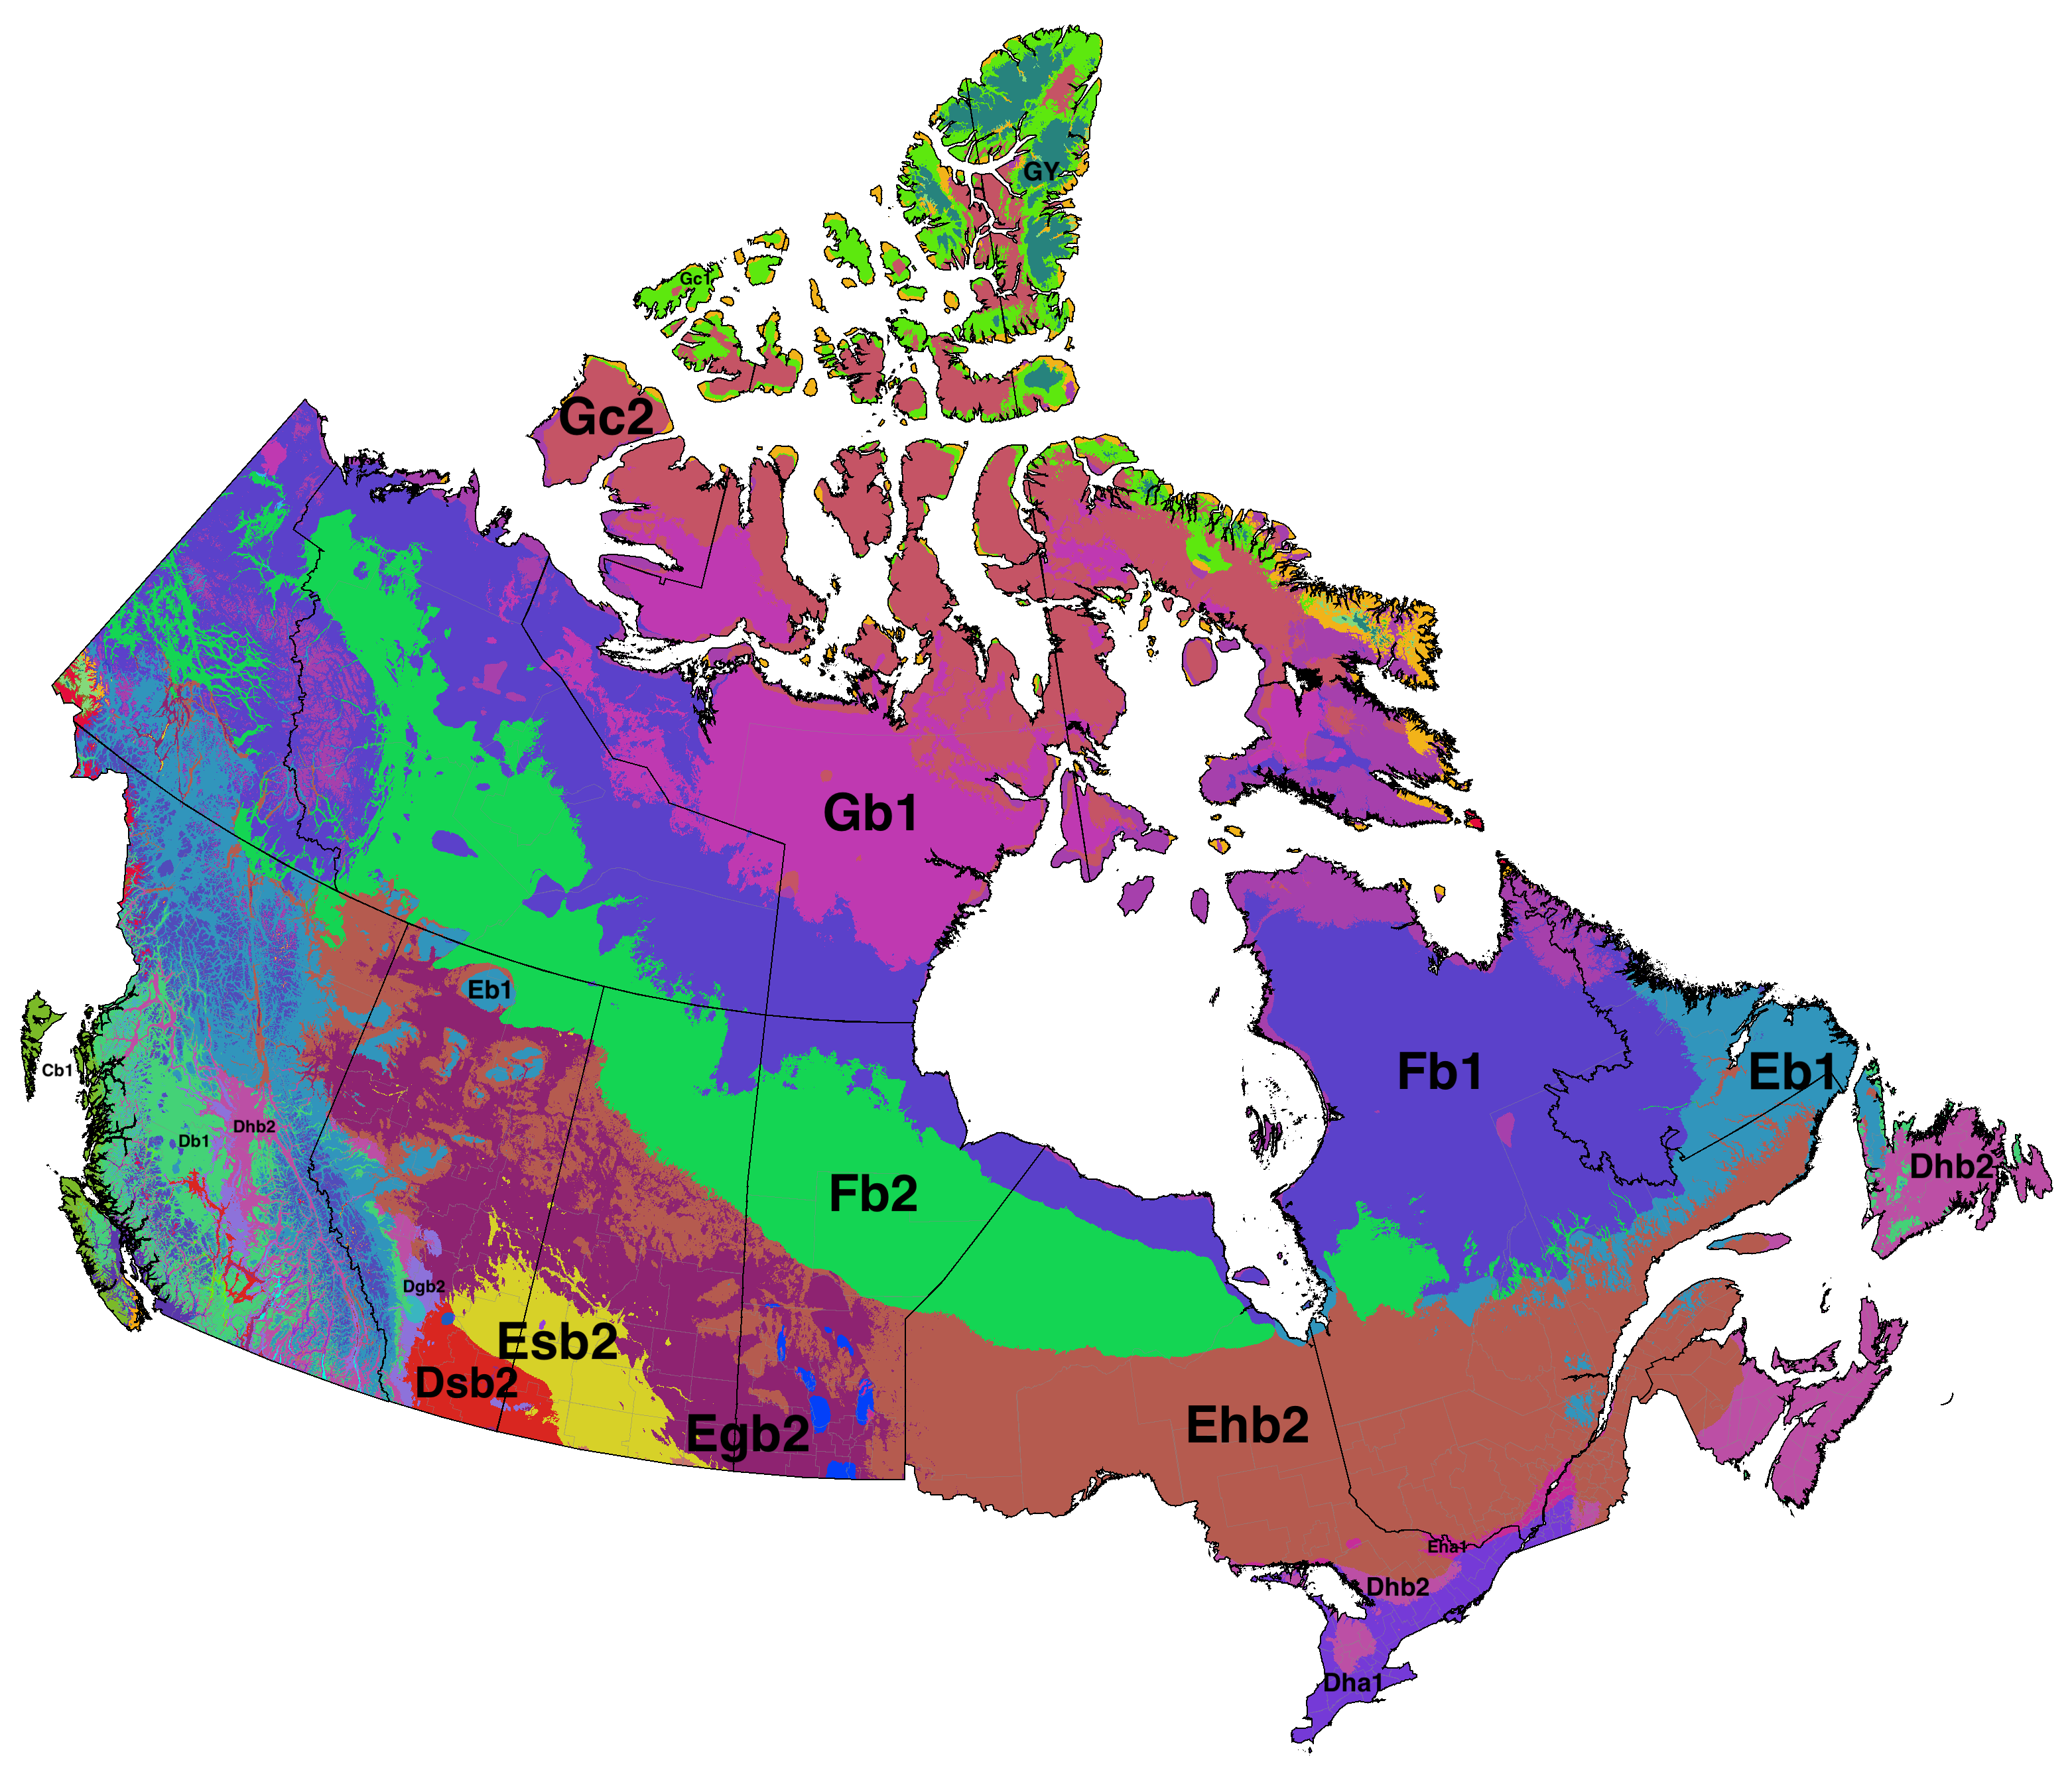
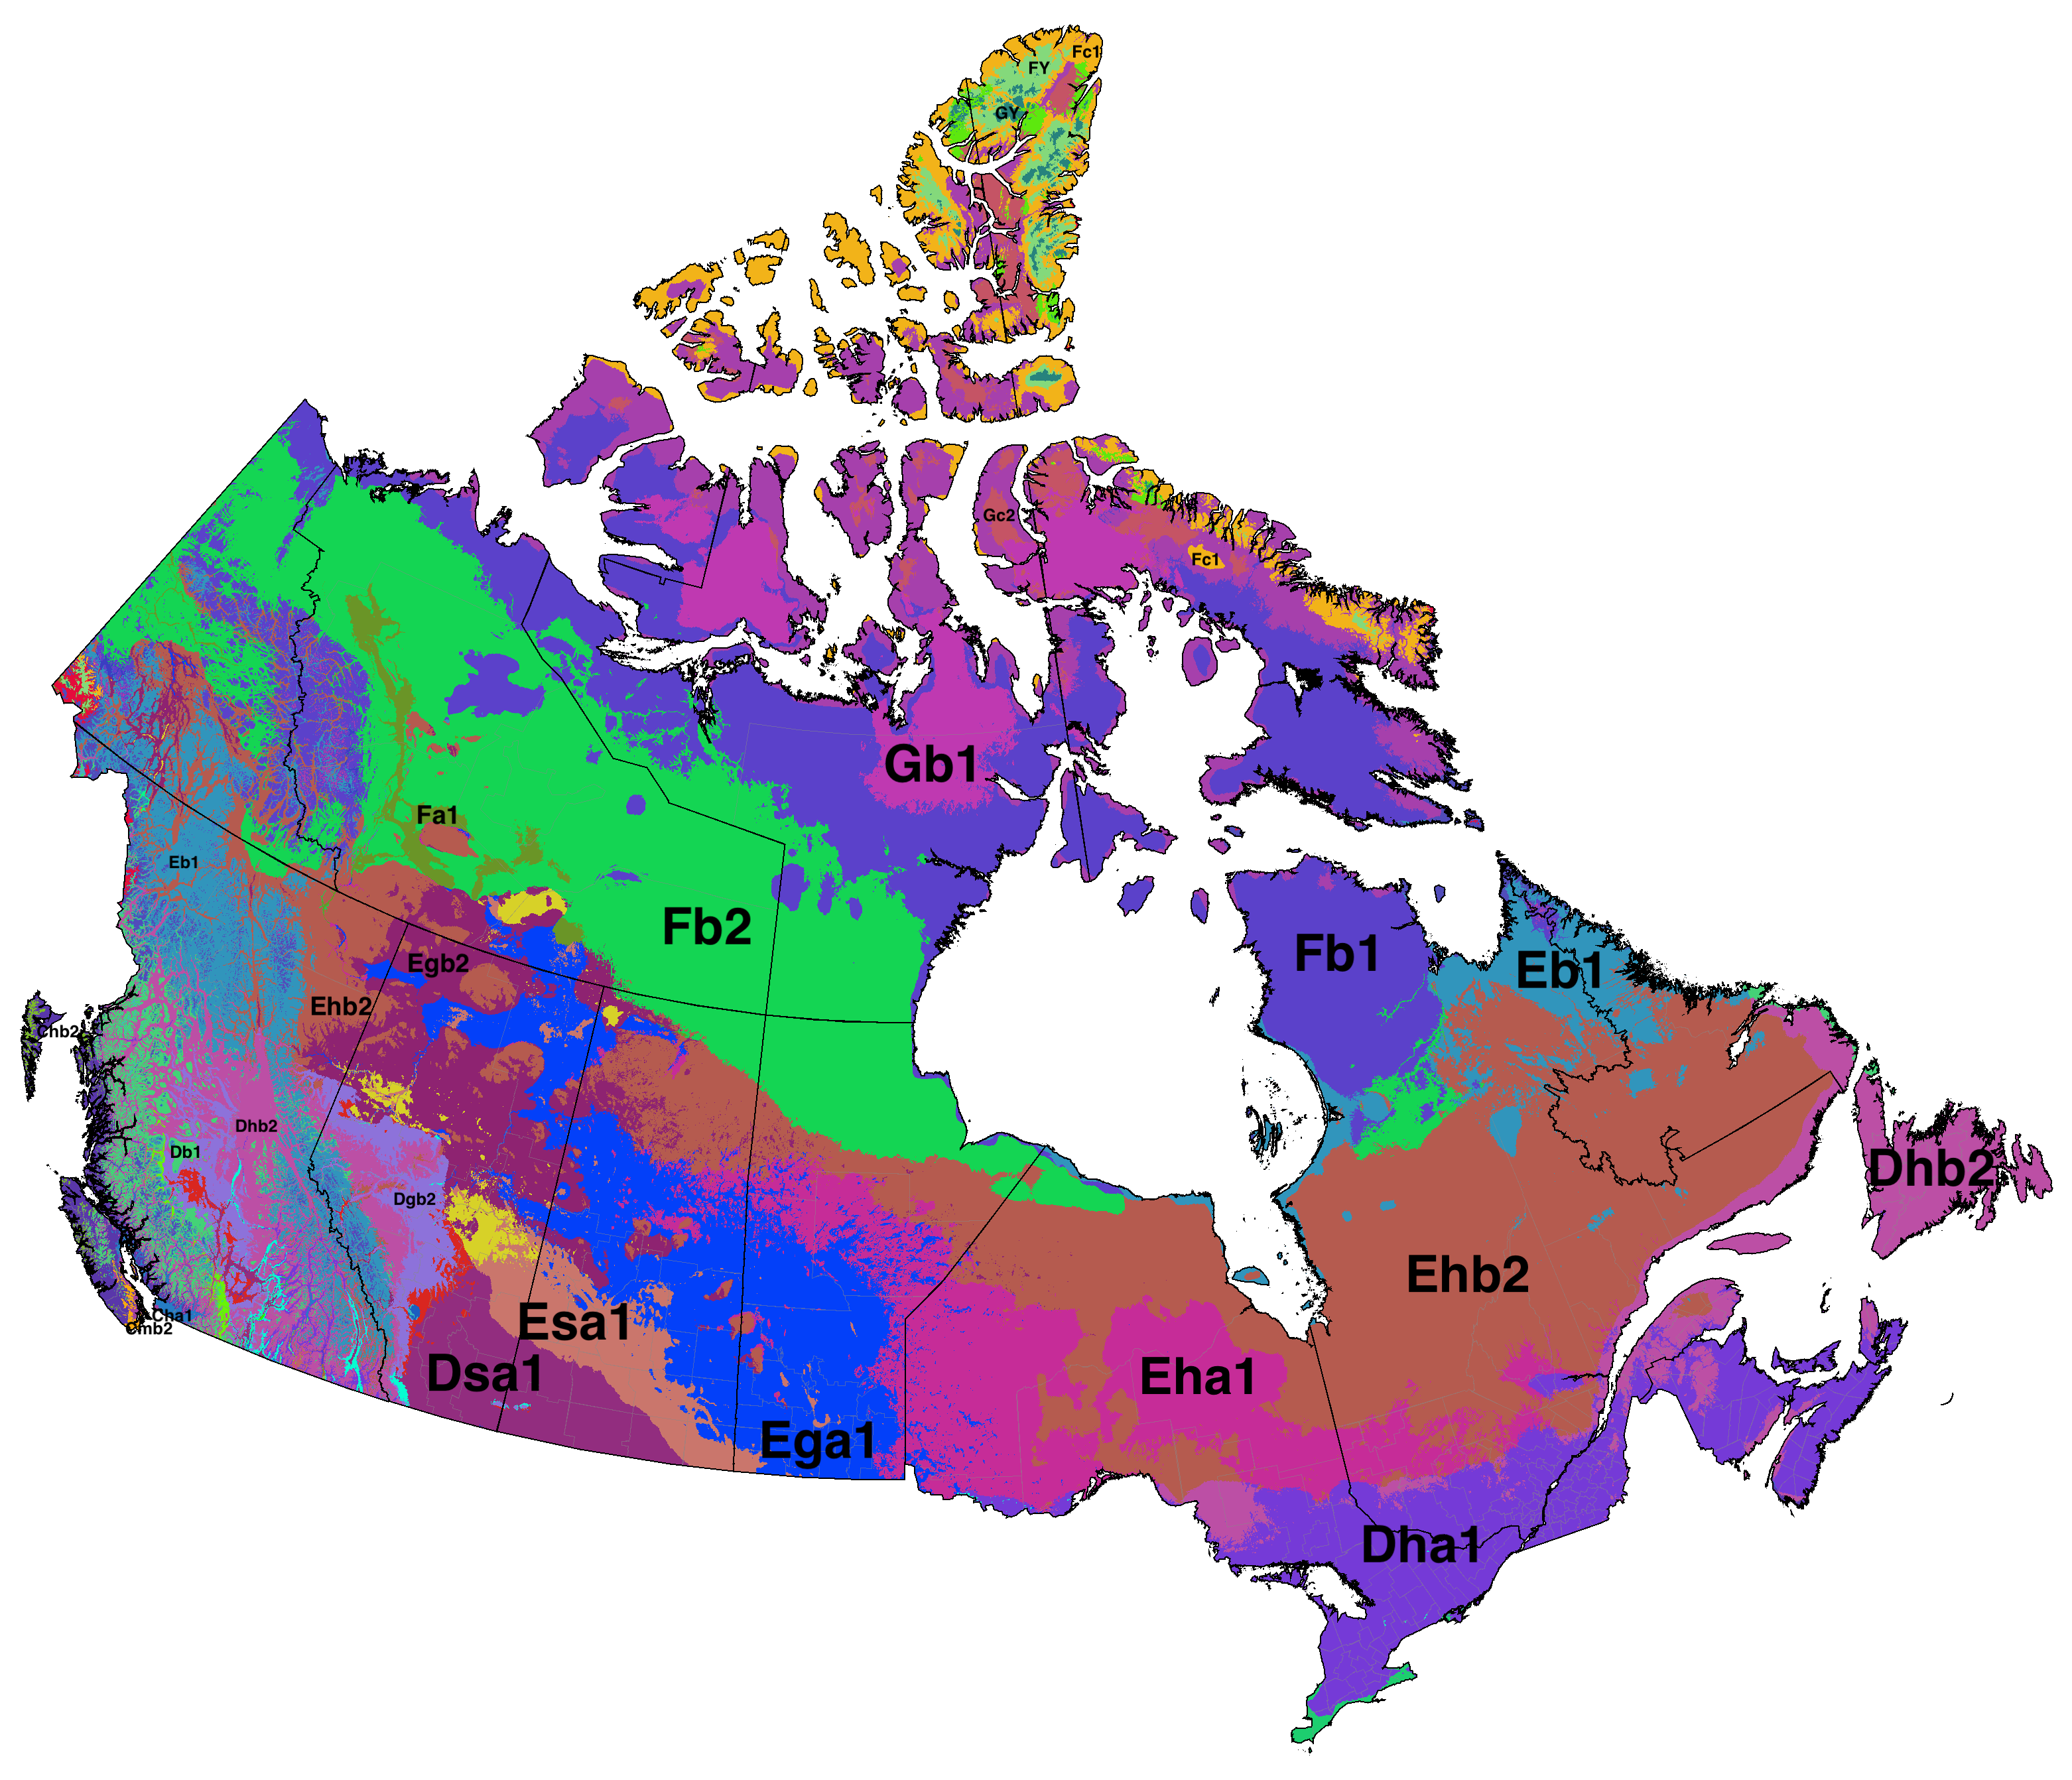
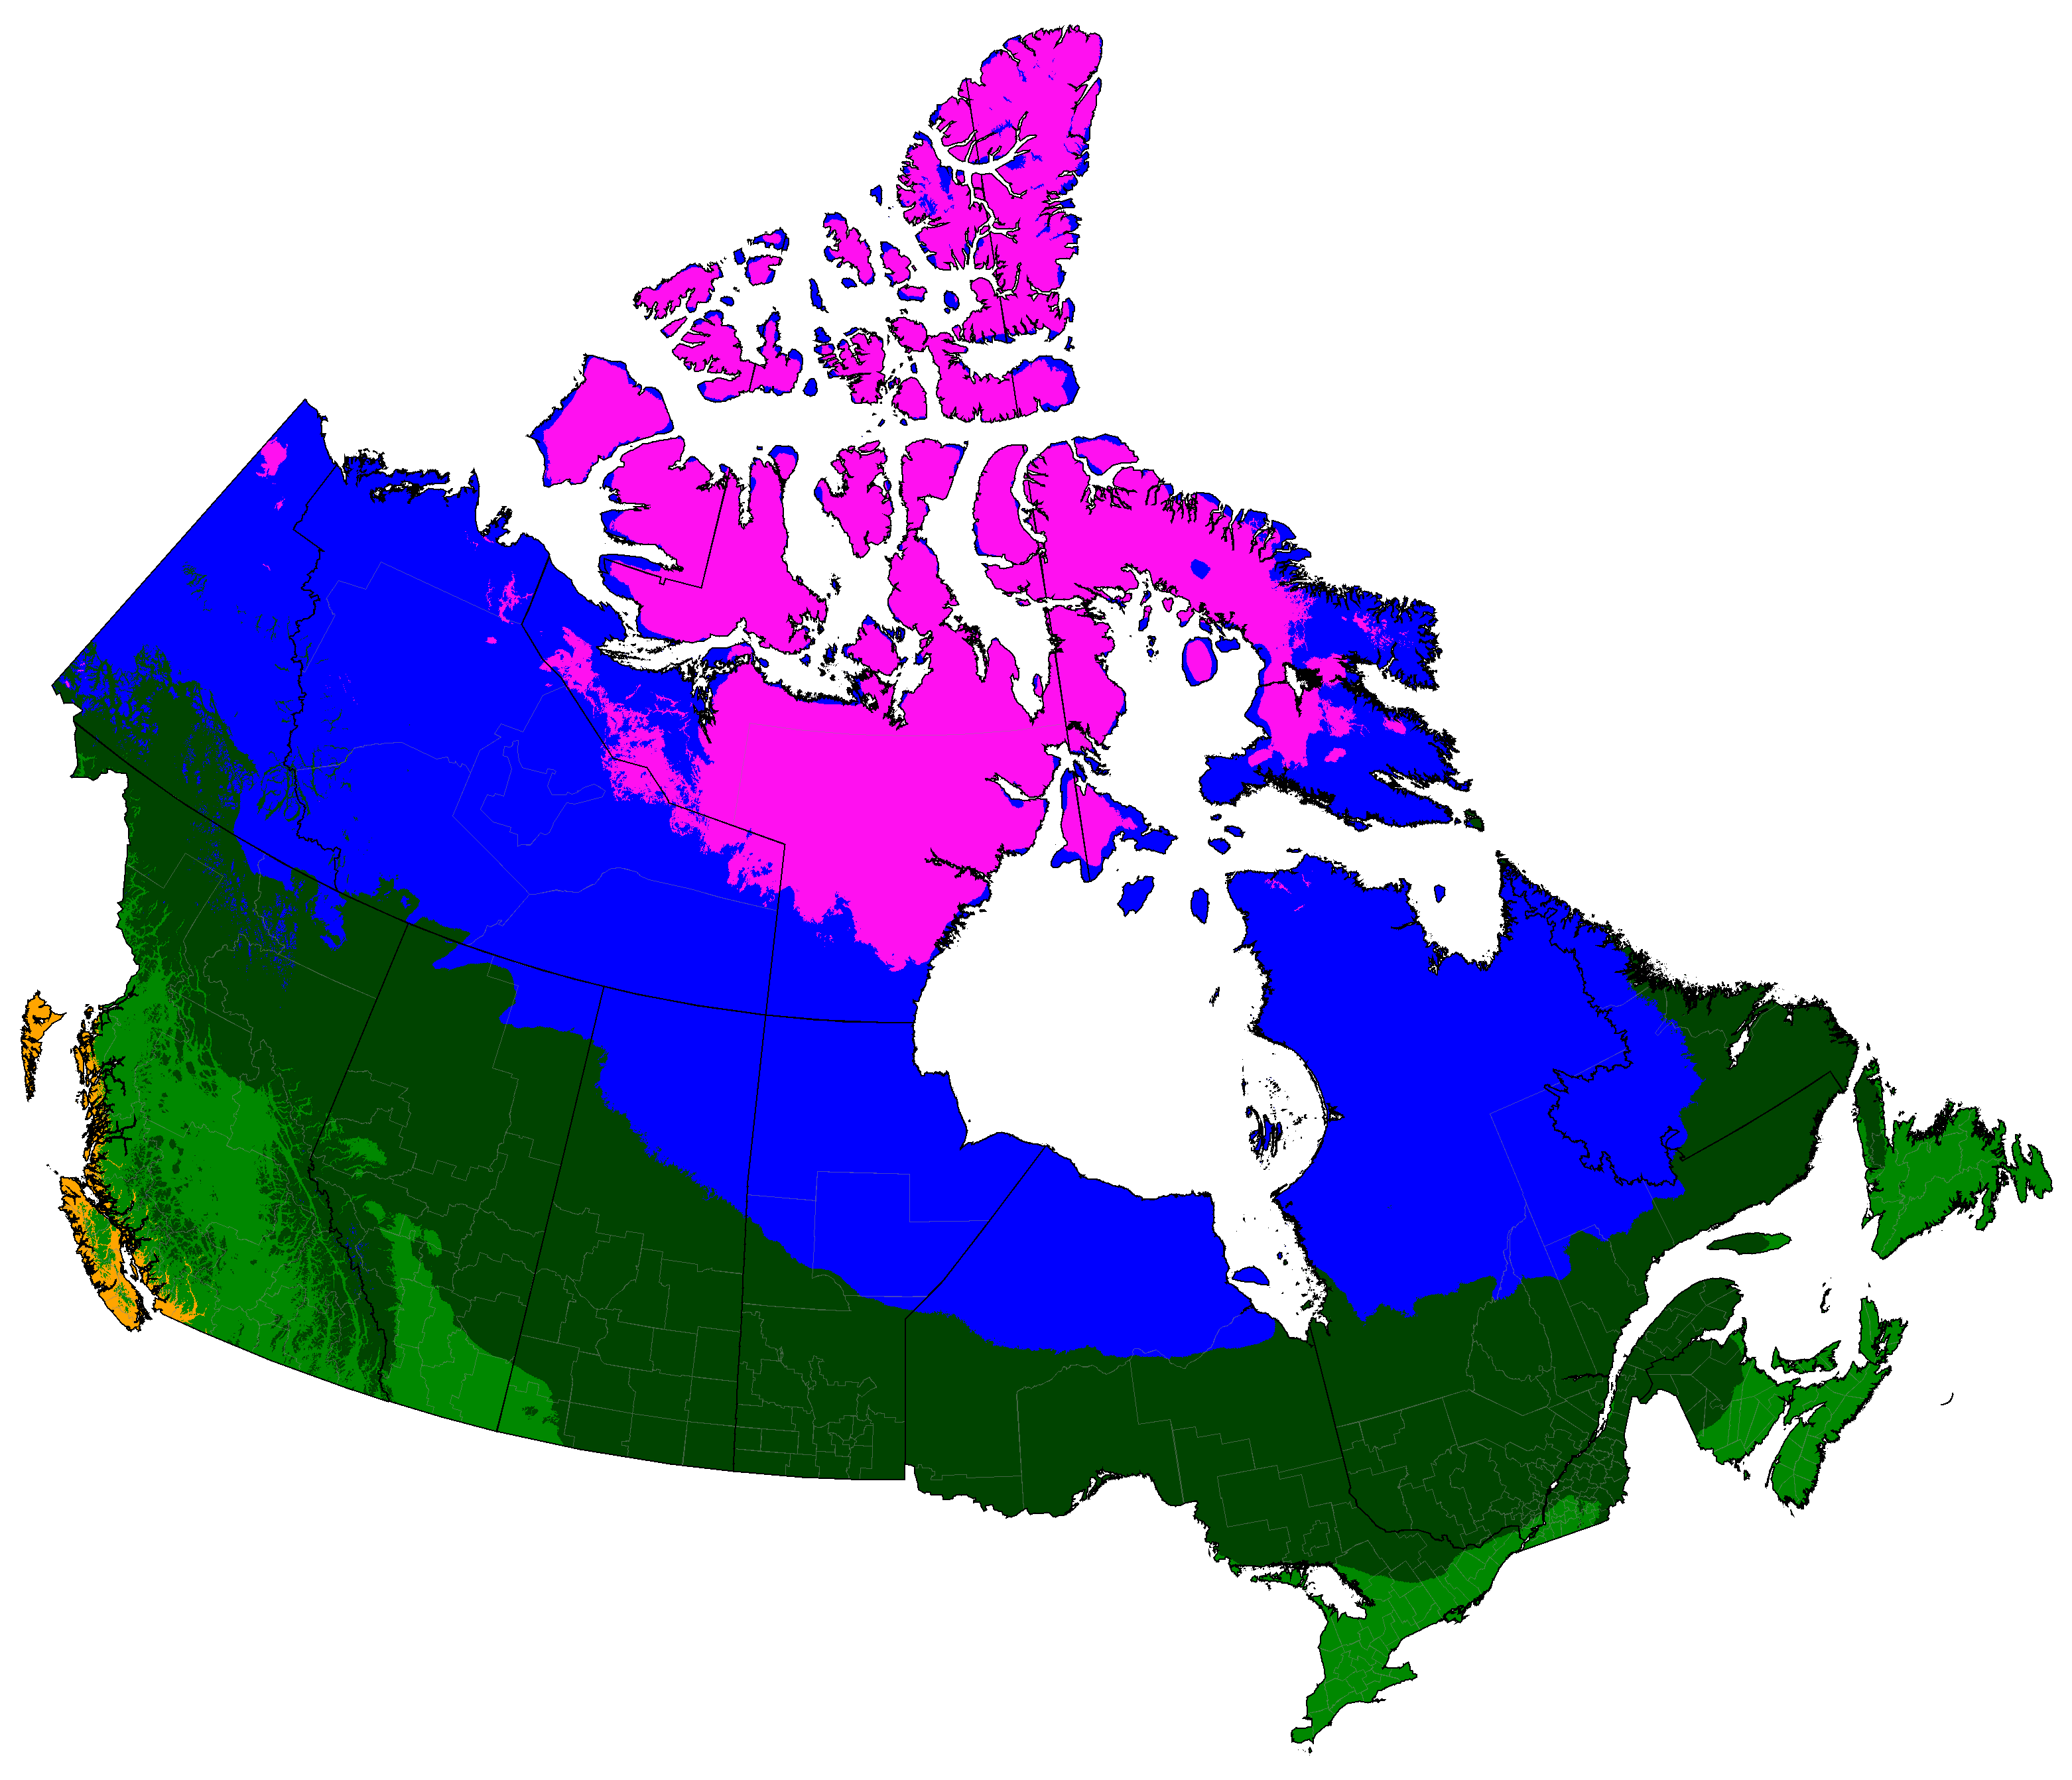
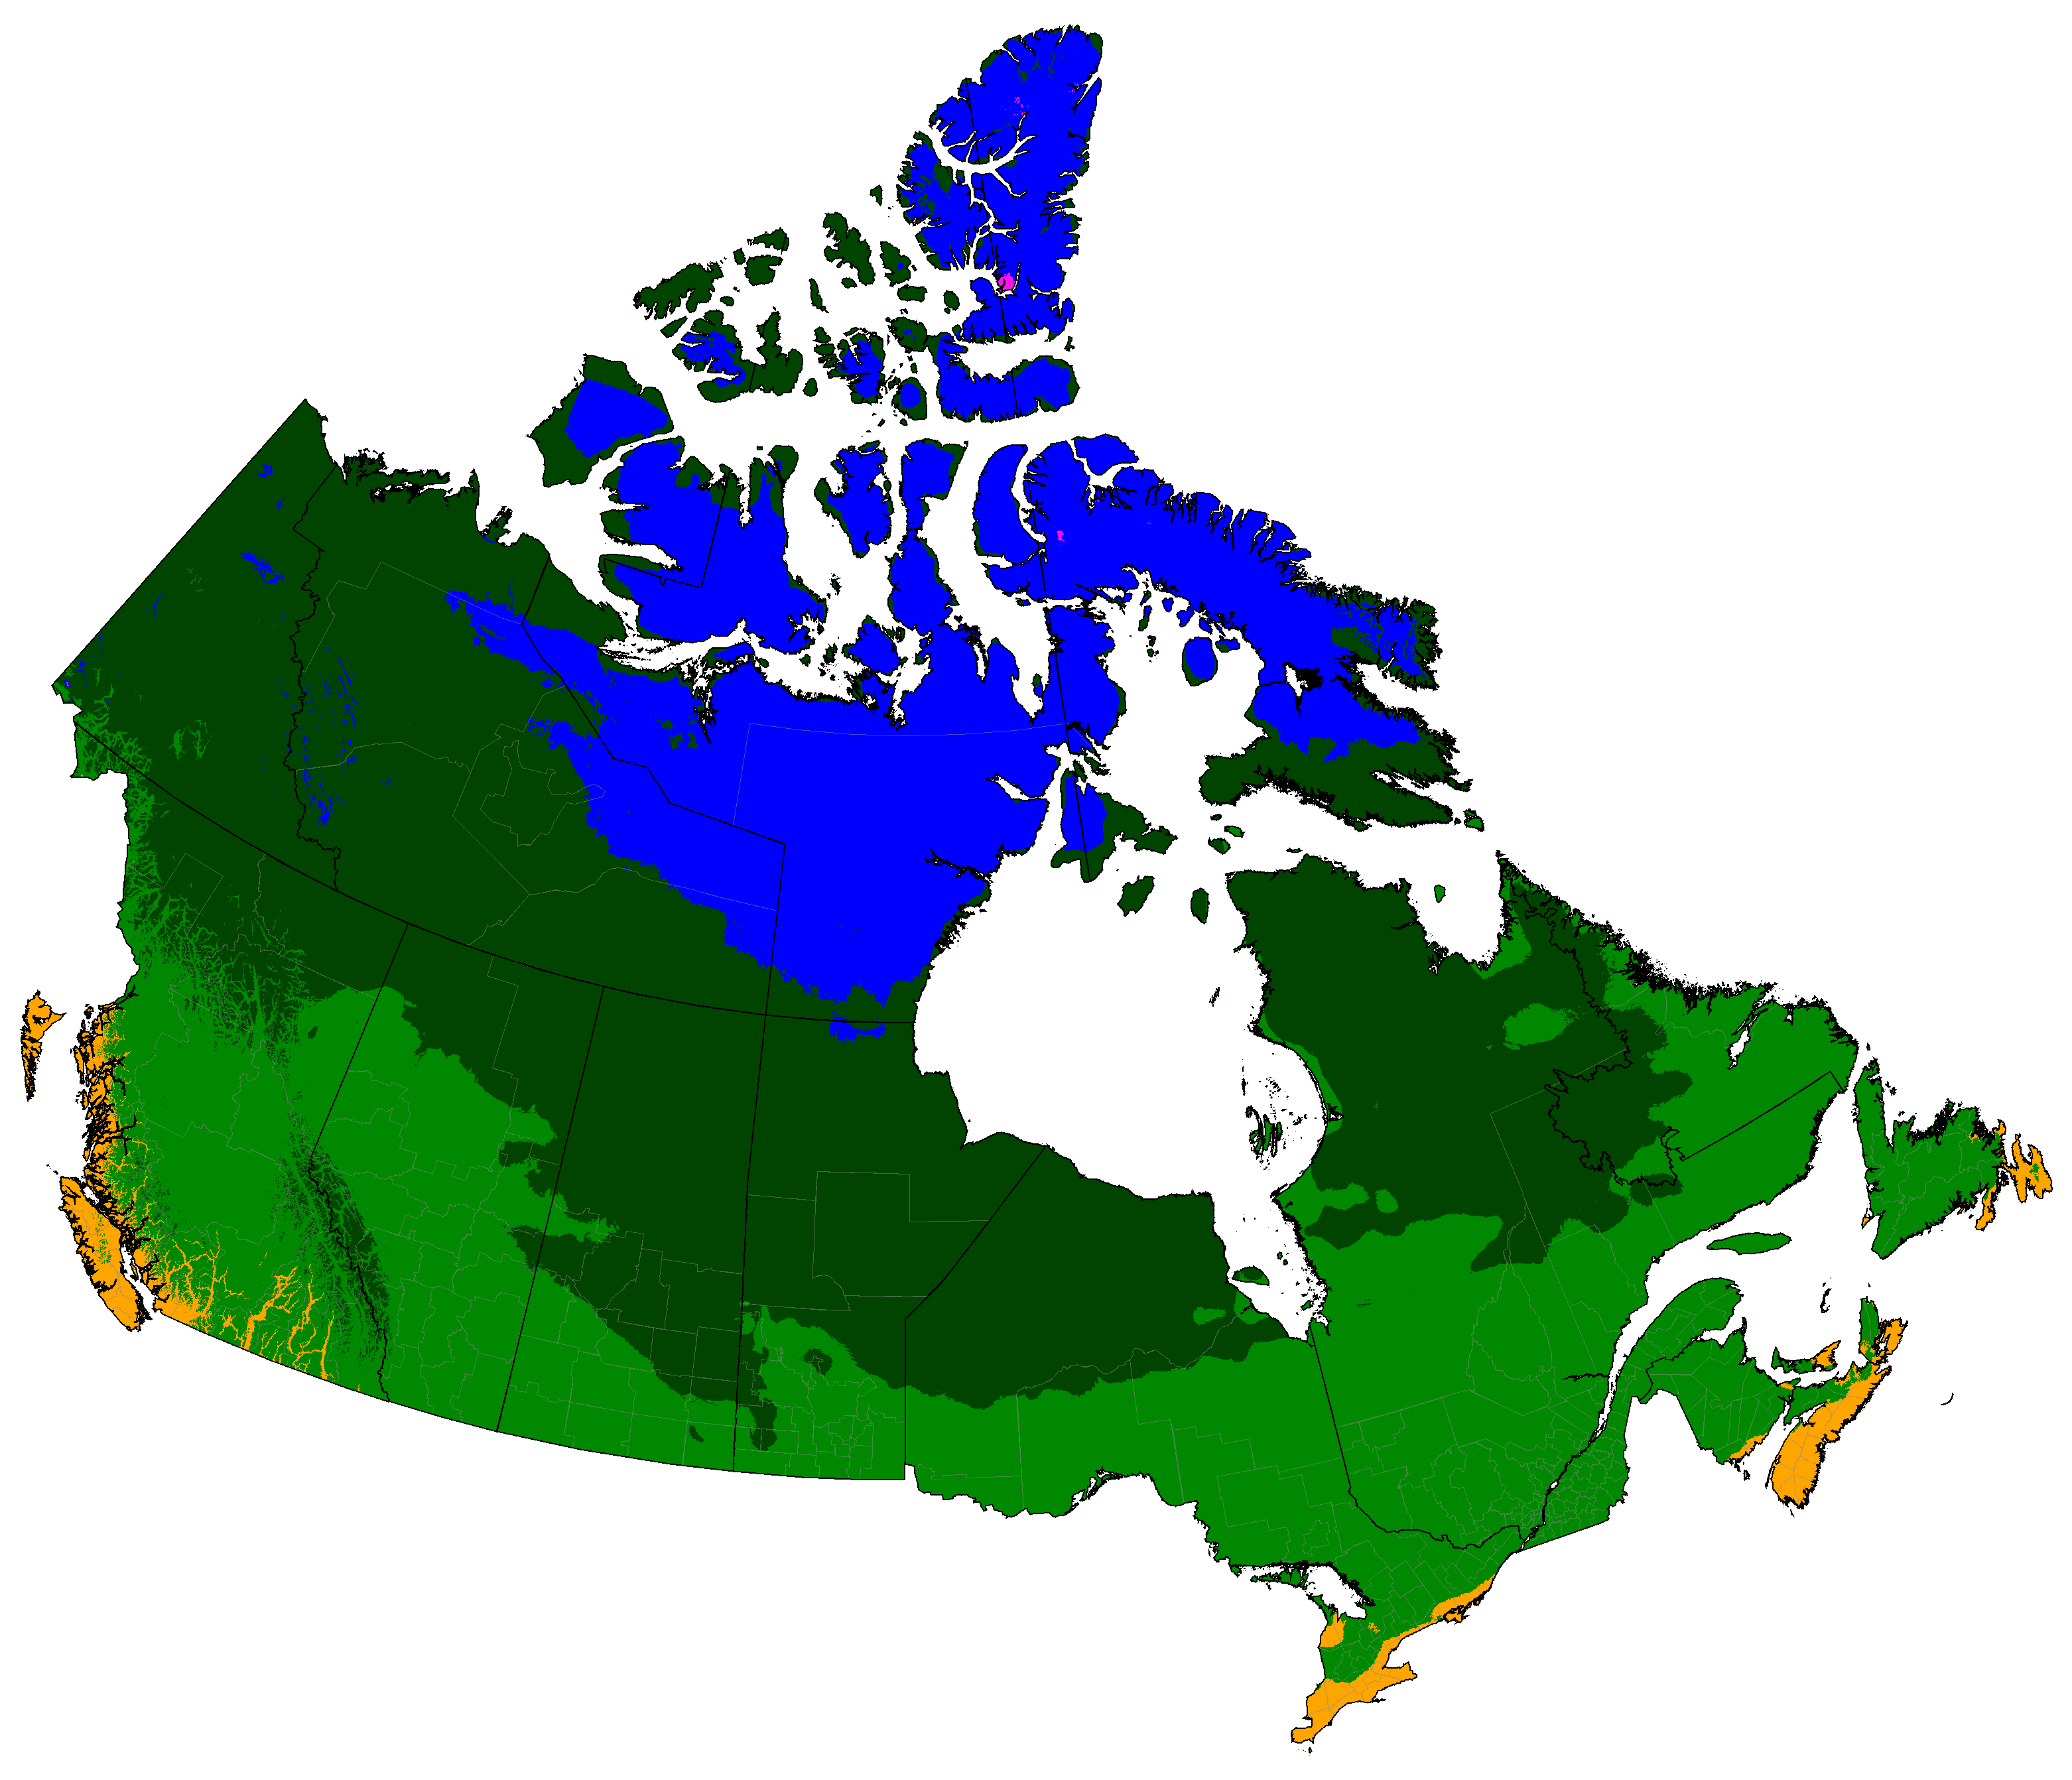
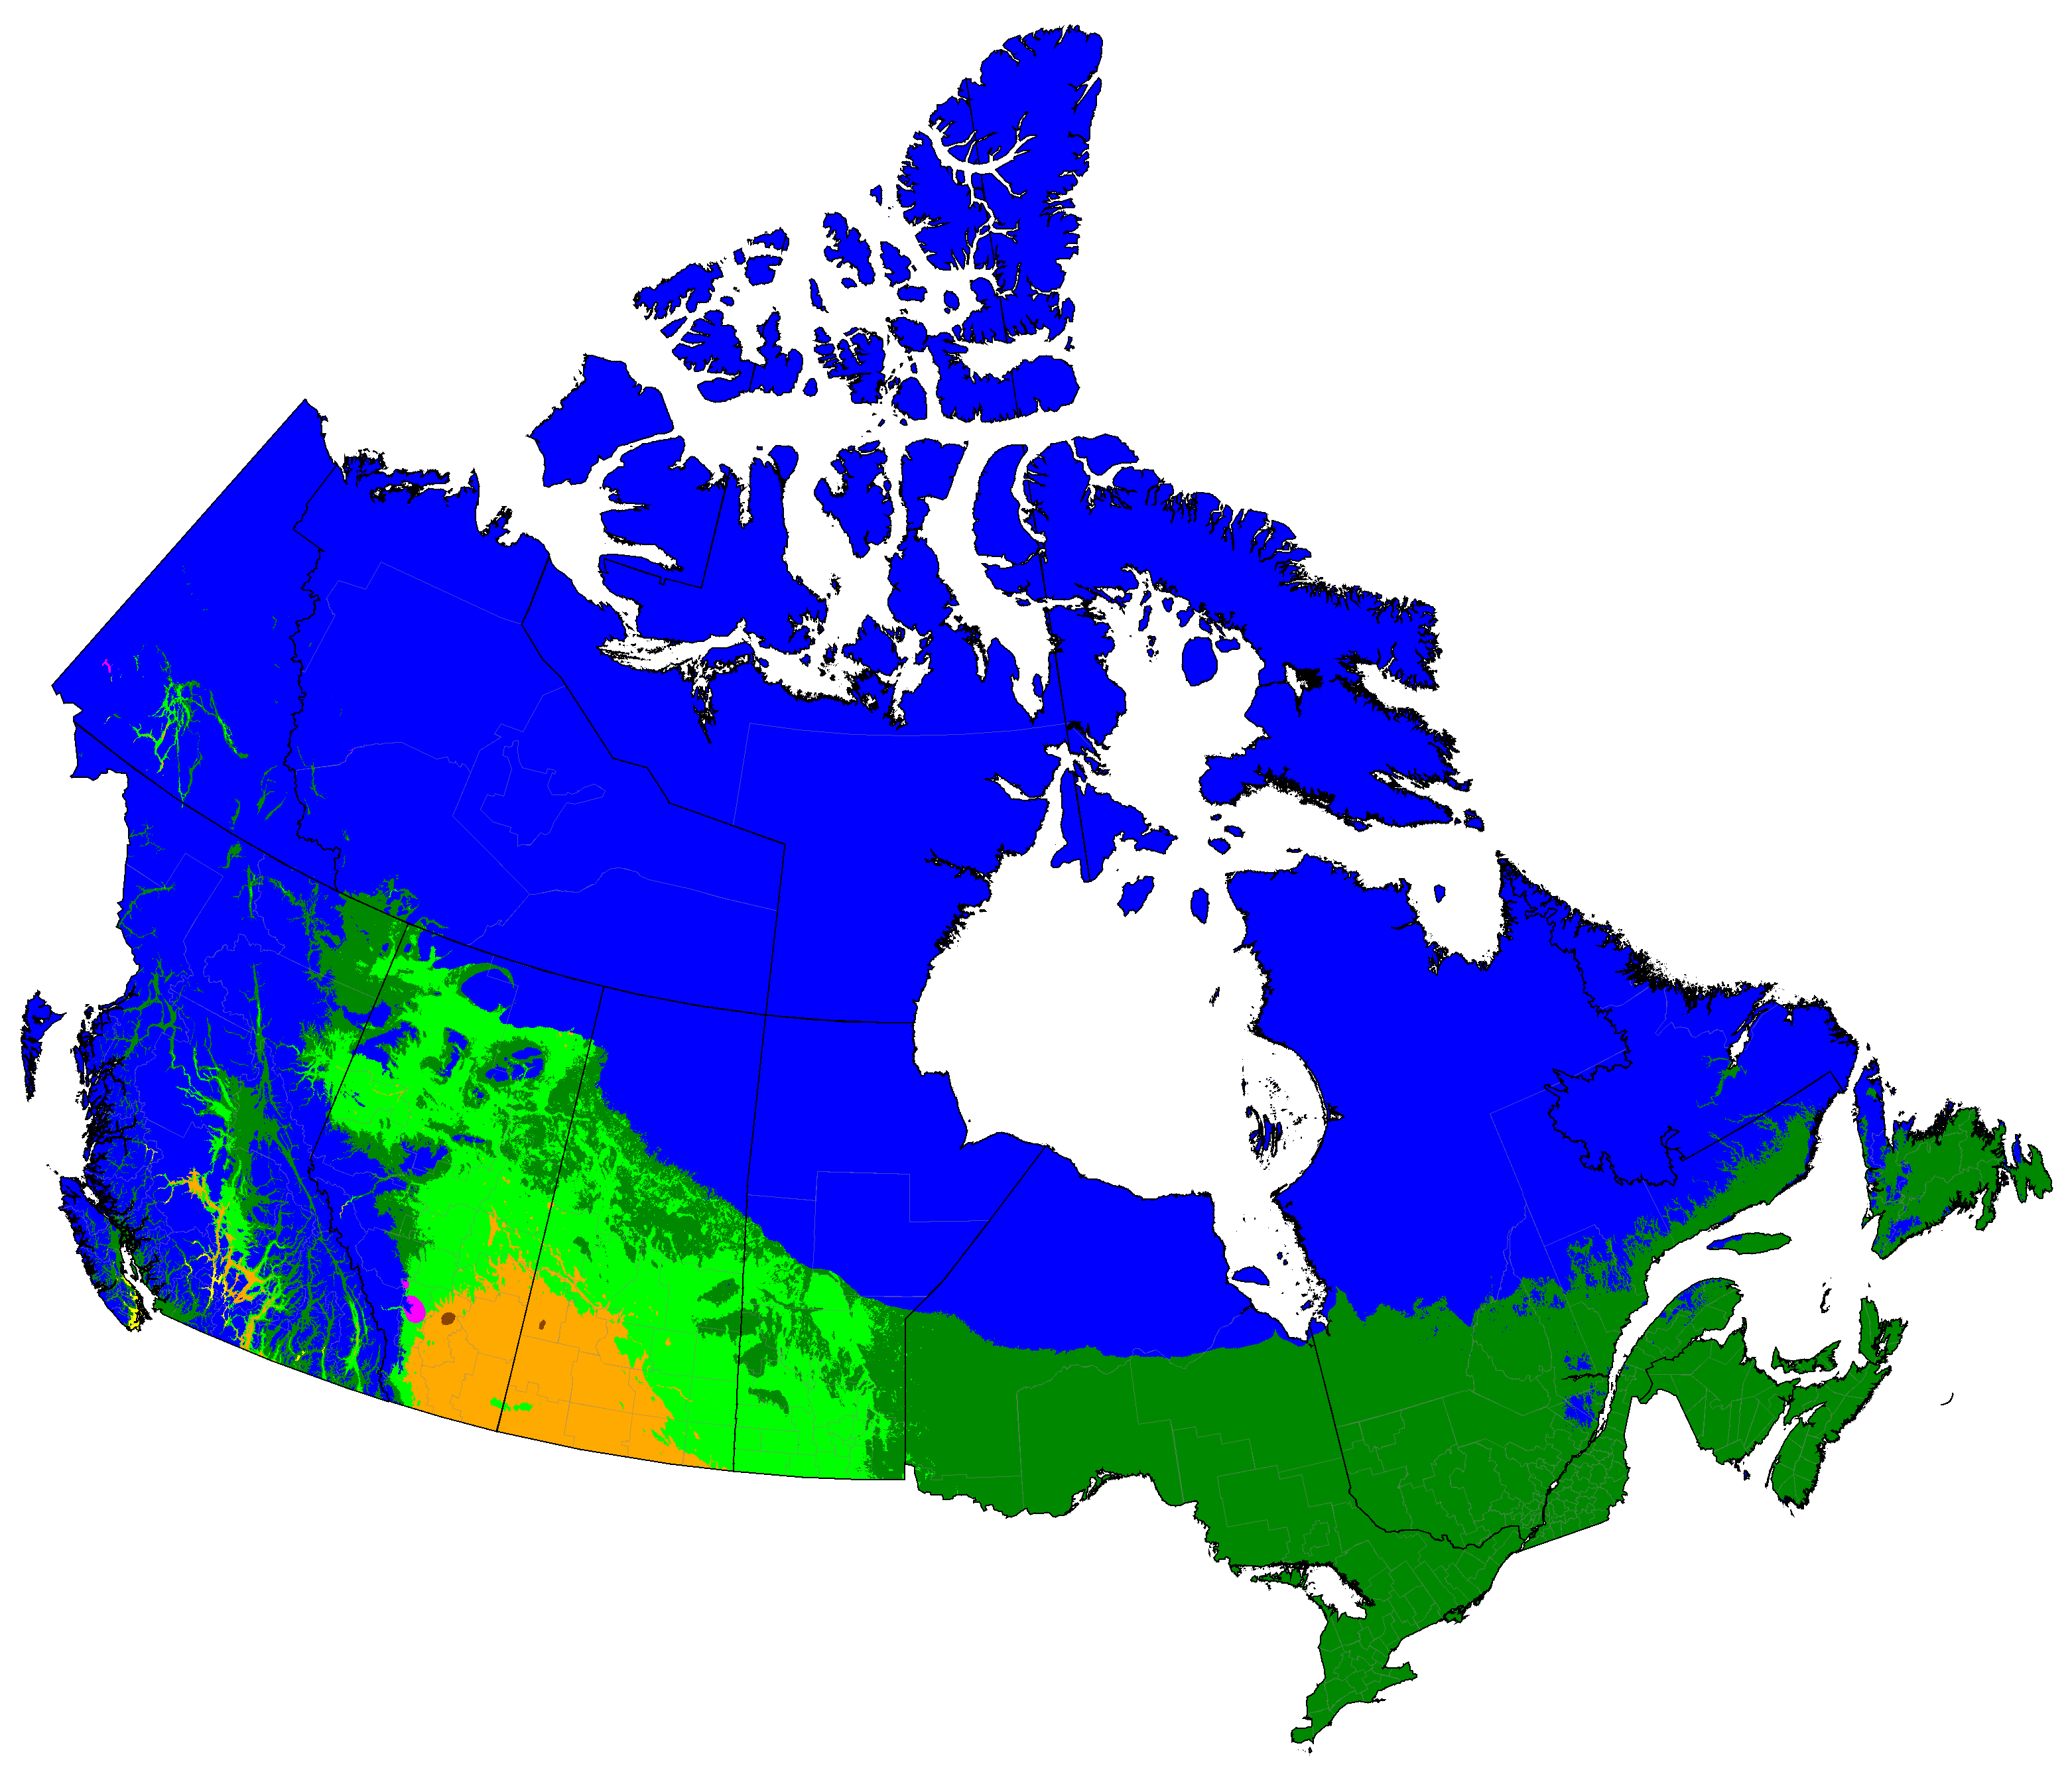
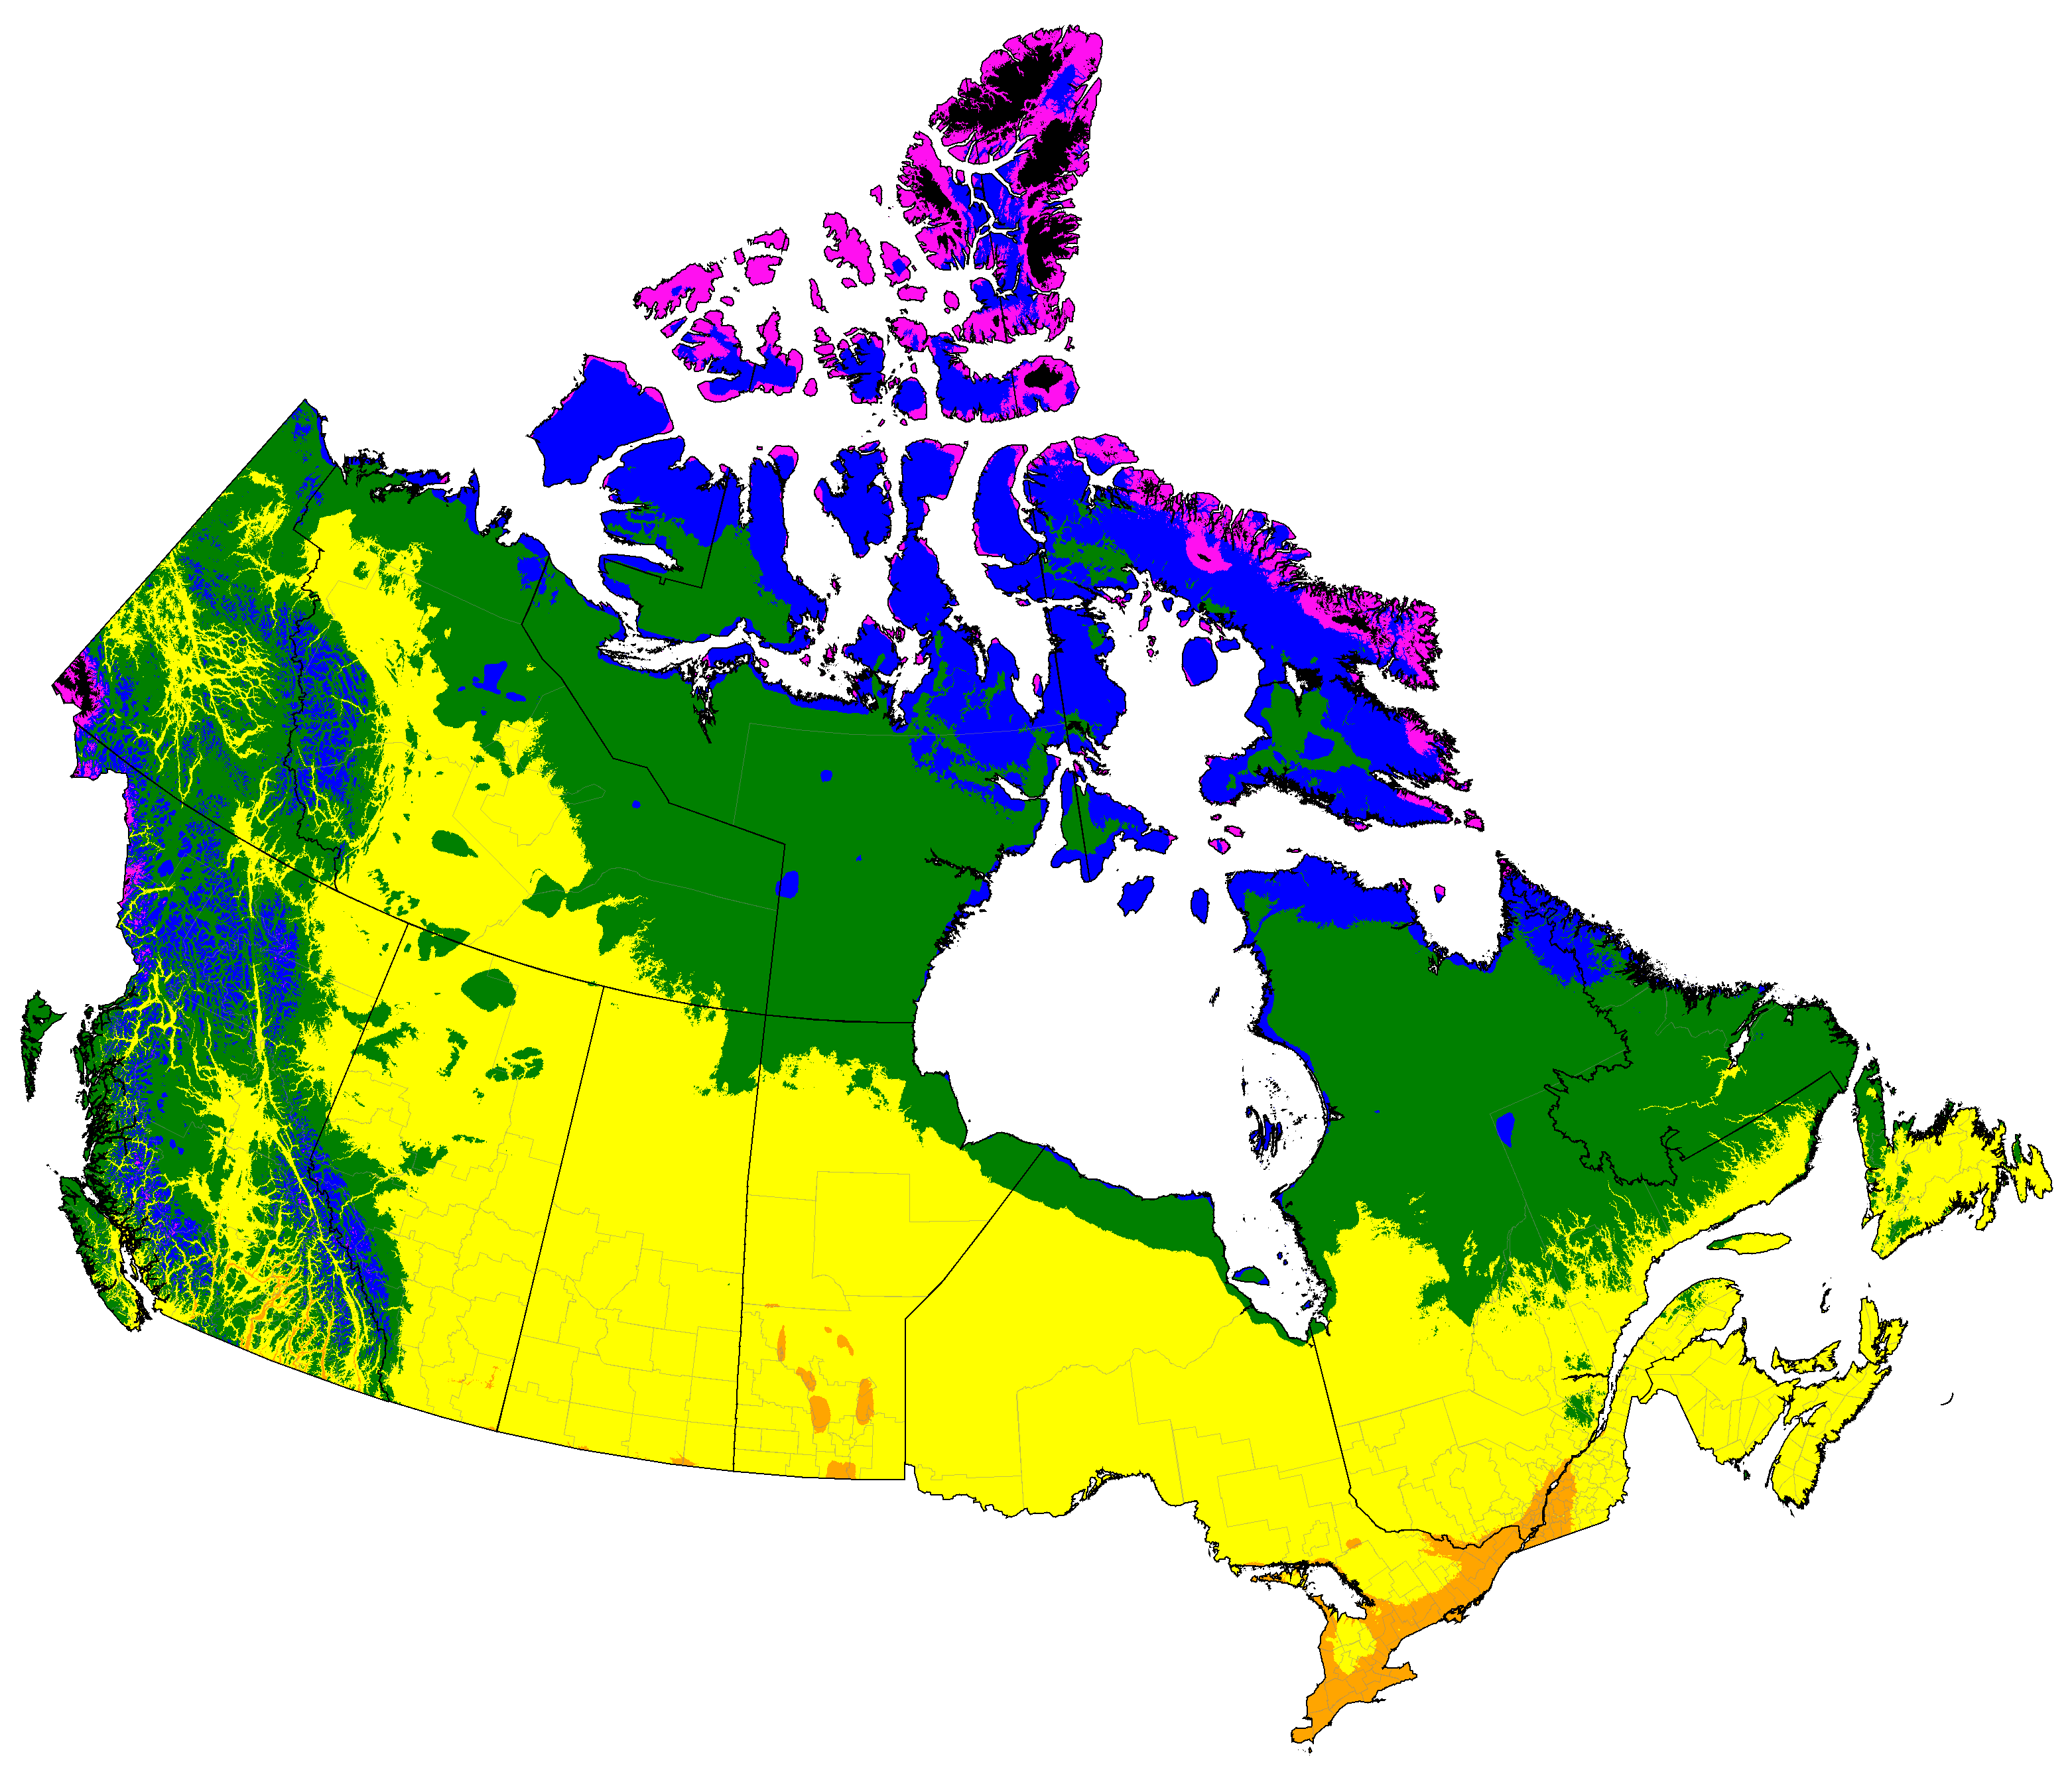
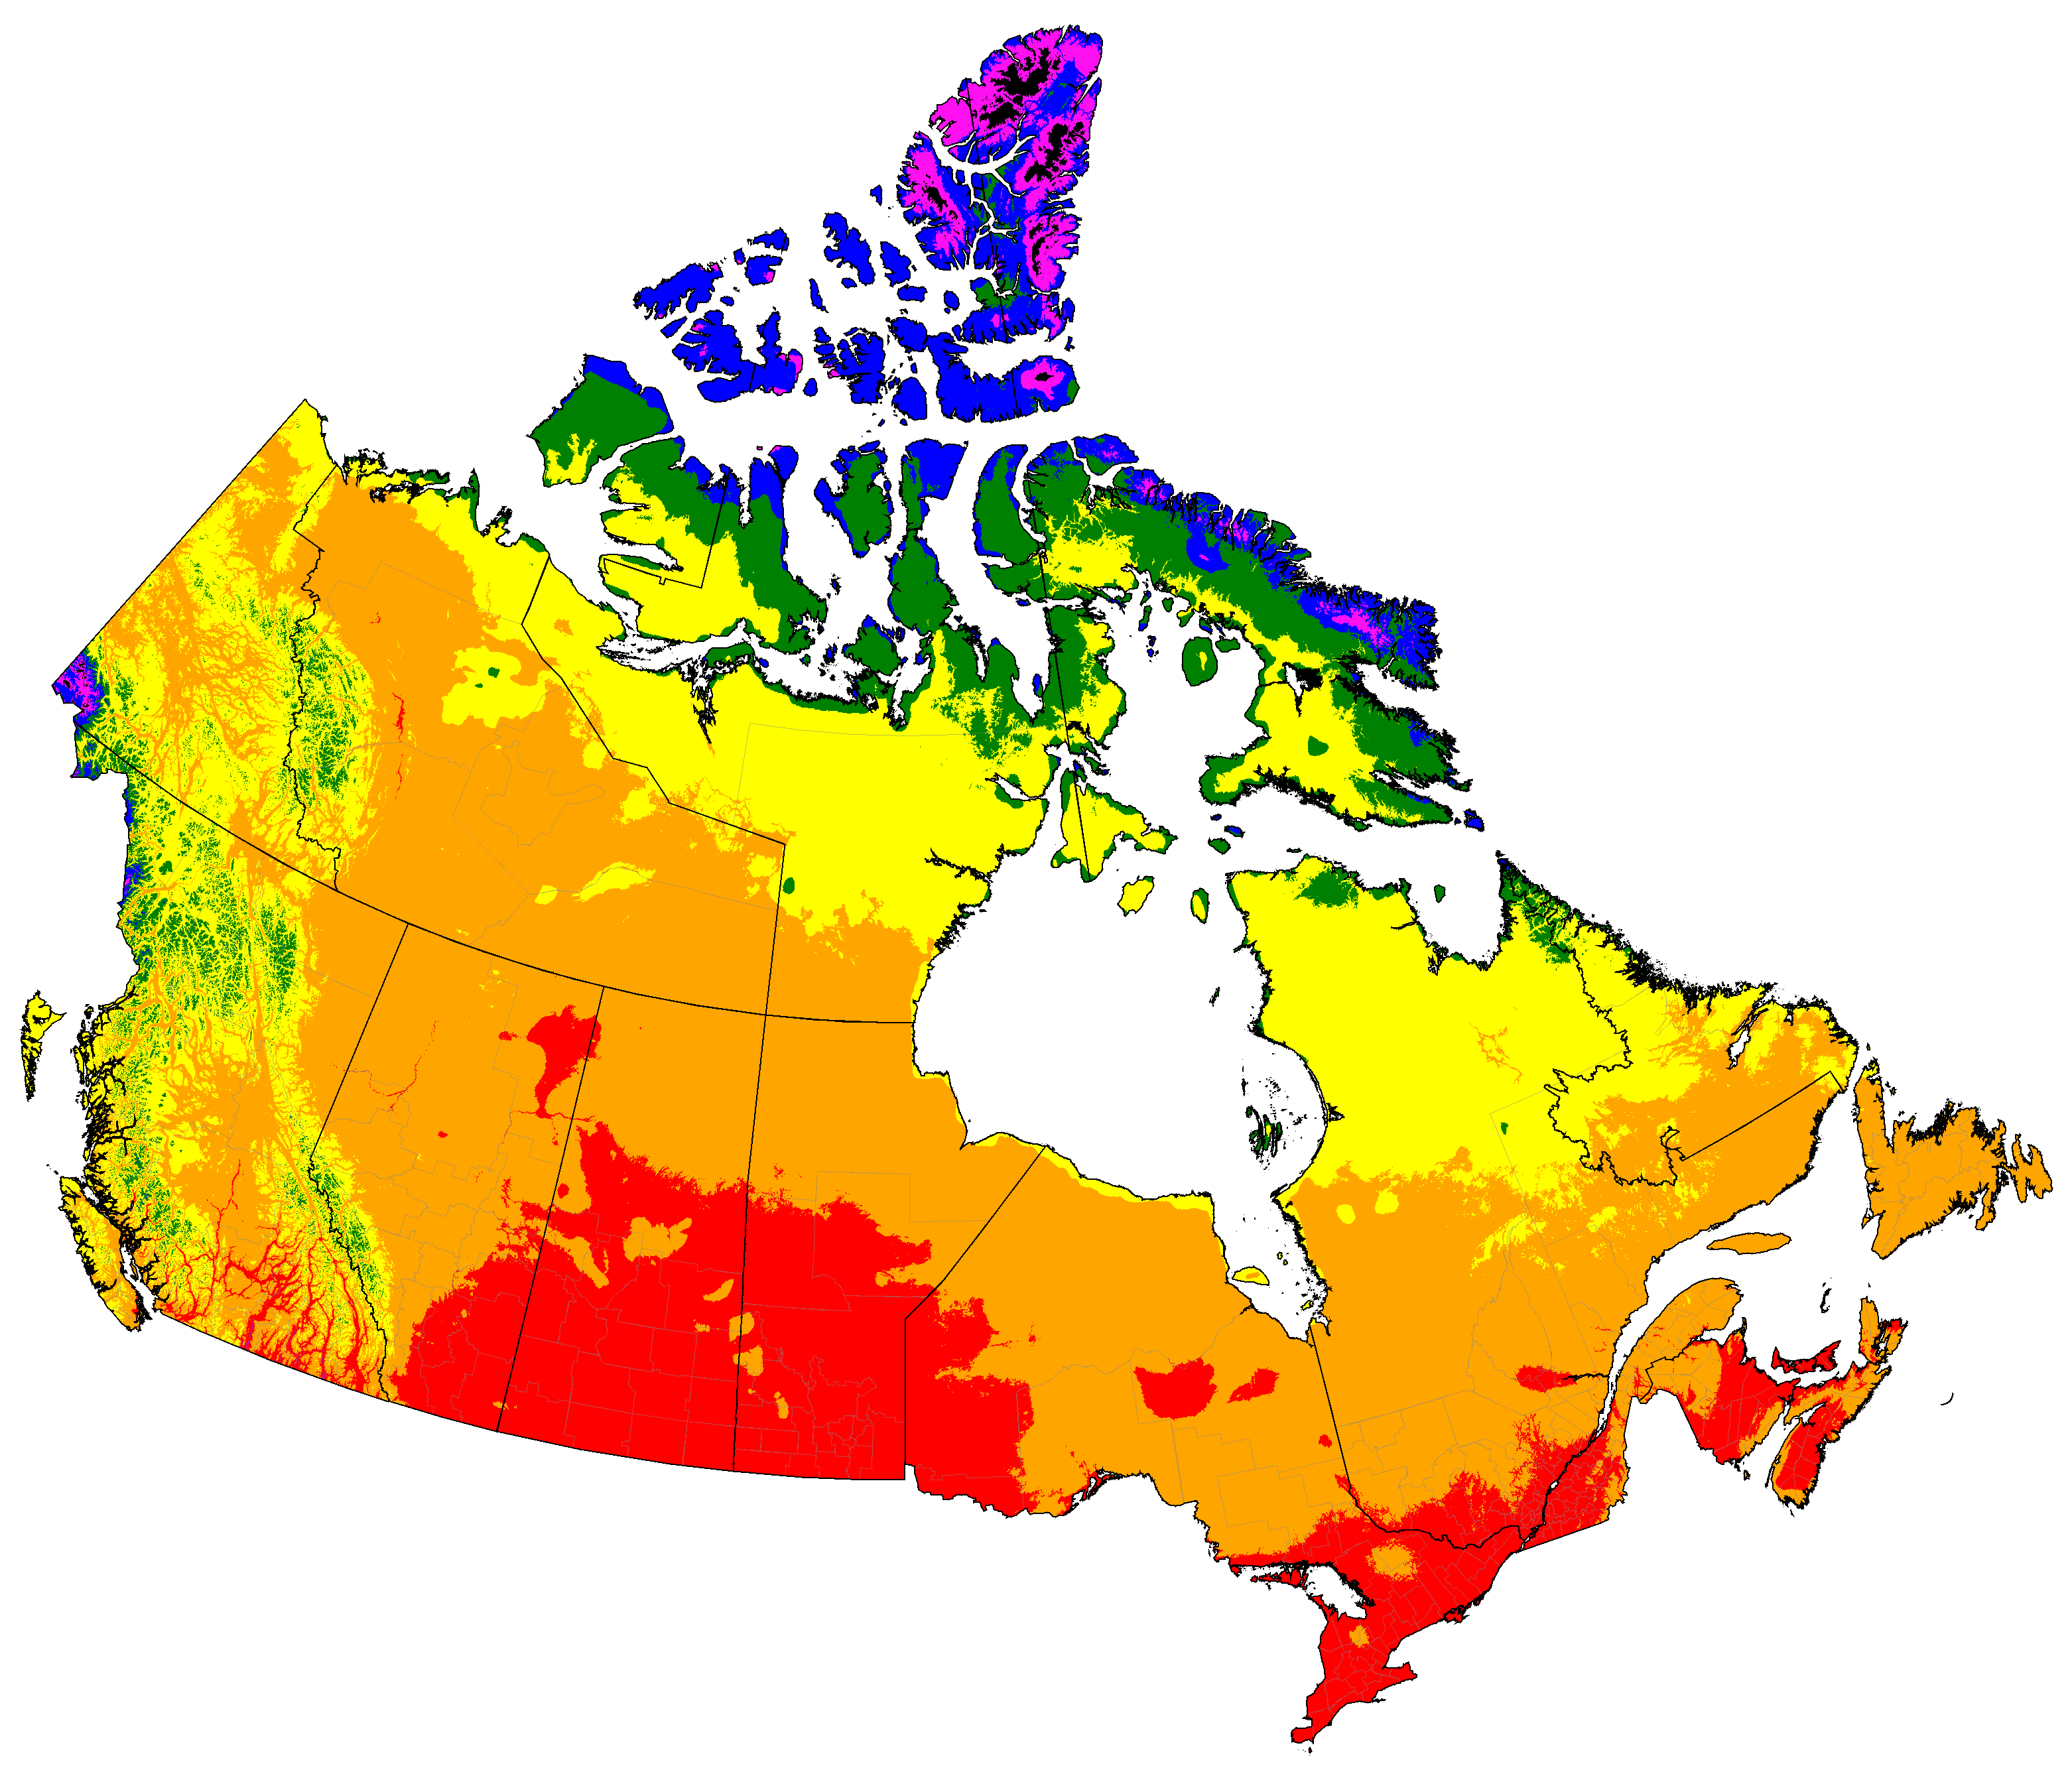
Canada distribution of classifications (projections are SSP5-8.5 high emissions normals)
Note: Due to the complexity of the system, only the most common climates in each map are labeled. The vertical line in the middle of Nunavut is a cartographic artifact, not a political boundary.
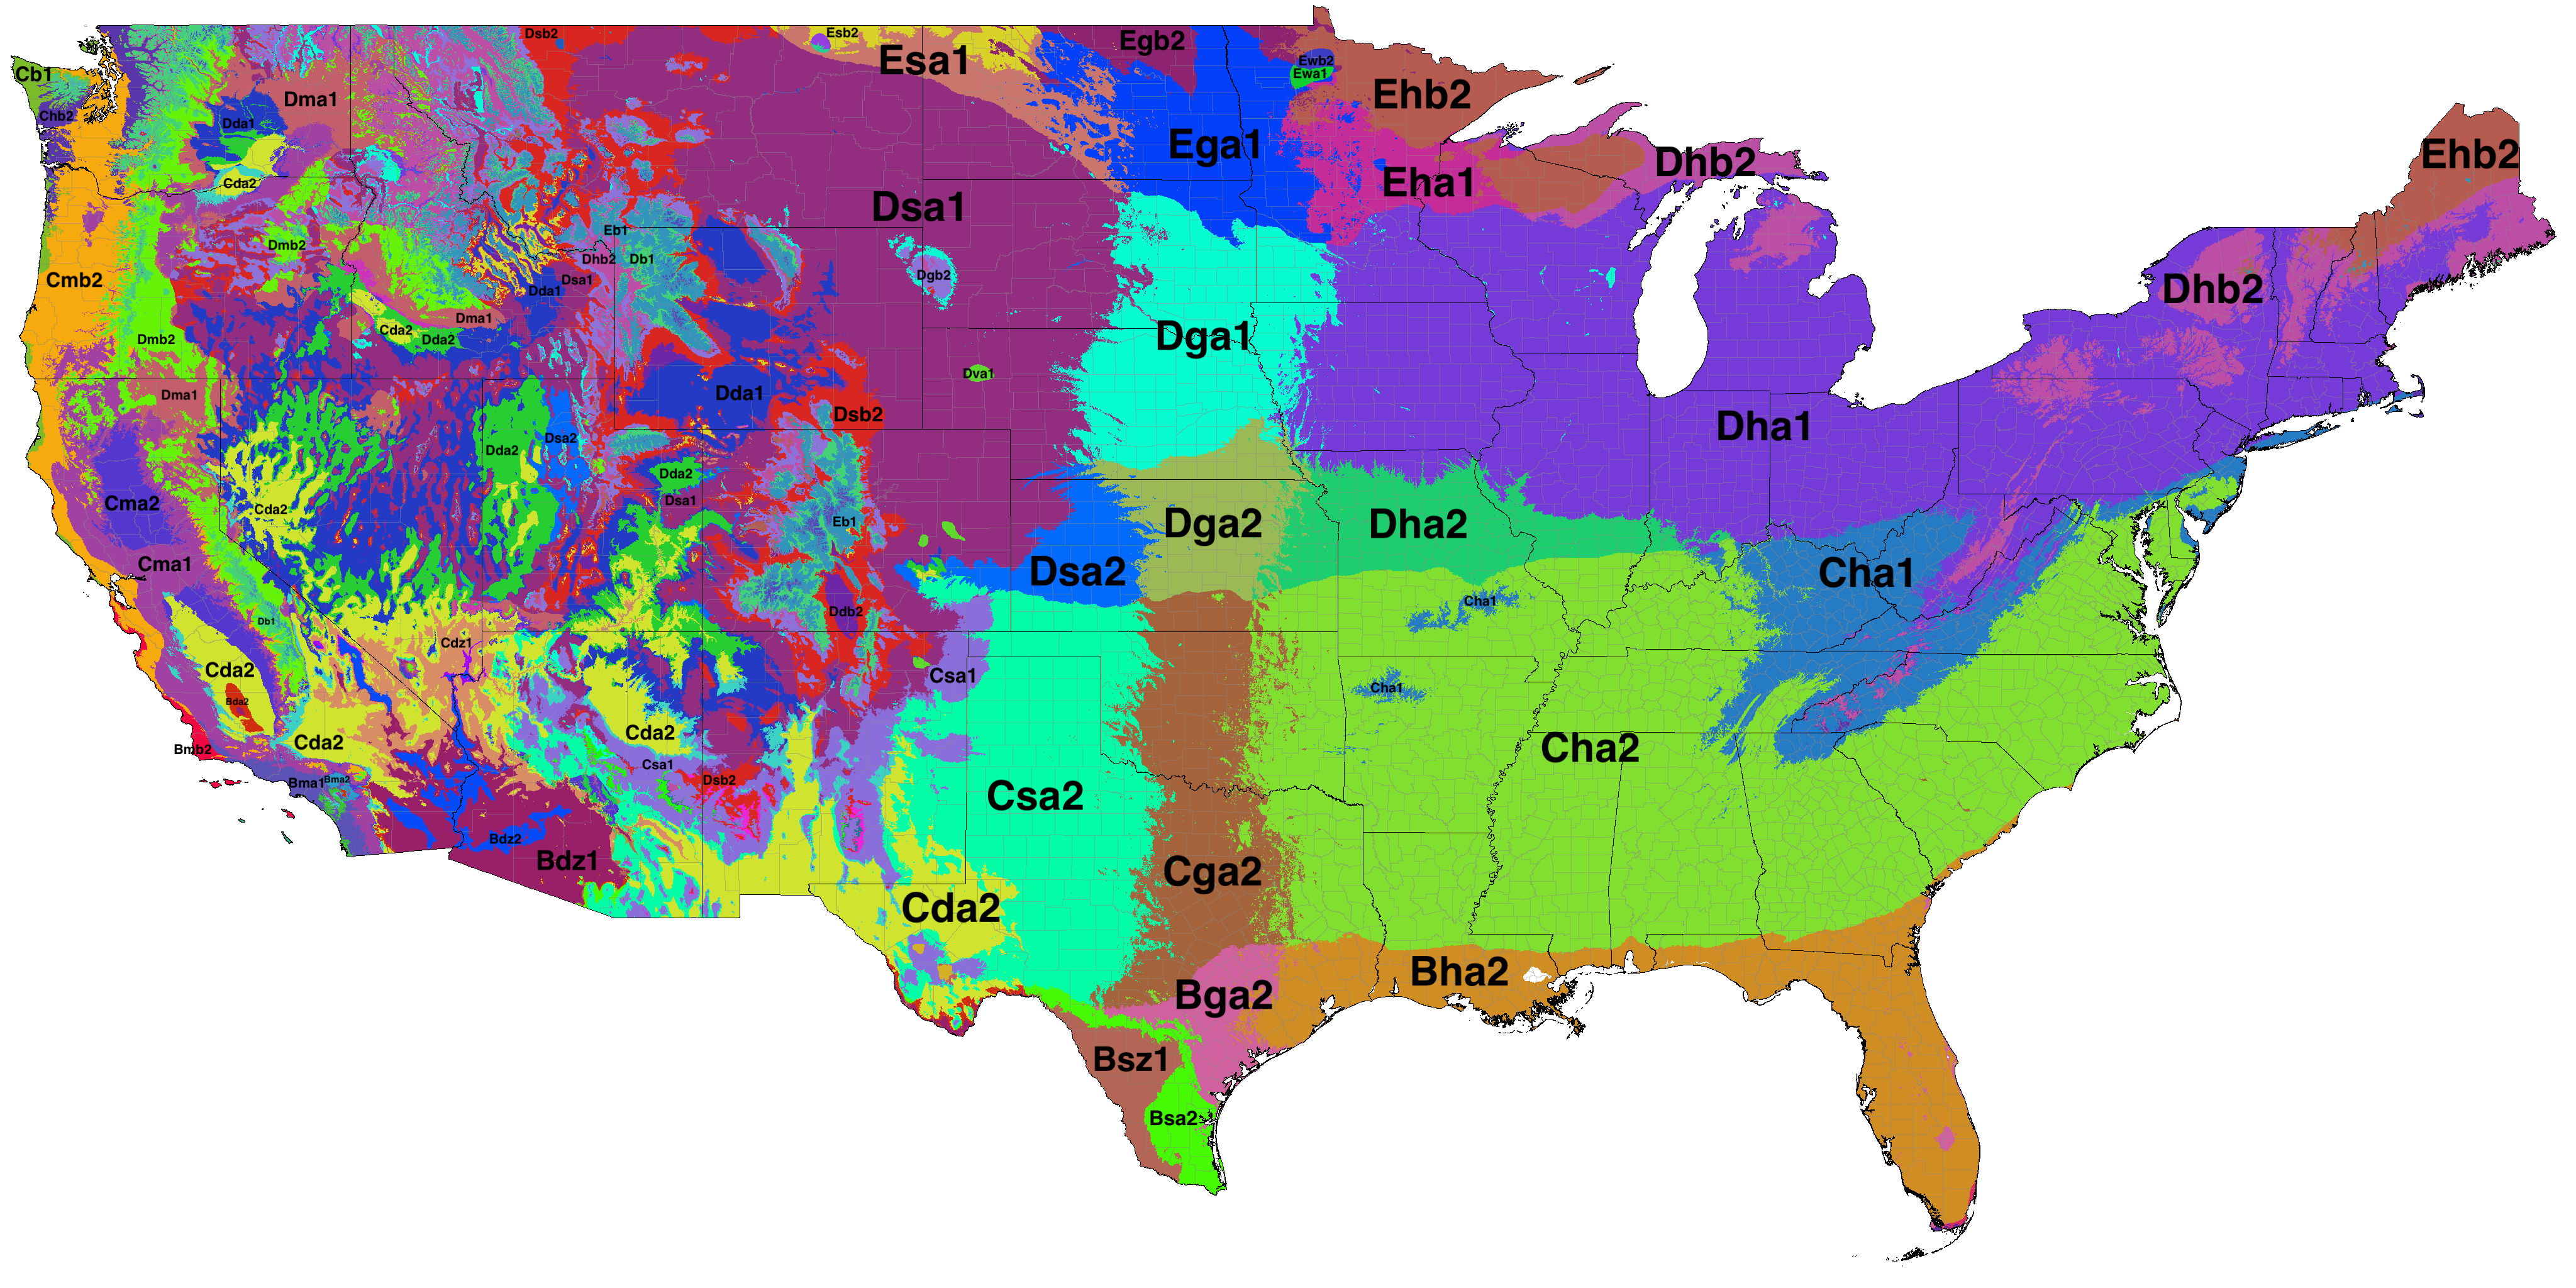
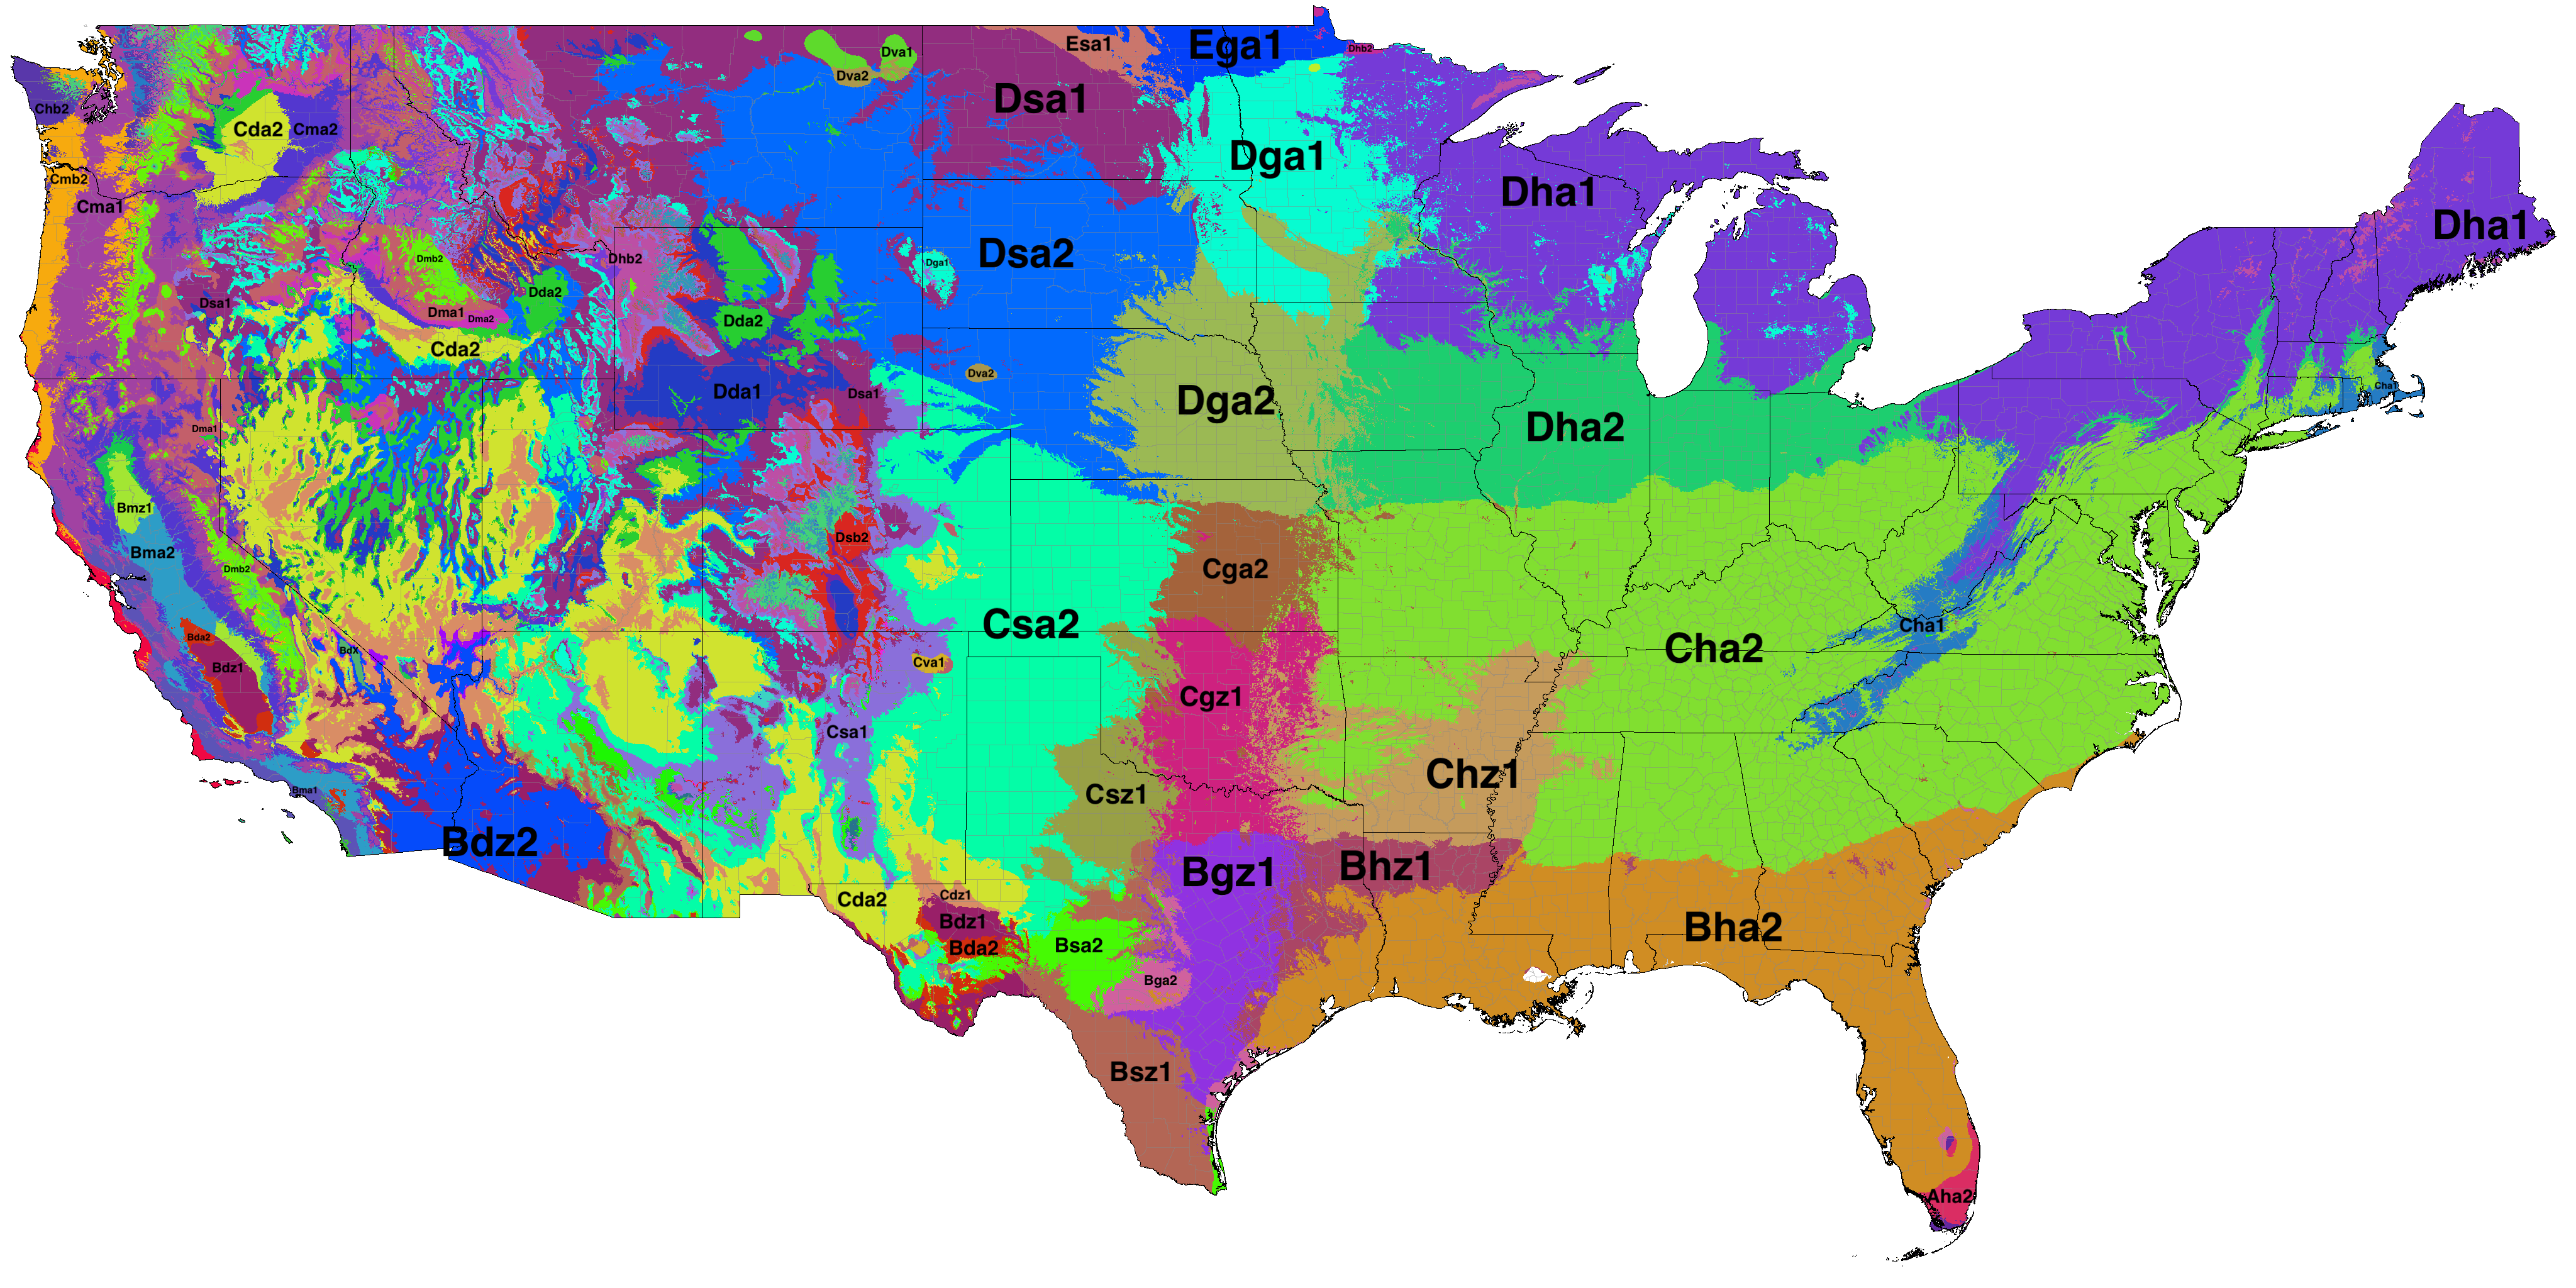
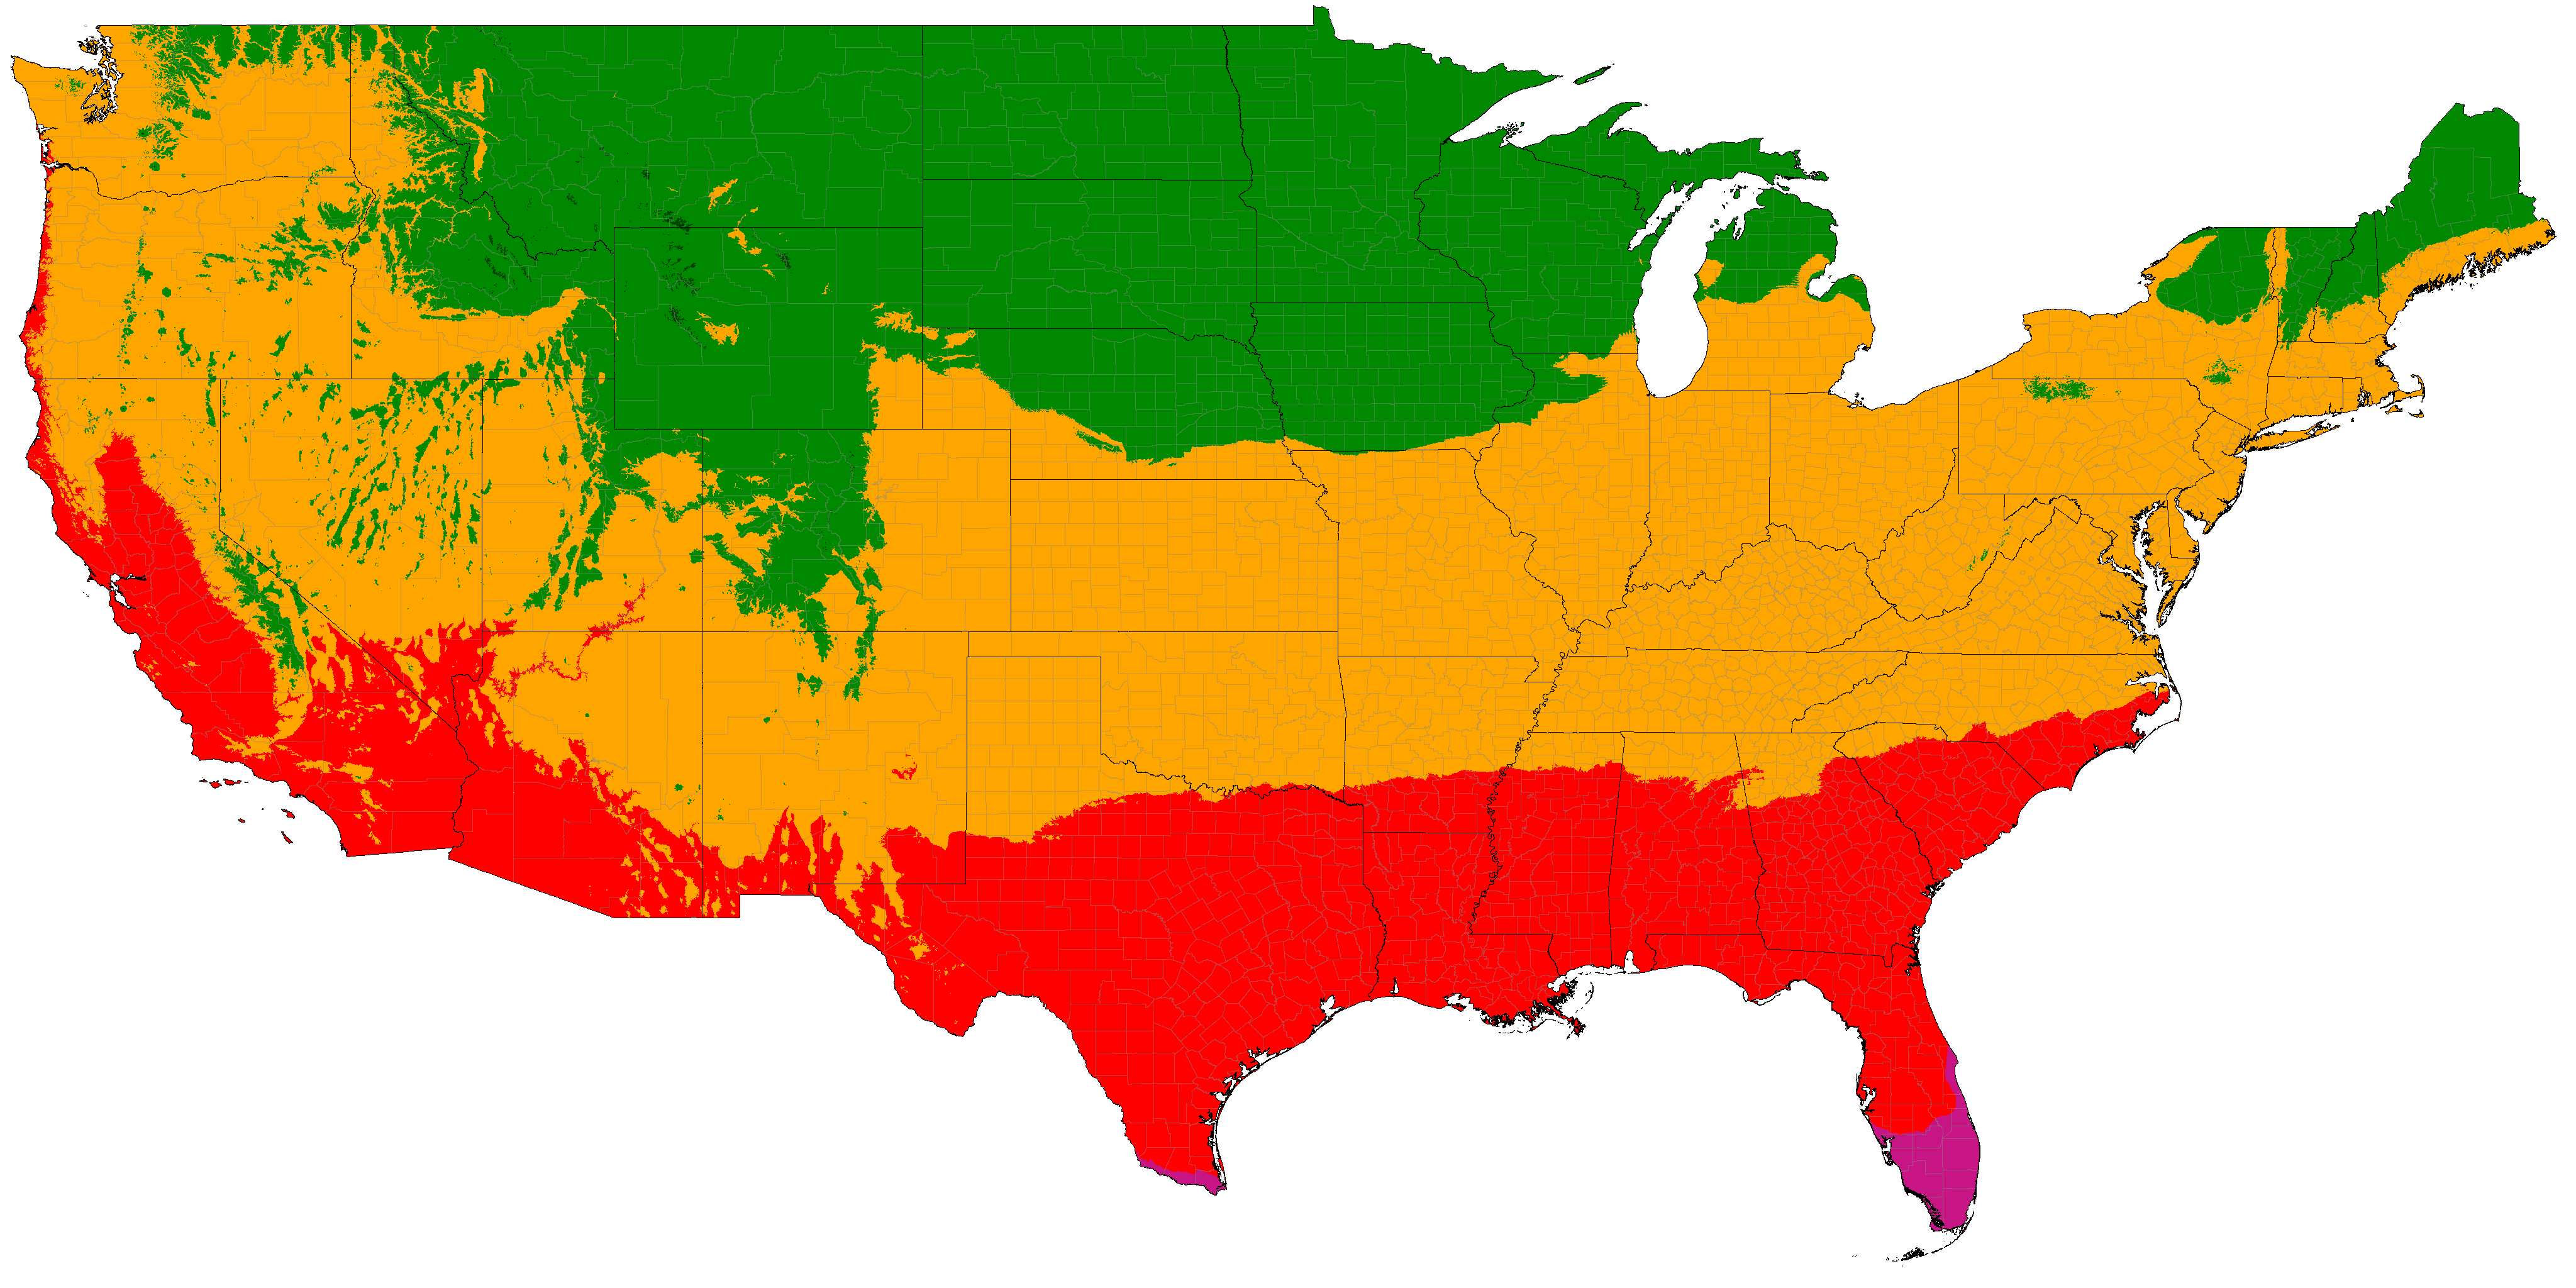
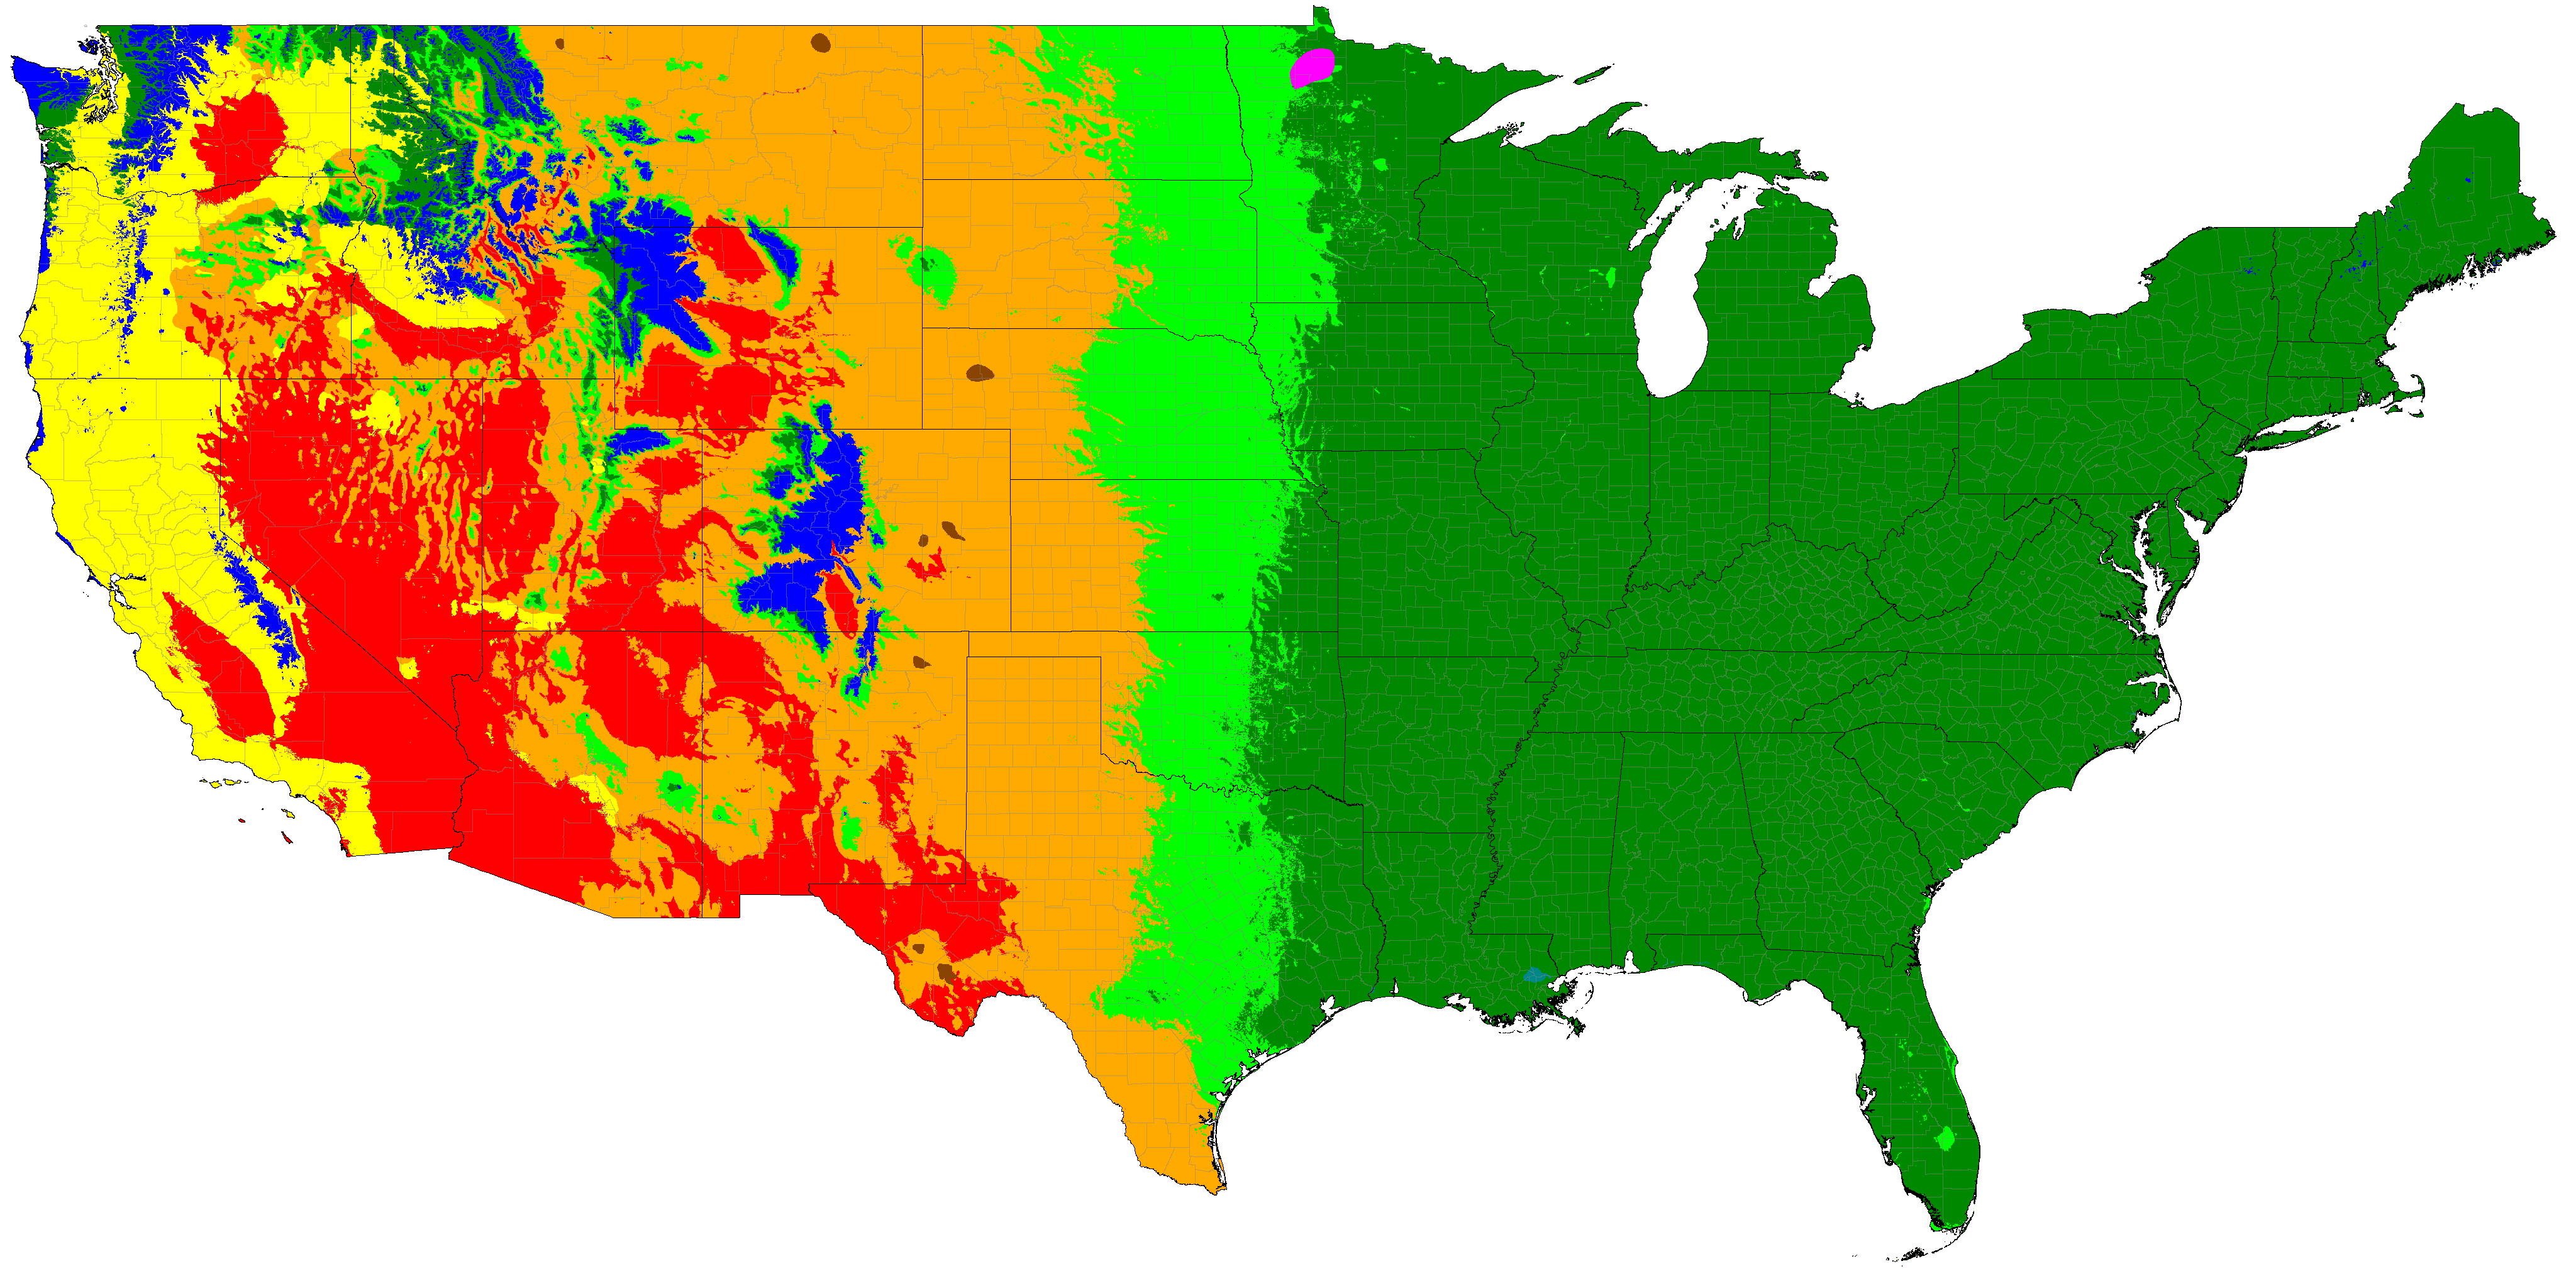
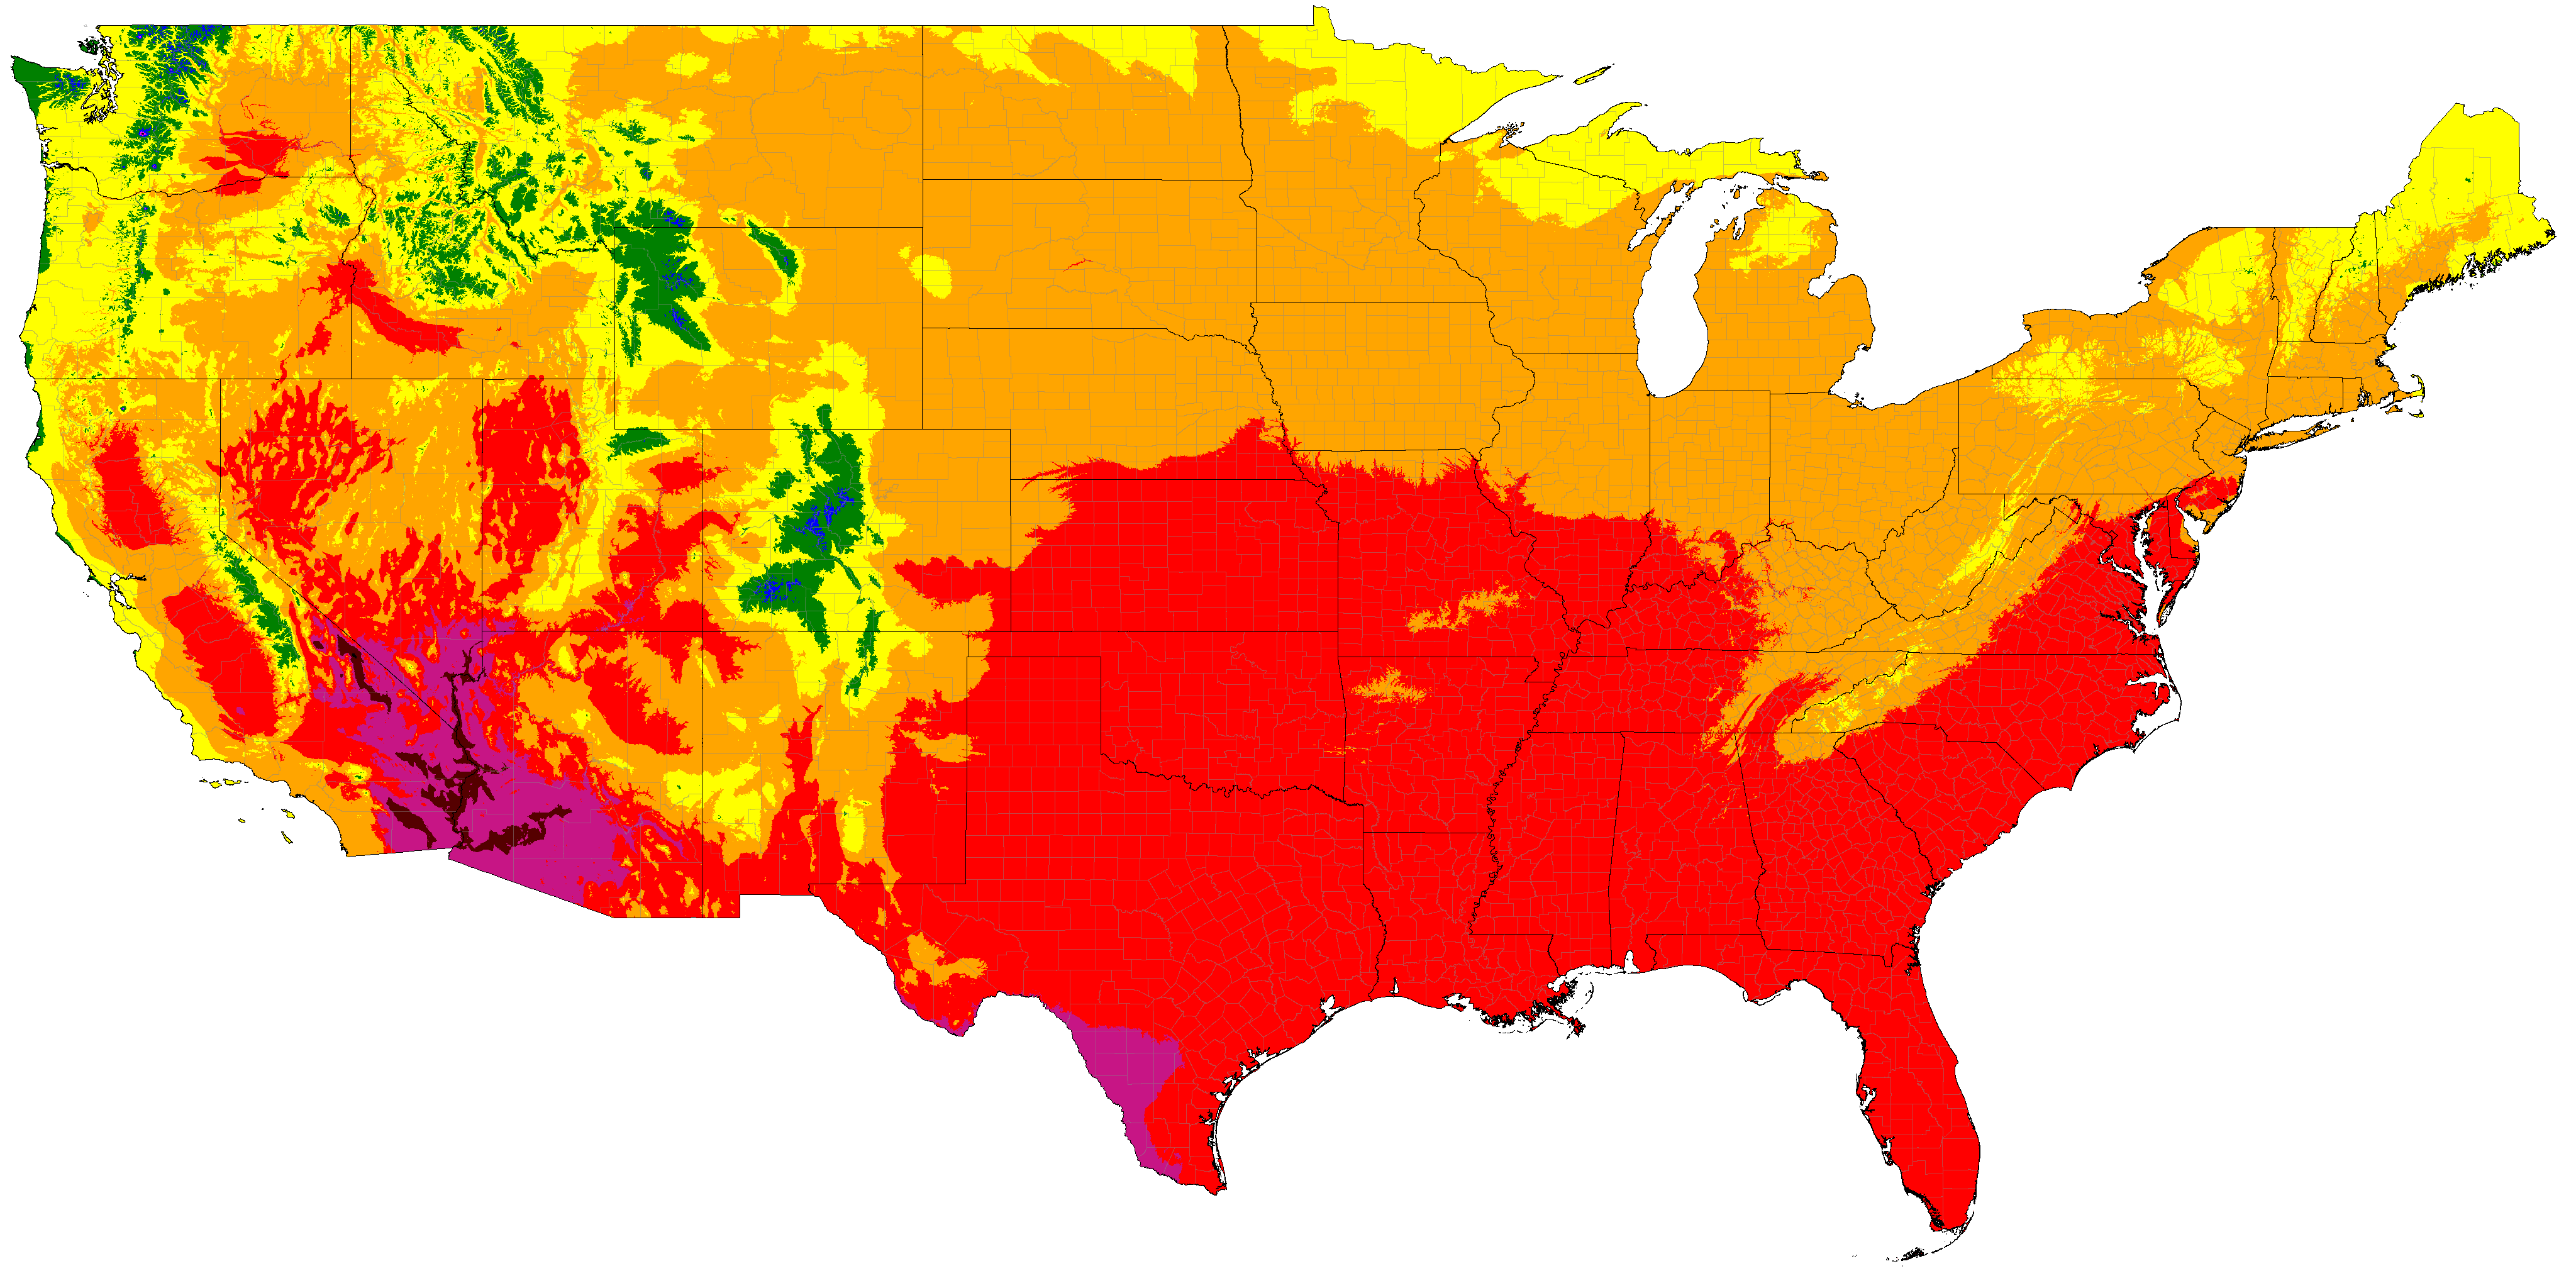
Contiguous United States distribution of classifications (projections are SSP5-8.5 high emissions normals)
Note: Due to the complexity of the system, only the most common climates in each map are labeled.
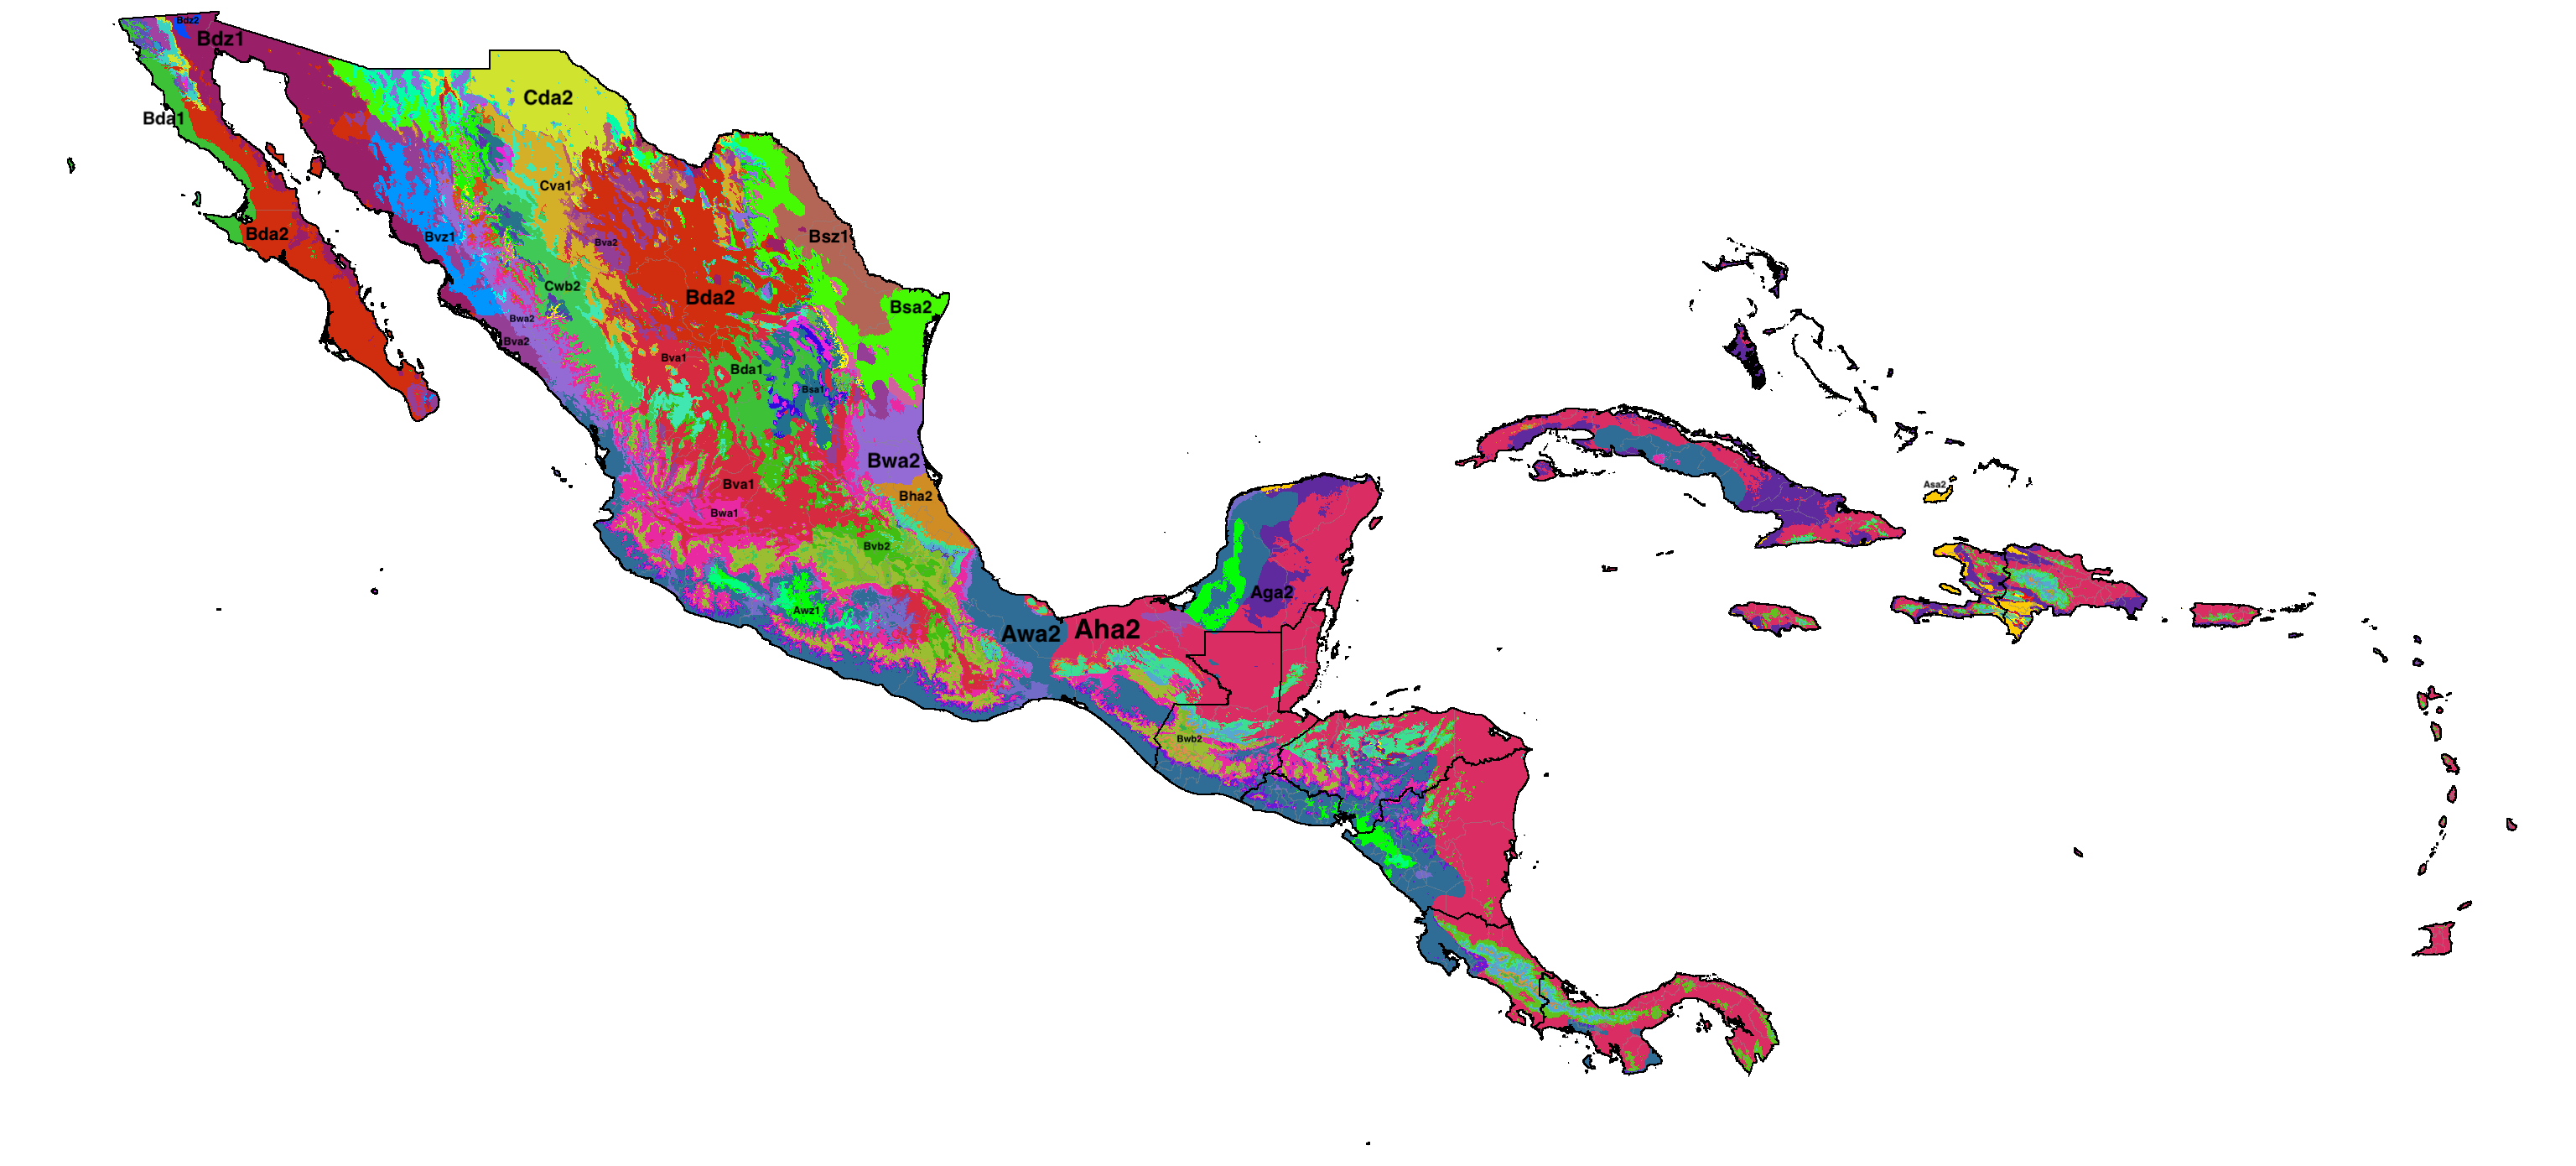
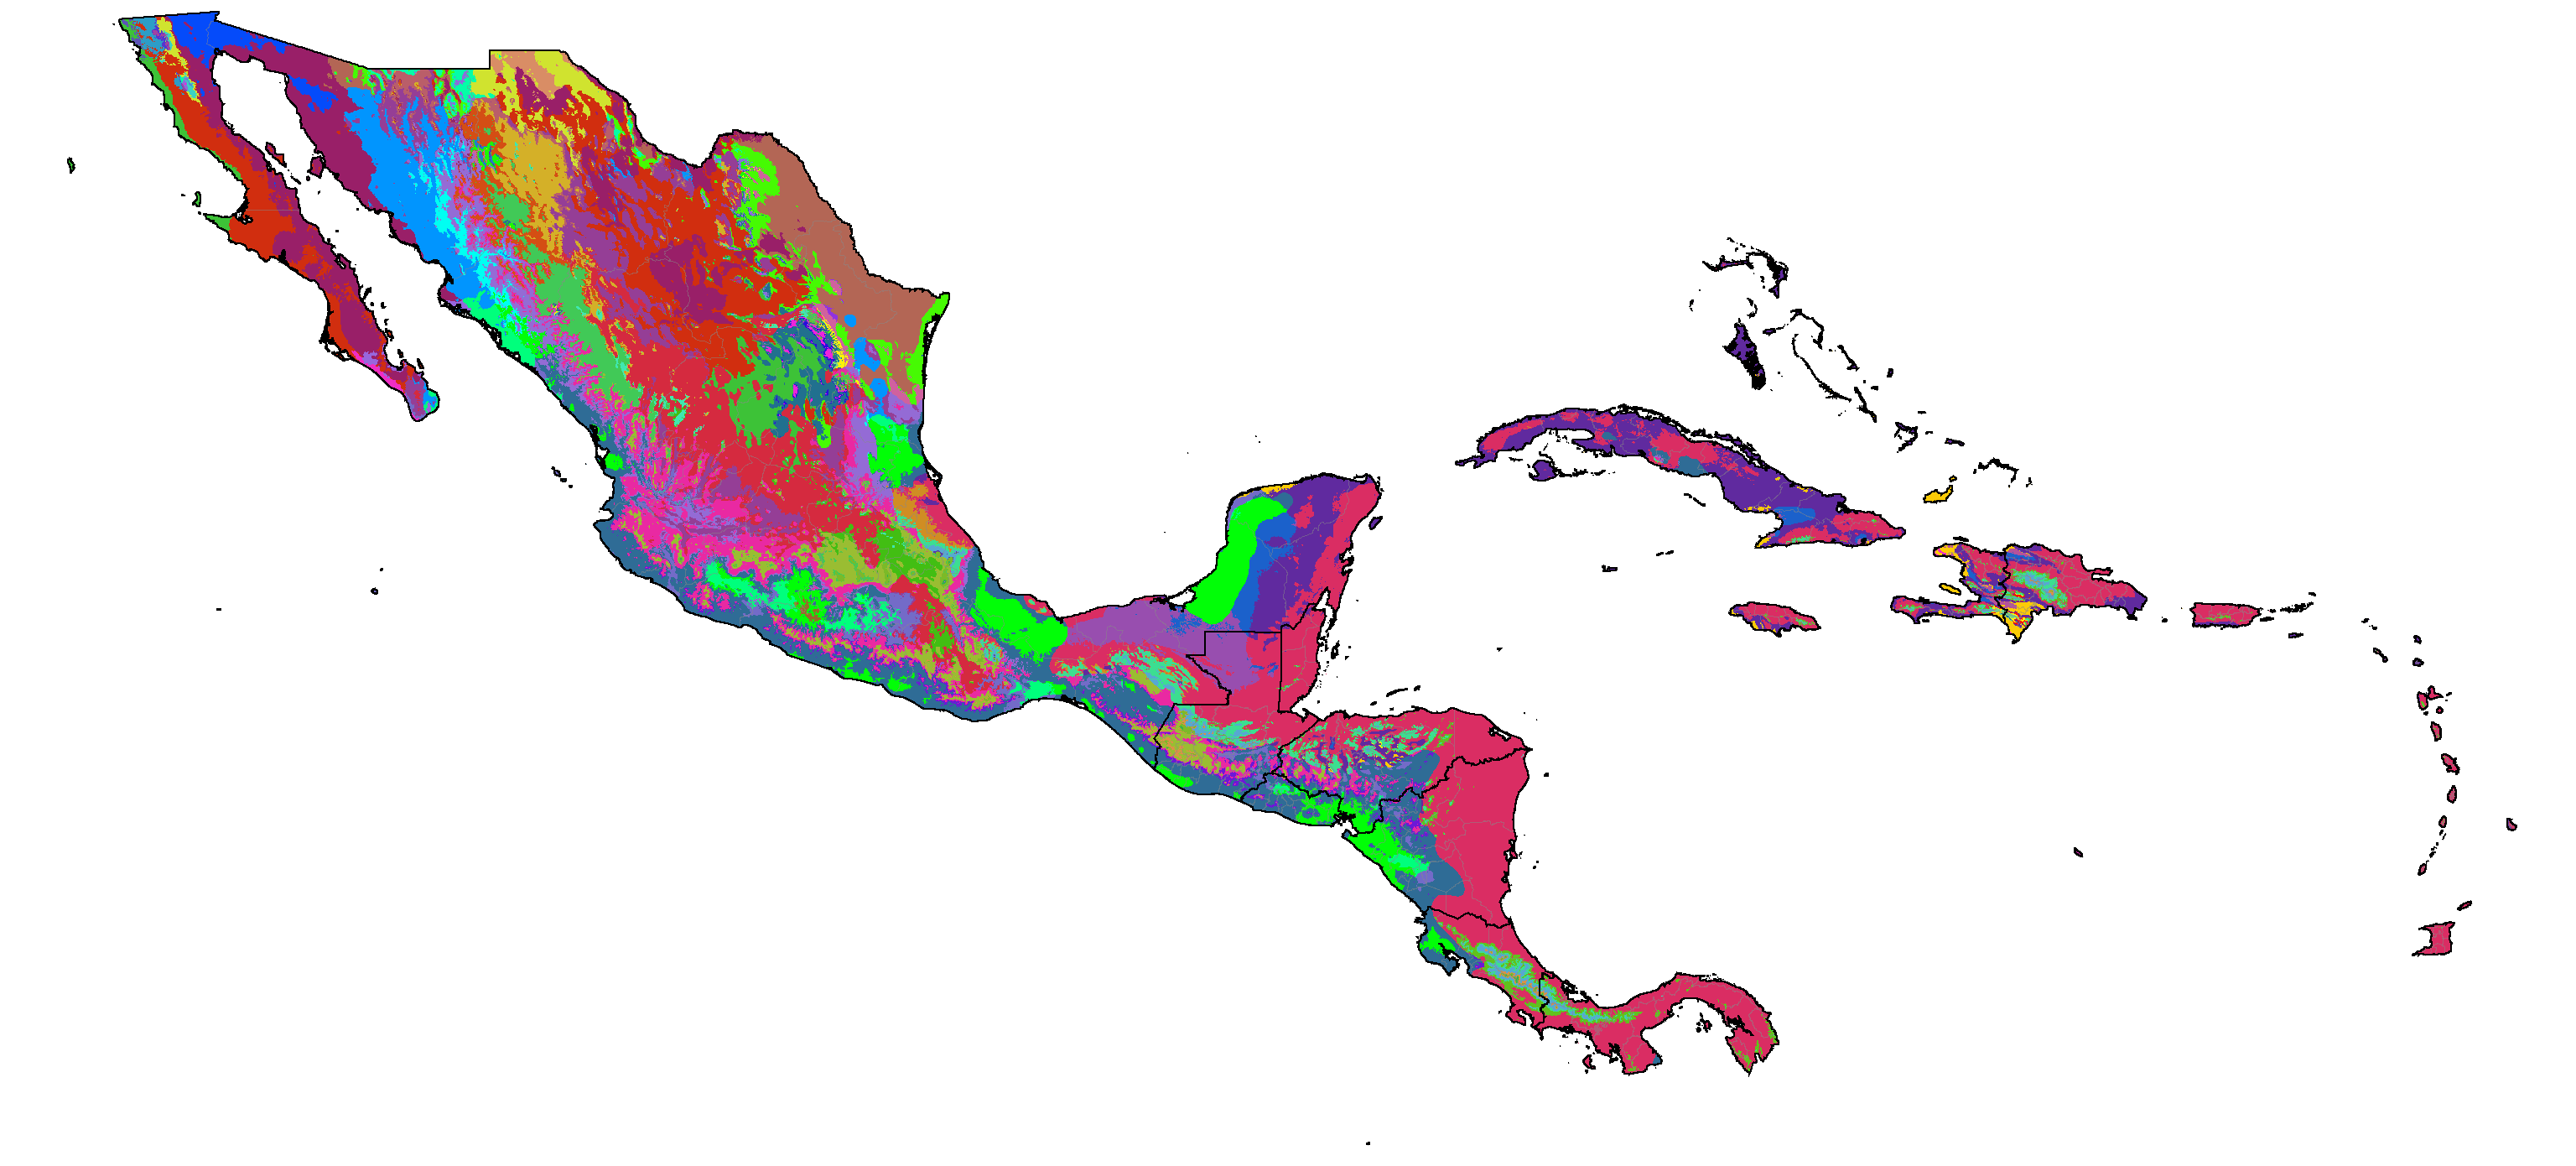
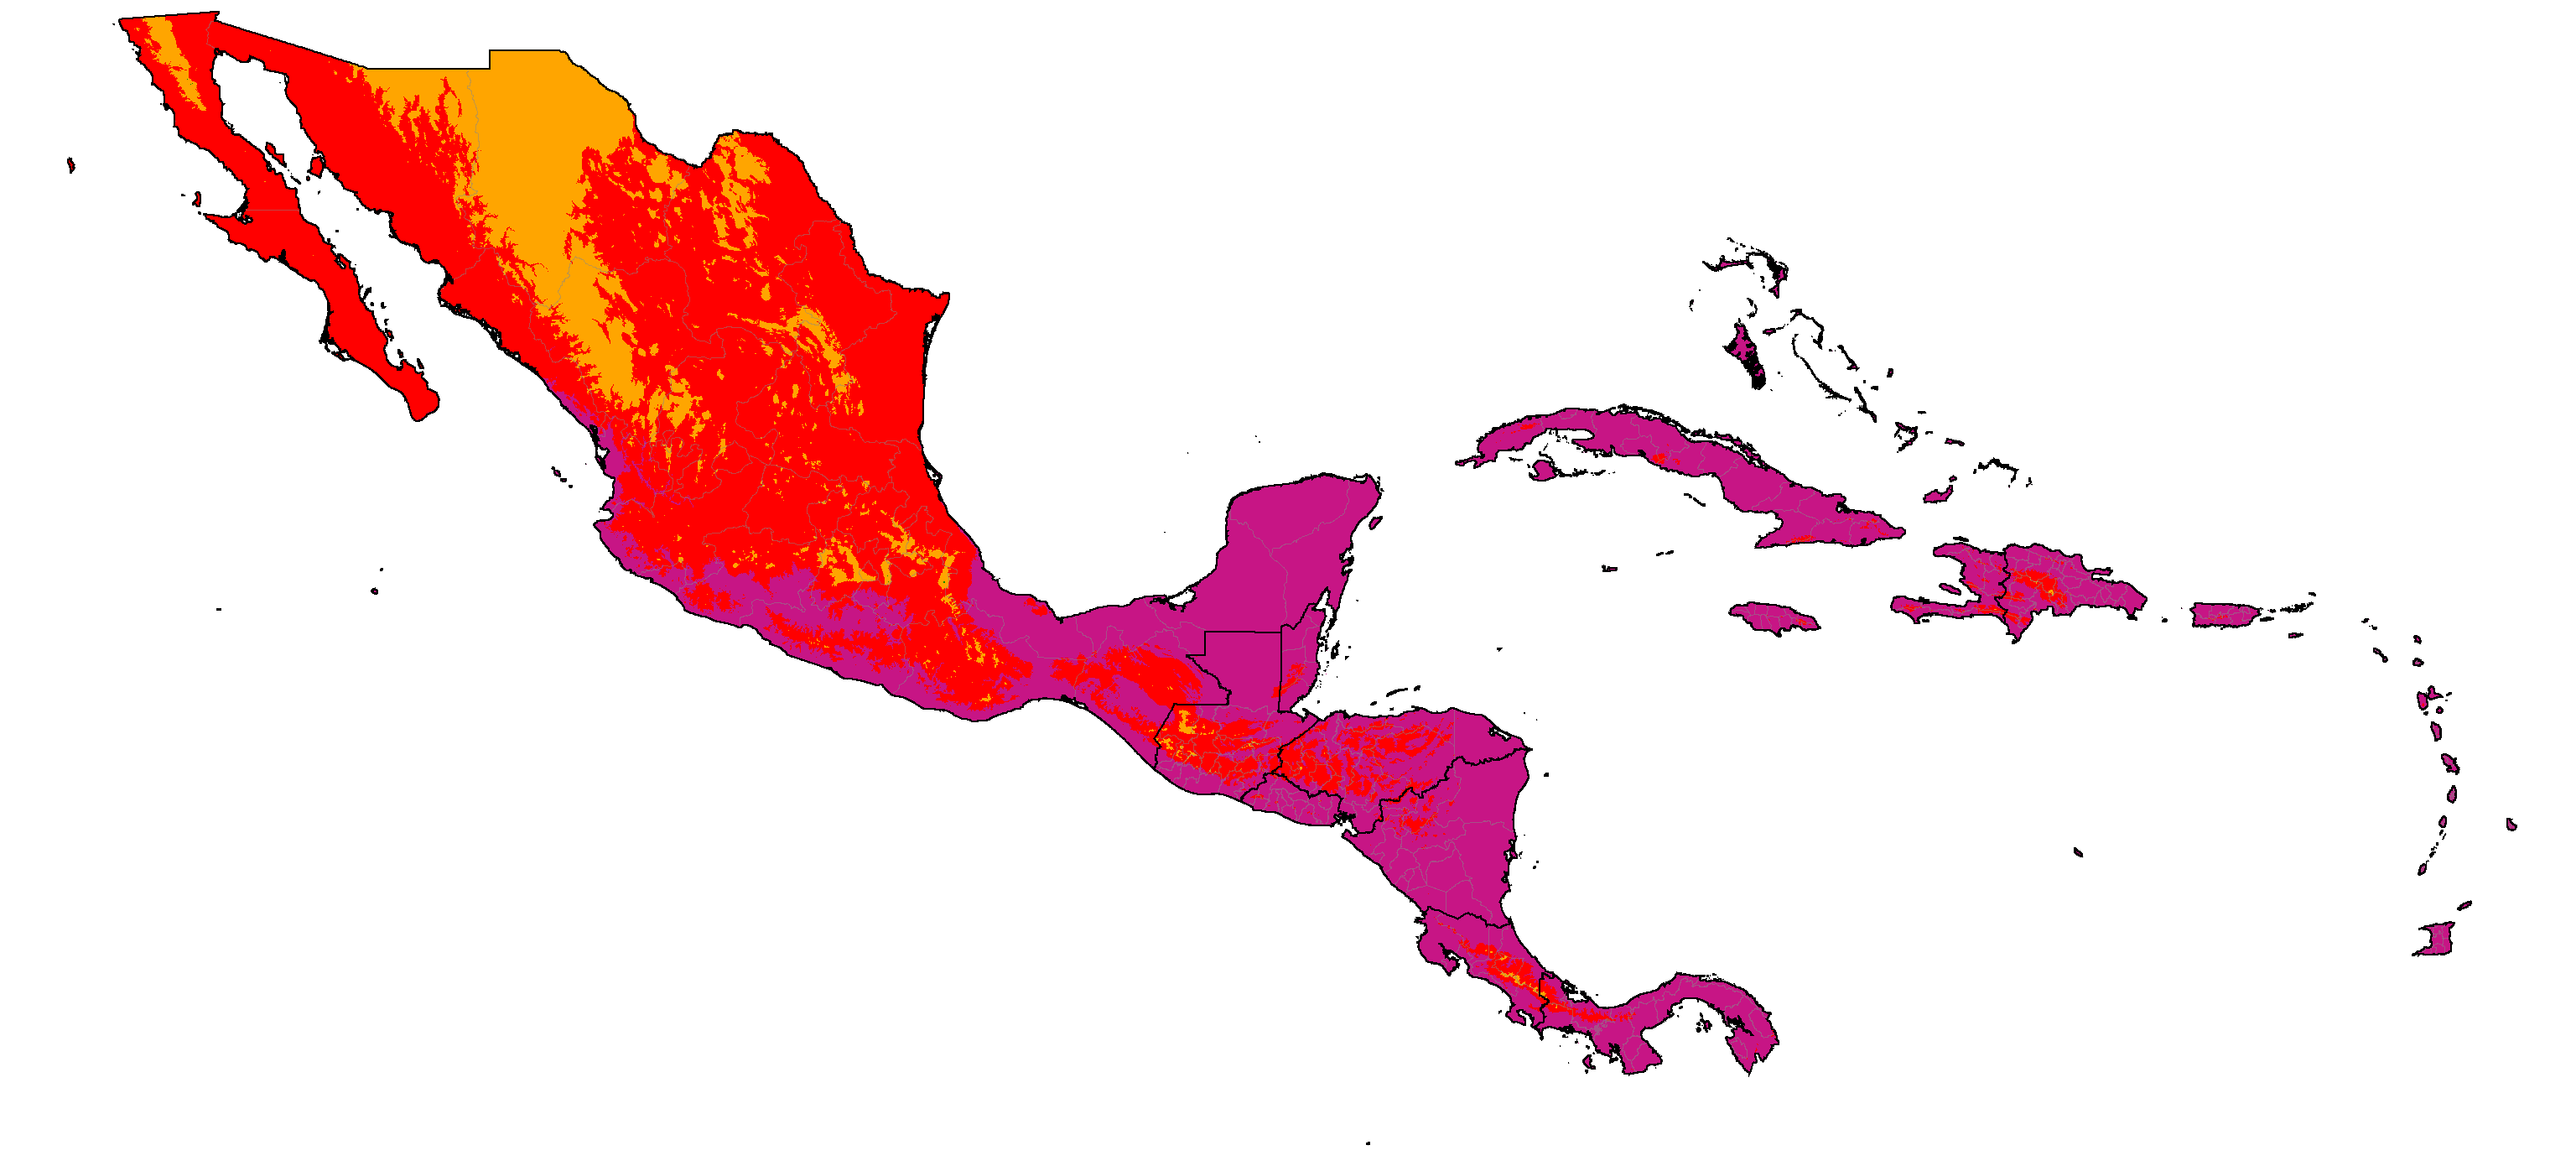
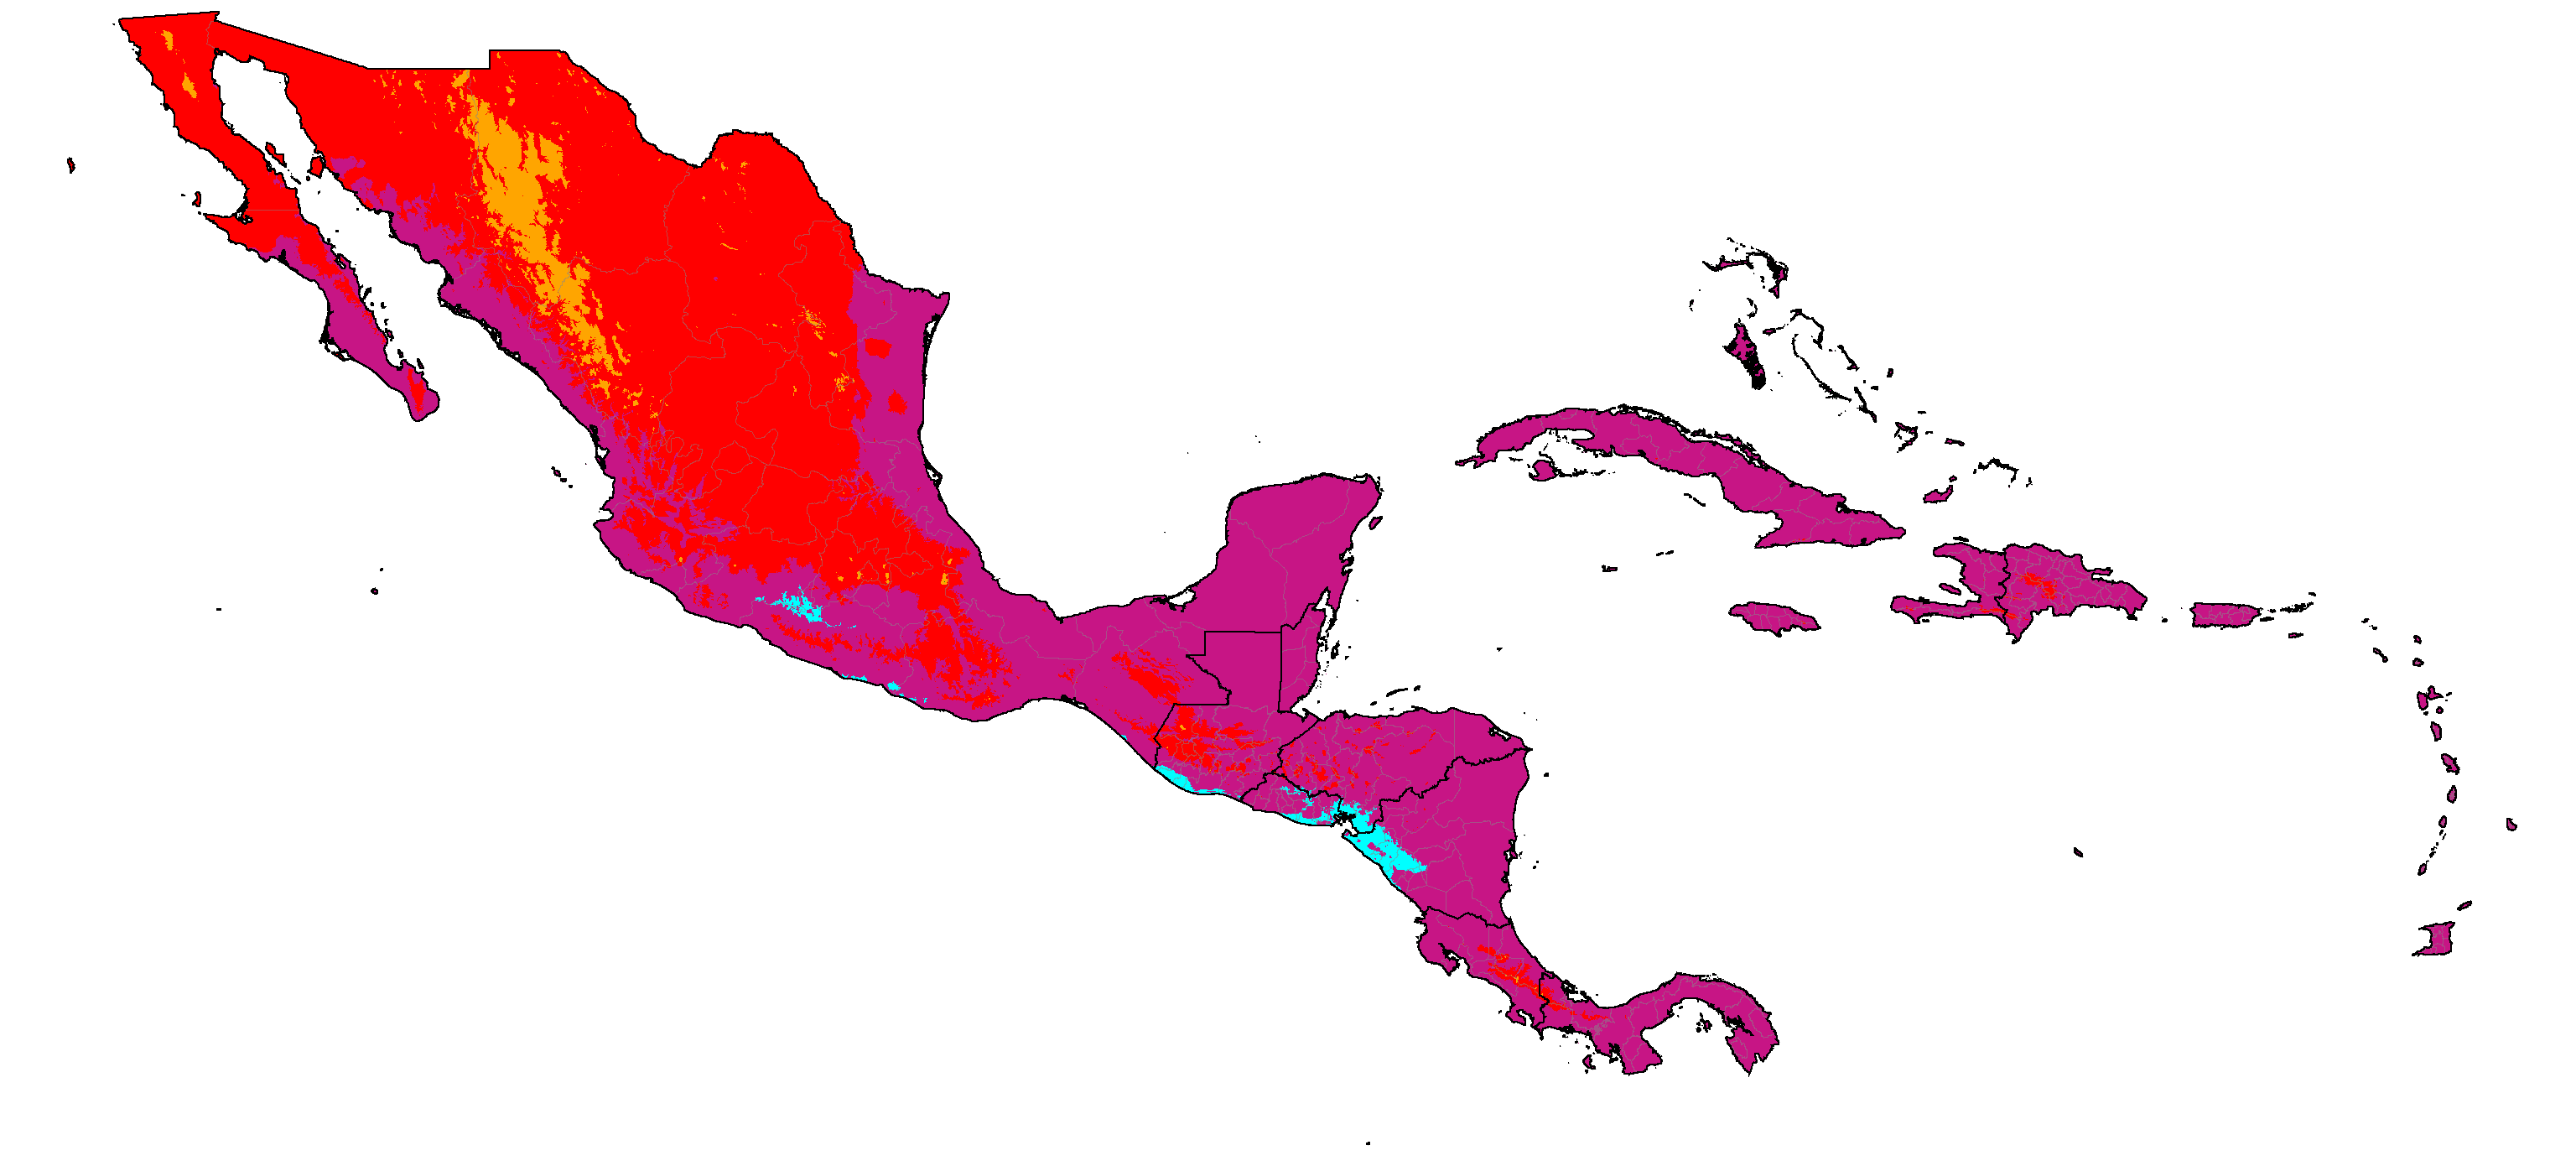
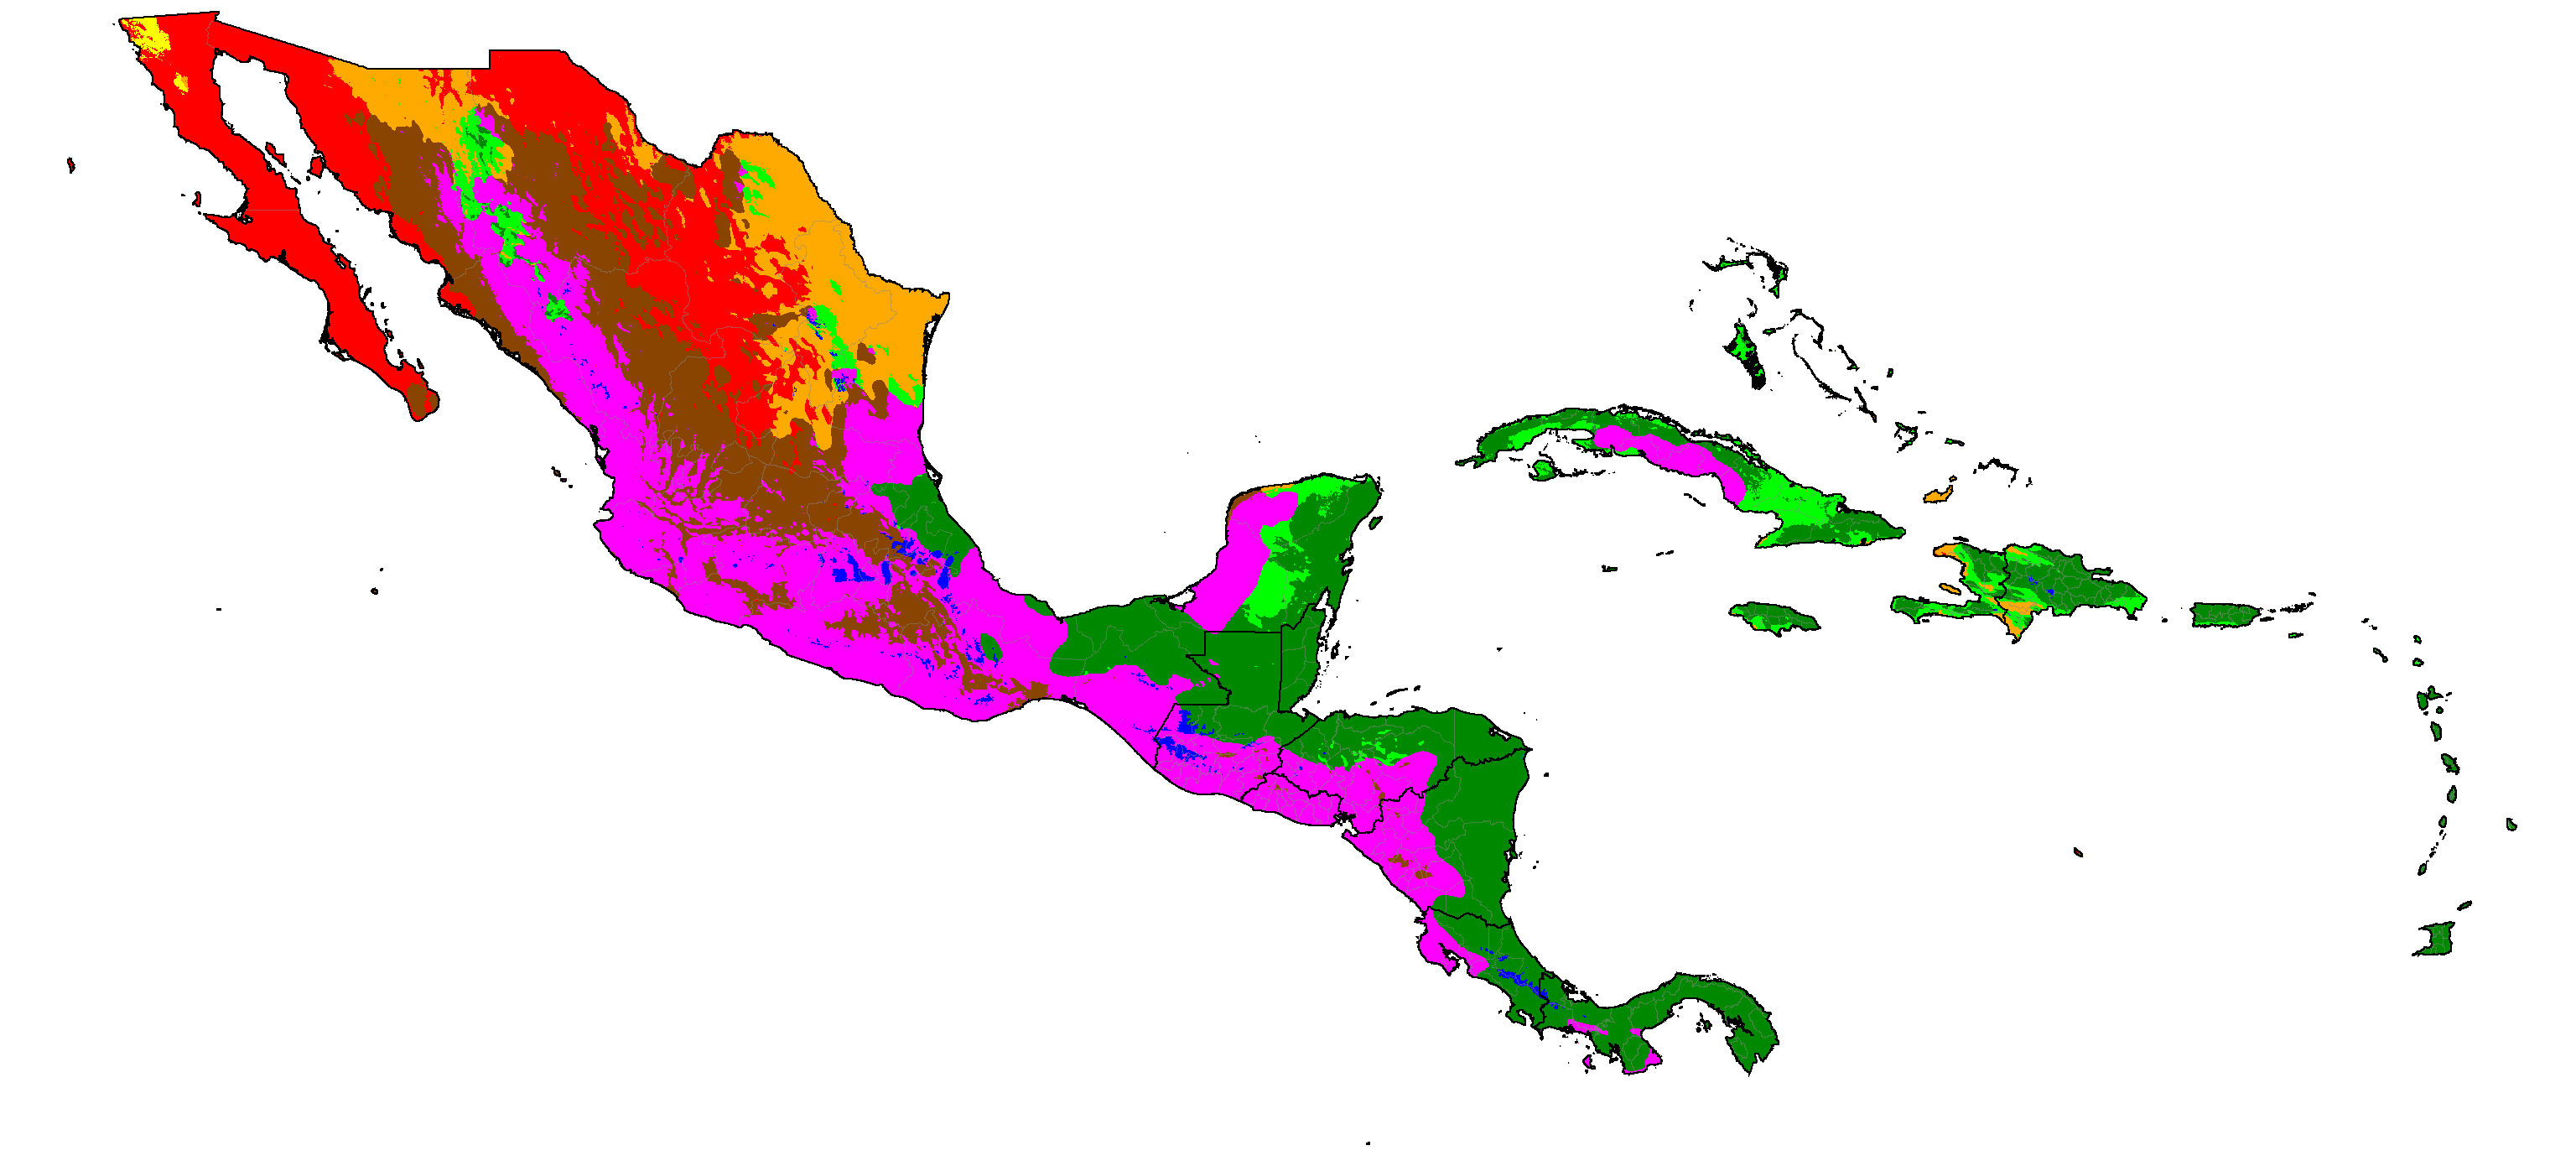
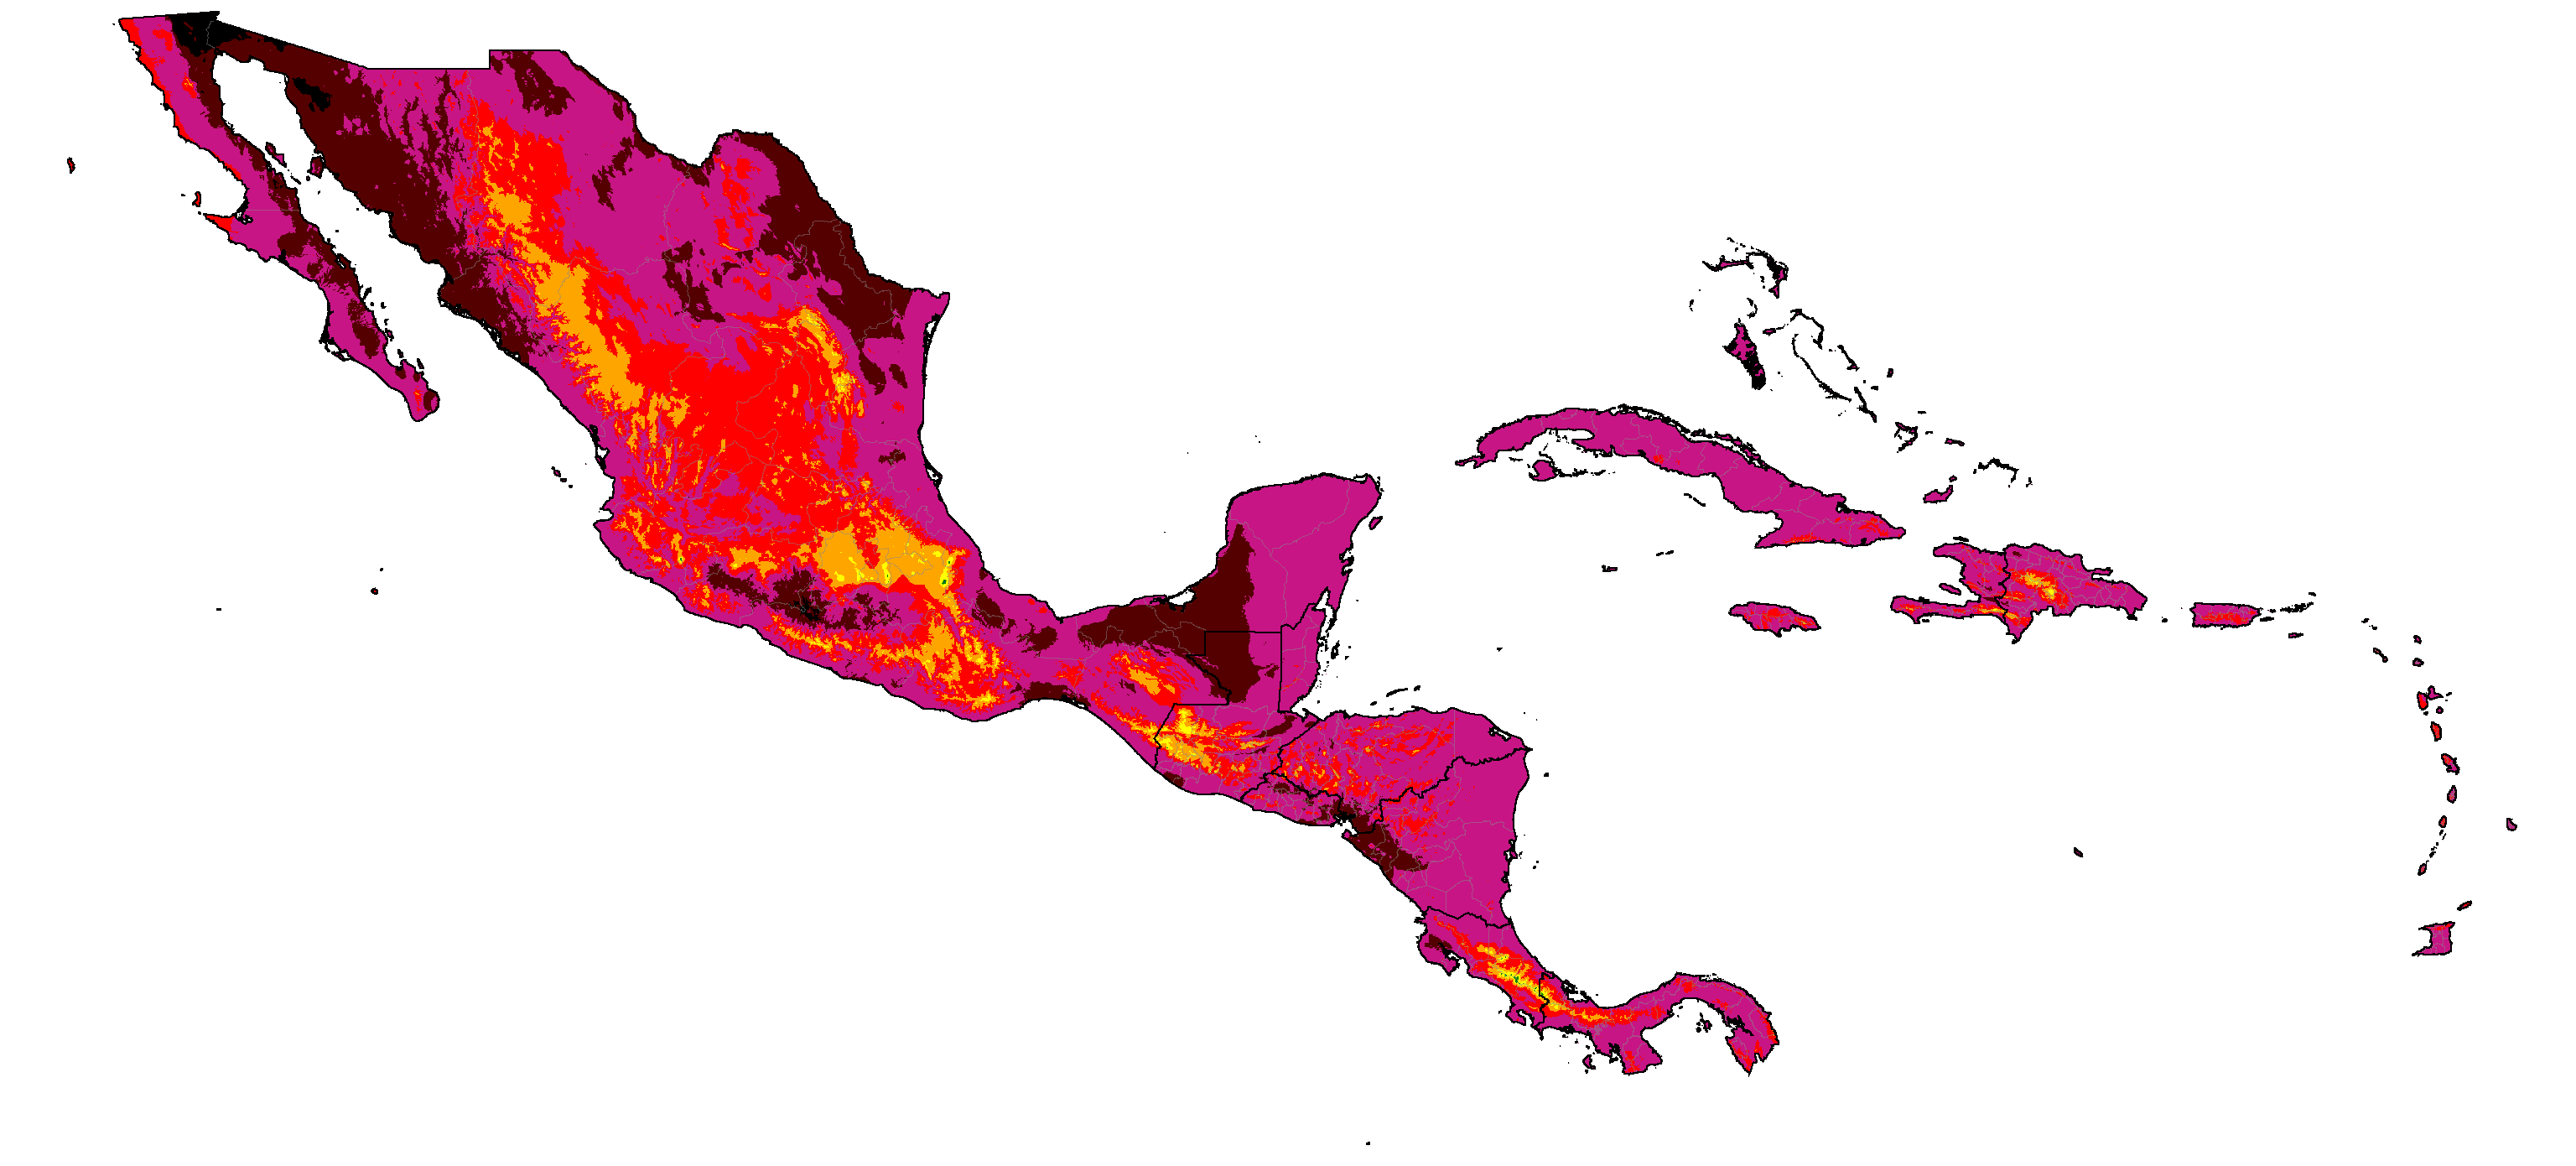
Mexico, Central America & the Carribean distribution of classifications (projections are SSP5-8.5 high emissions normals)
Note: Due to the complexity of the system, only the most common climates in each map are labeled.
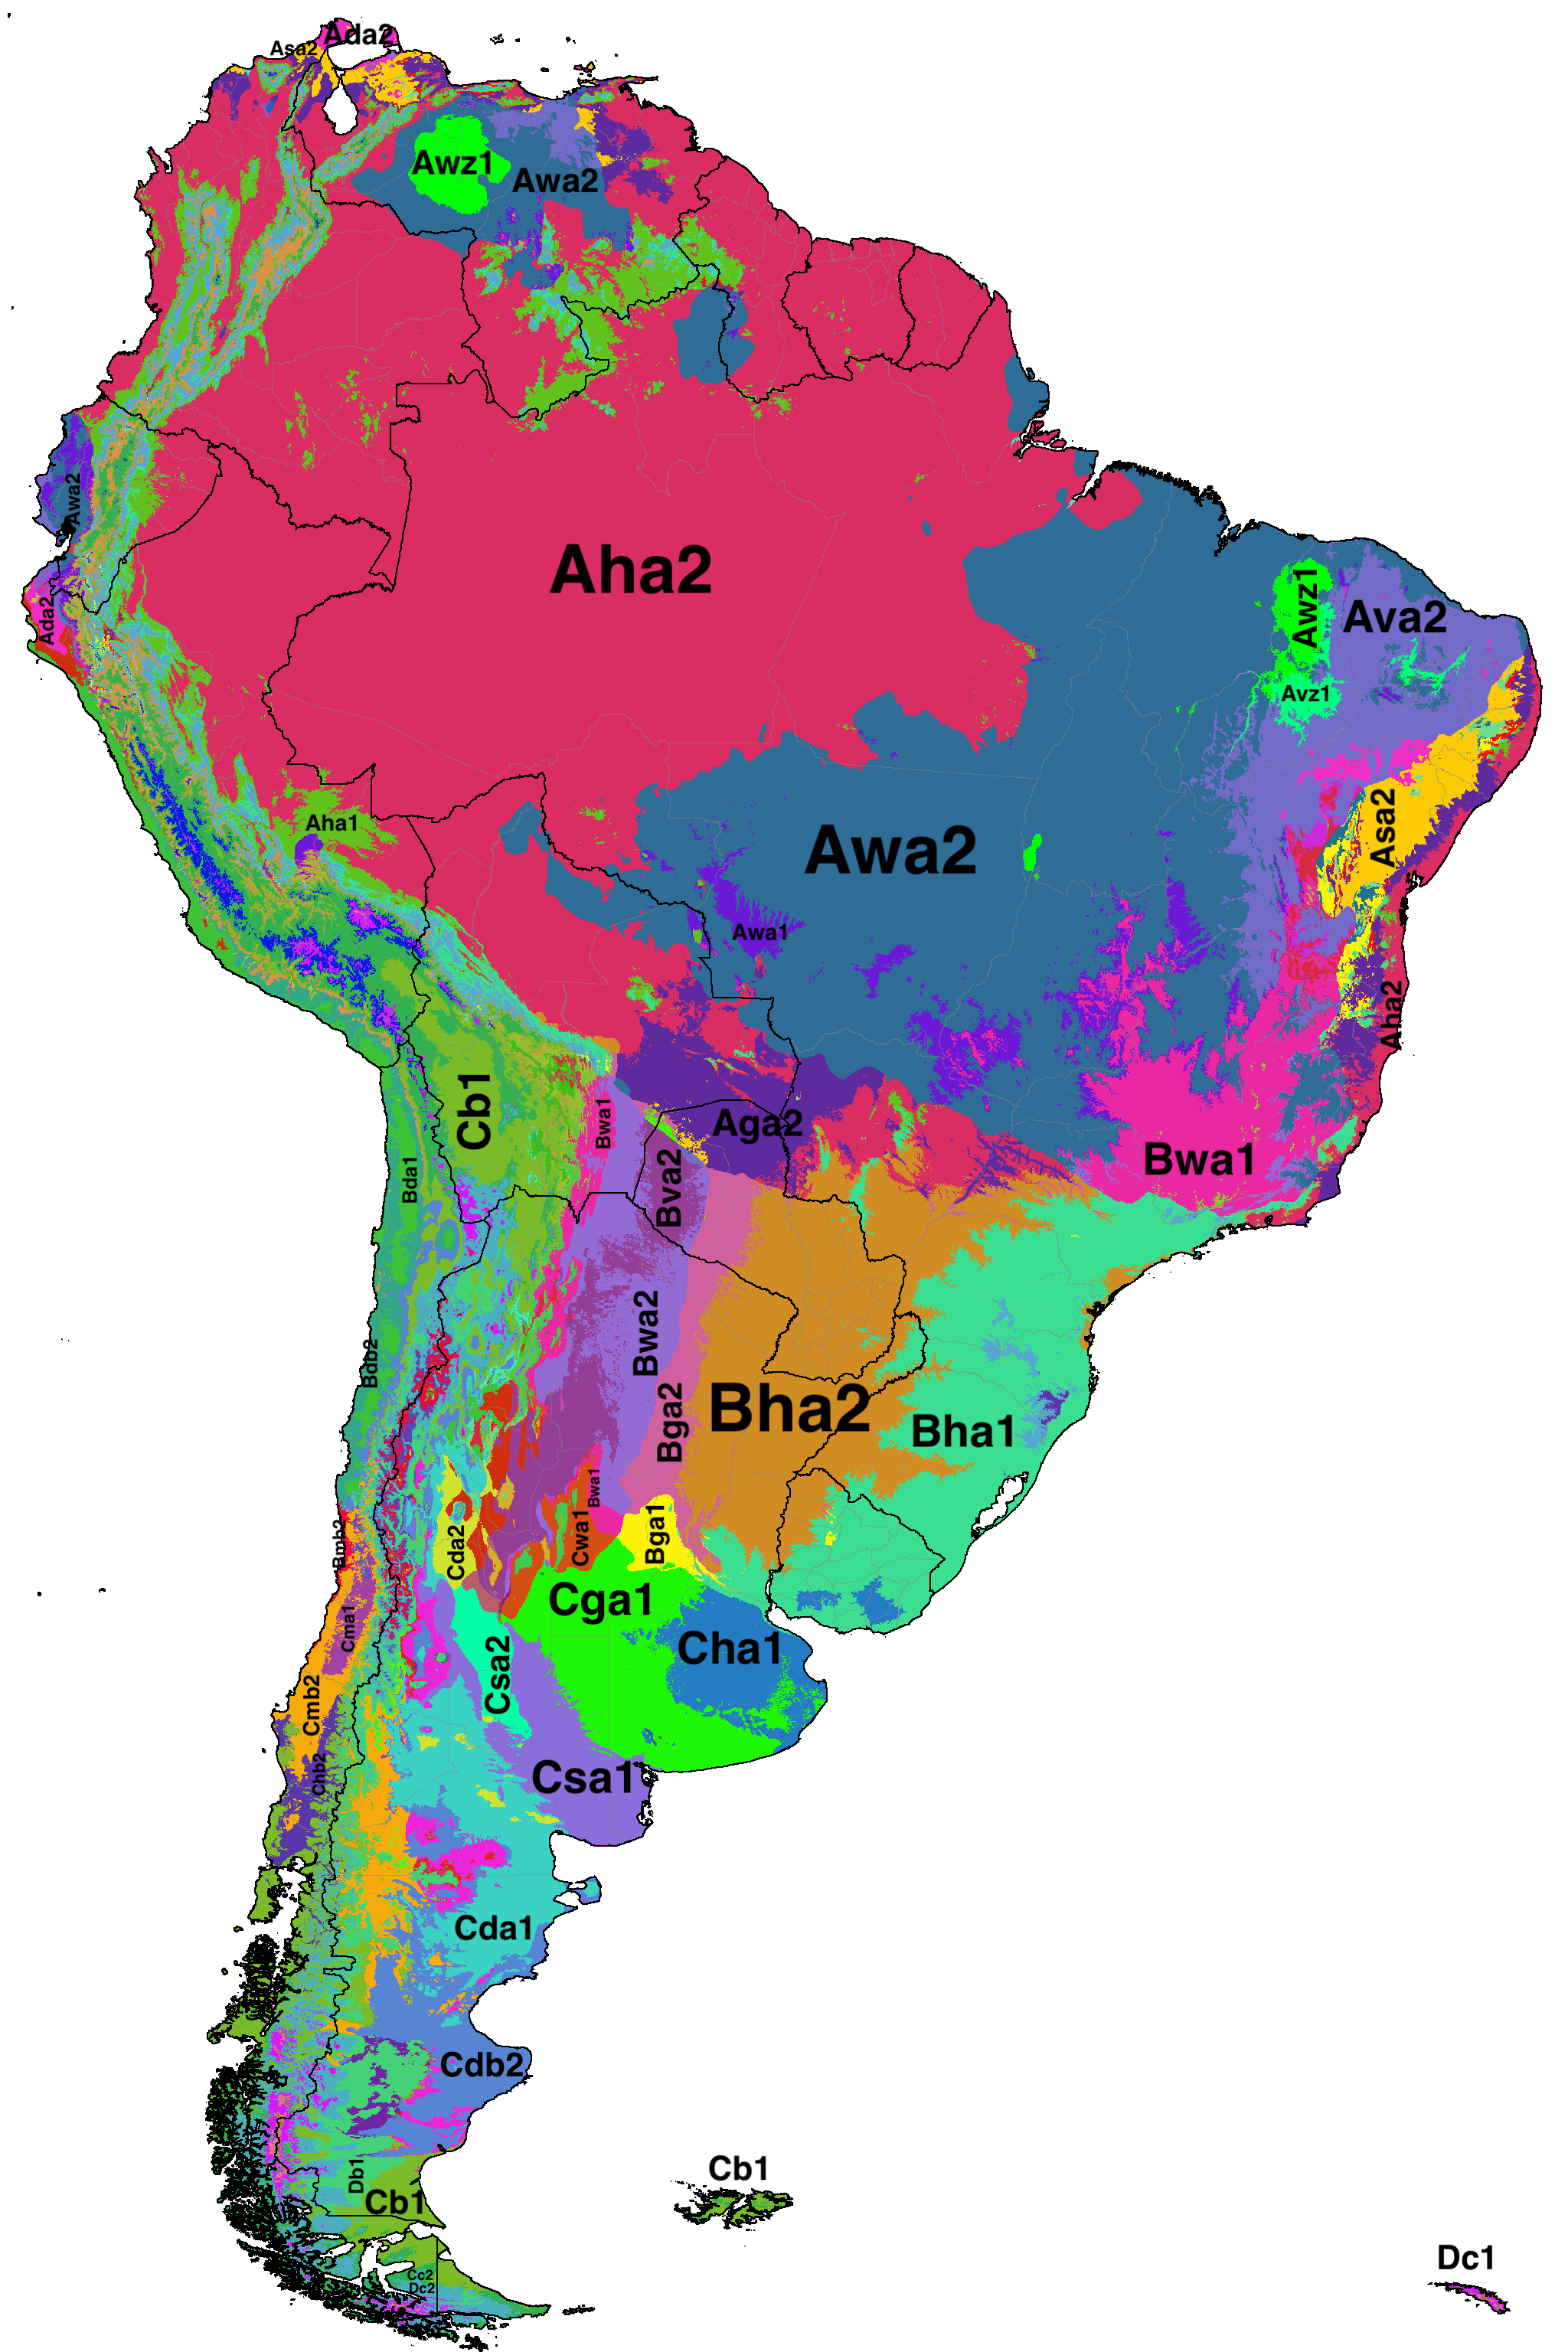
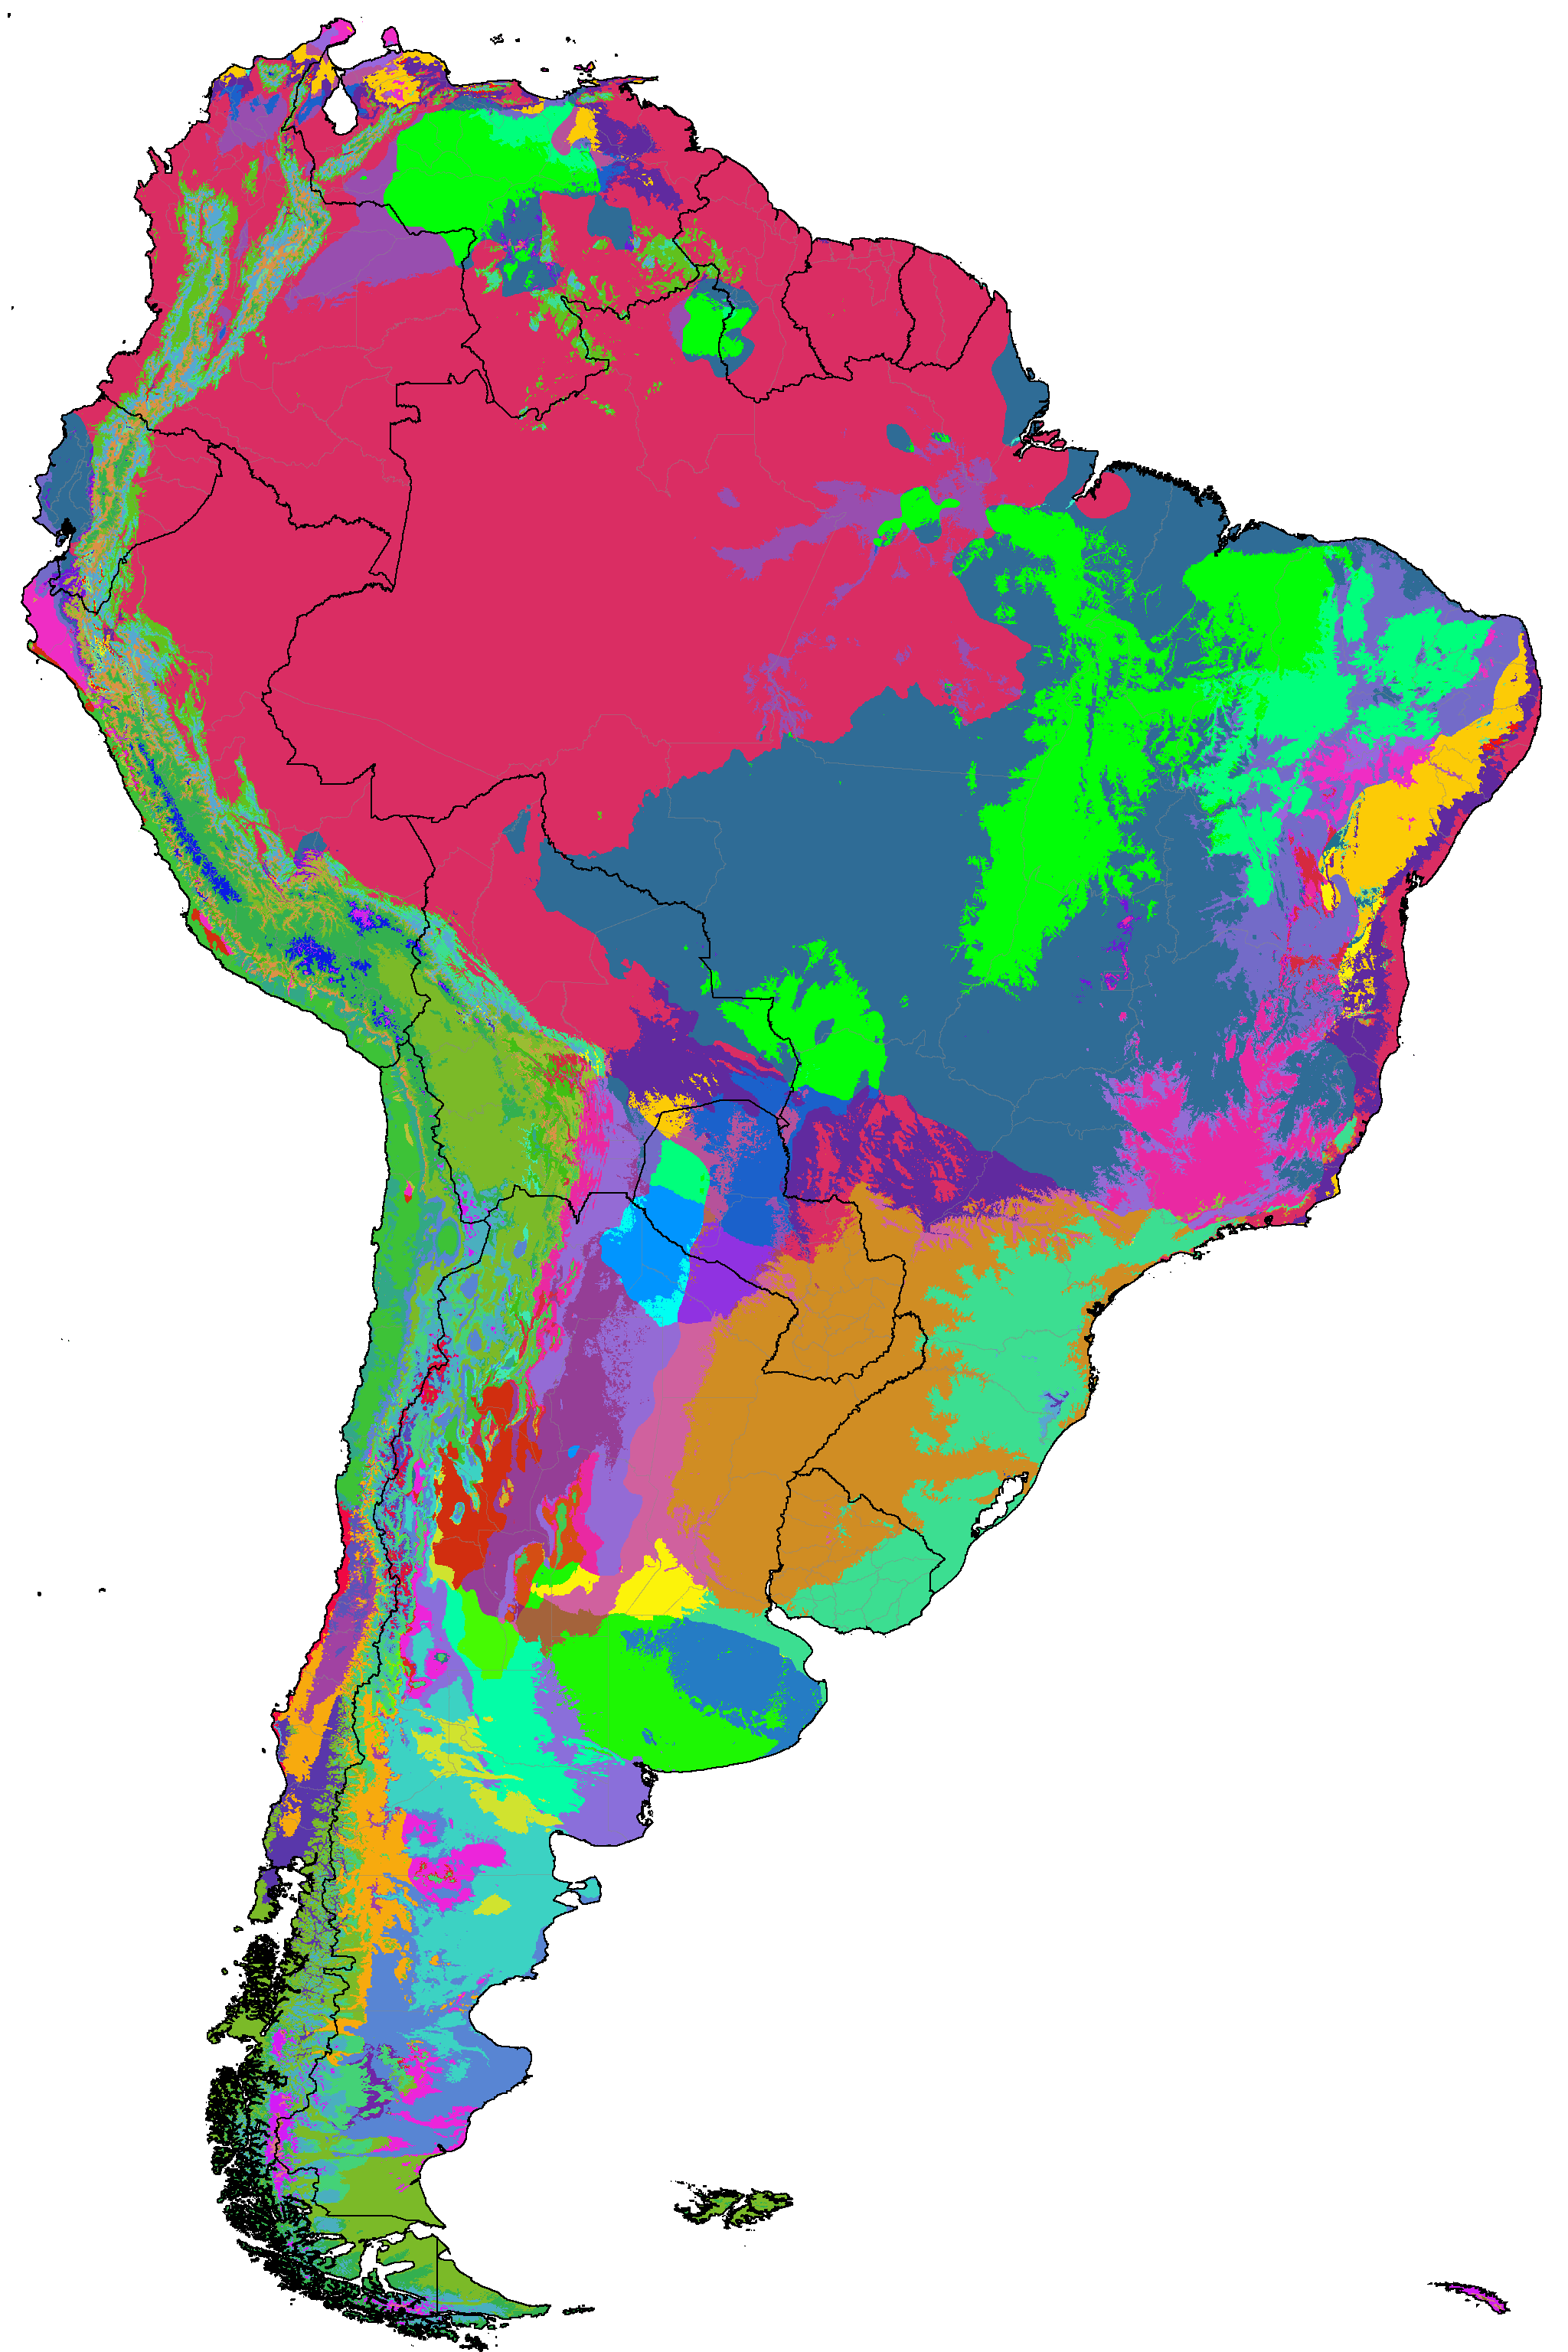
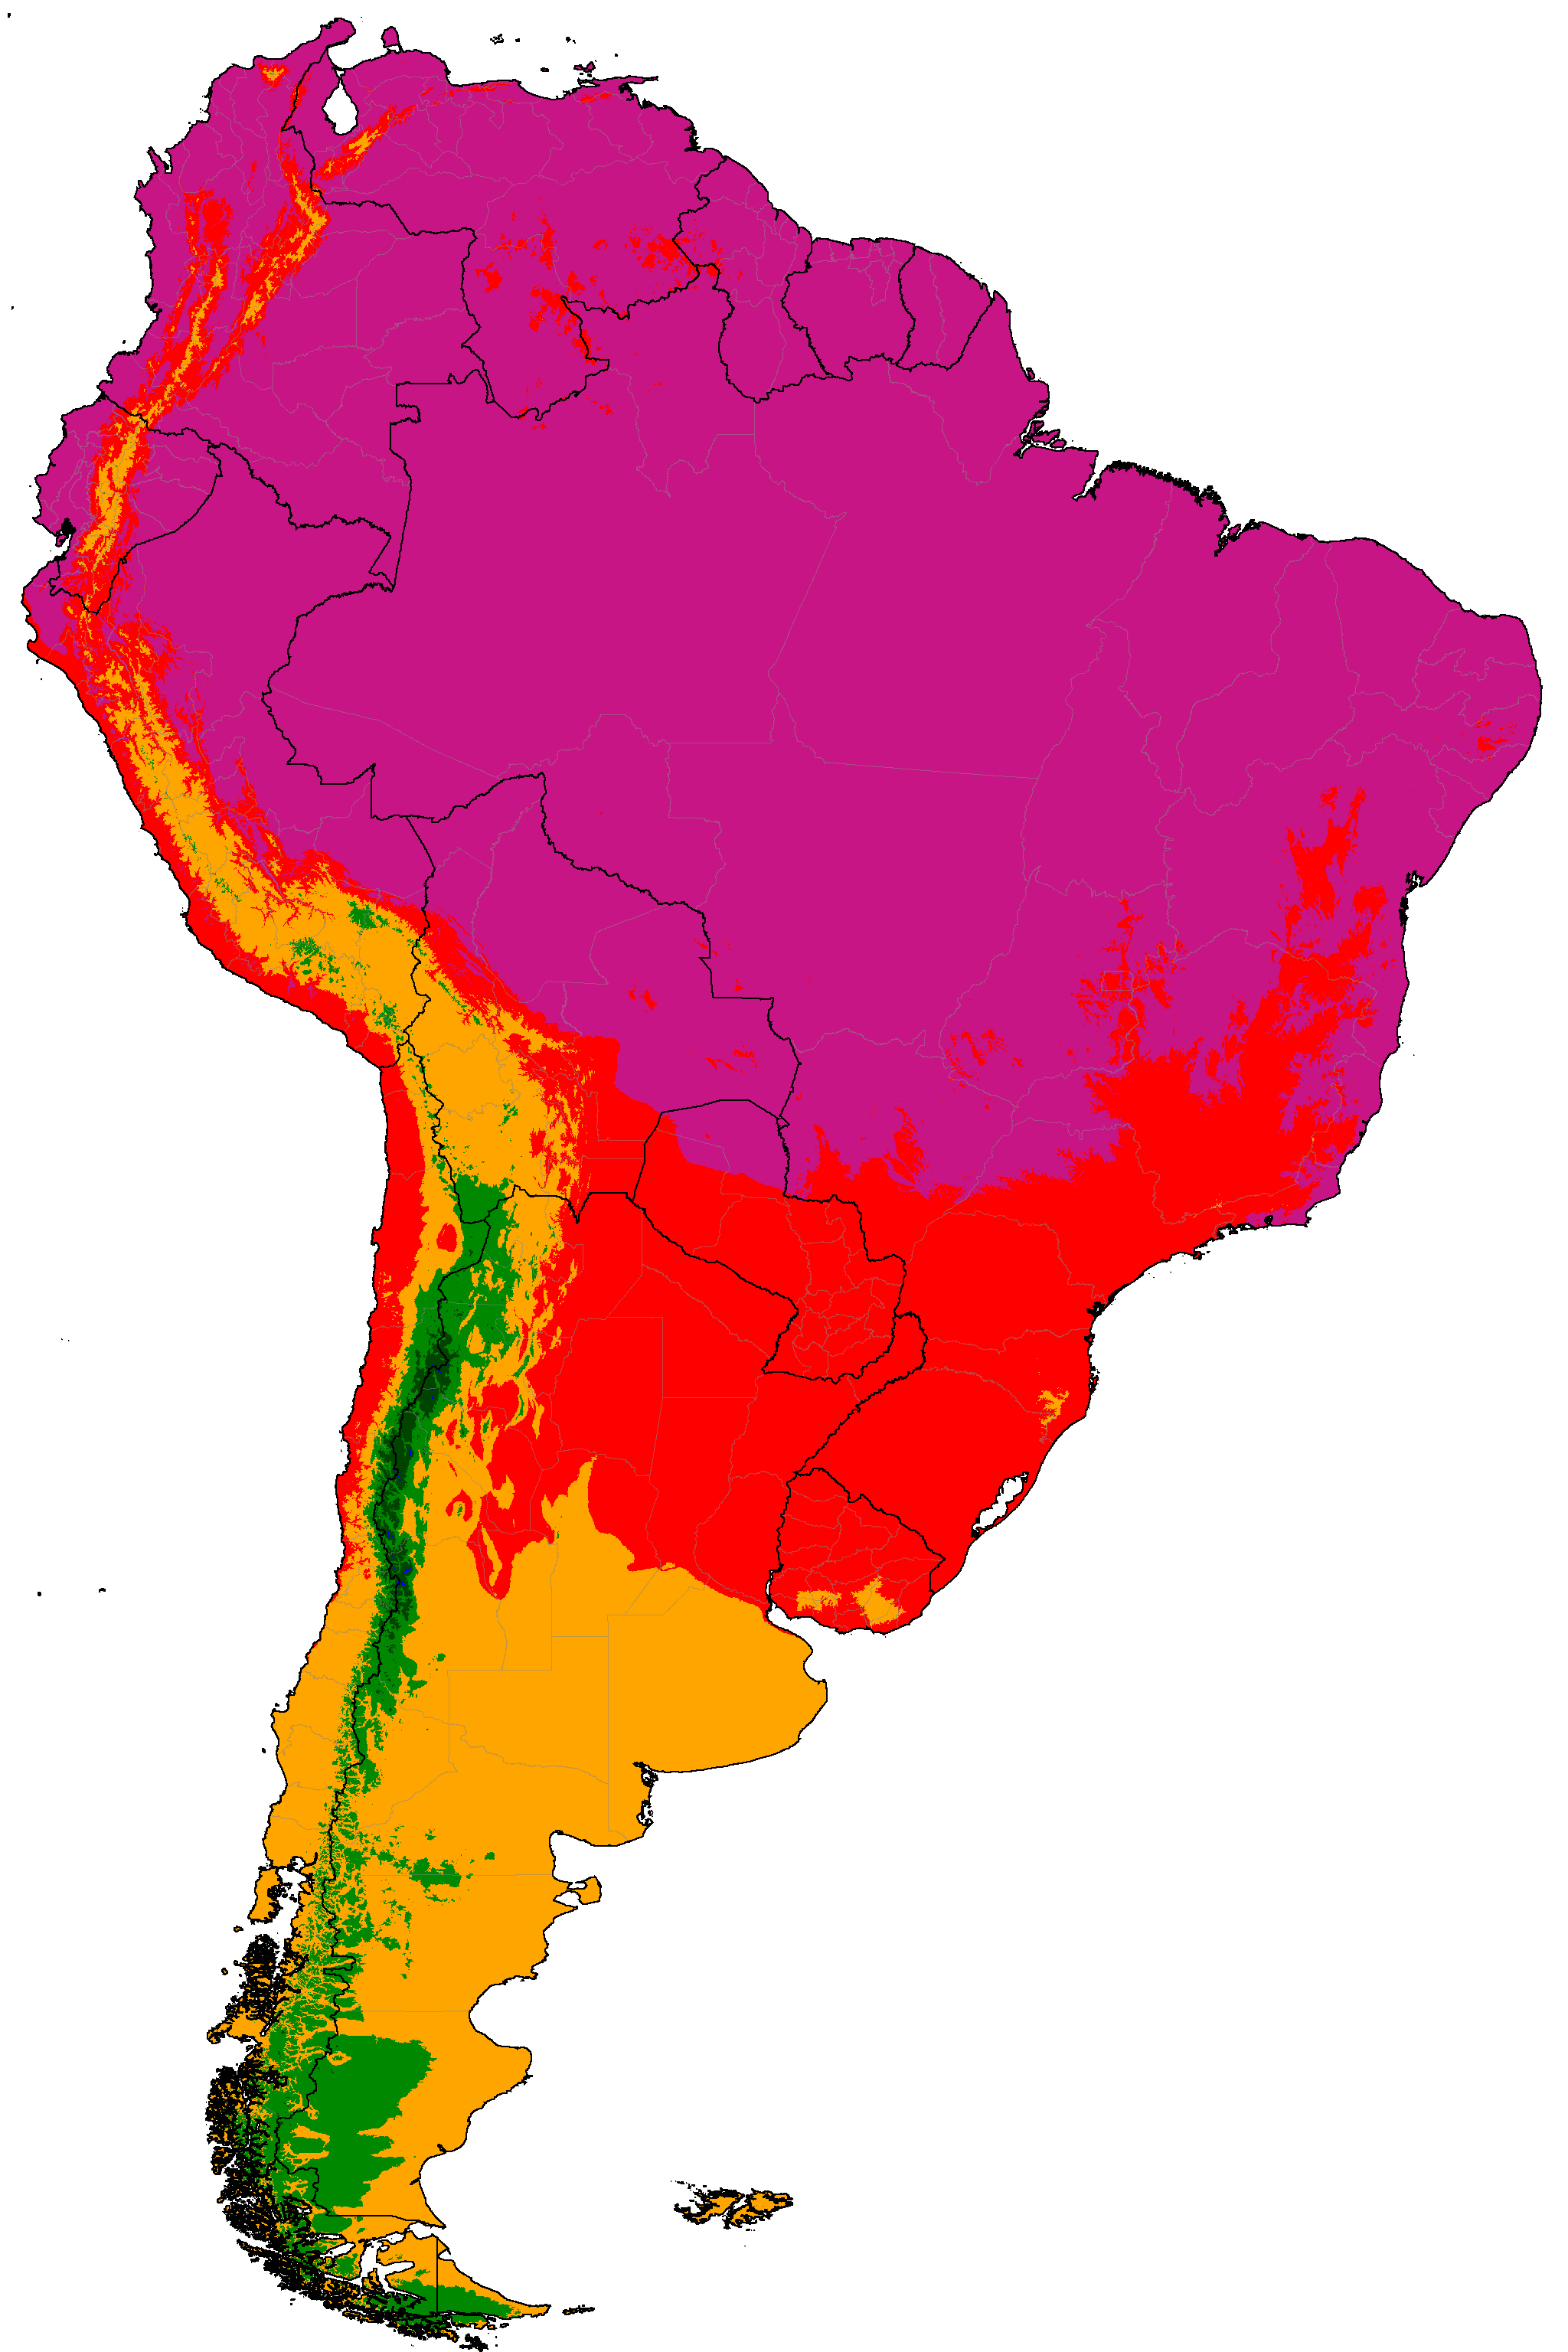
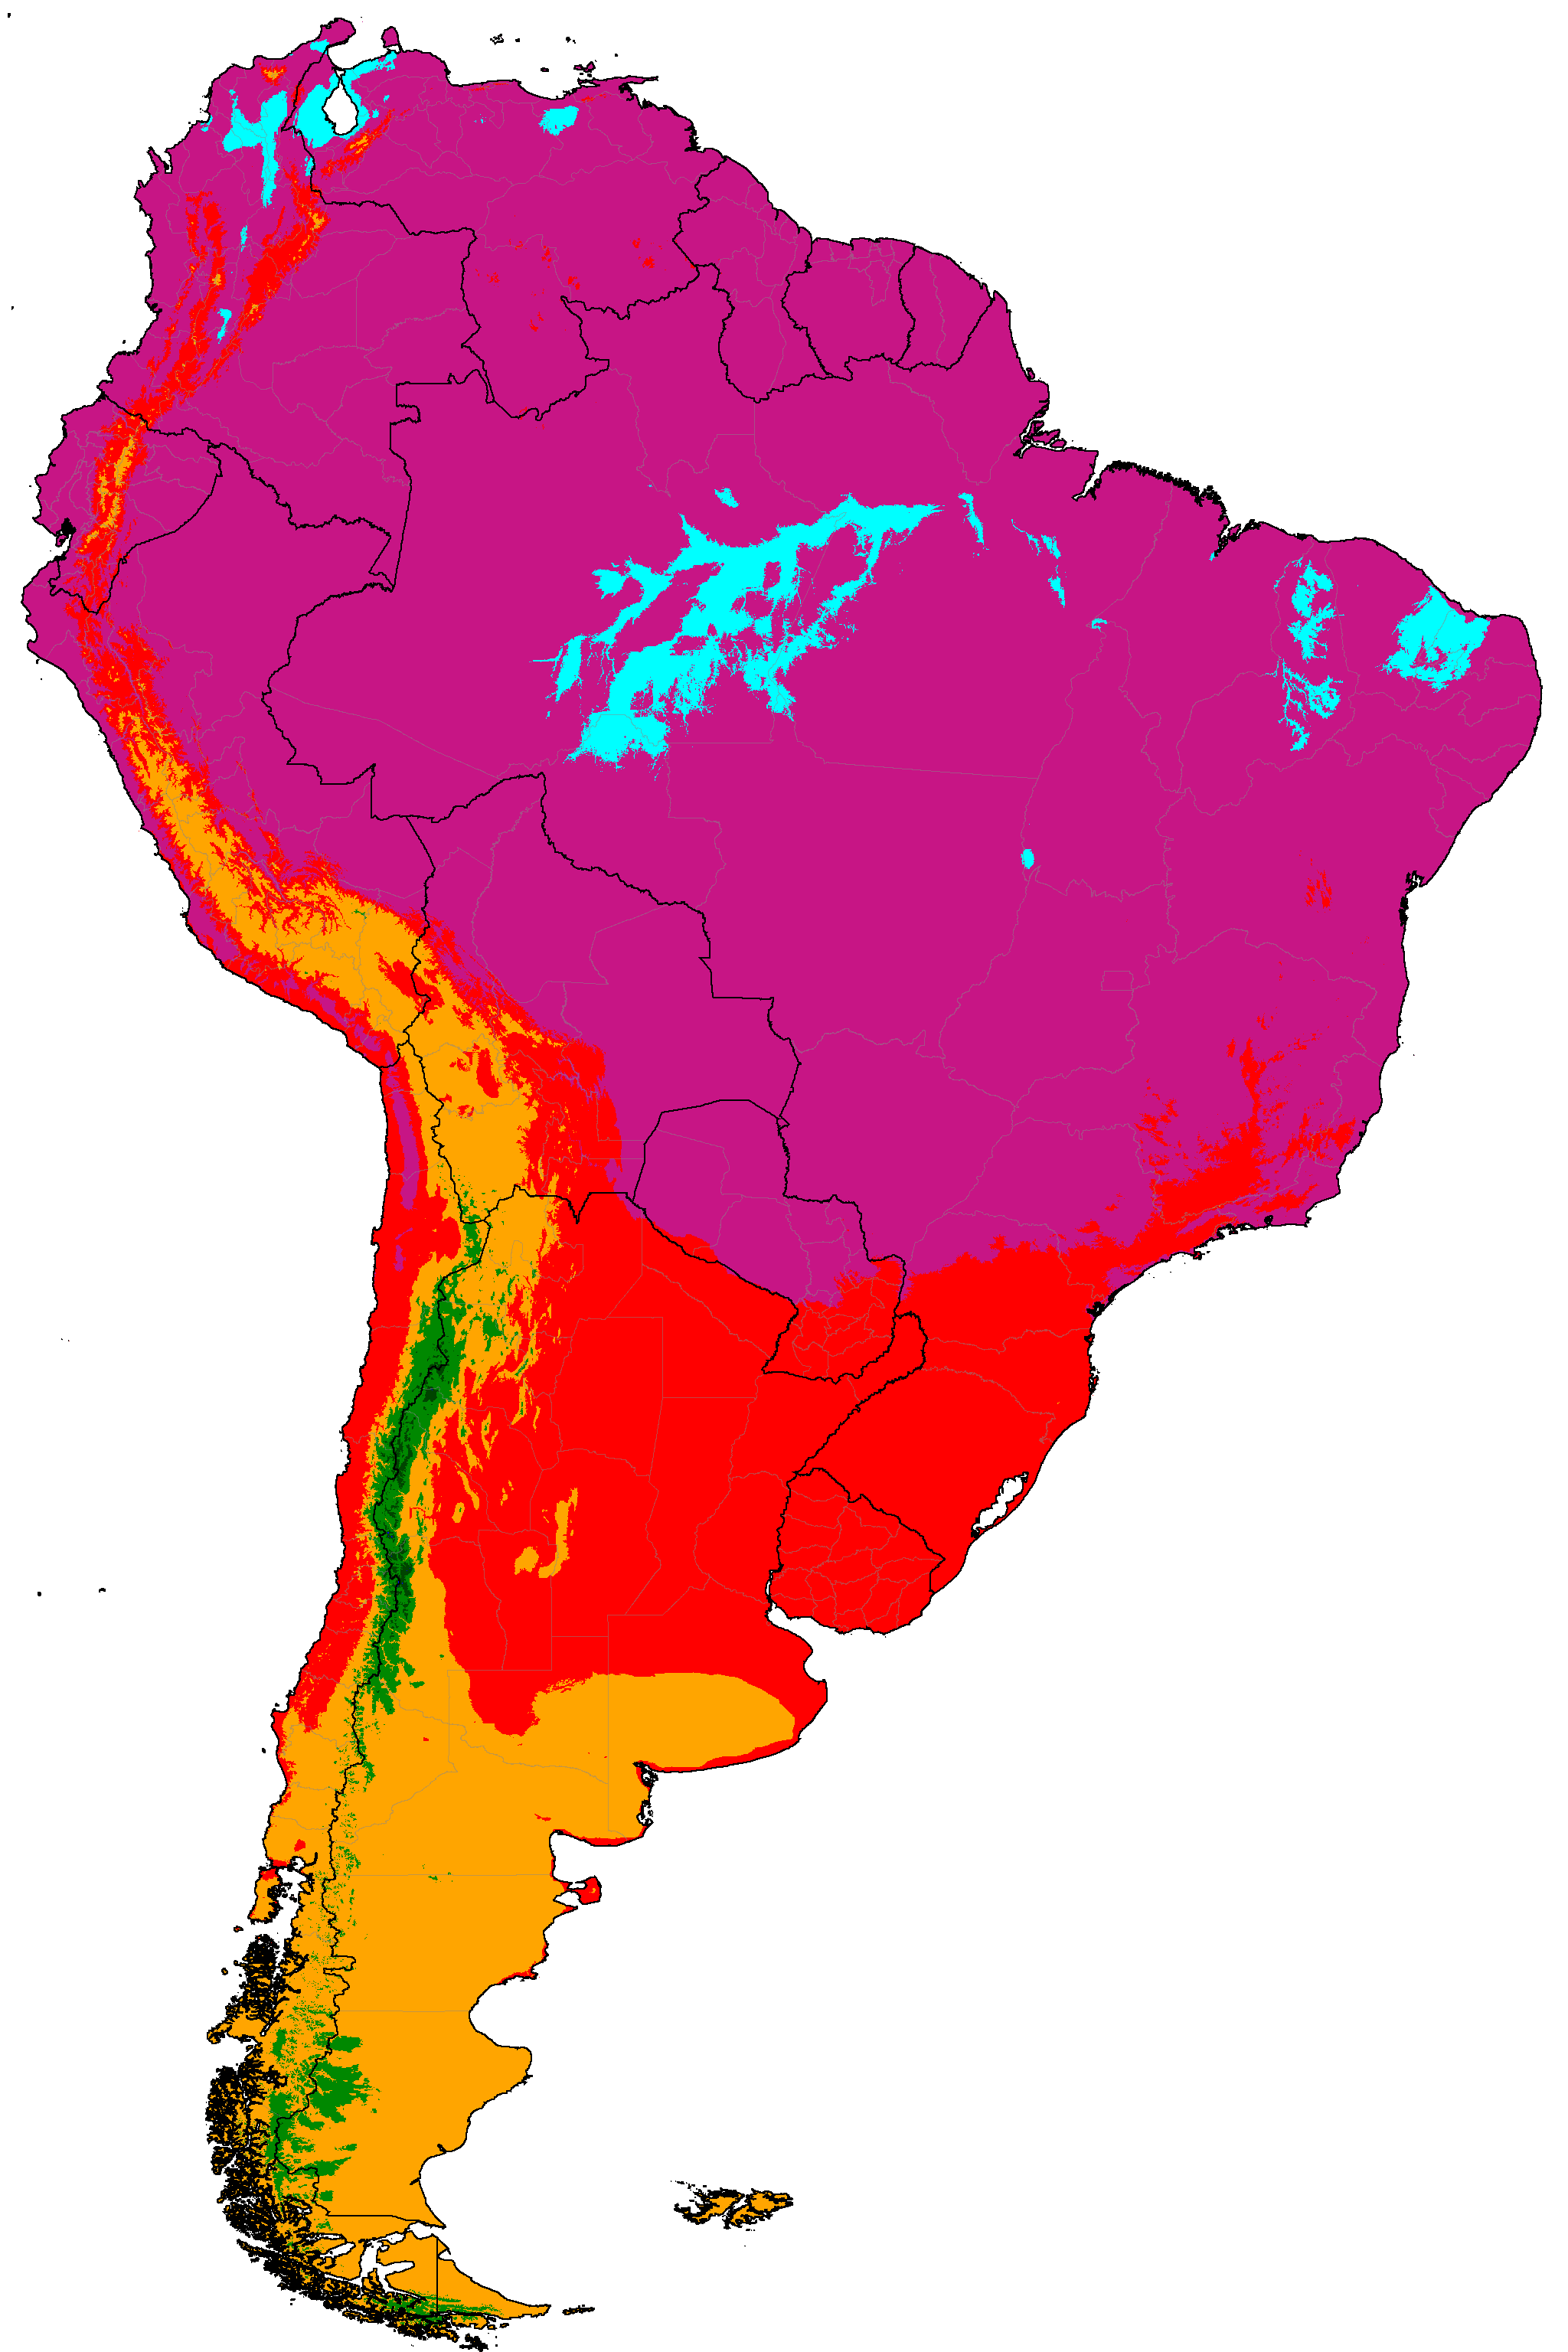
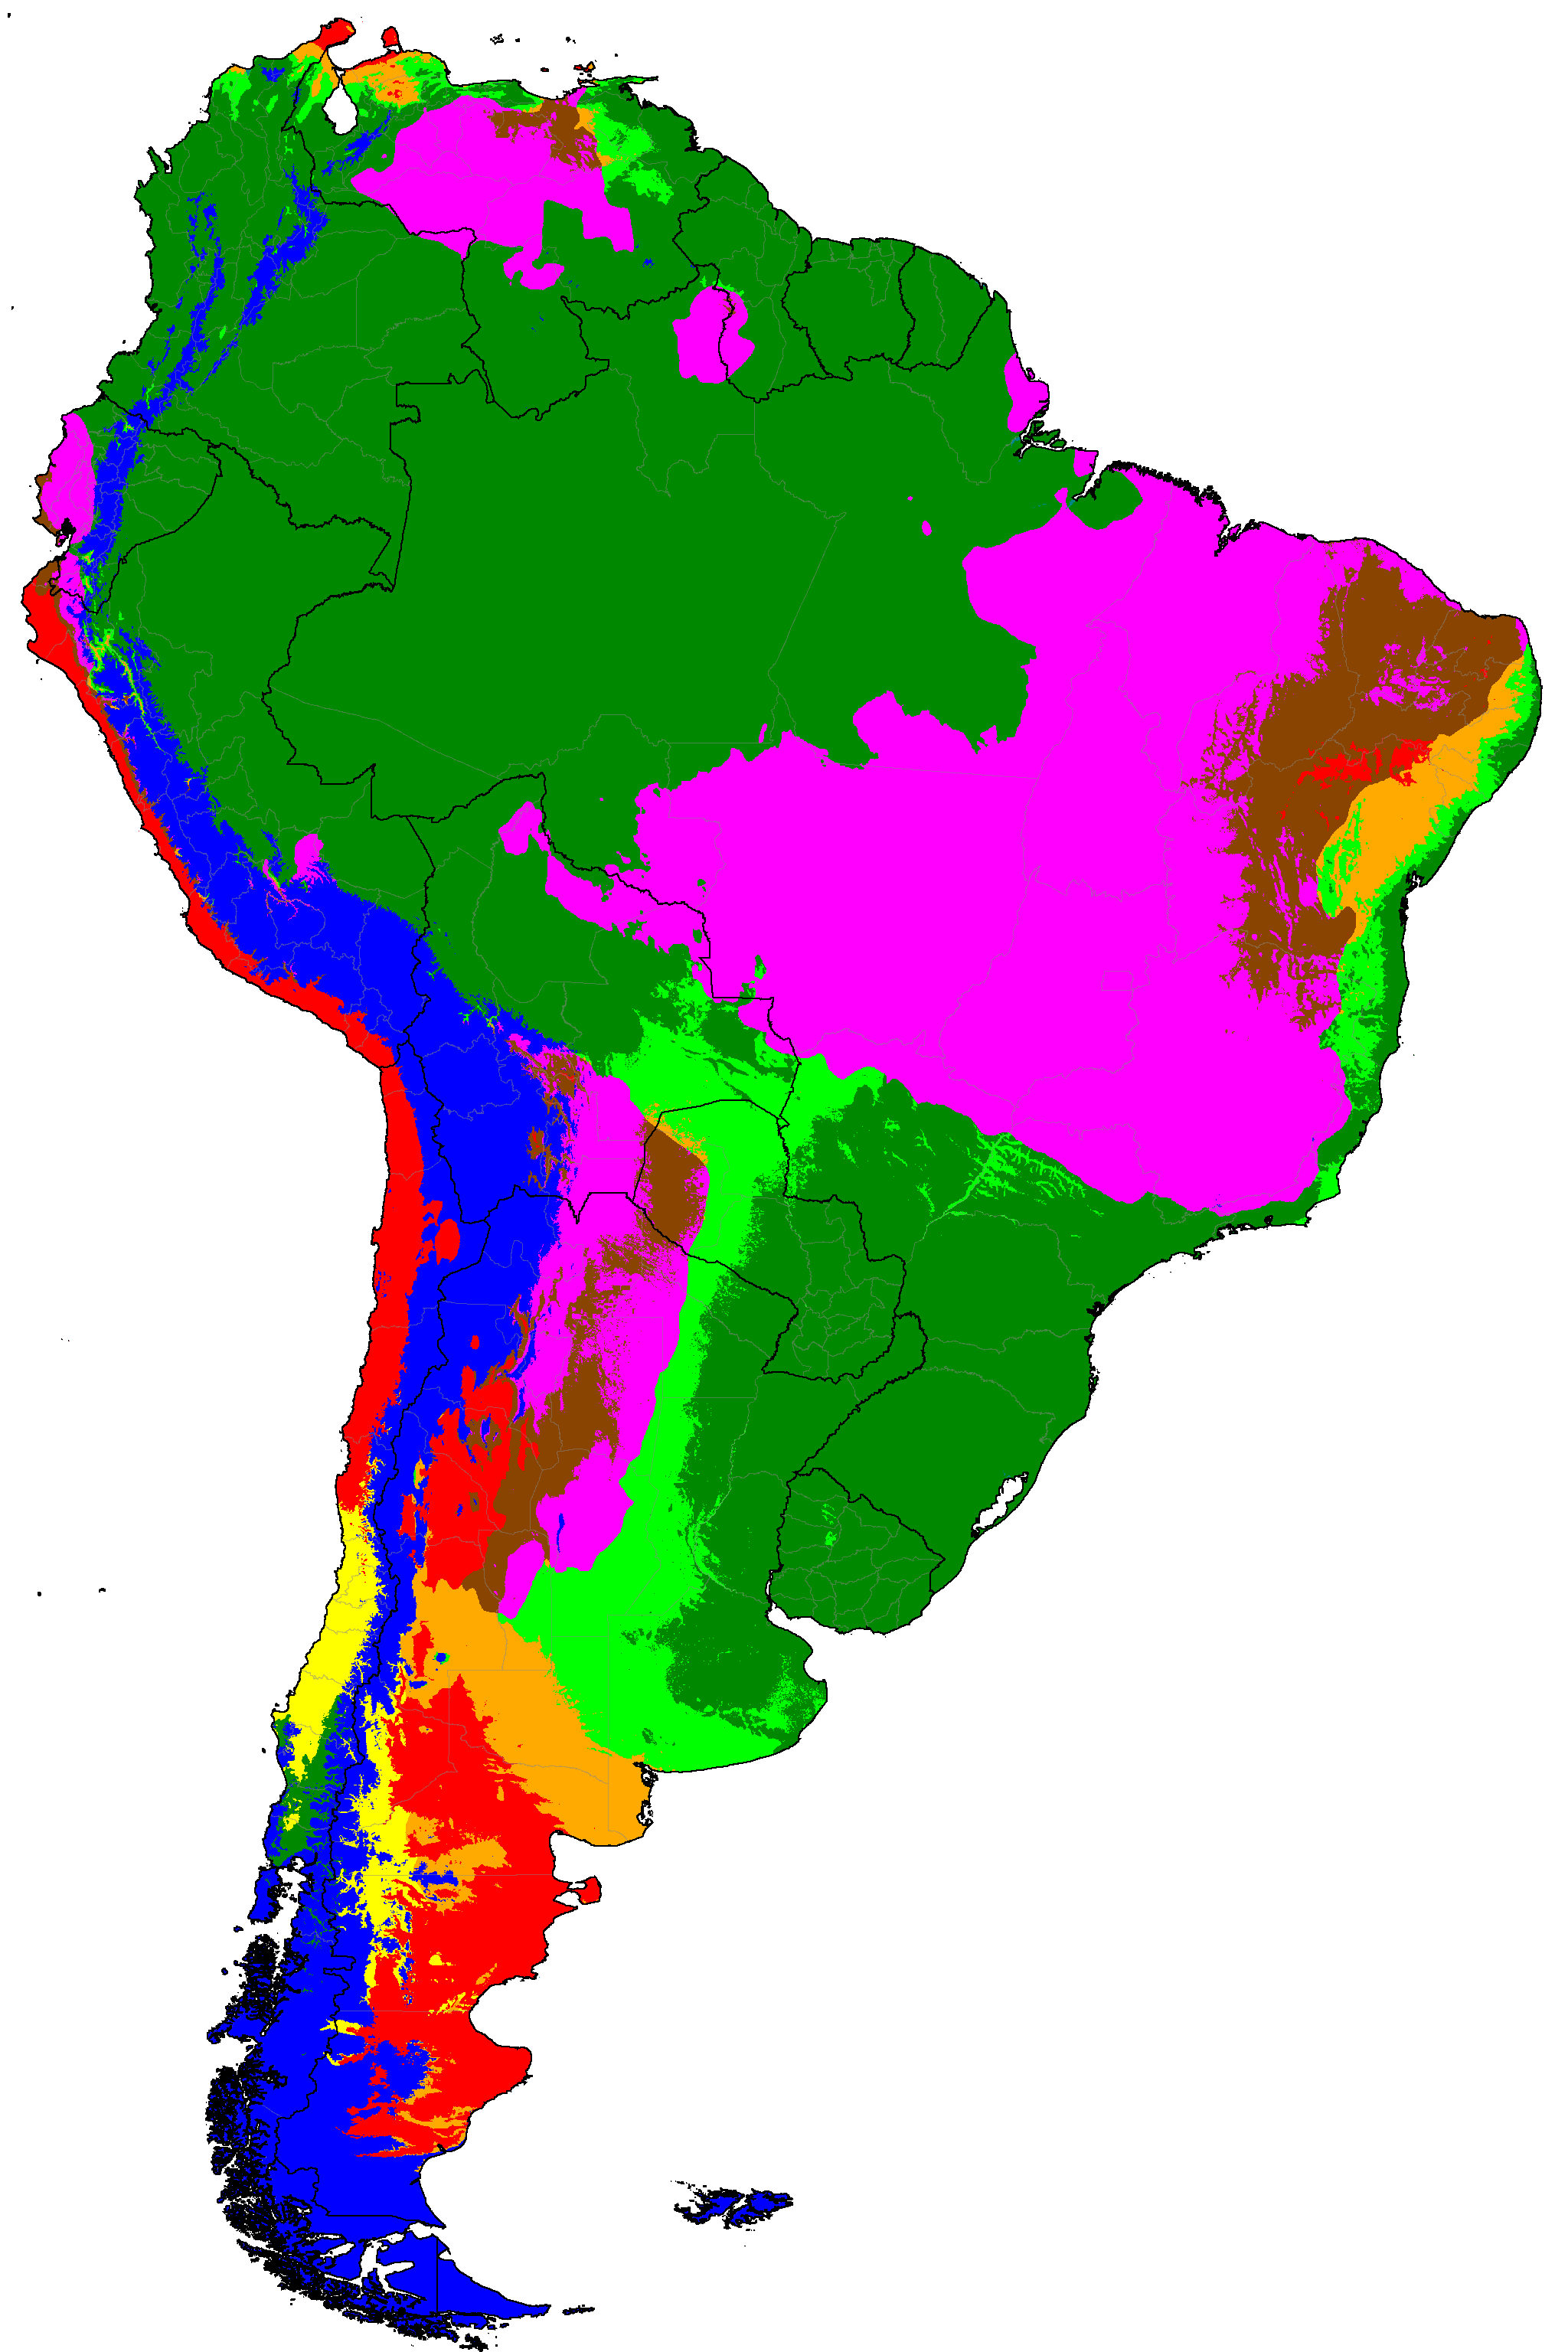
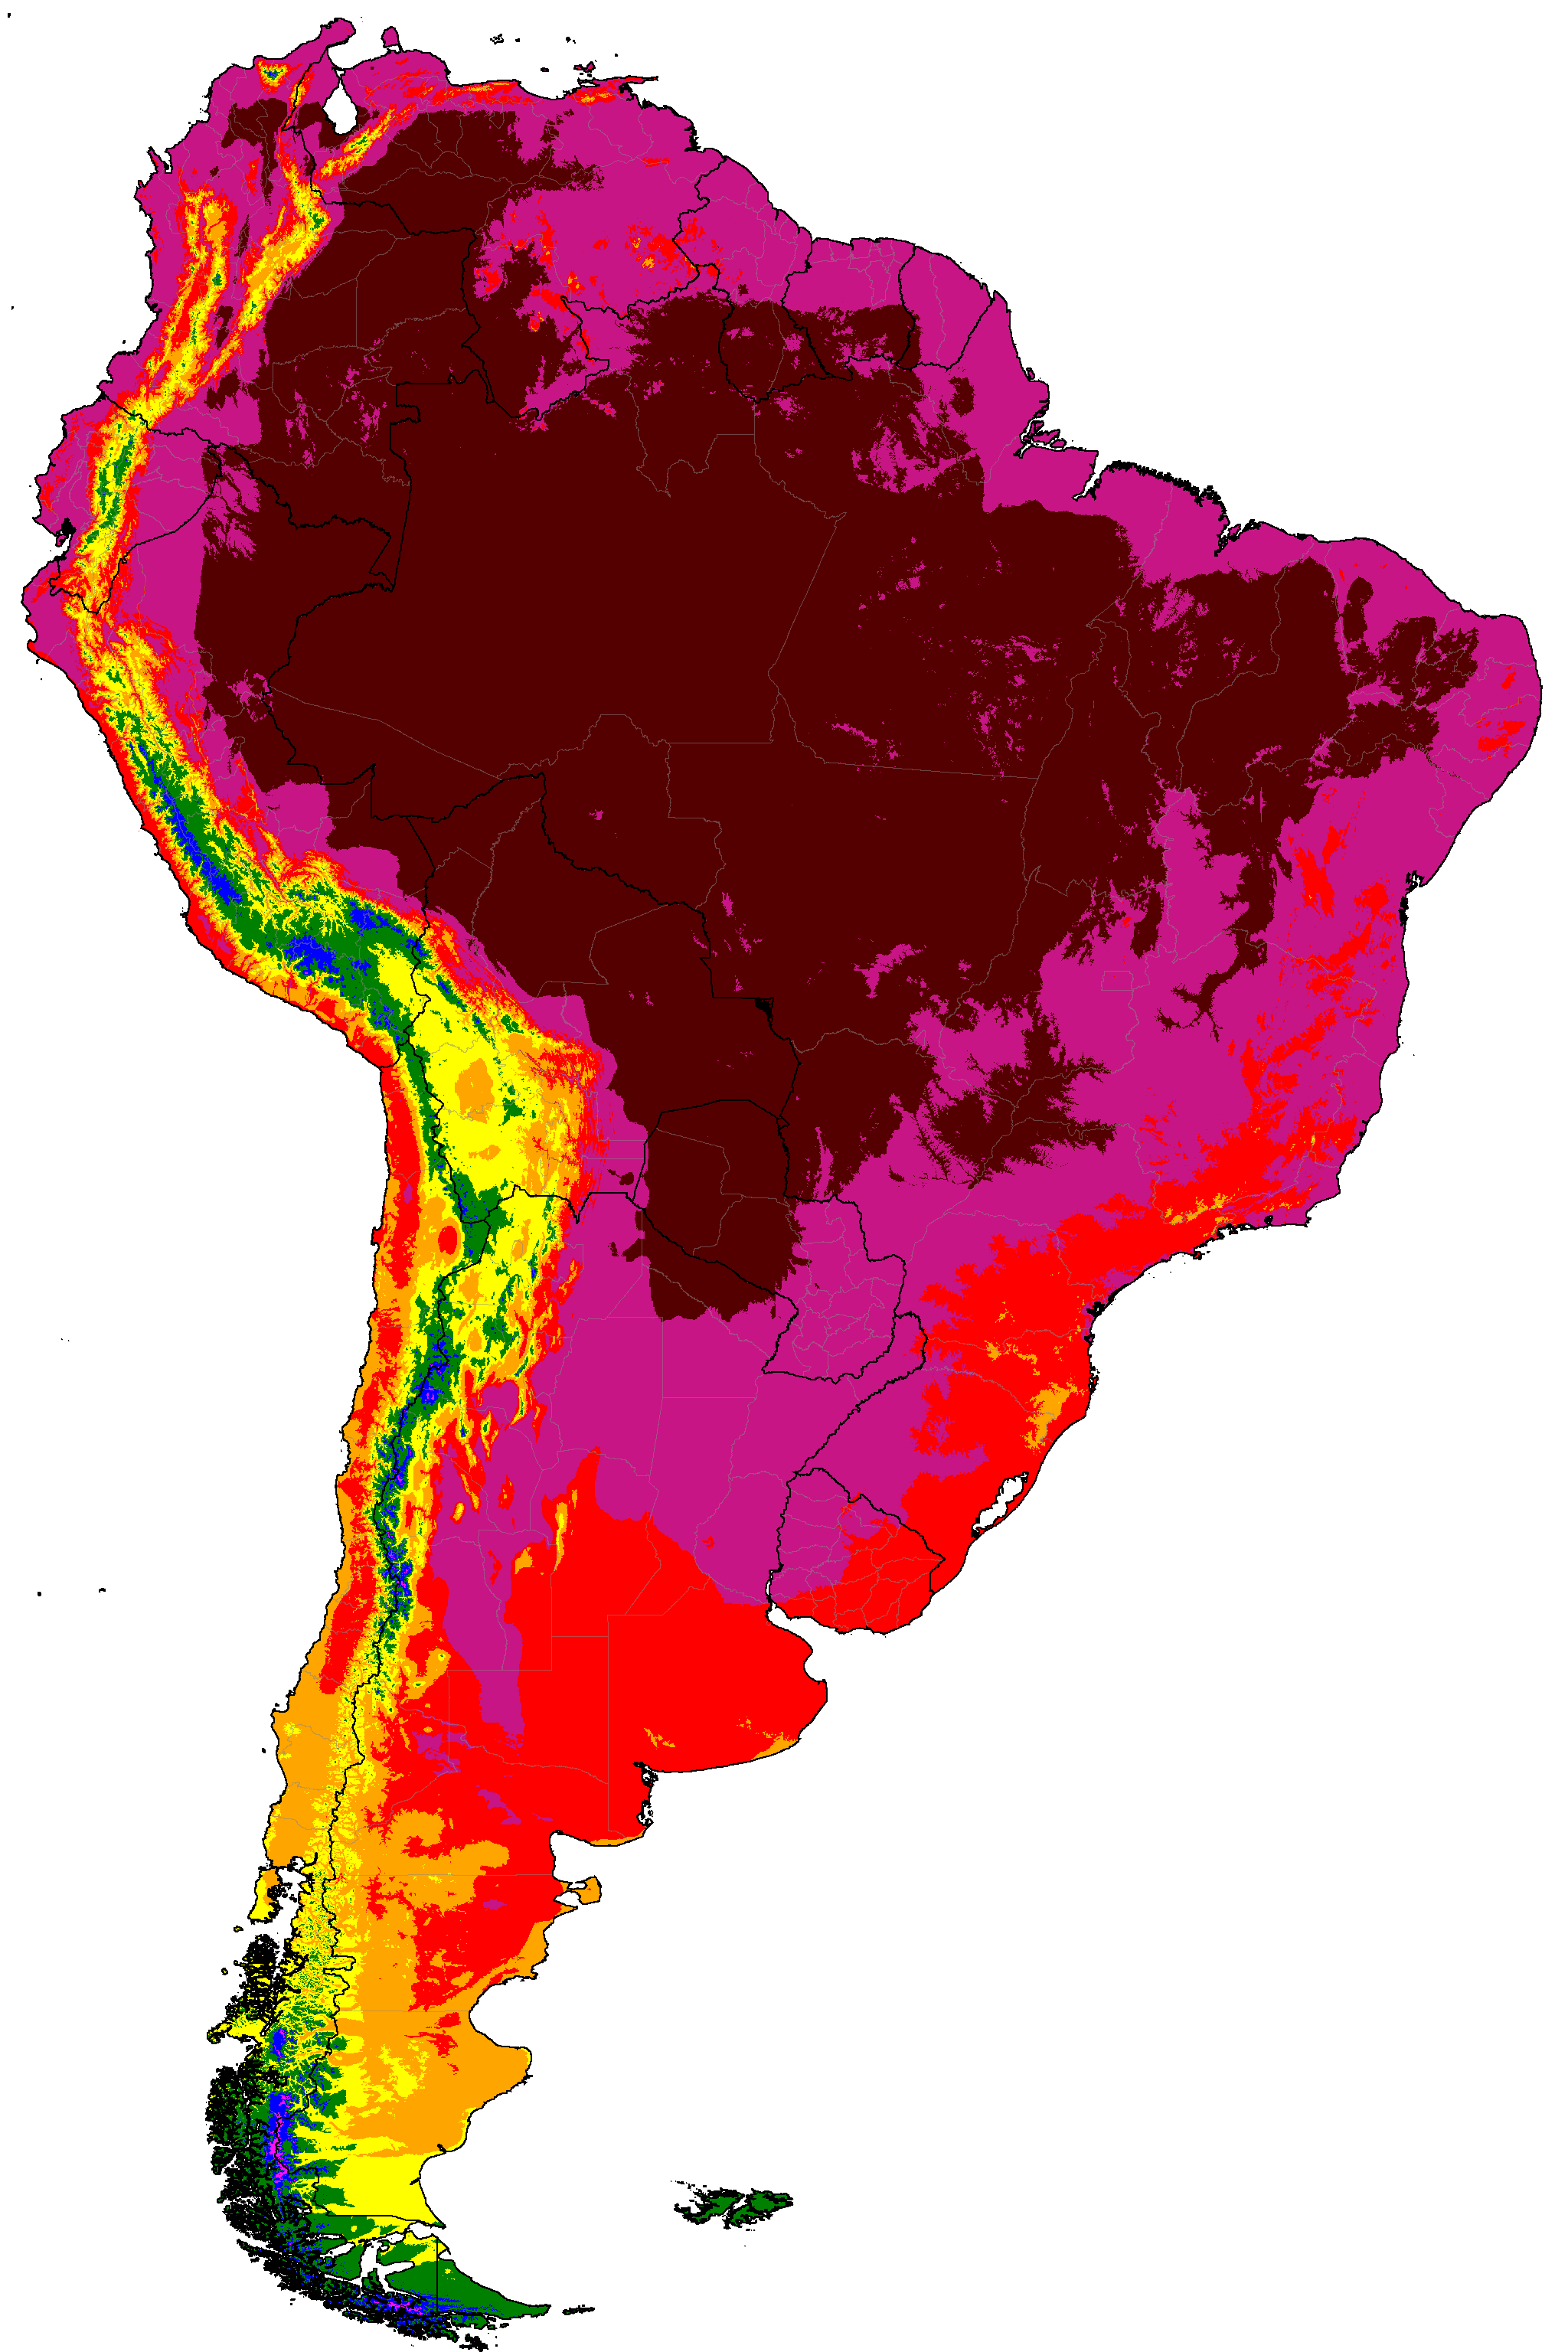
South America distribution of classifications (projections are SSP5-8.5 high emissions normals)
Note: Due to the complexity of the system, only the most common climates in each map are labeled.
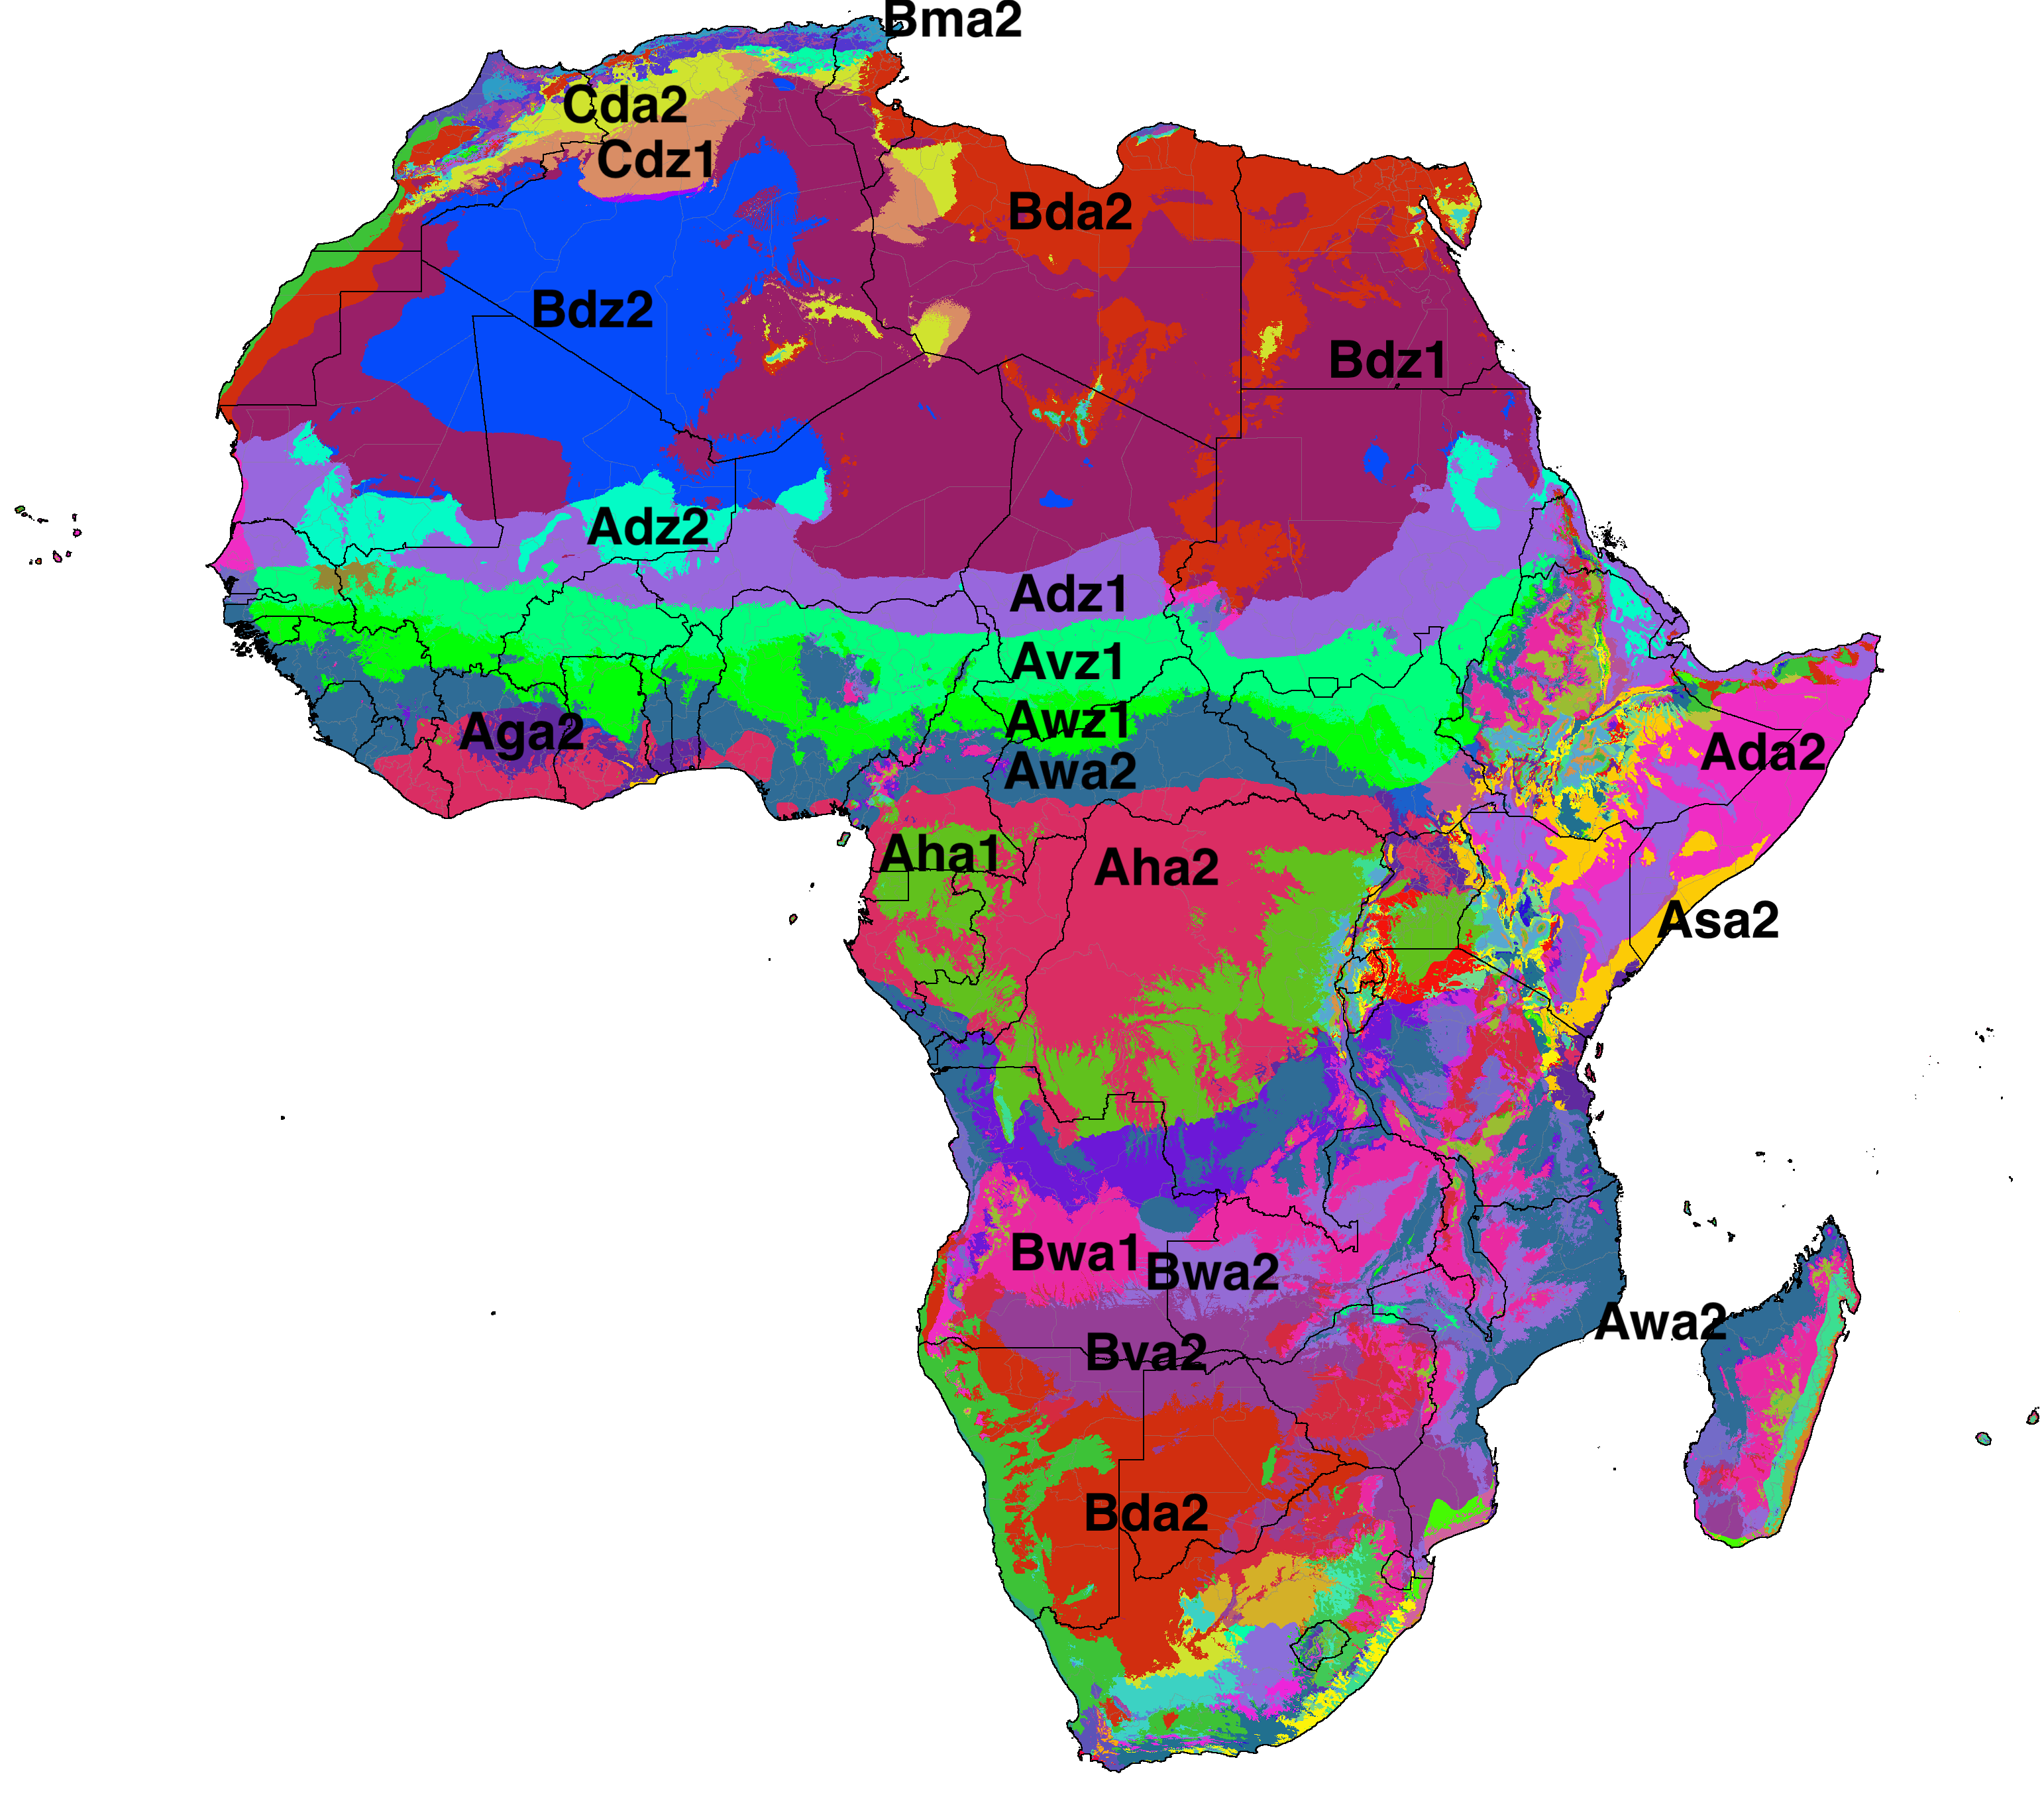
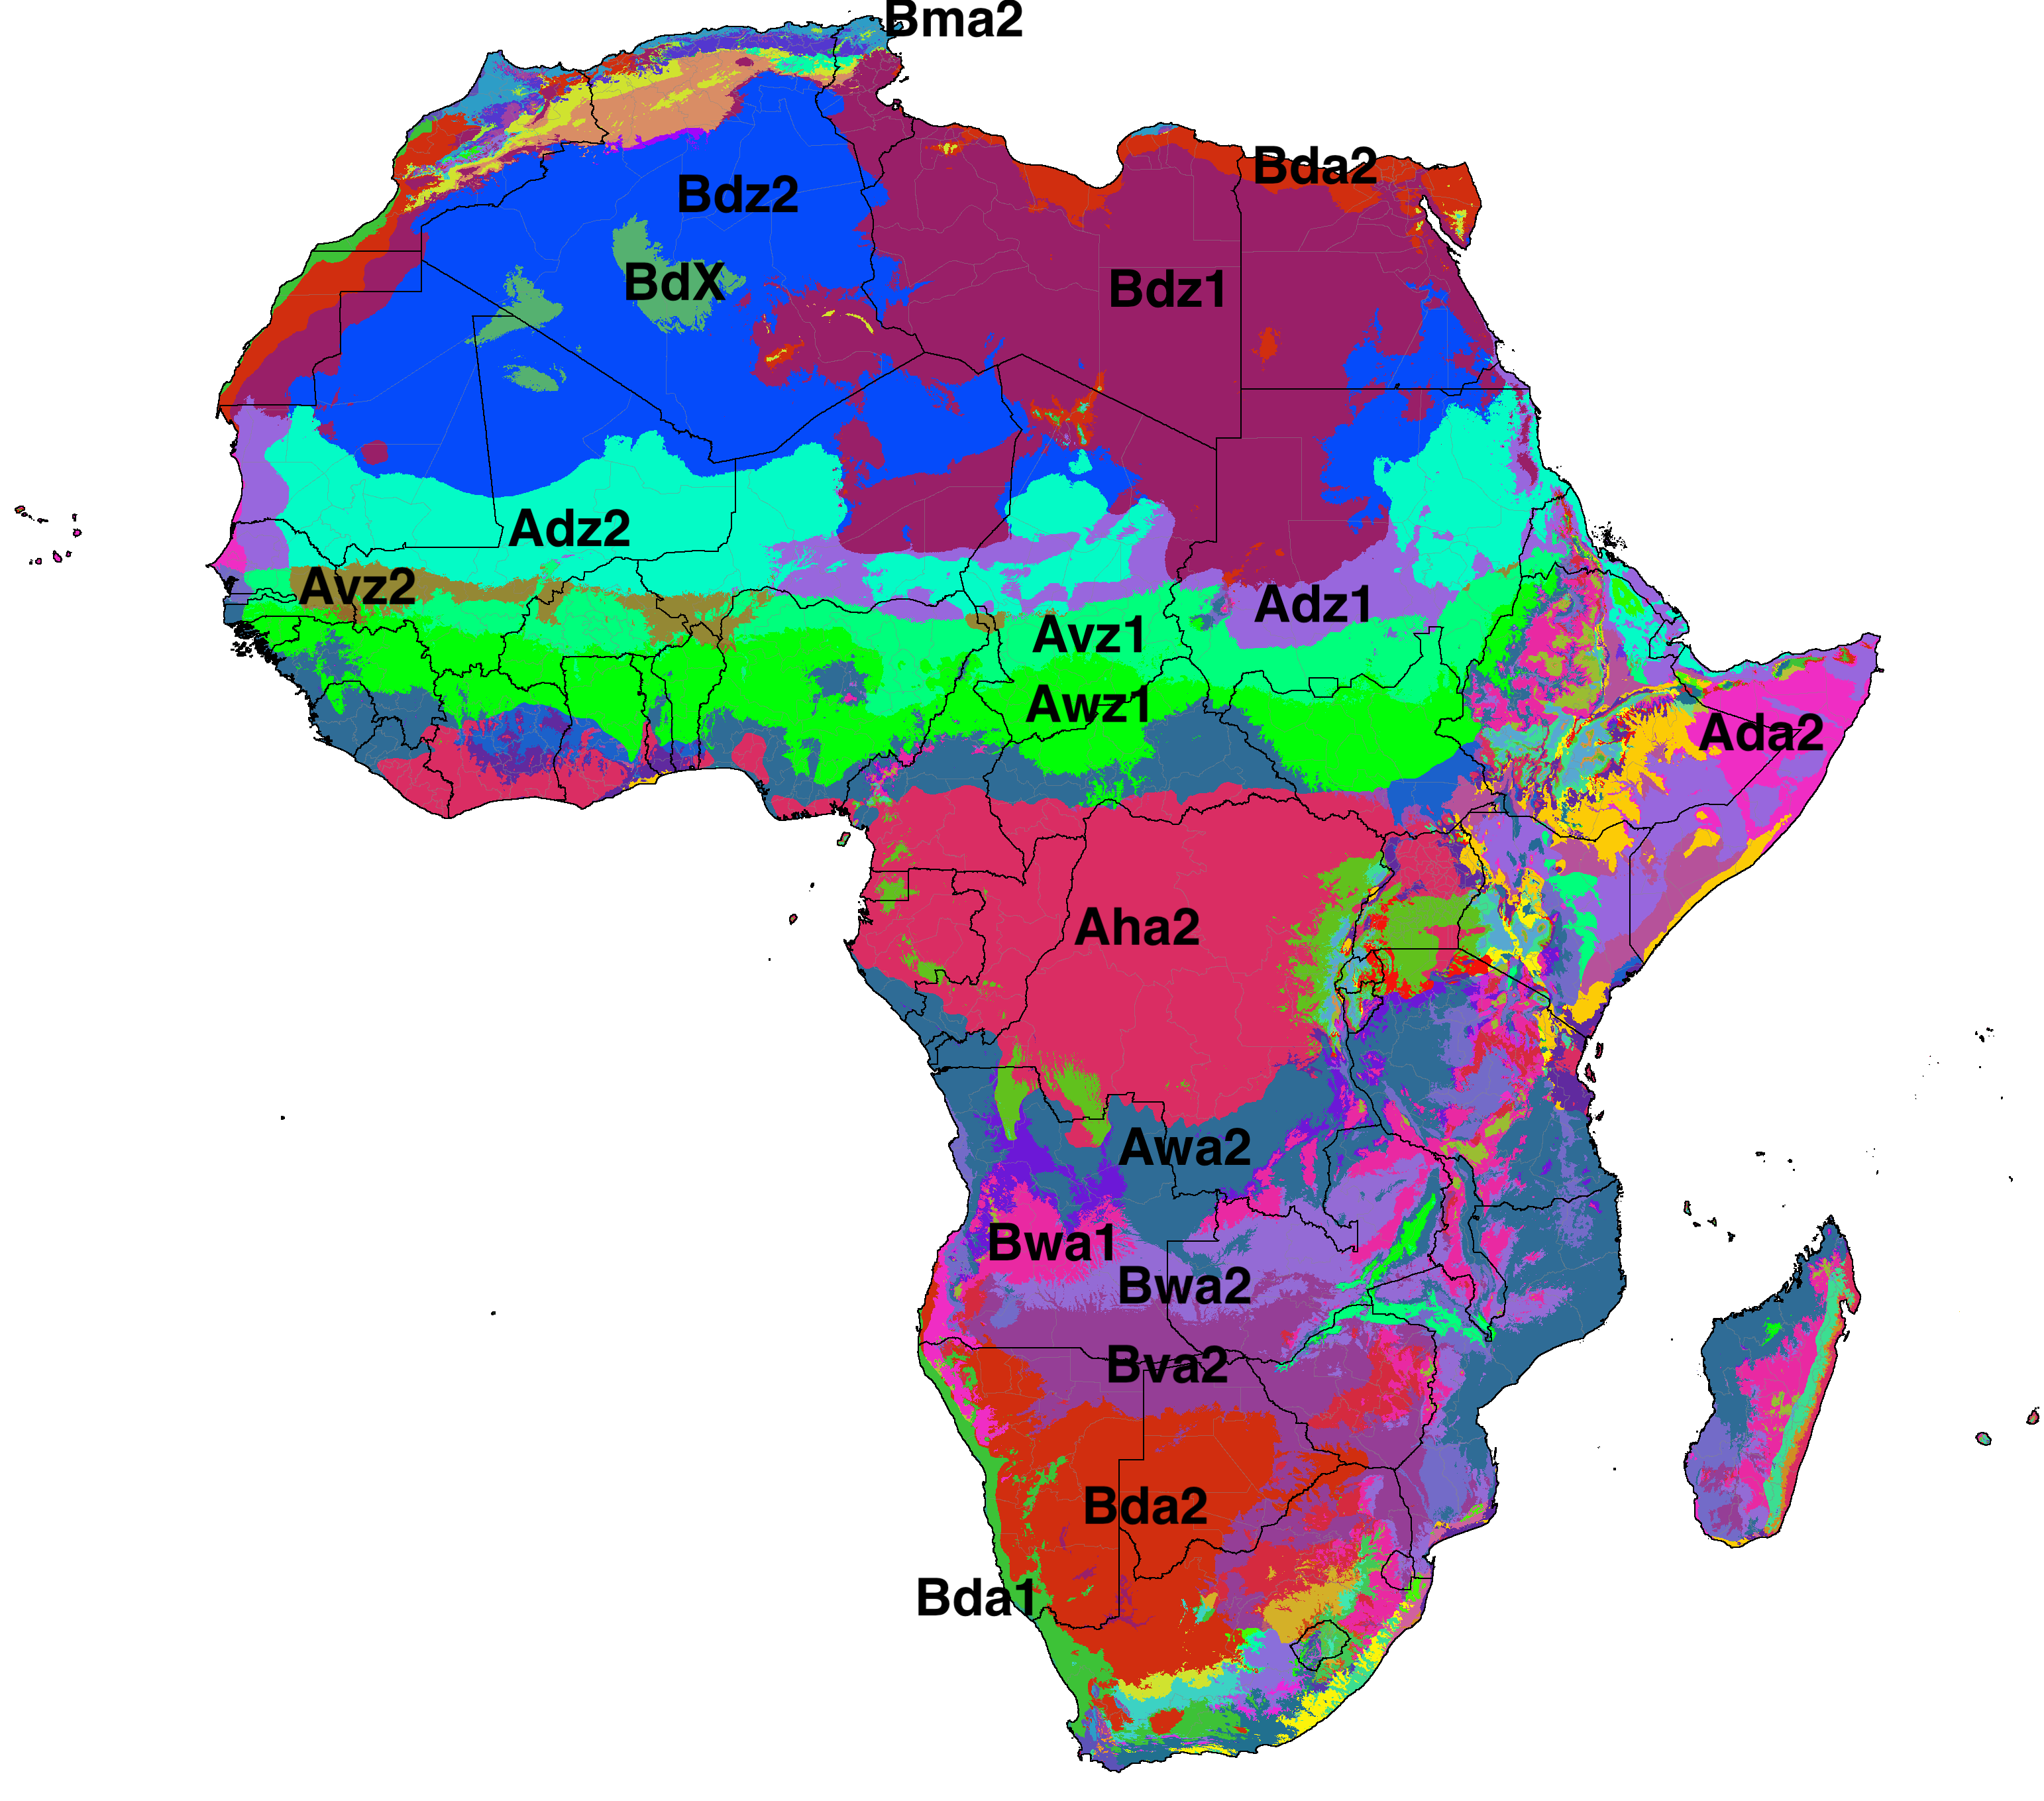
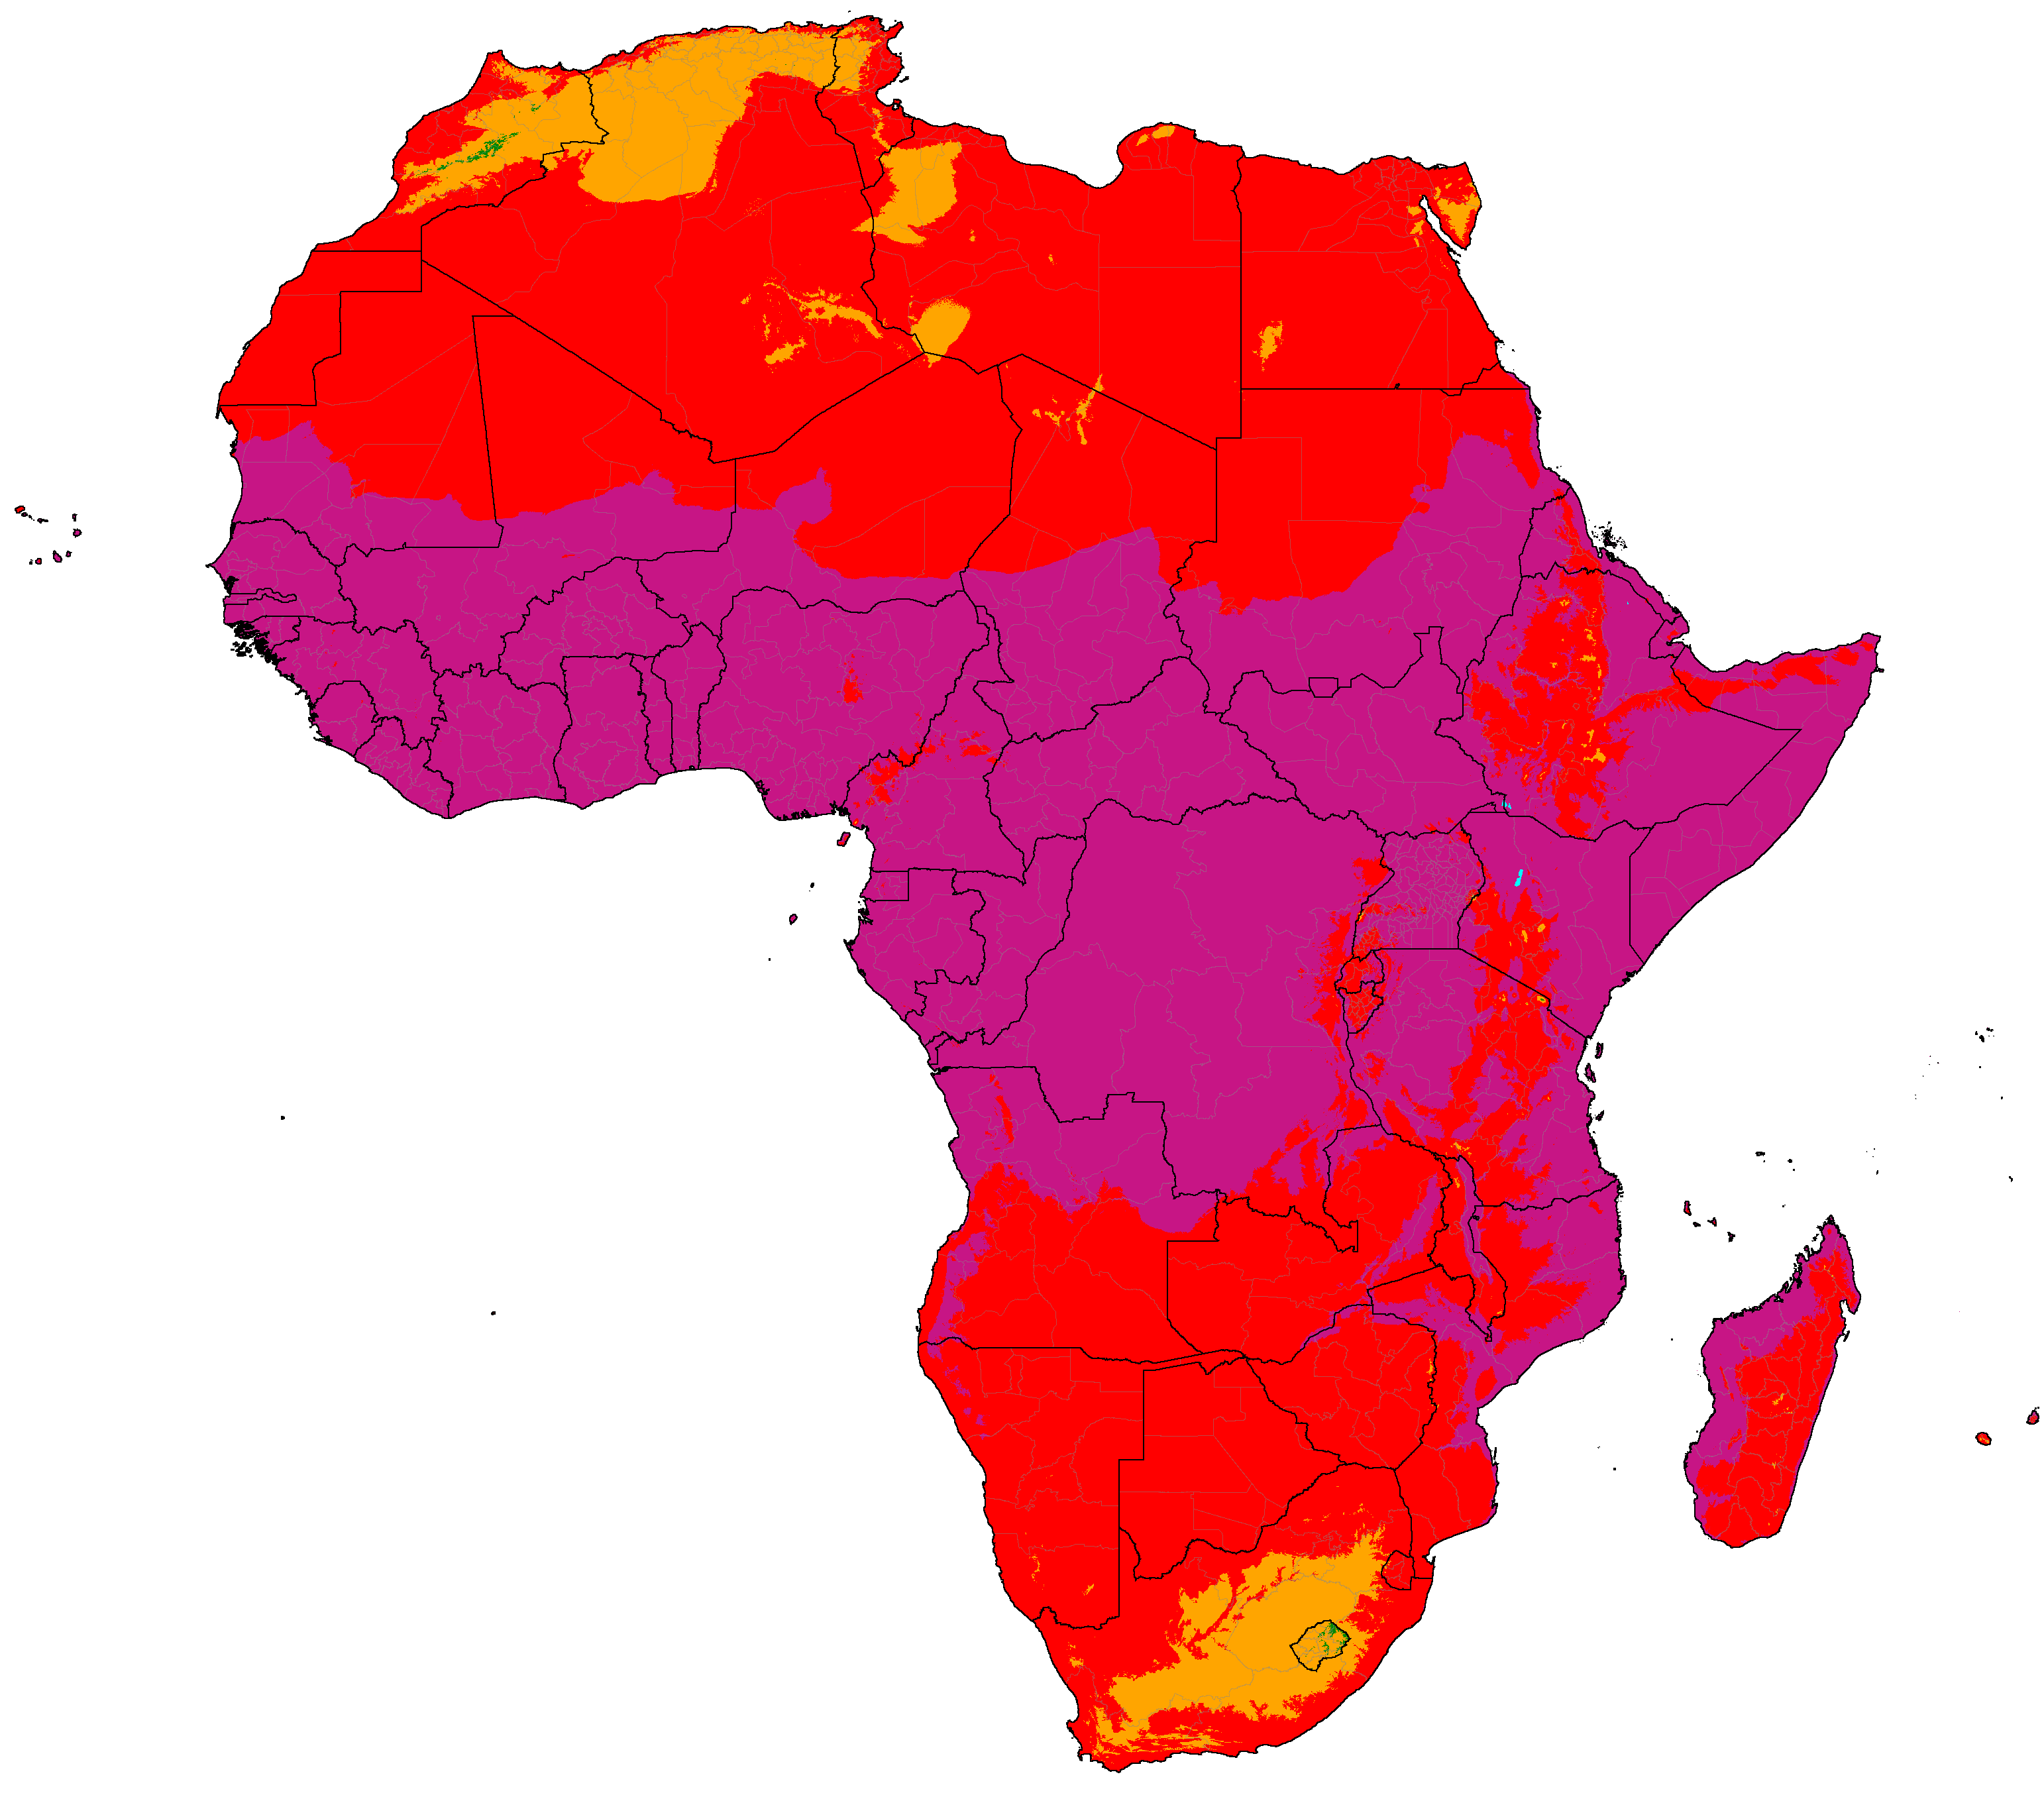
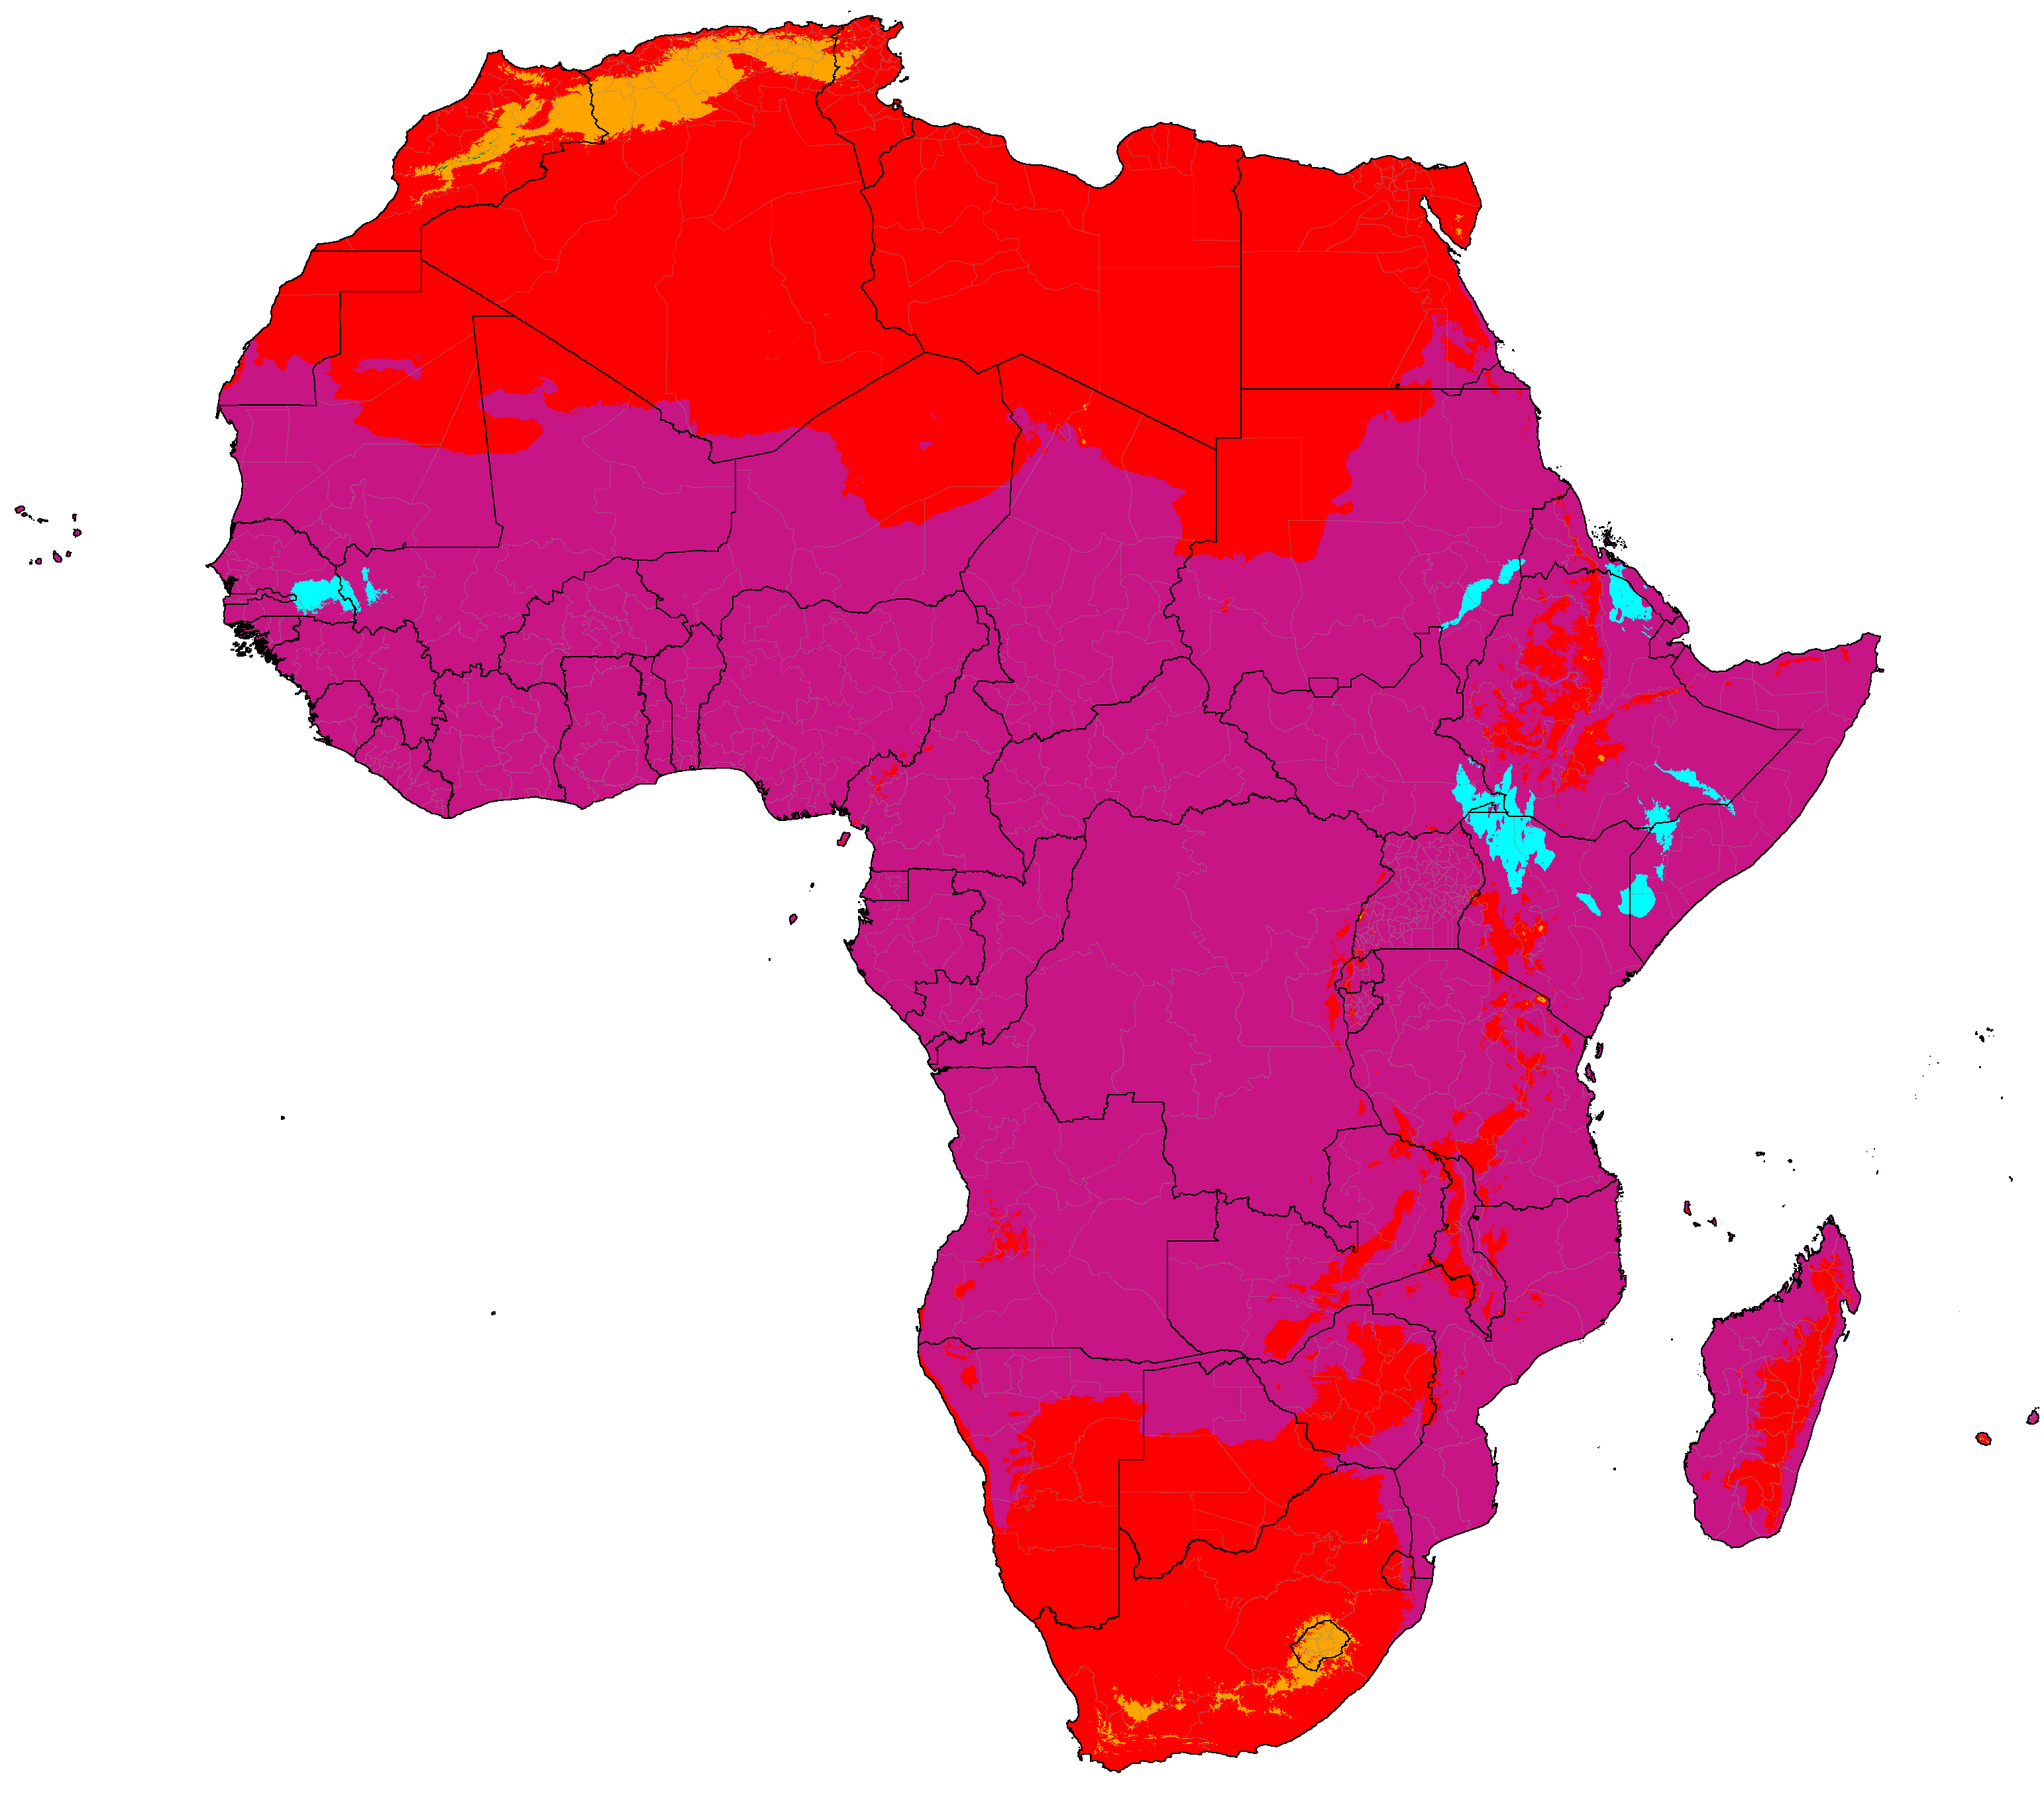
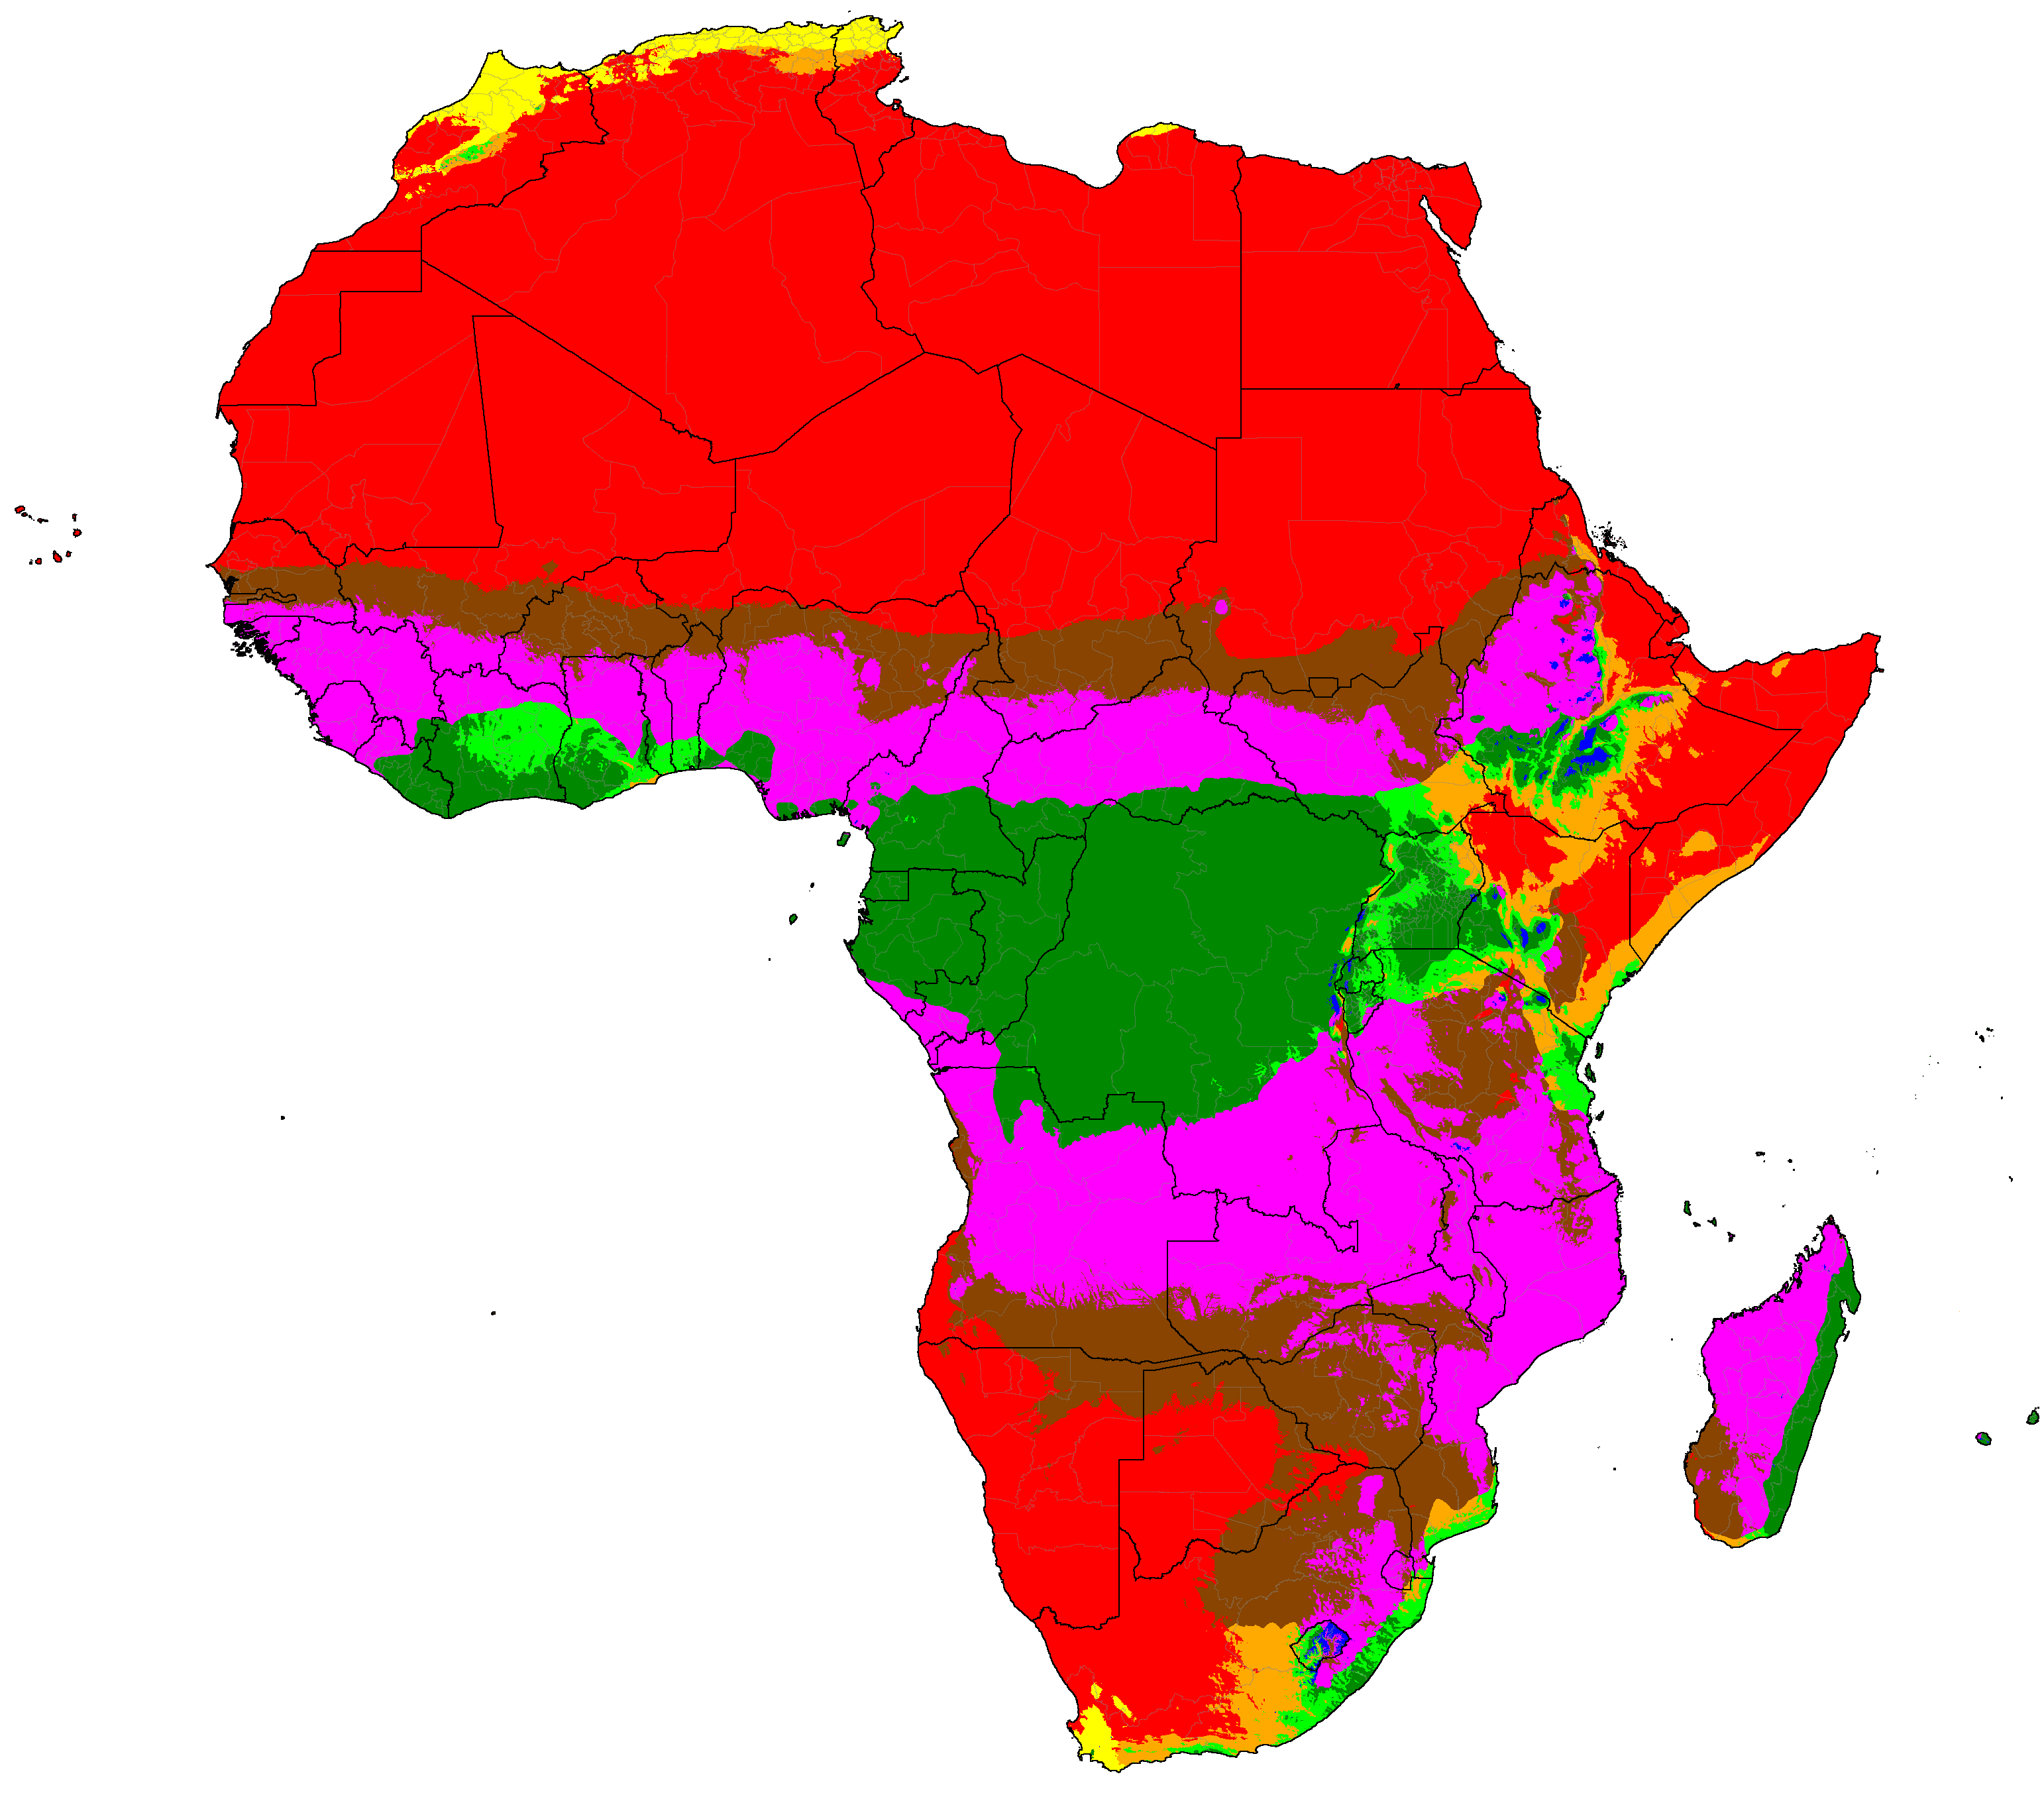
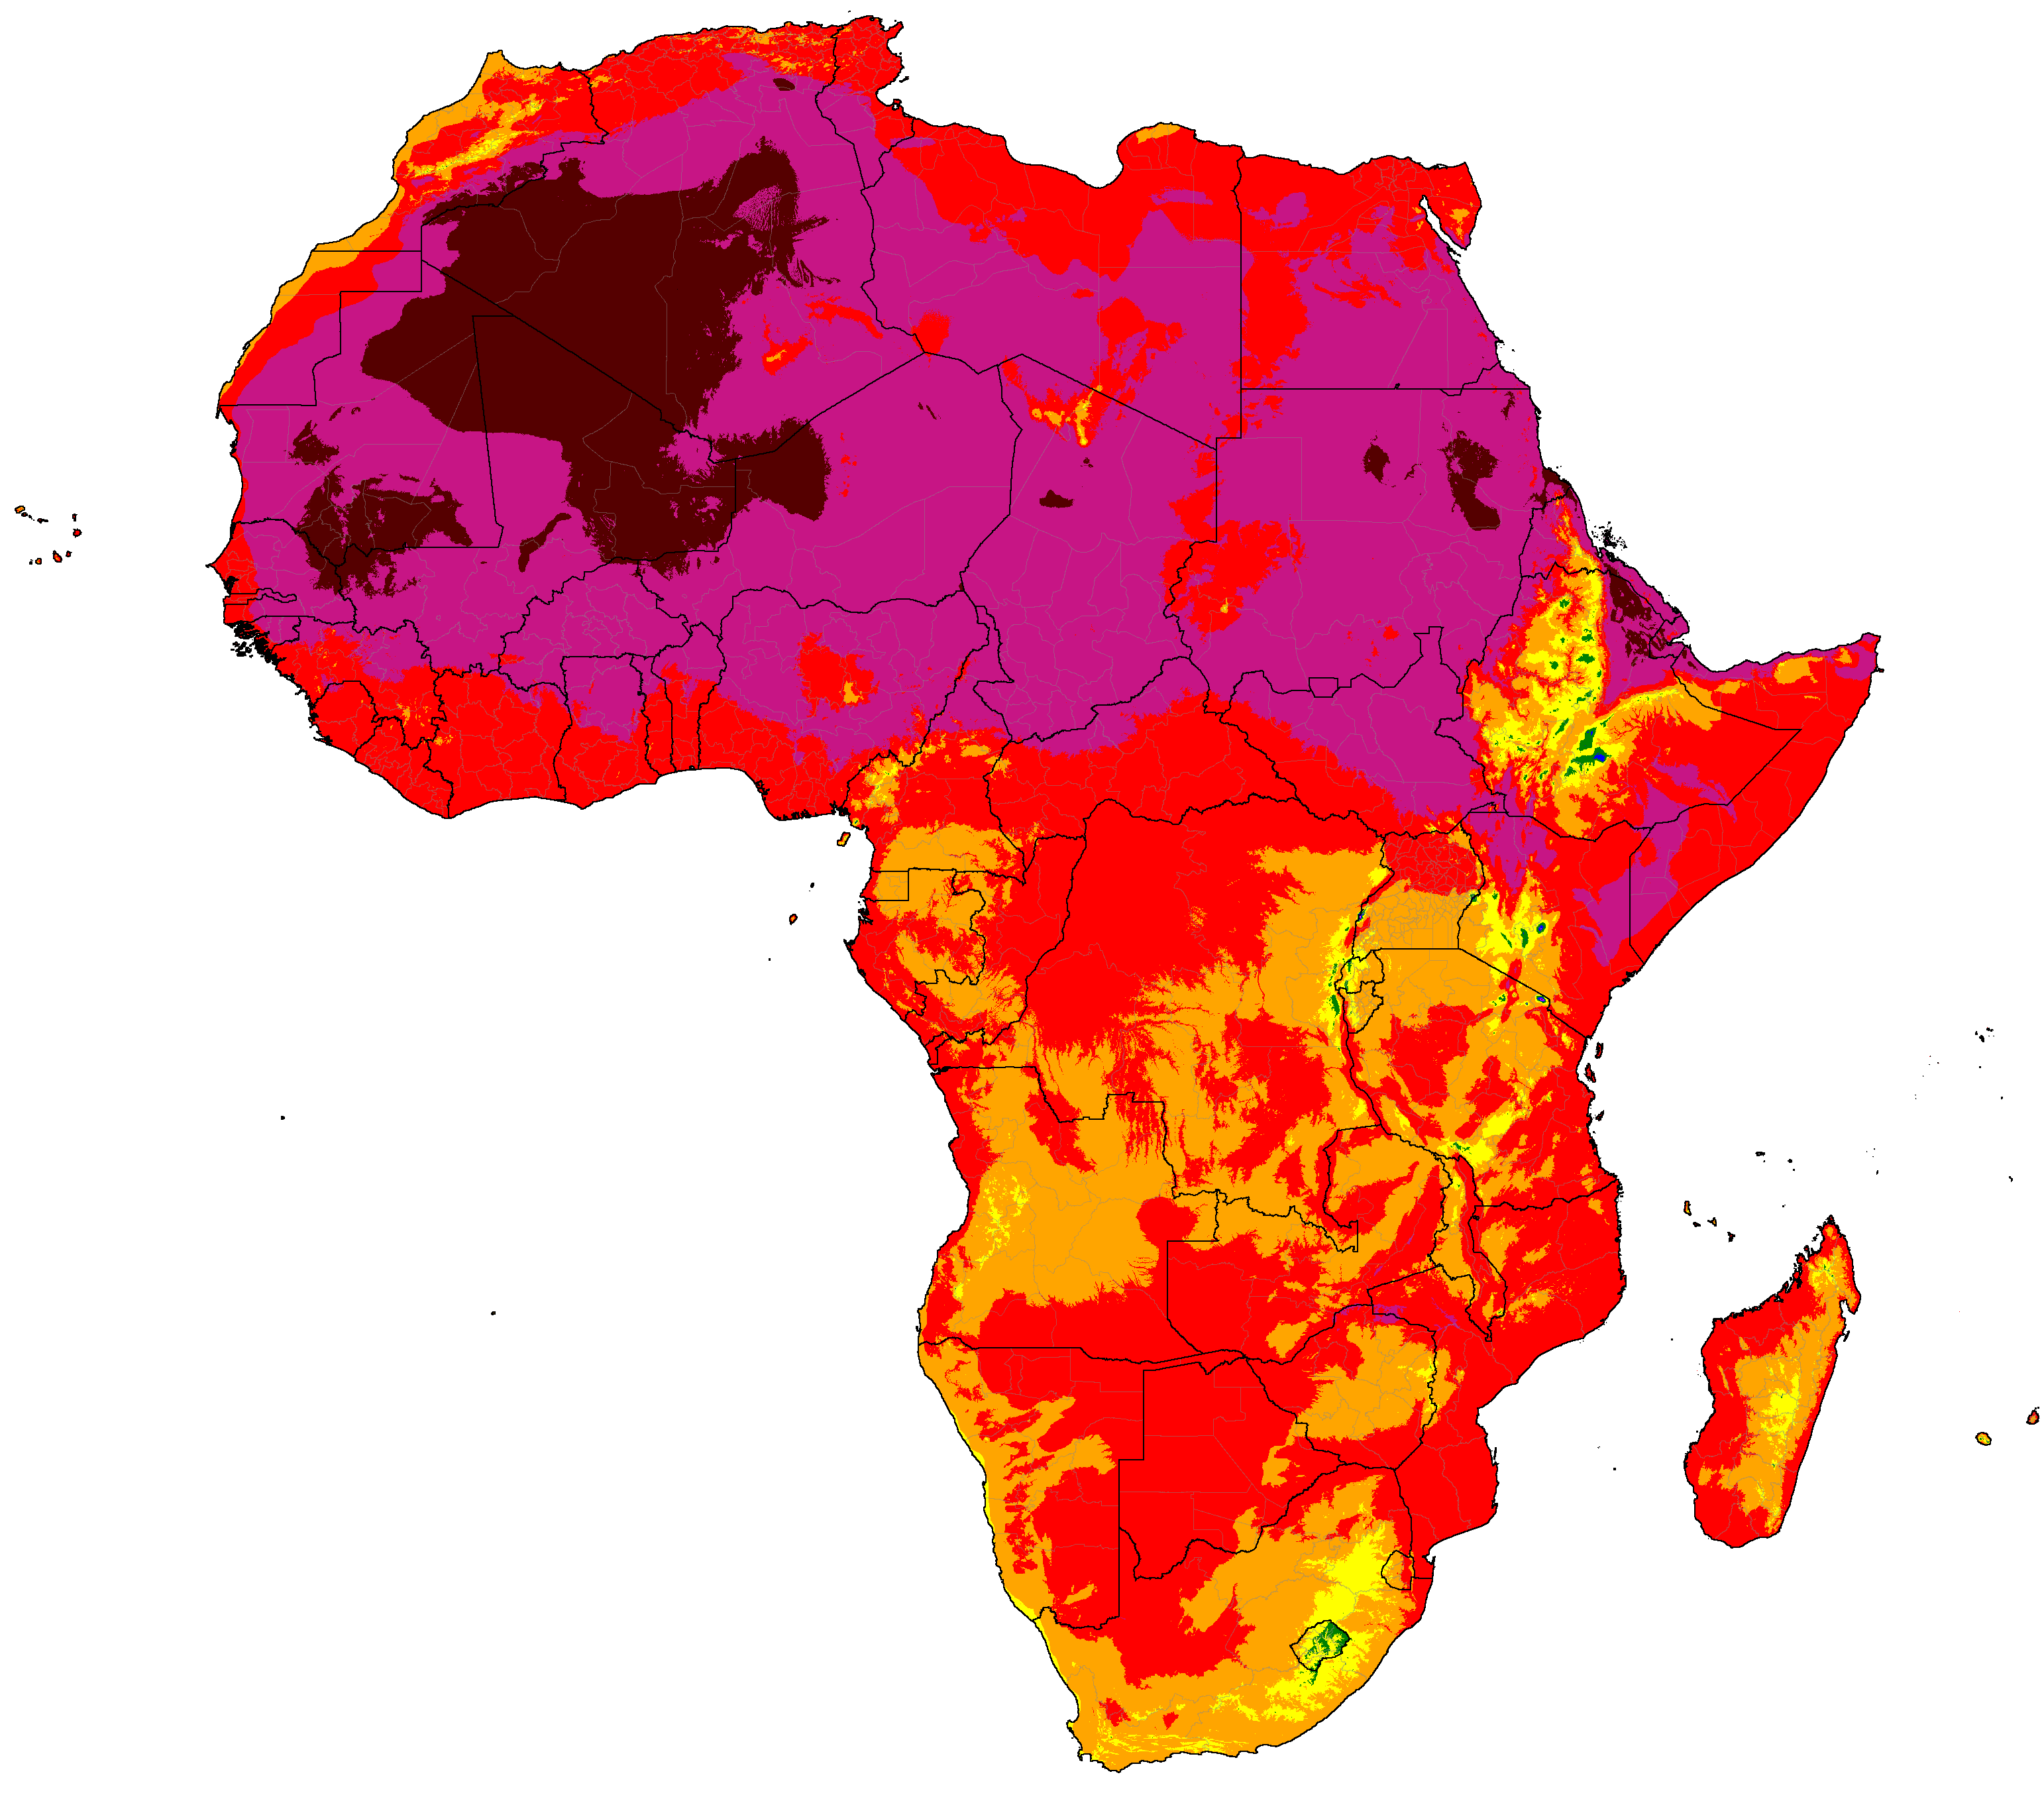
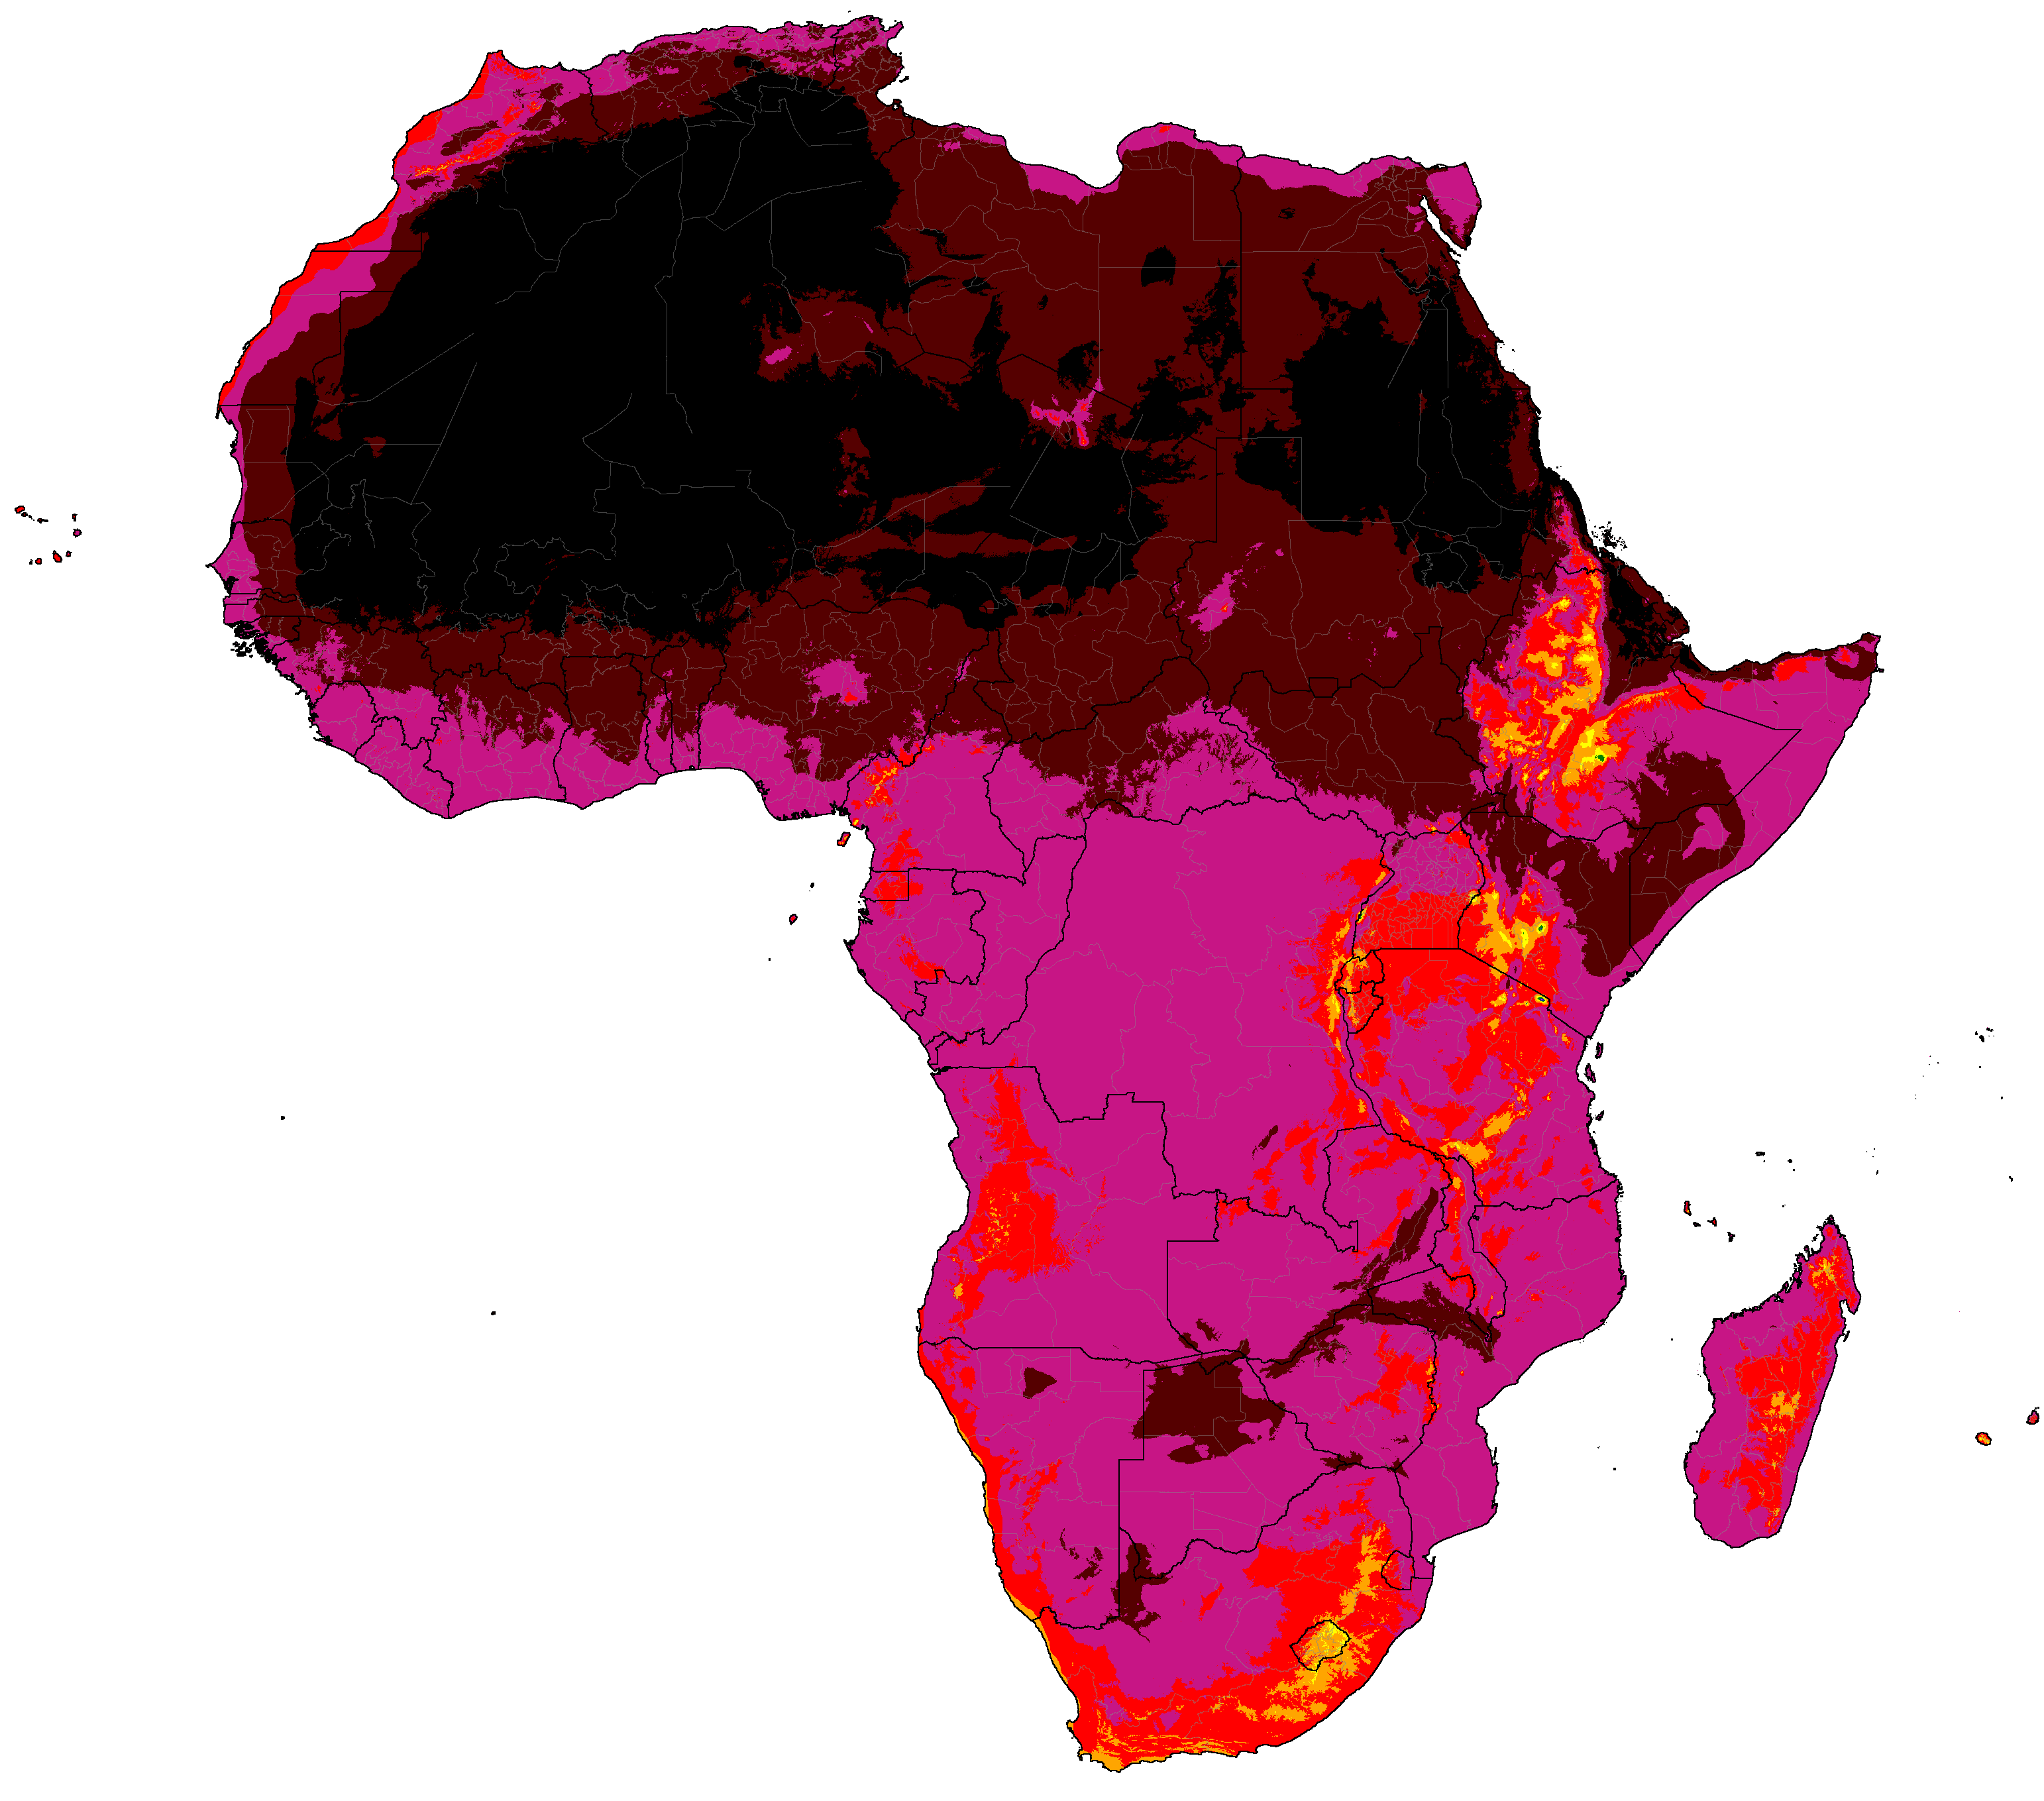
Africa distribution of classifications (projections are SSP5-8.5 high emissions normals)
Note: Due to the complexity of the system, only the most common climates in each map are labeled.
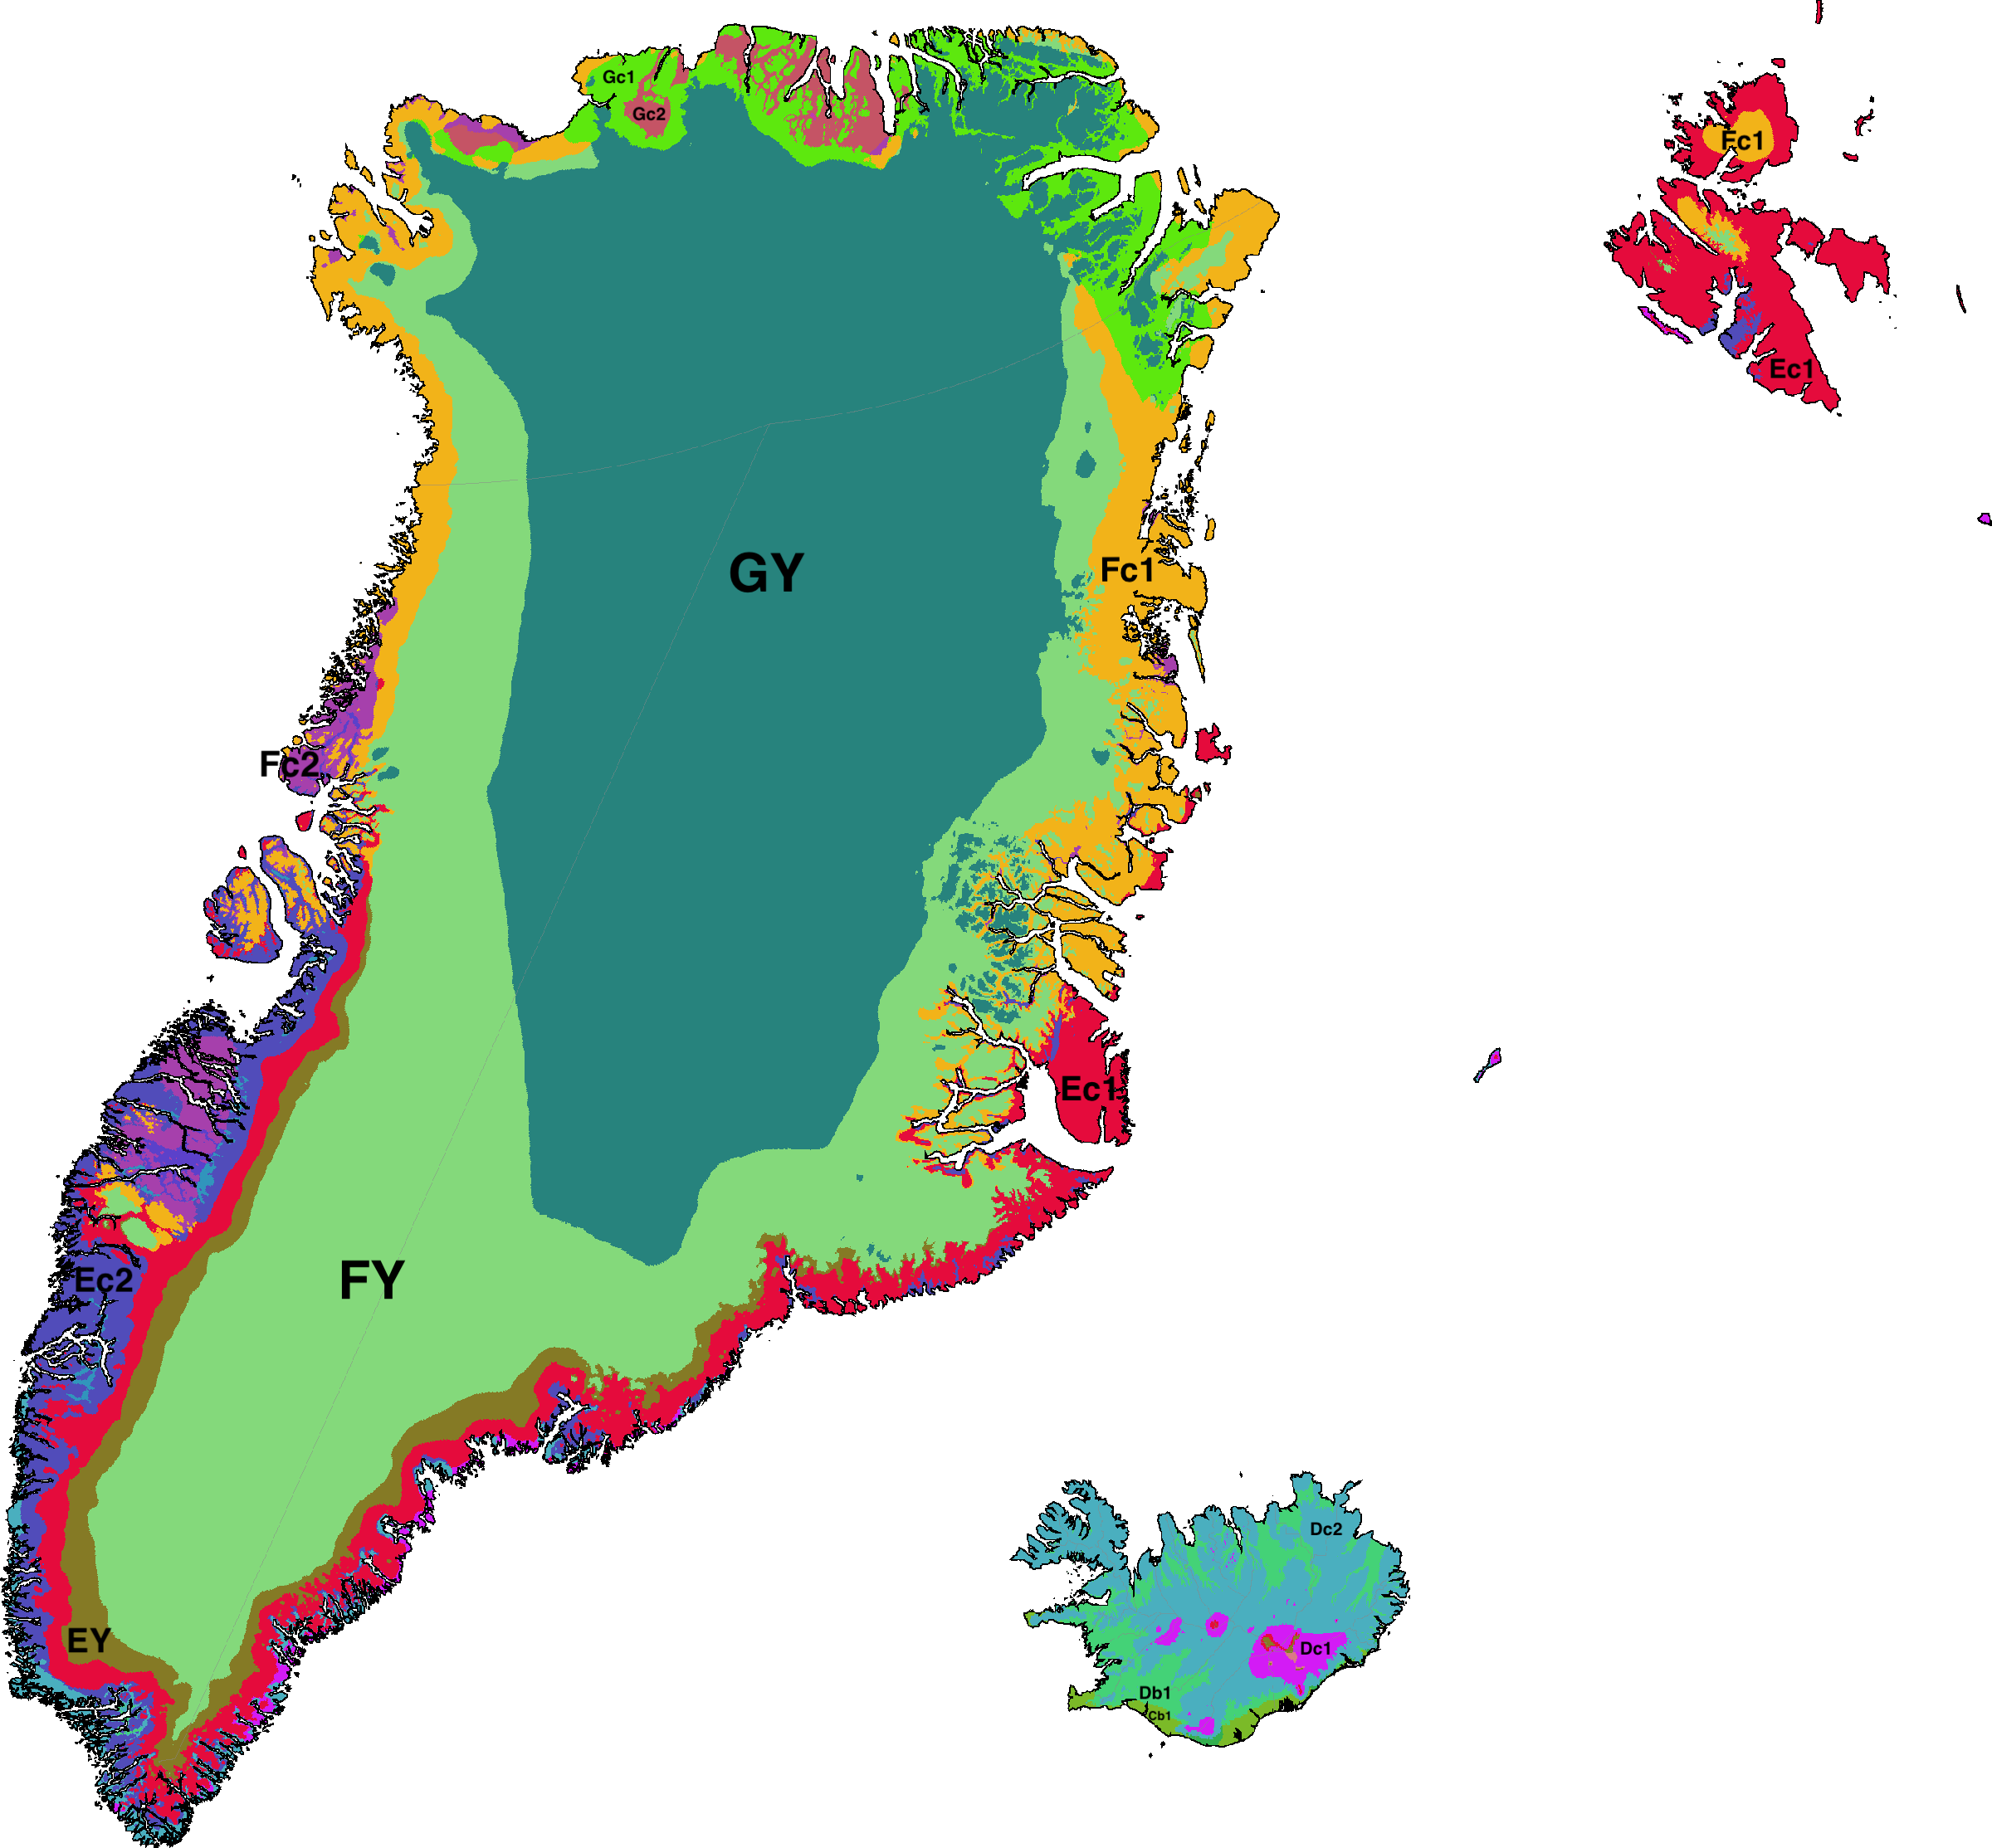
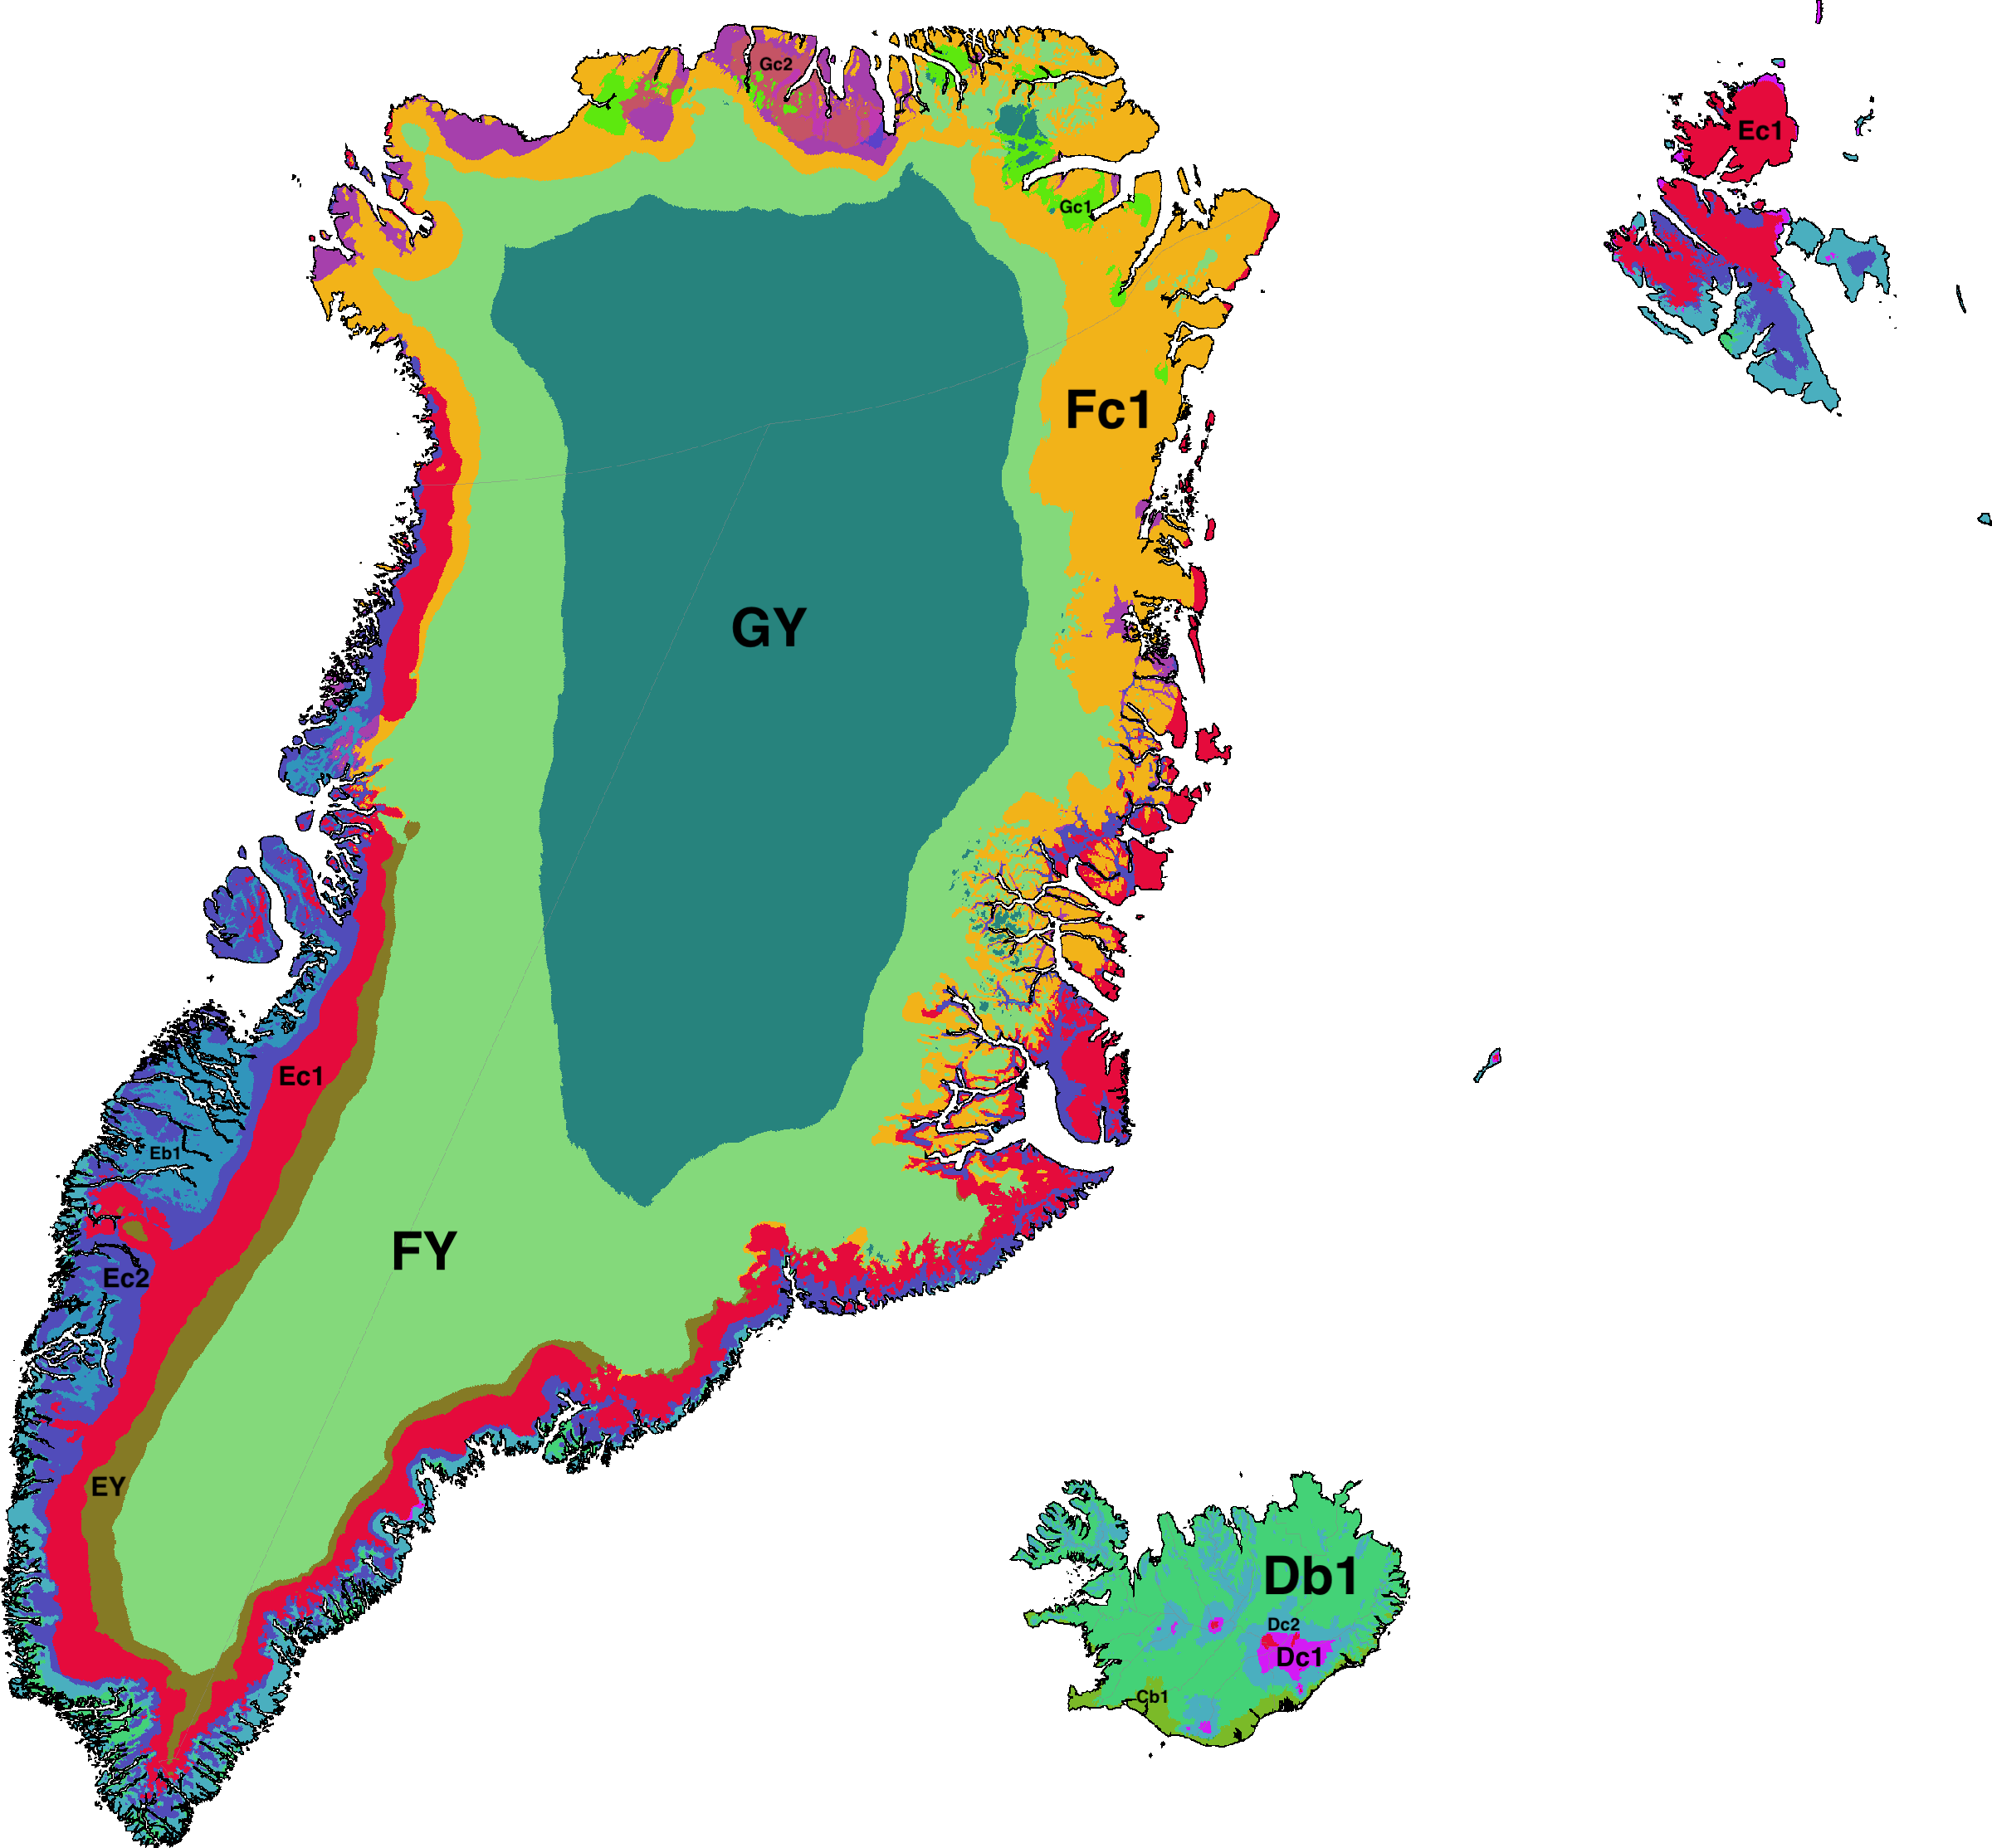
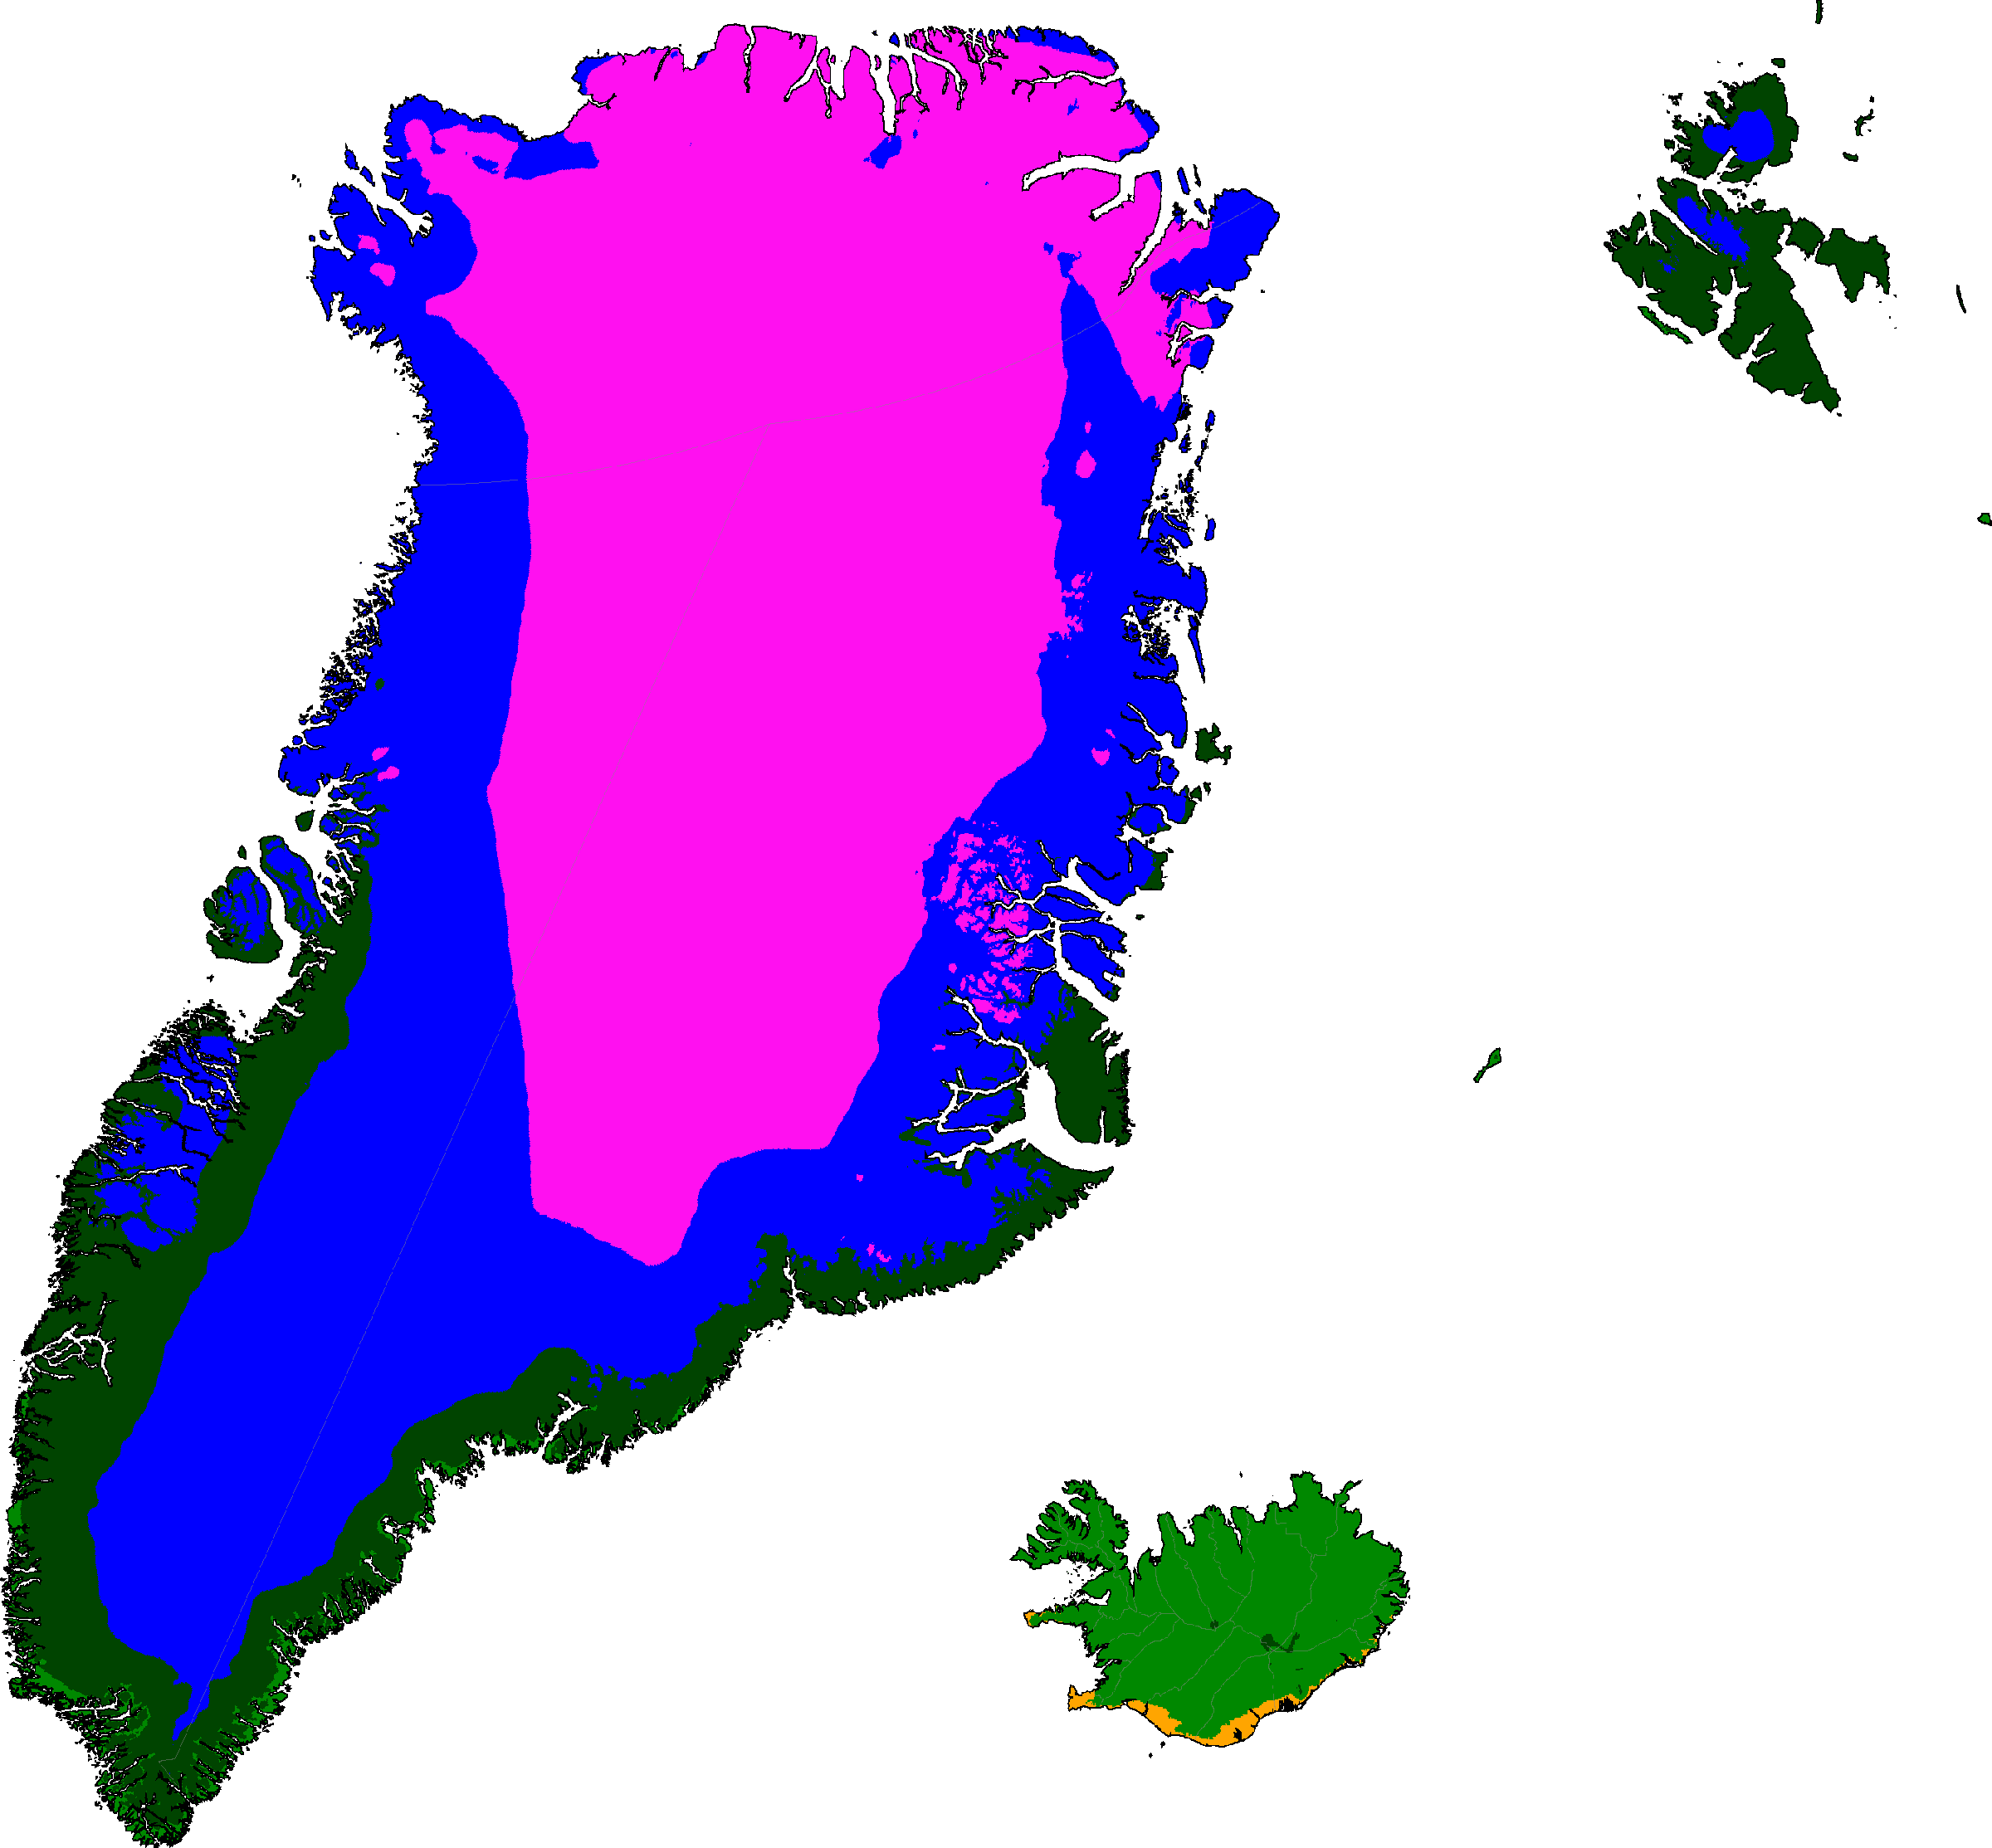
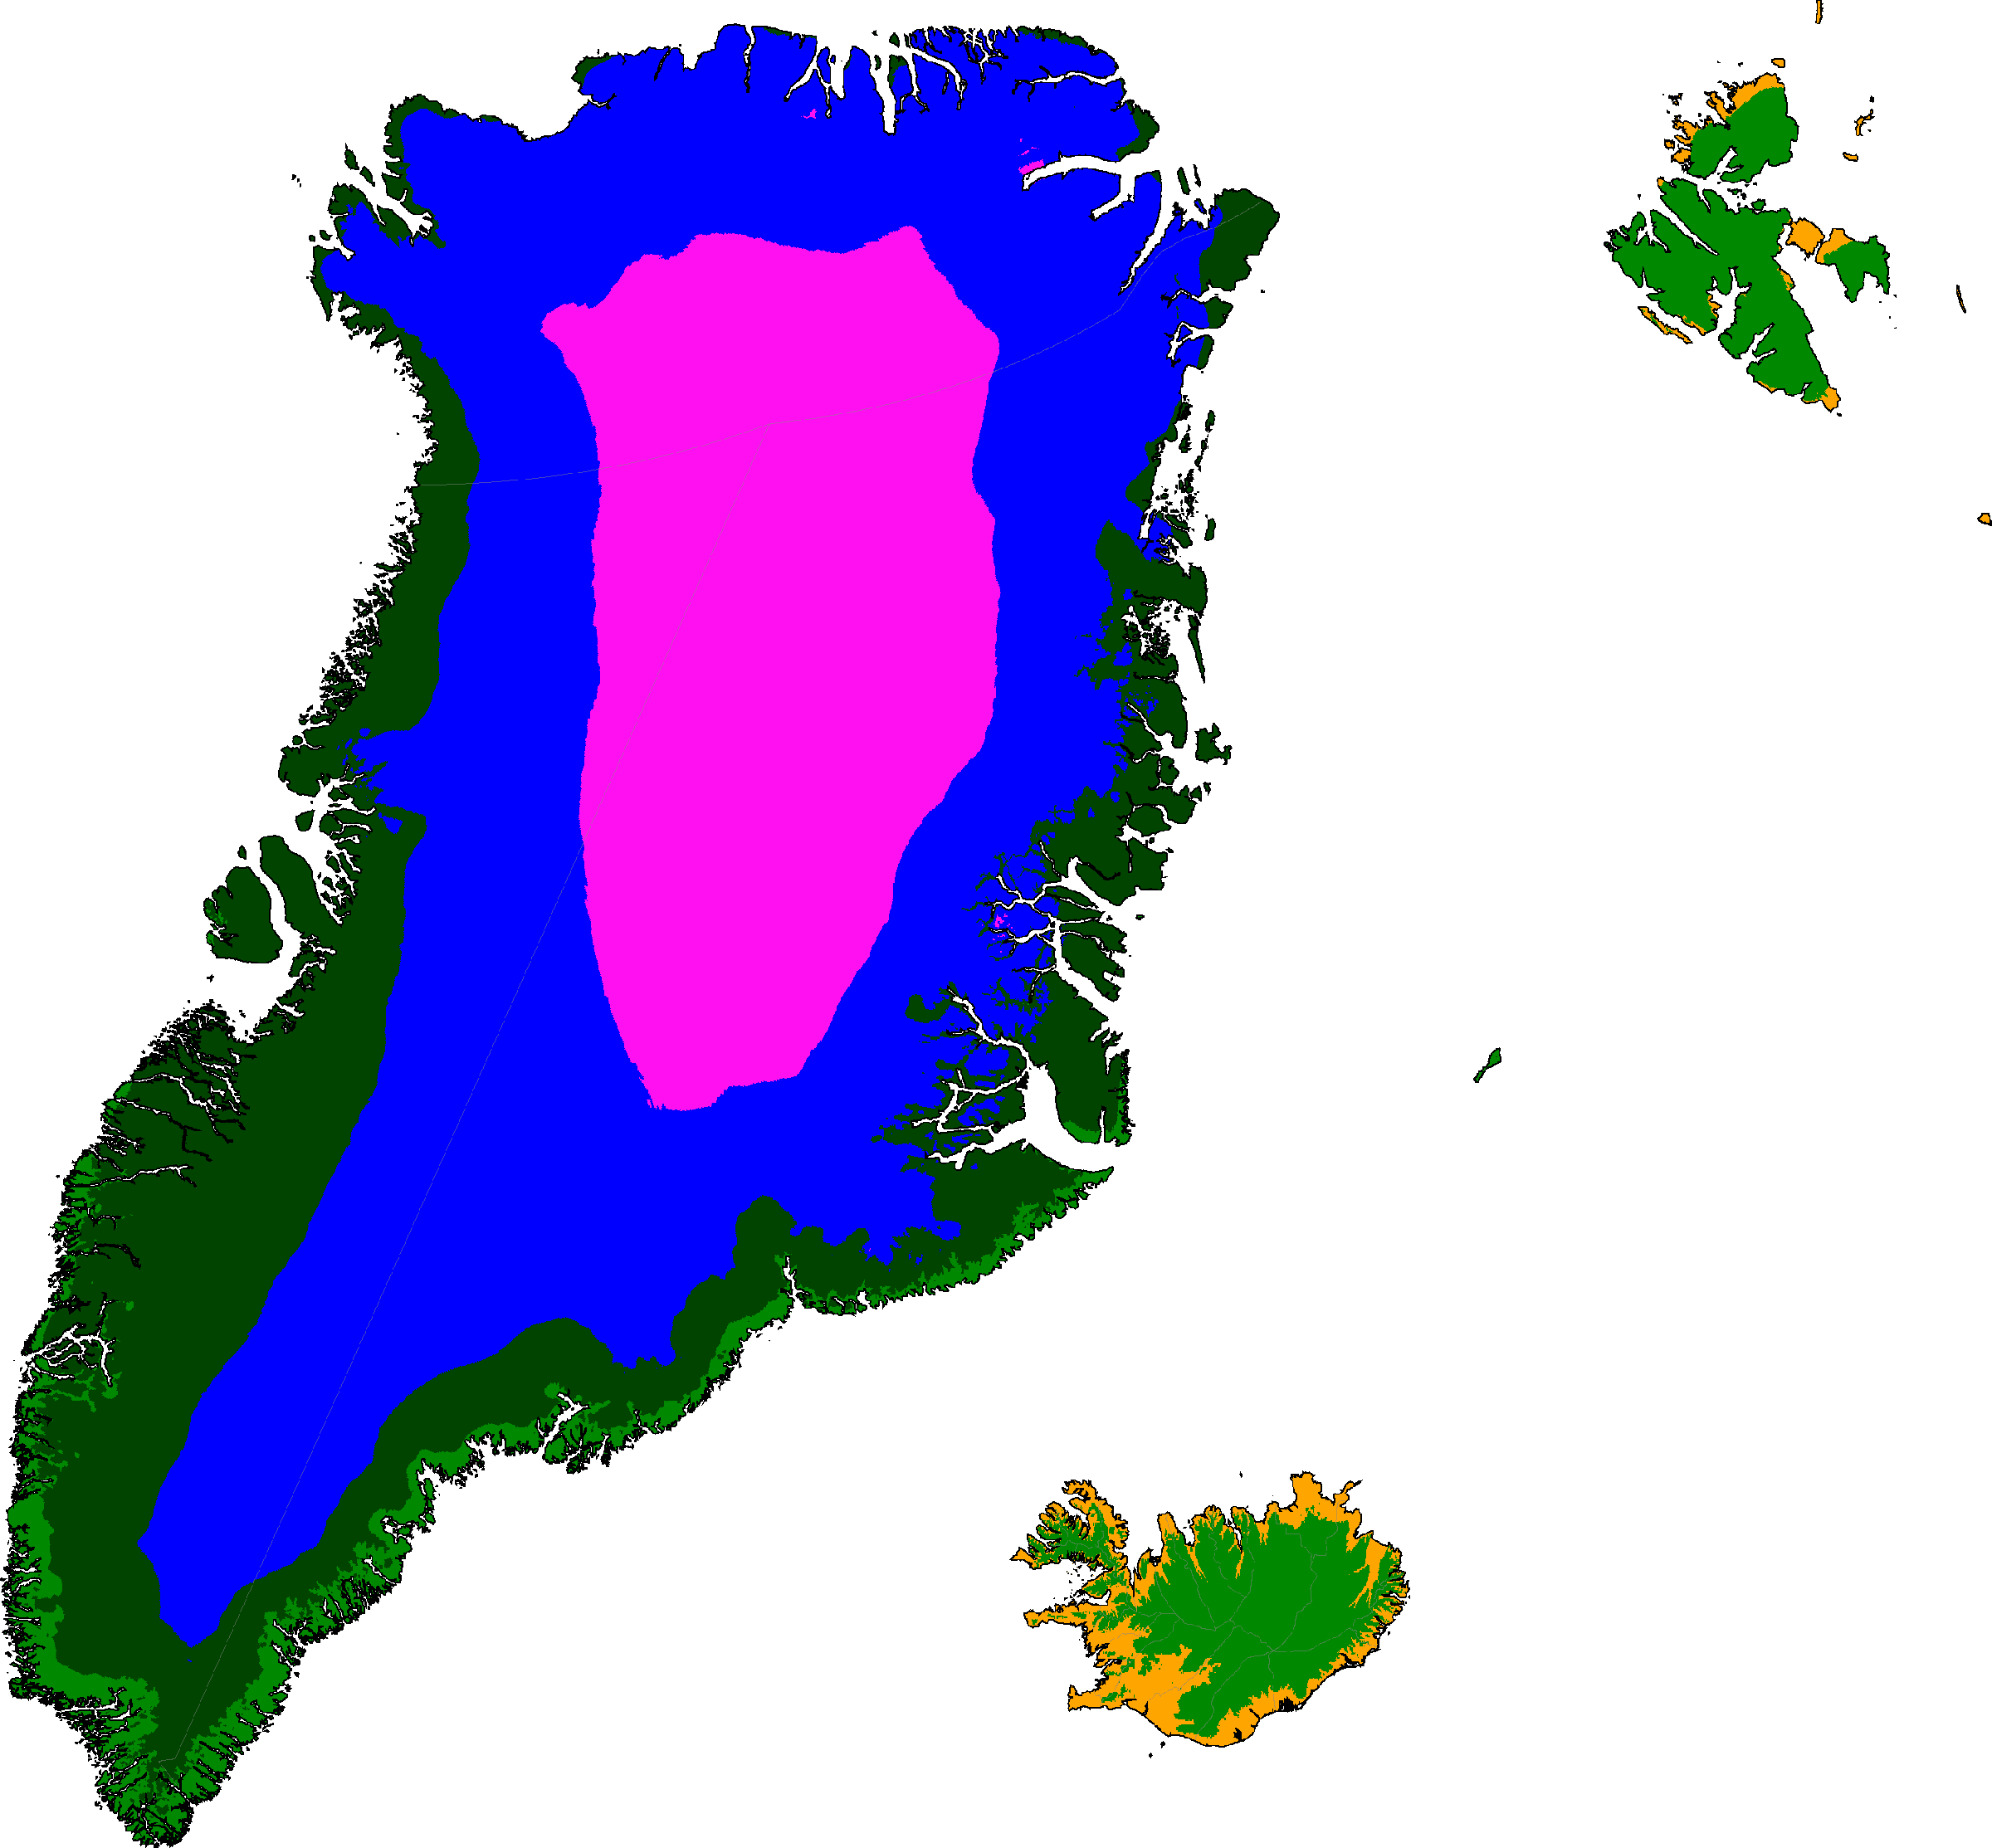
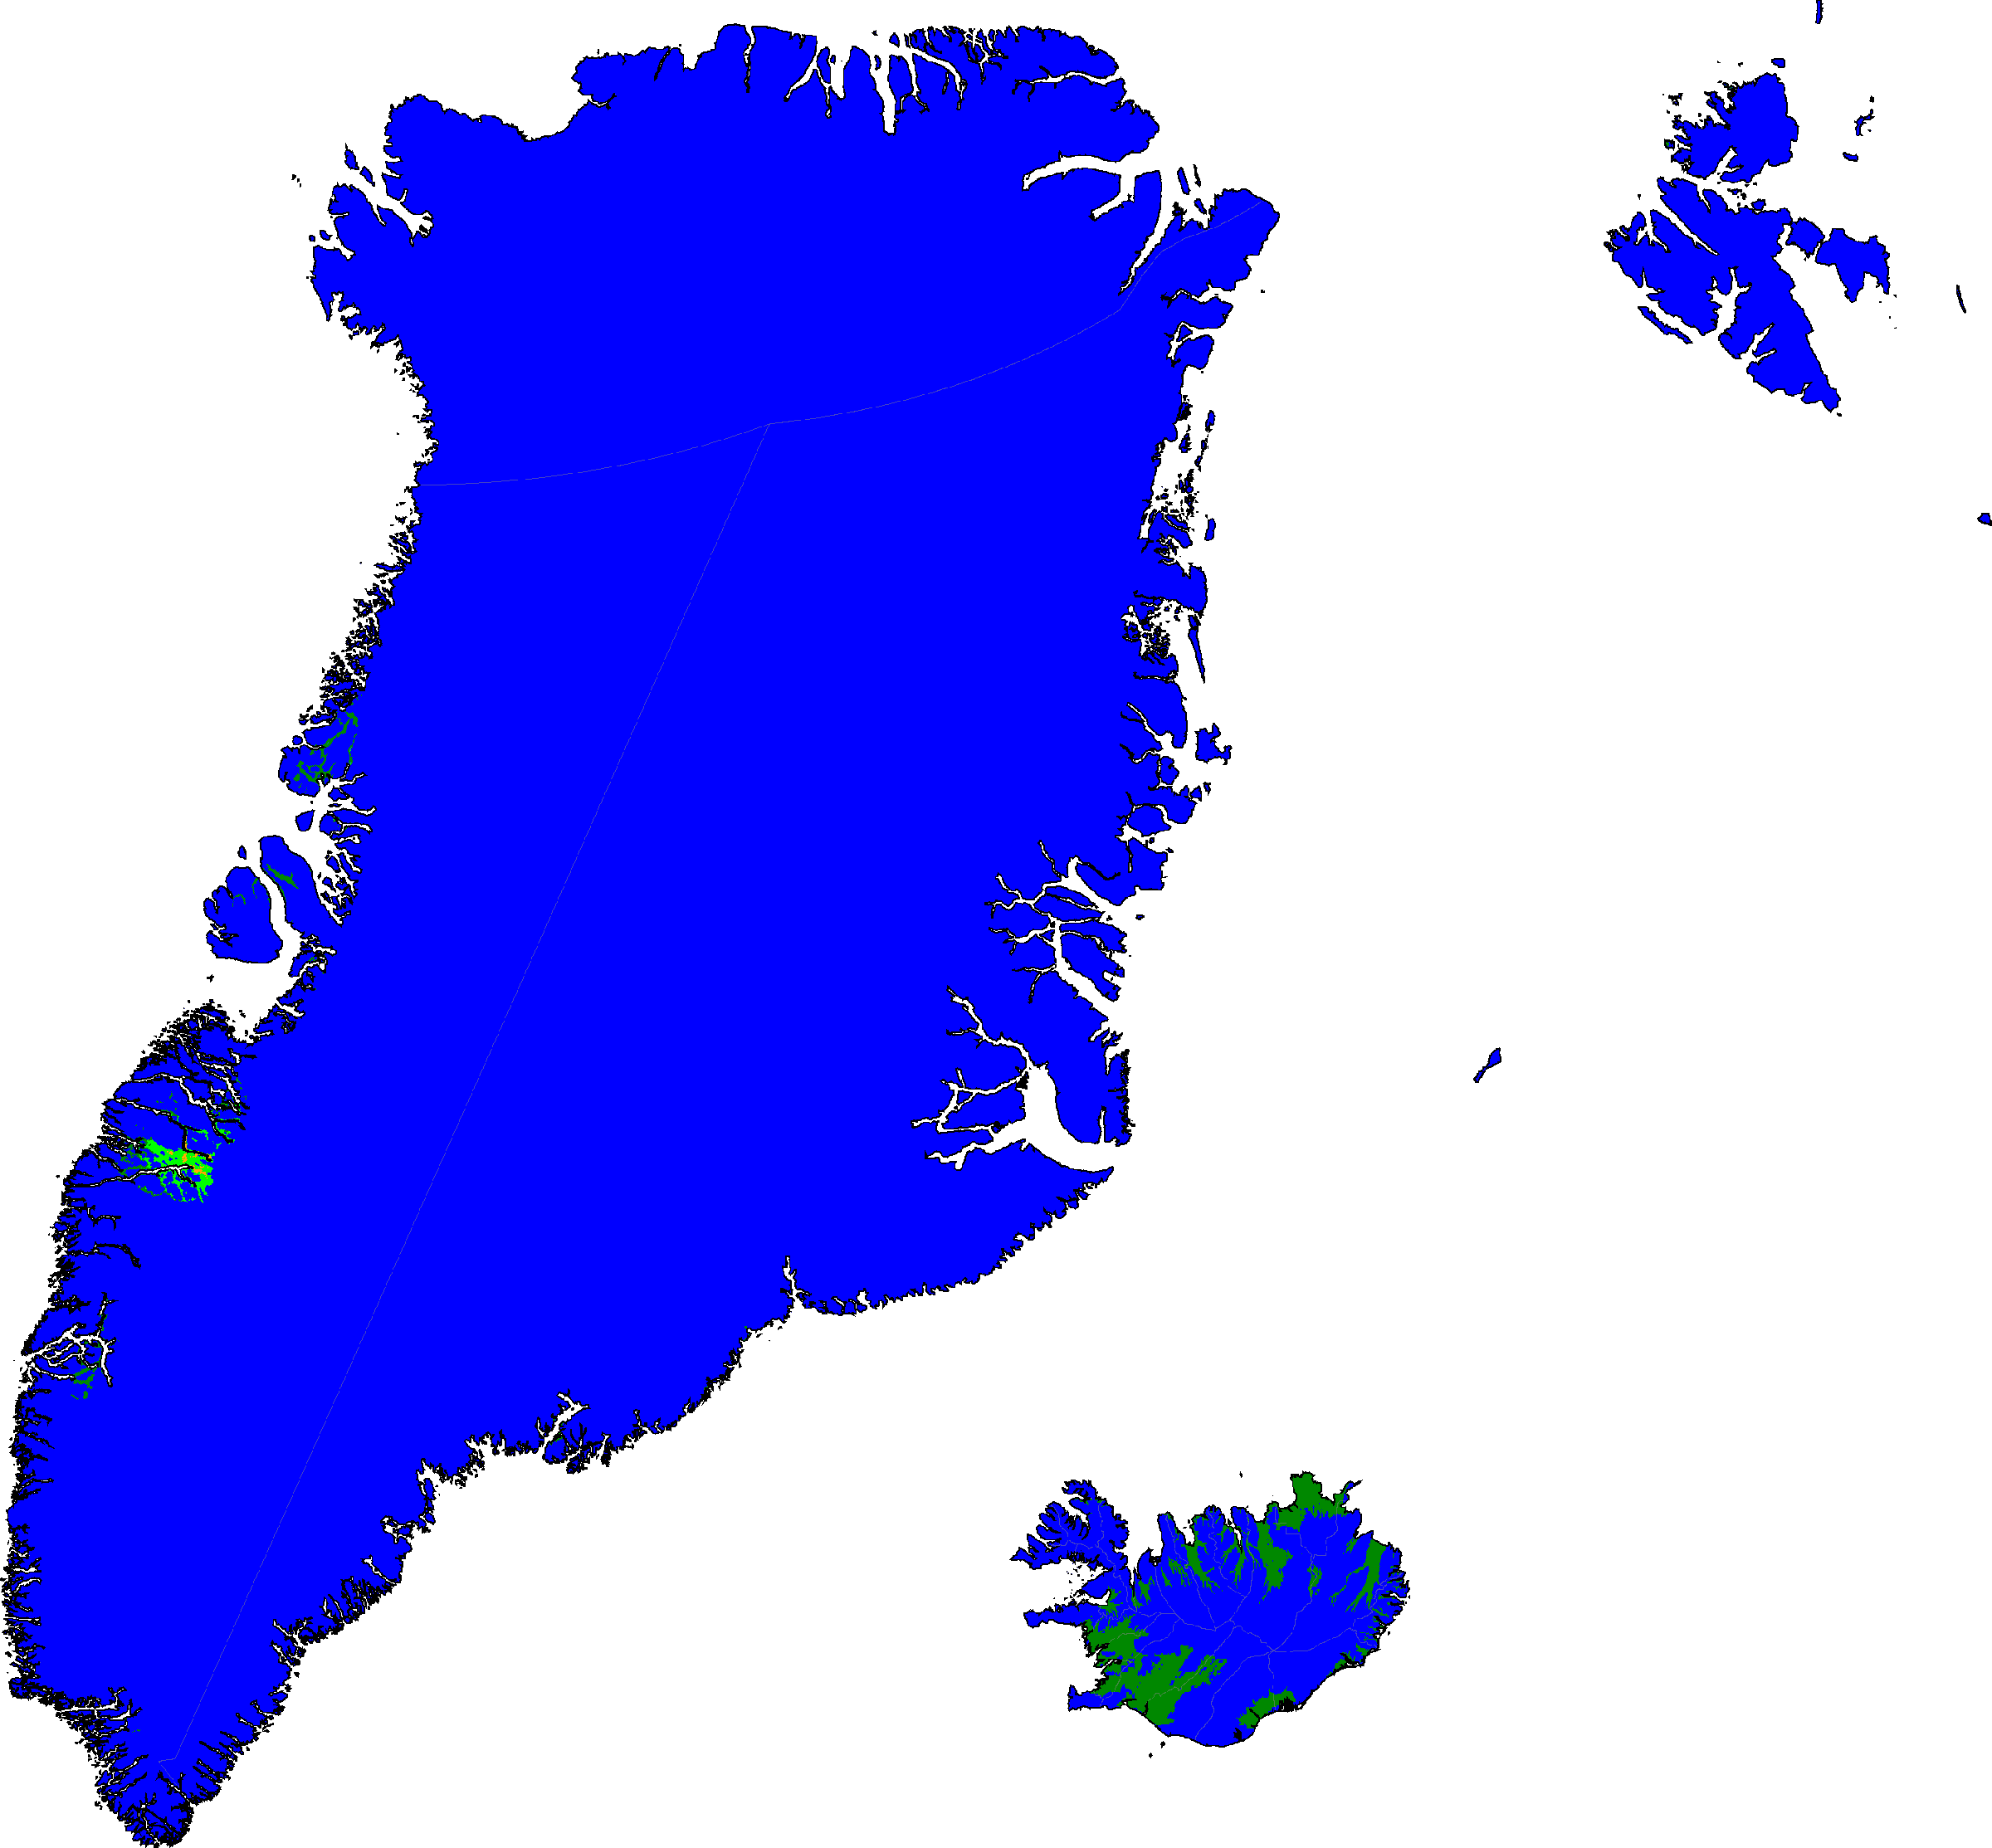
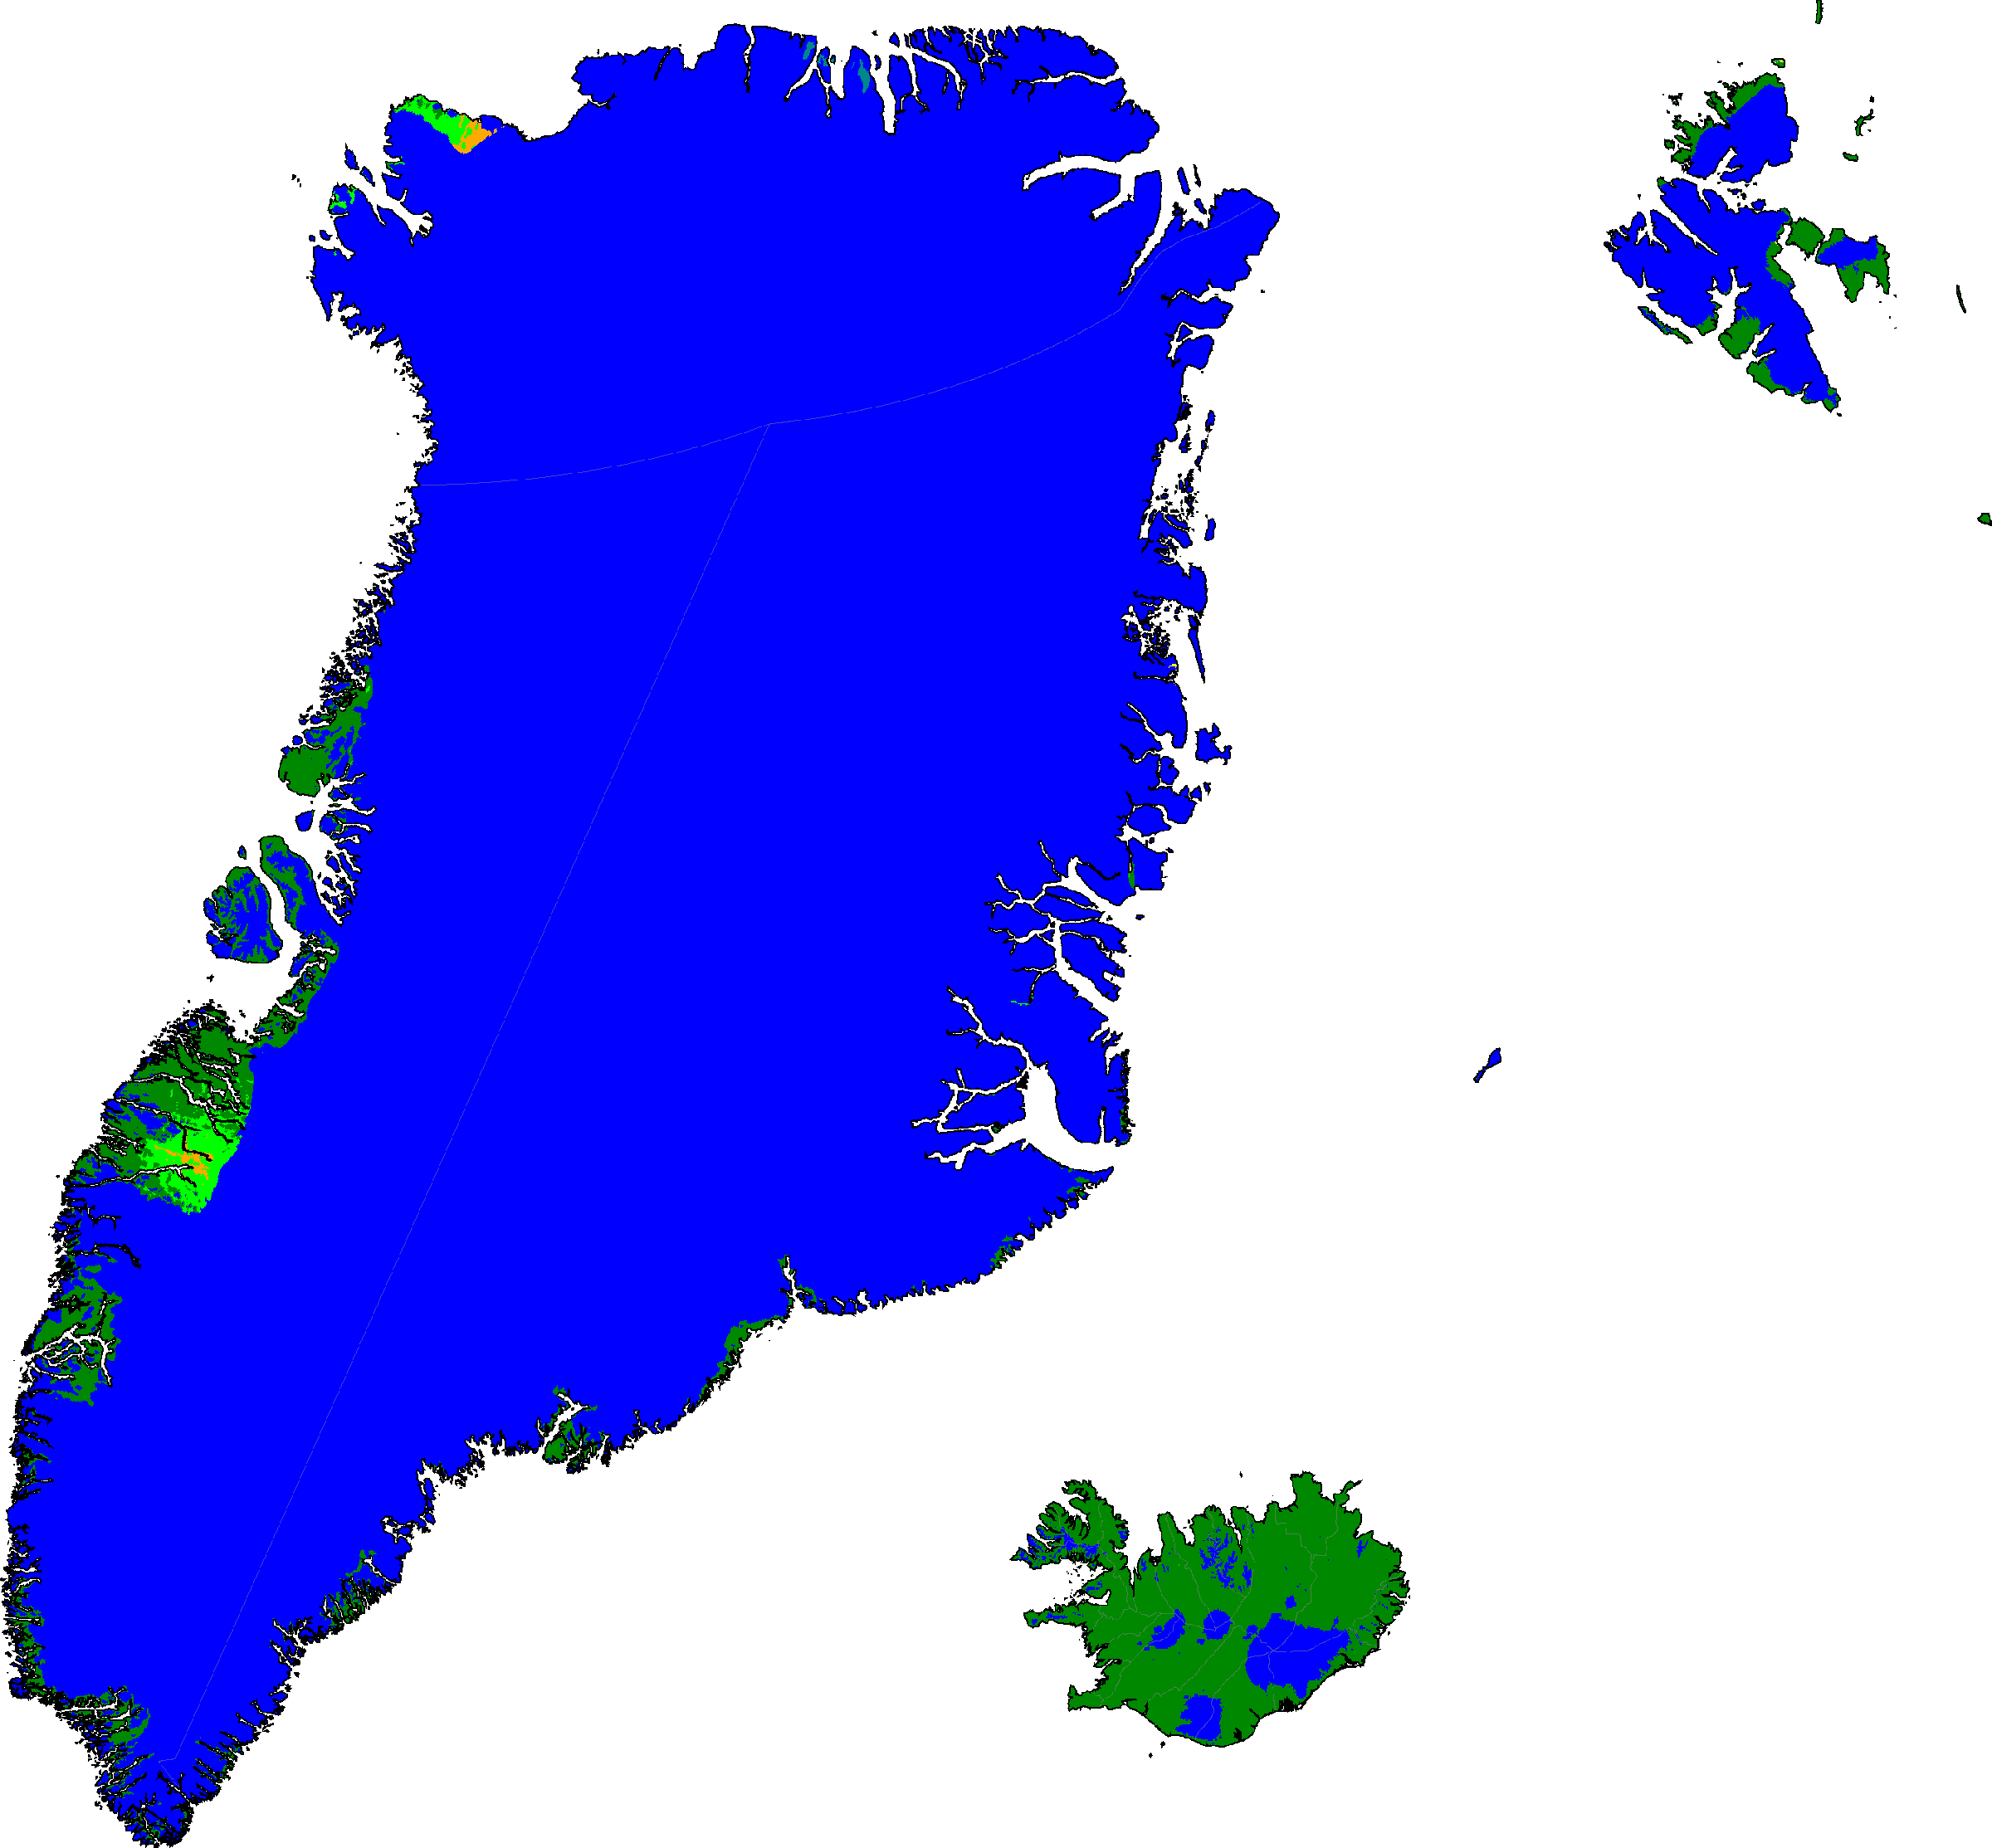
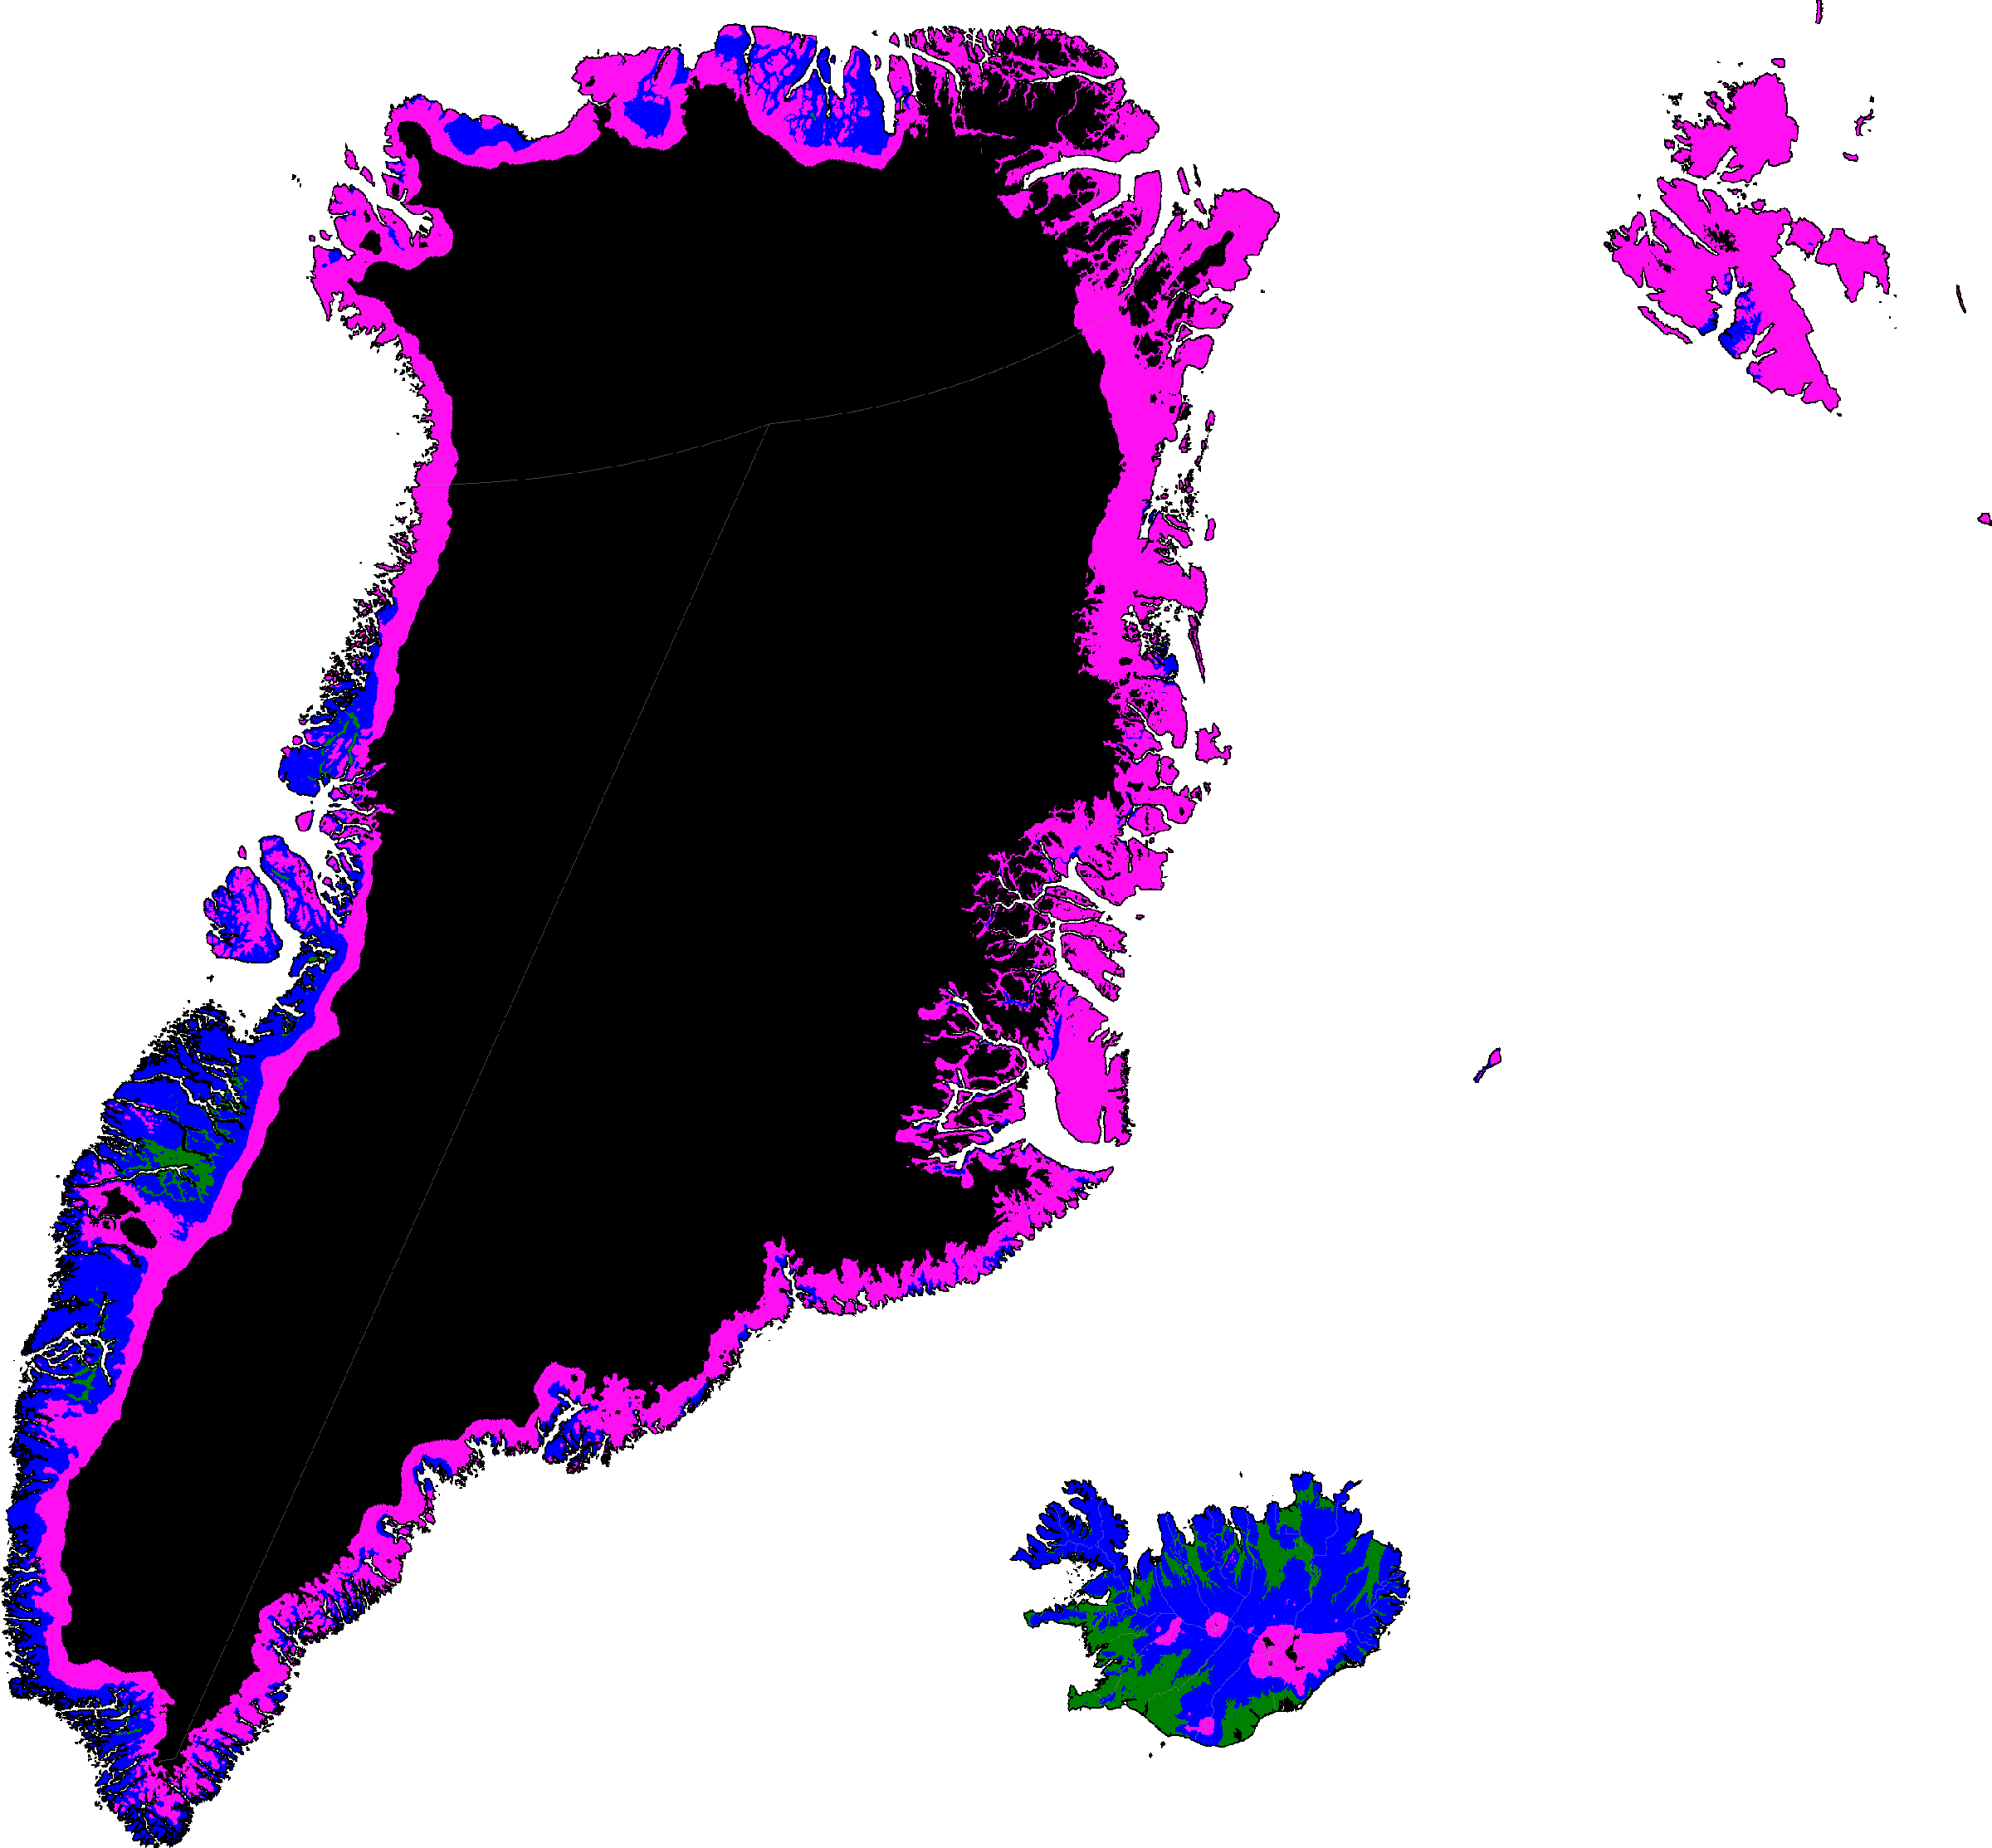
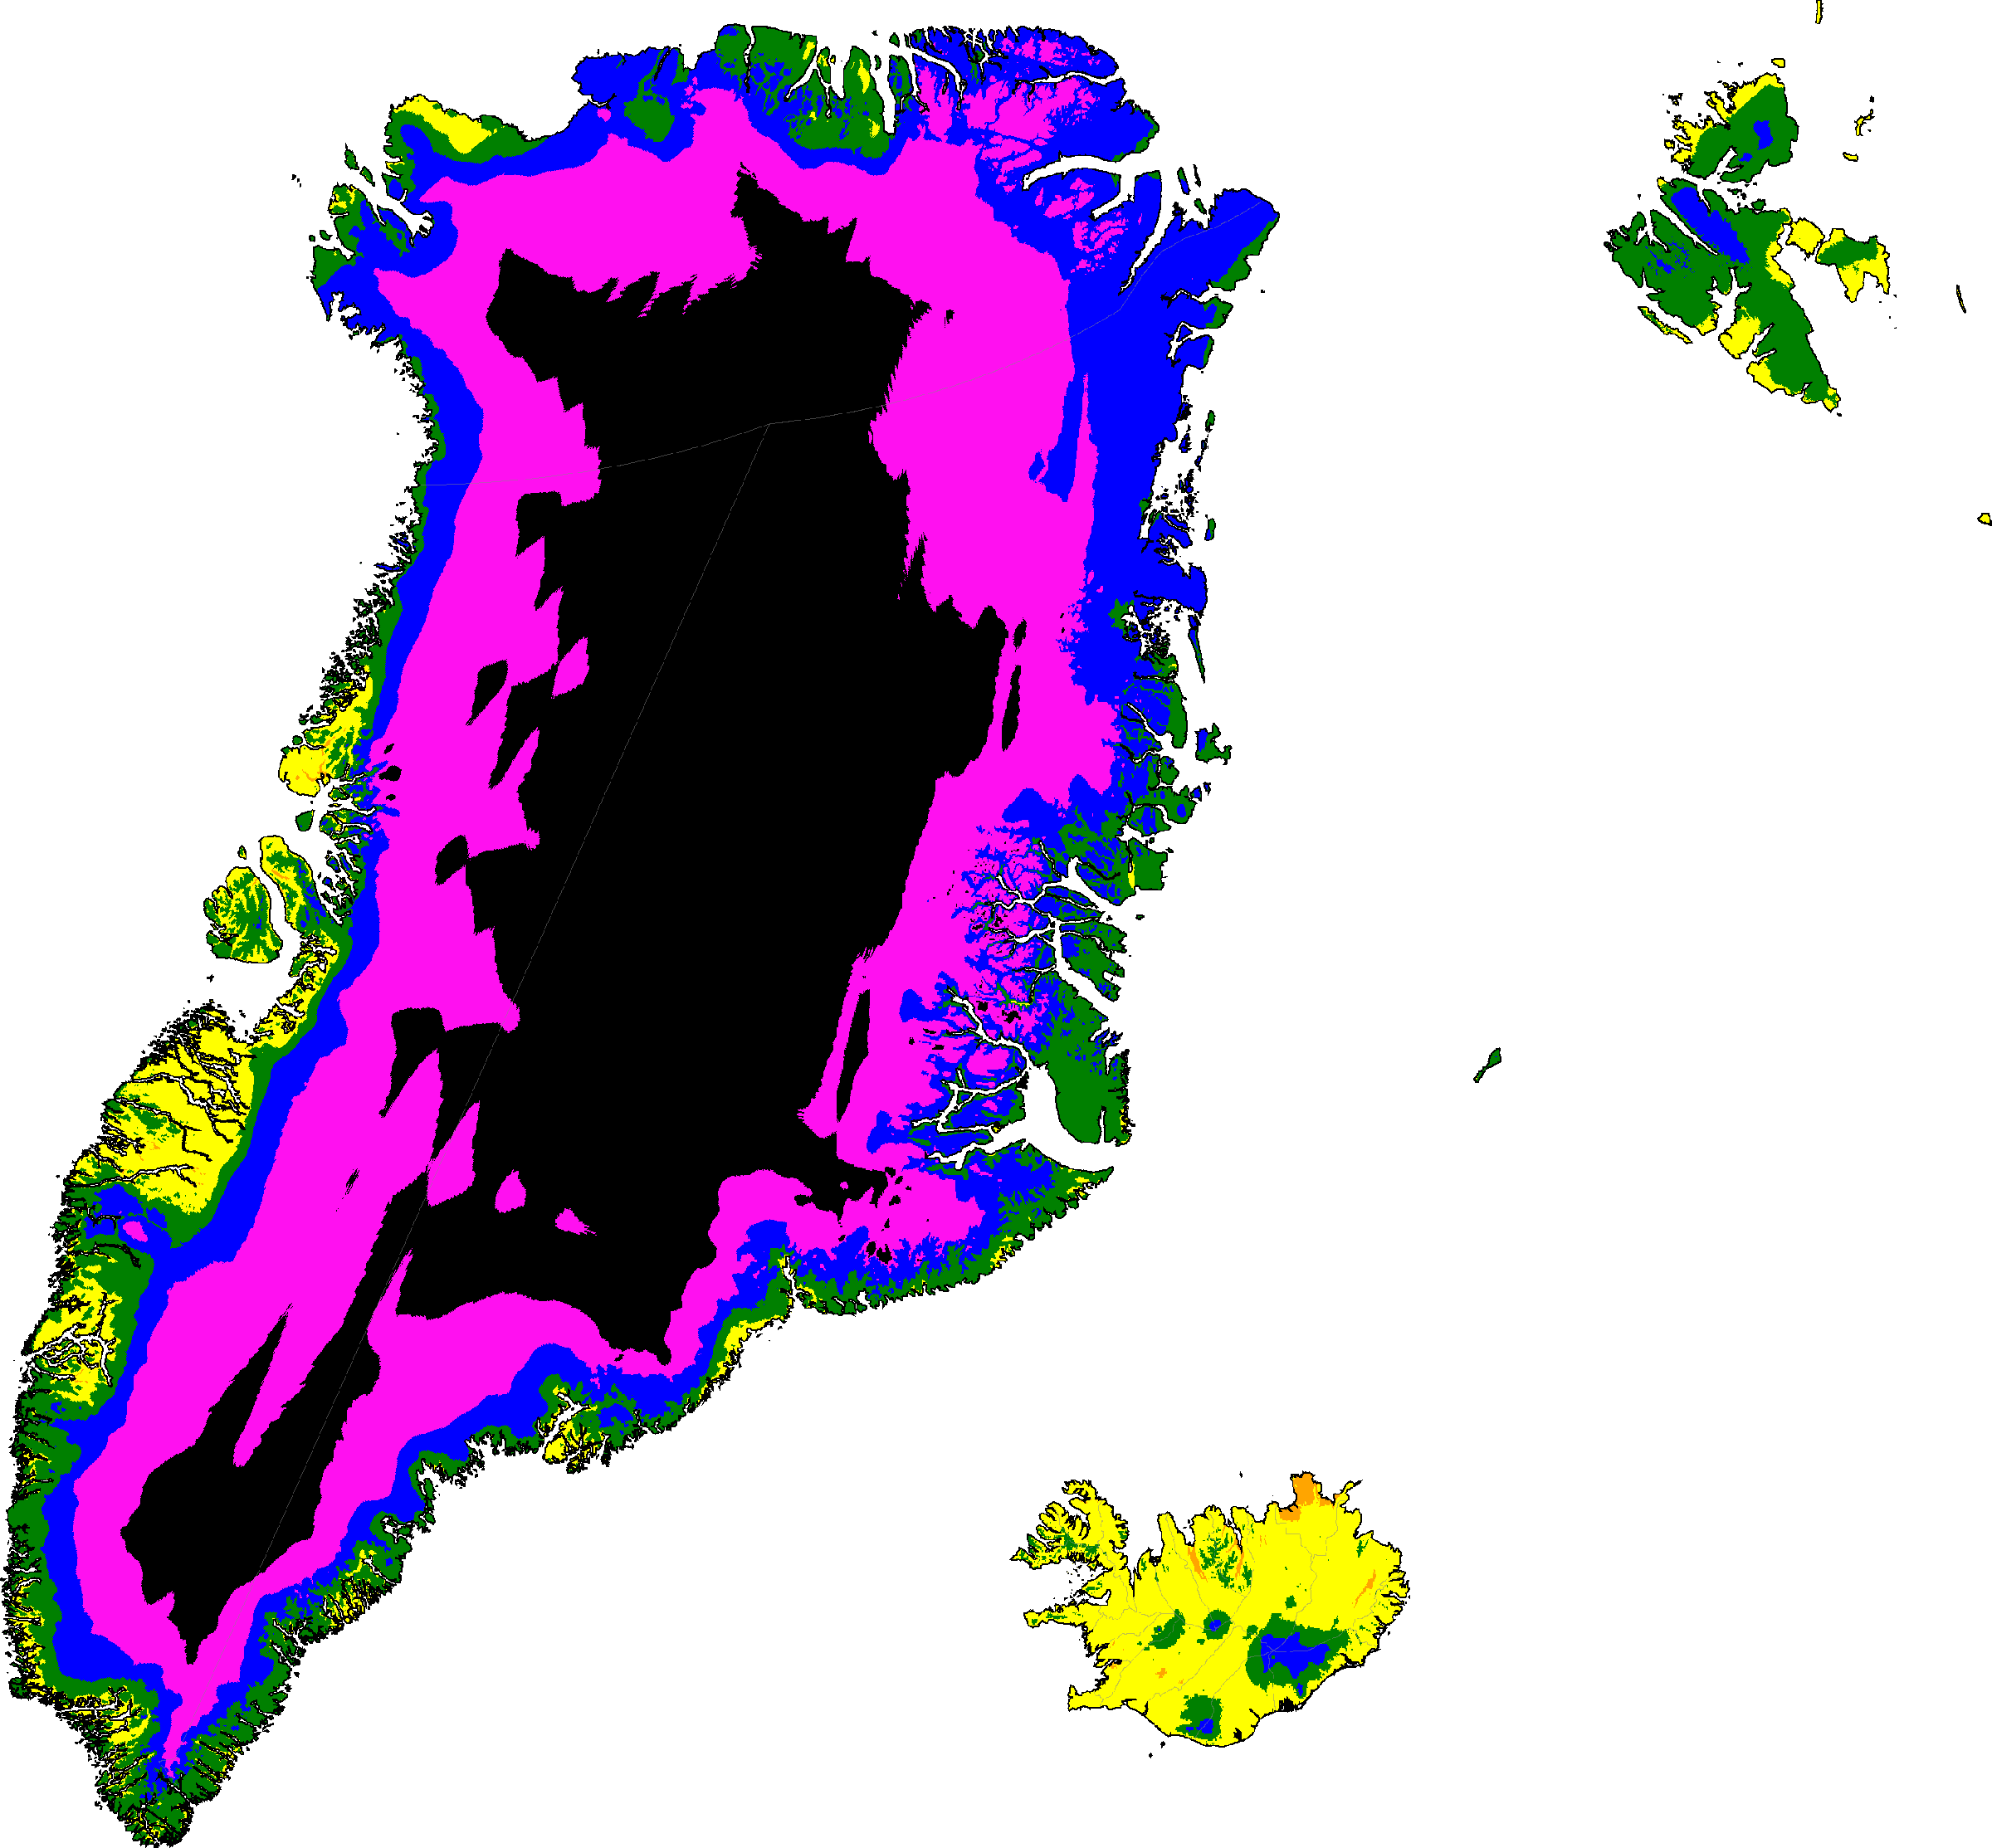
Greenland and Iceland distribution of classifications (projections are SSP5-8.5 high emissions normals)
Note: Due to the complexity of the system, only the most common climates in each map are labeled.
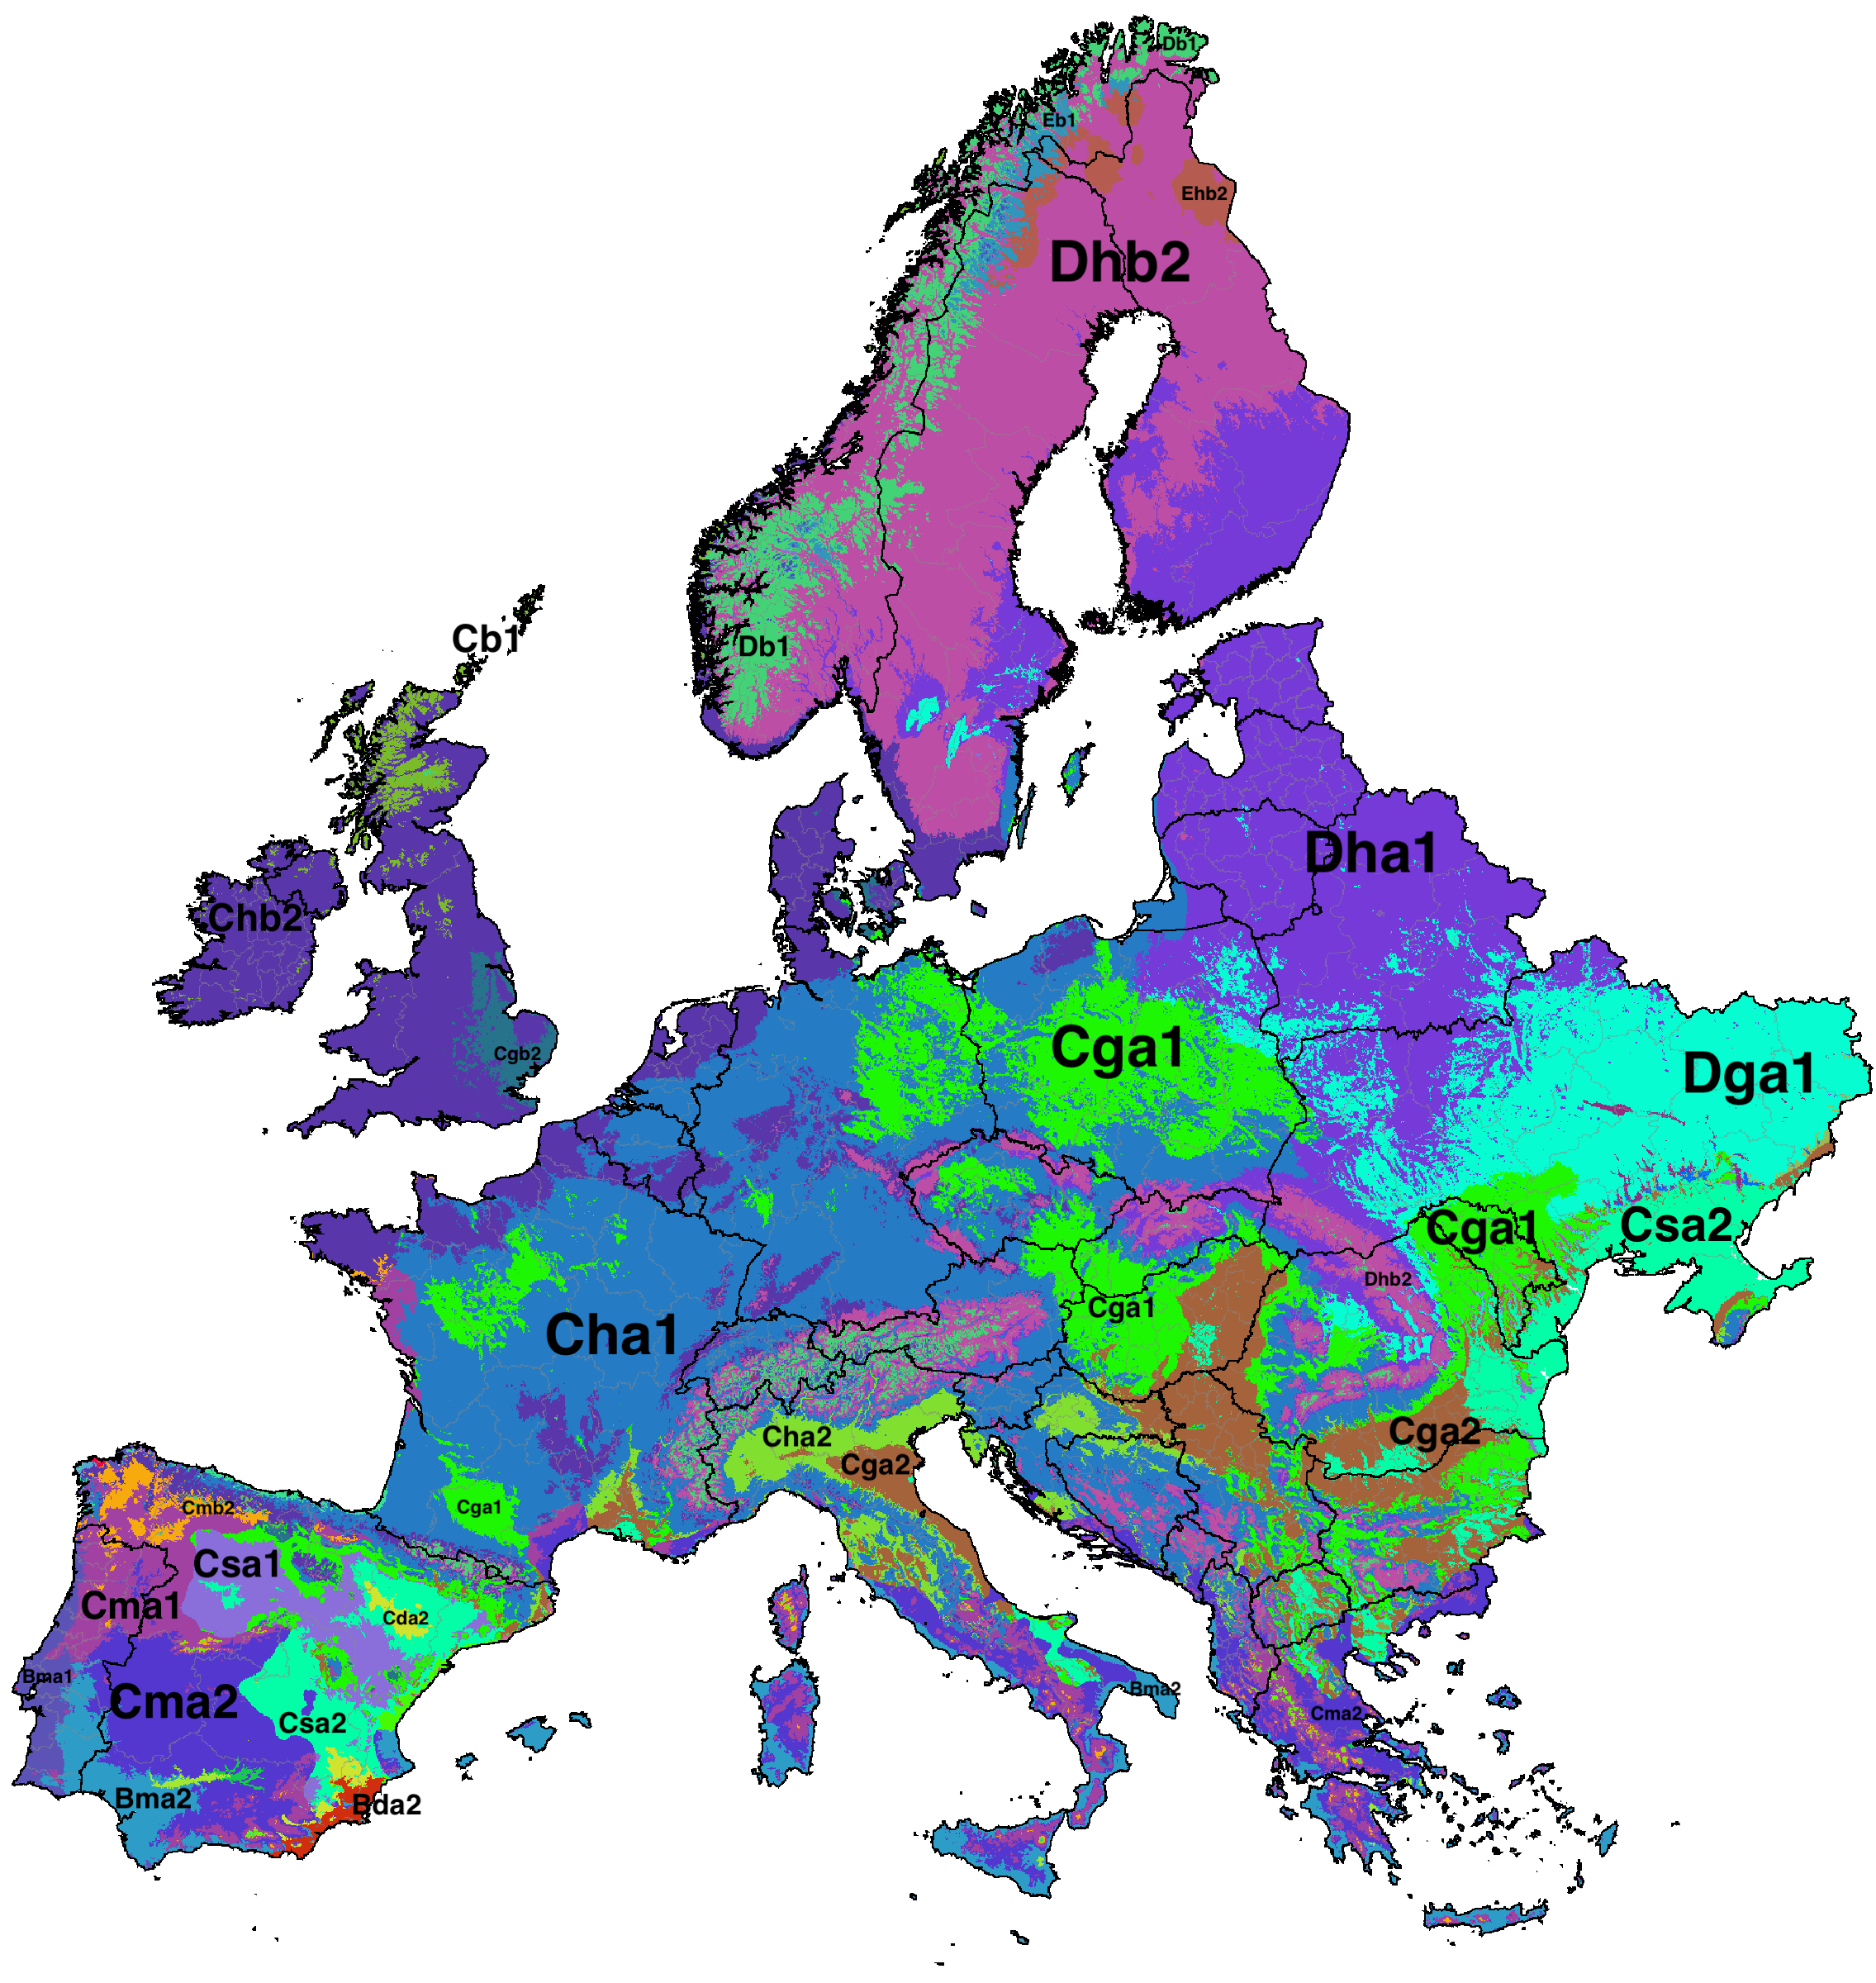
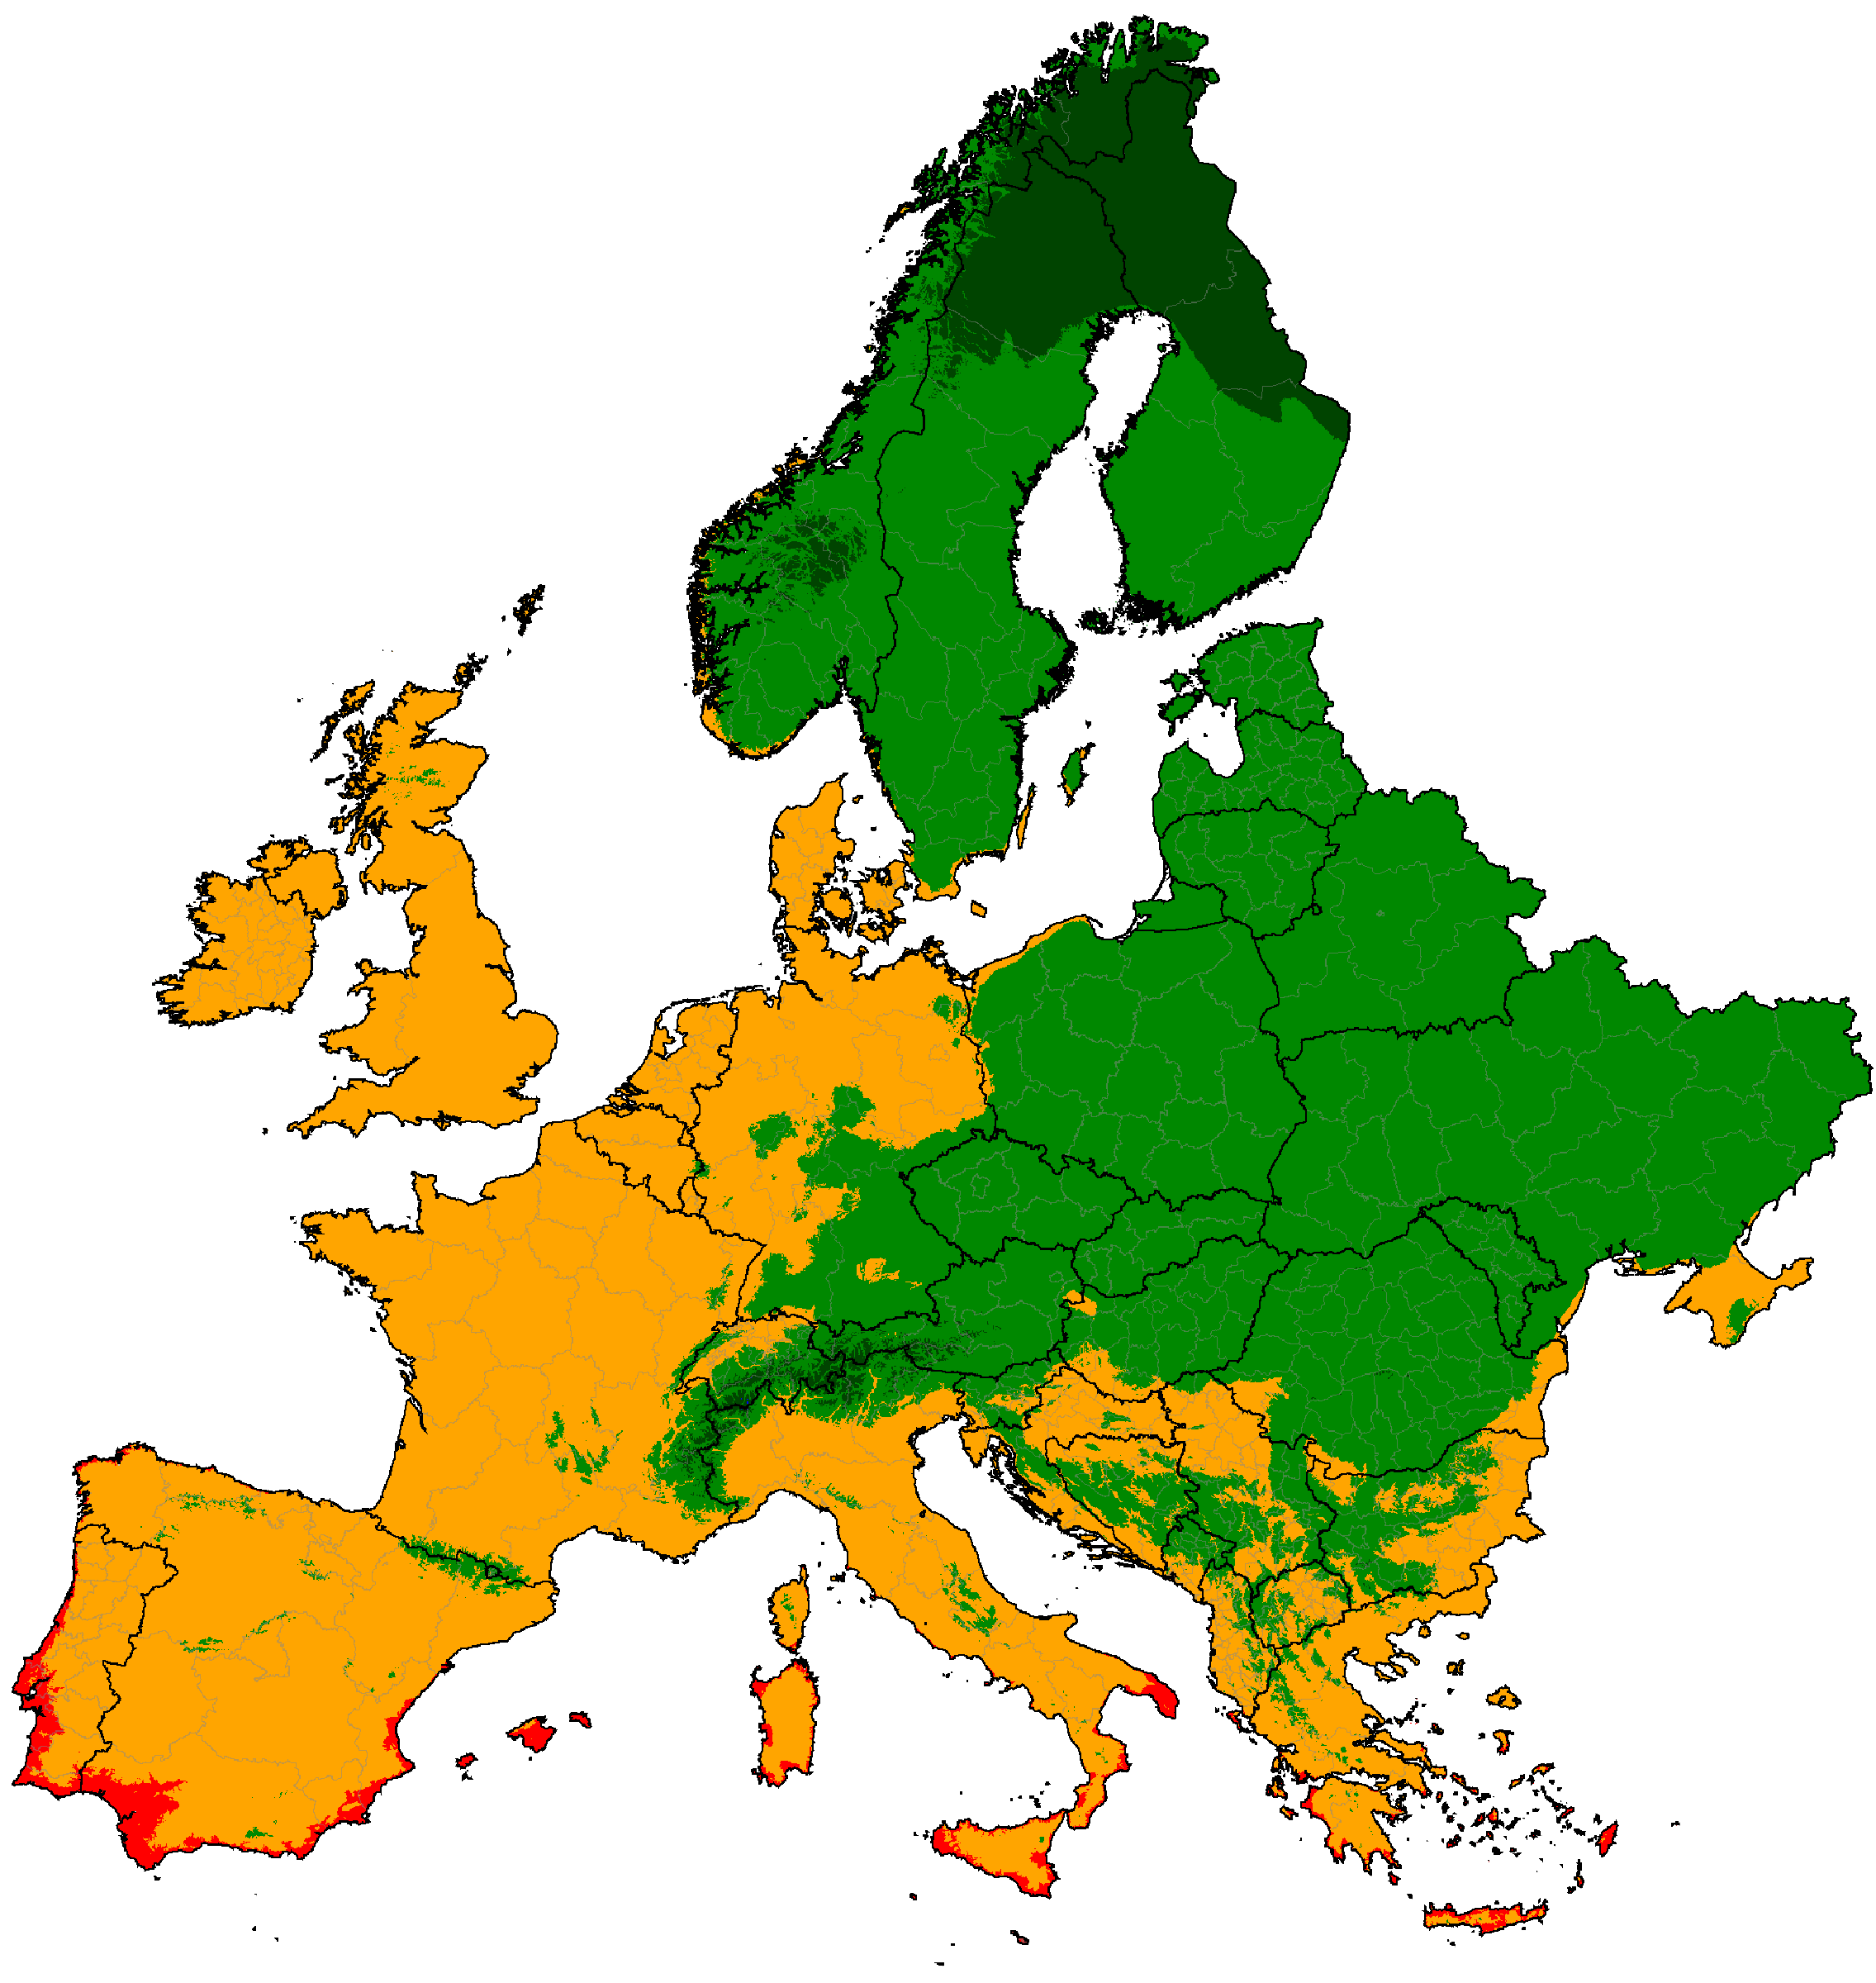
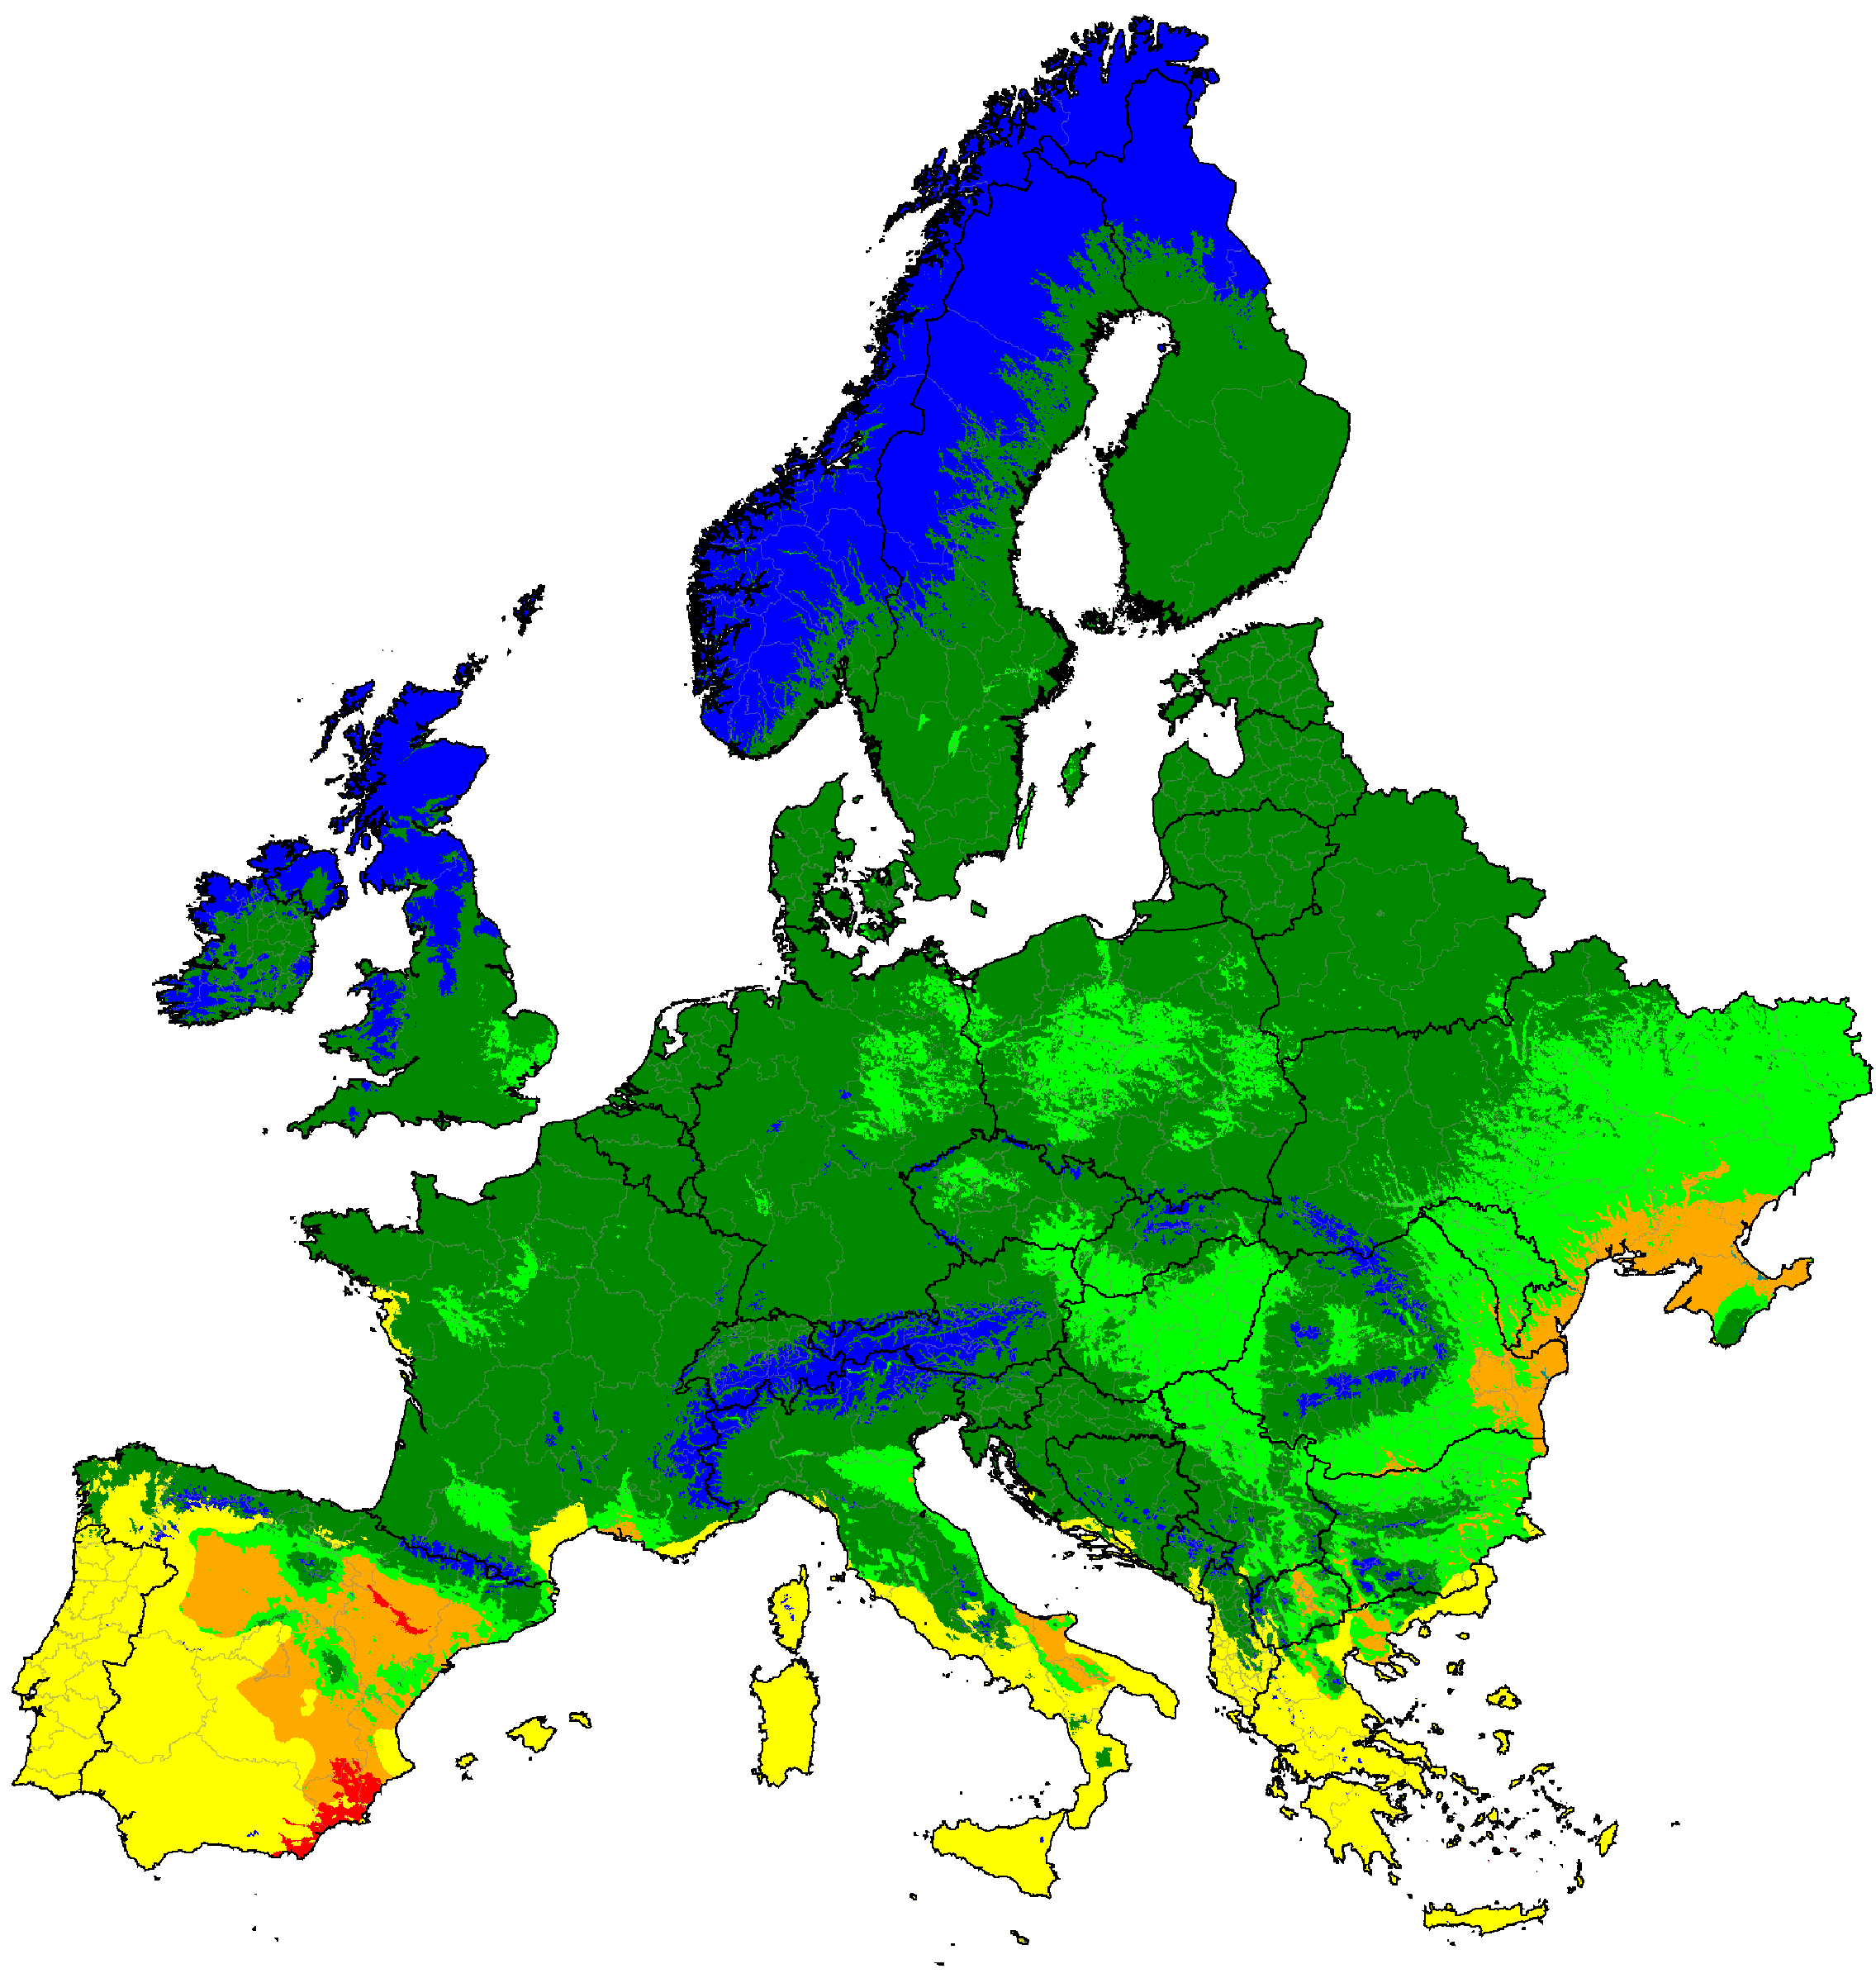
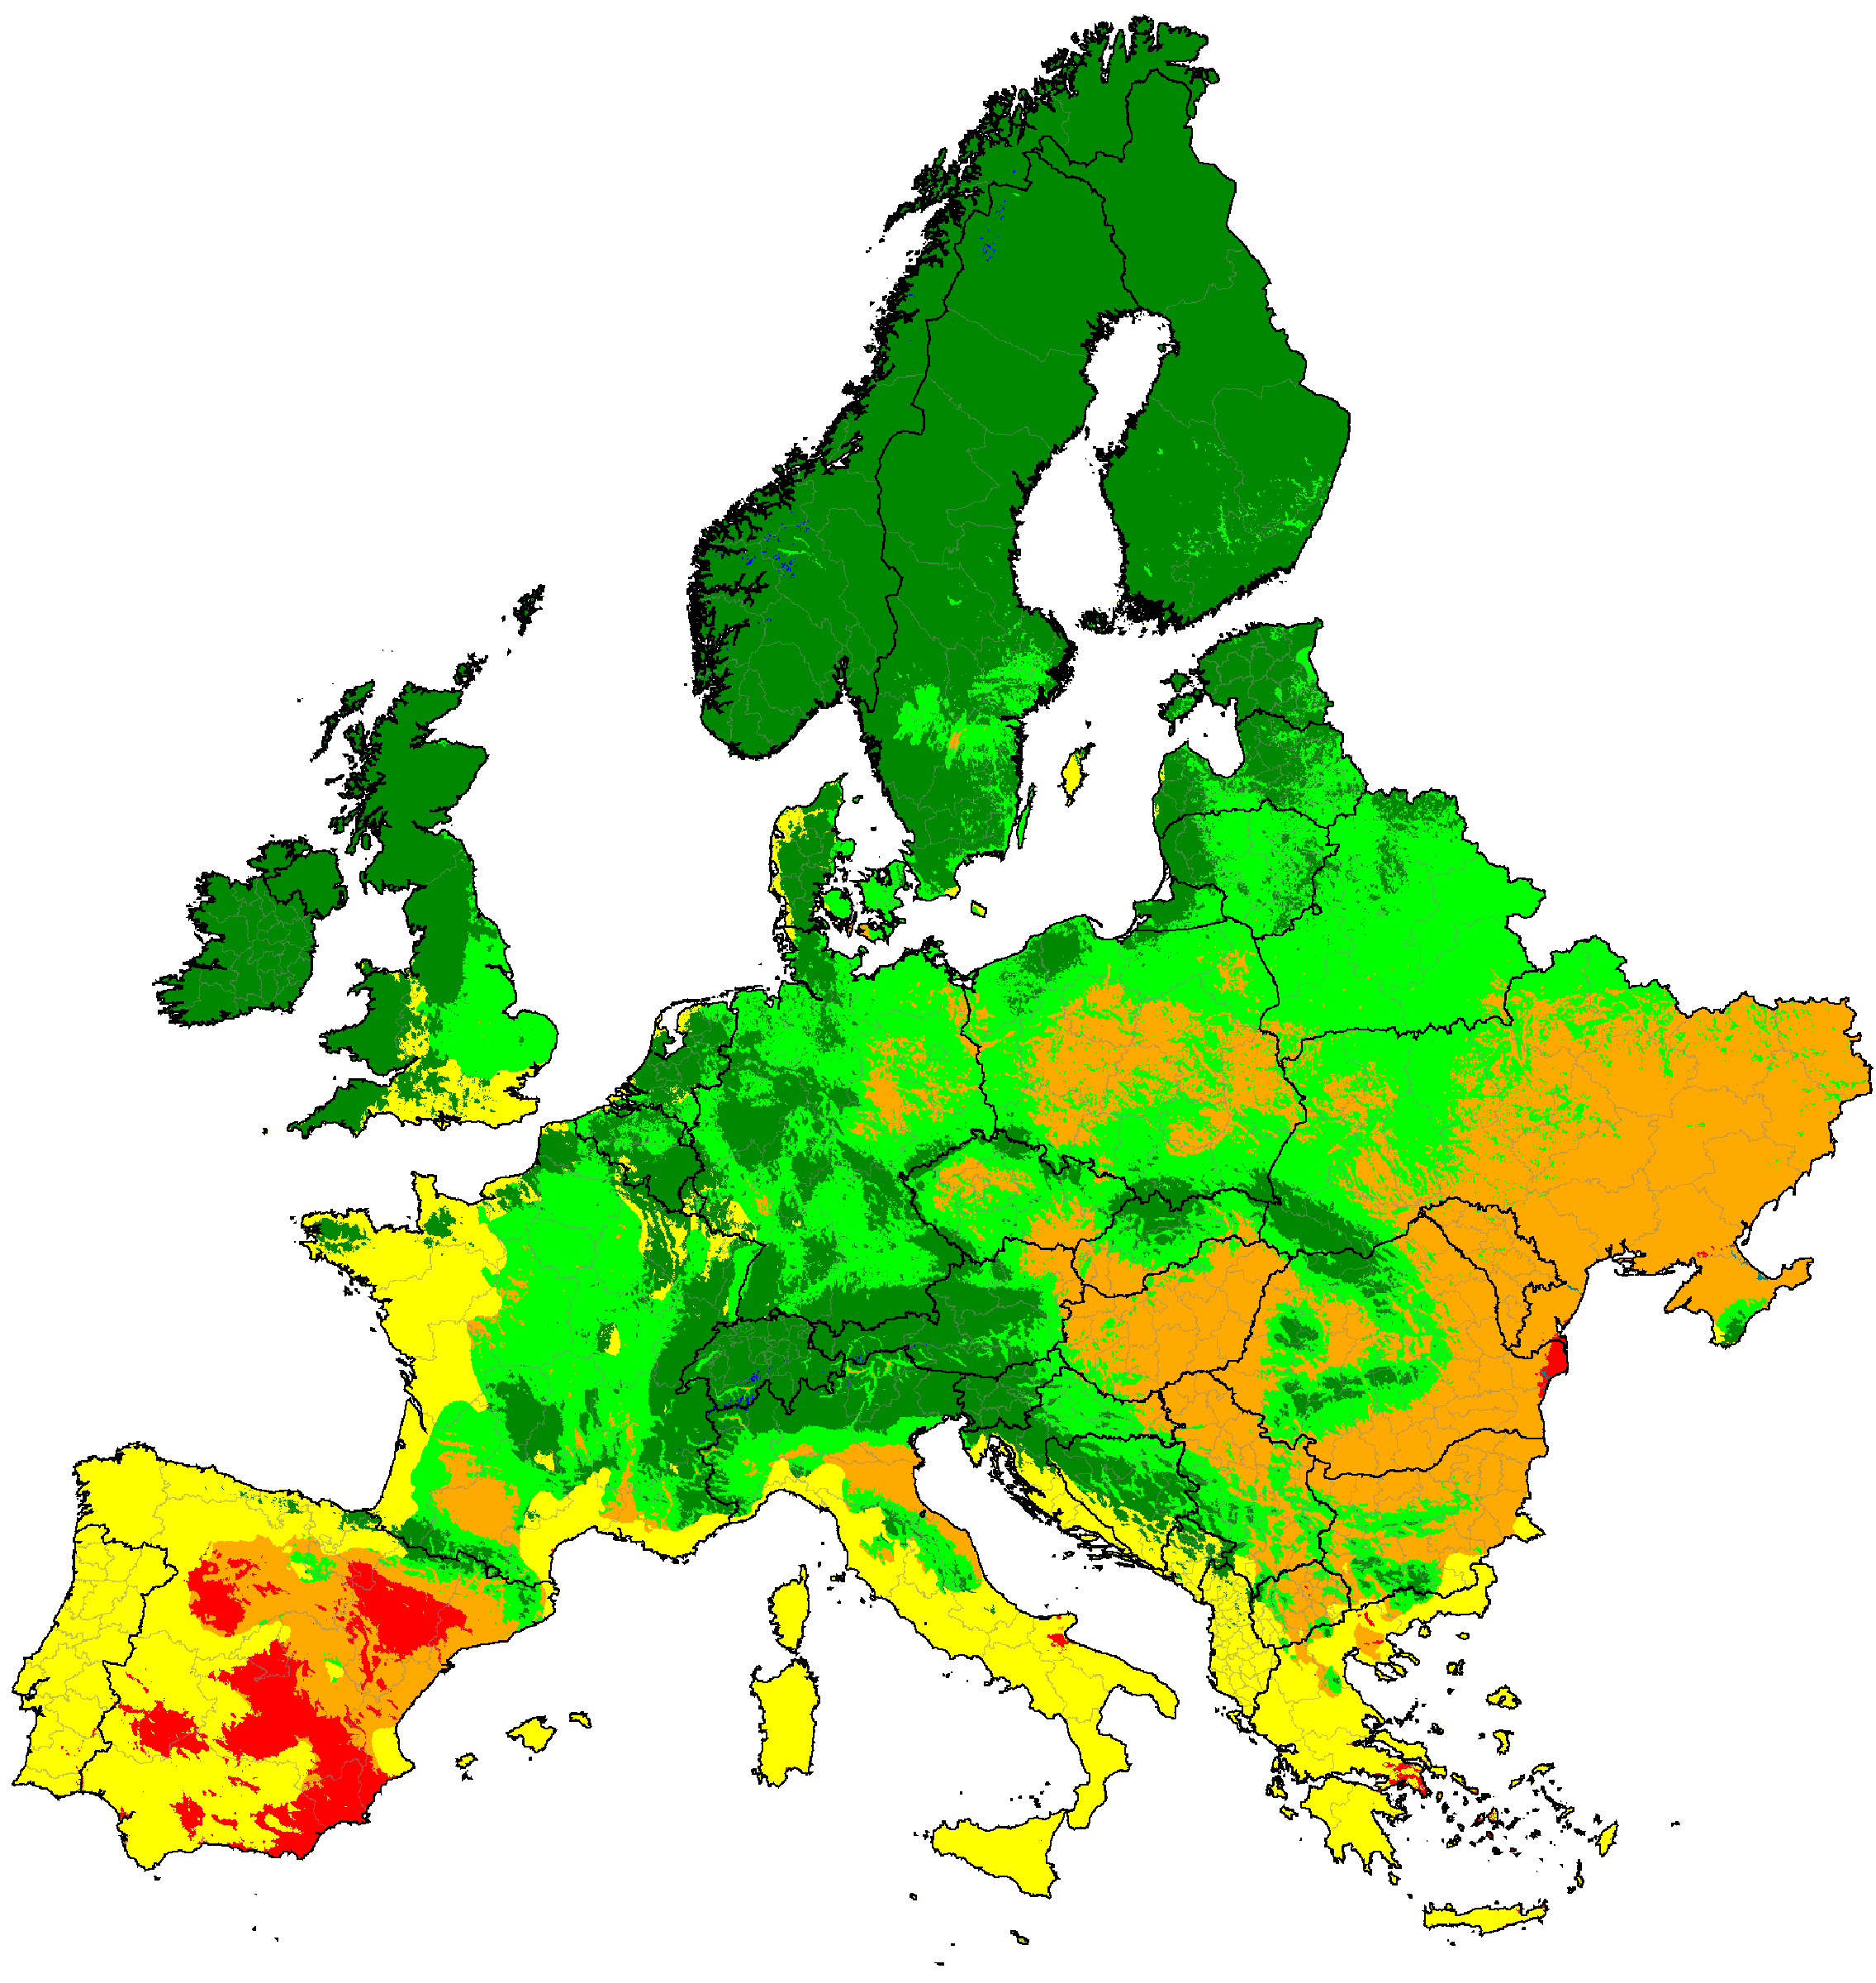
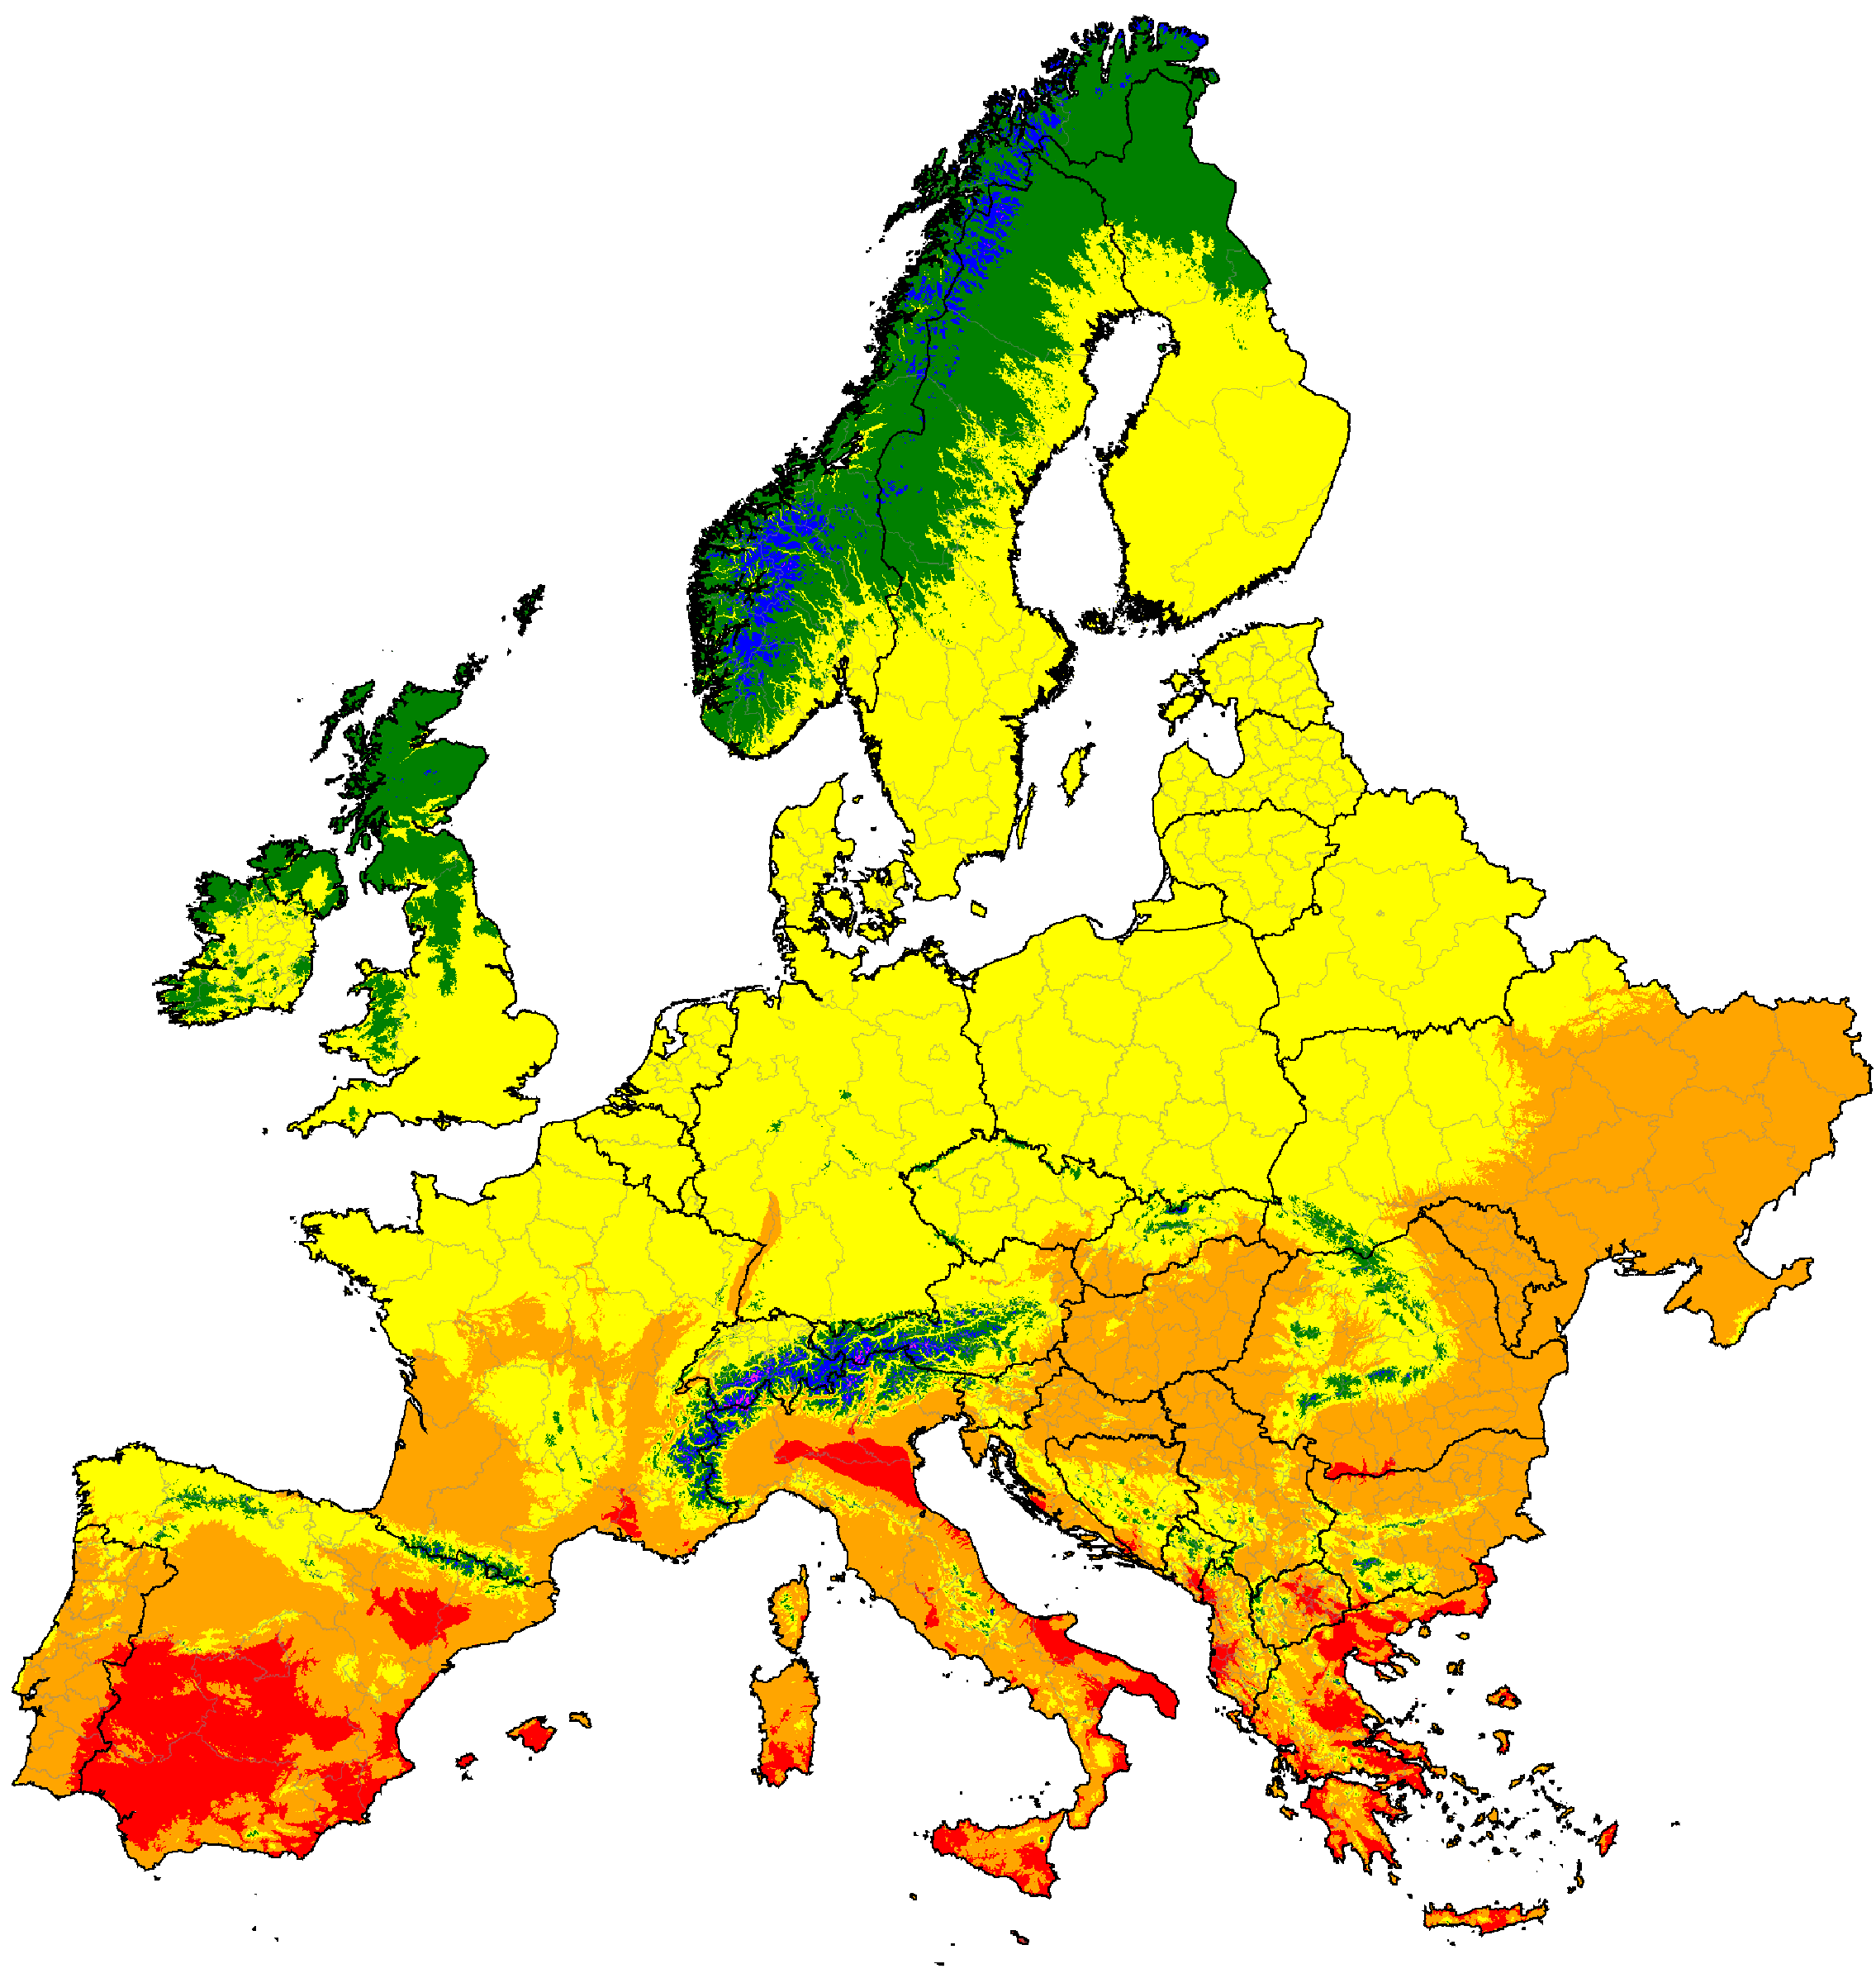
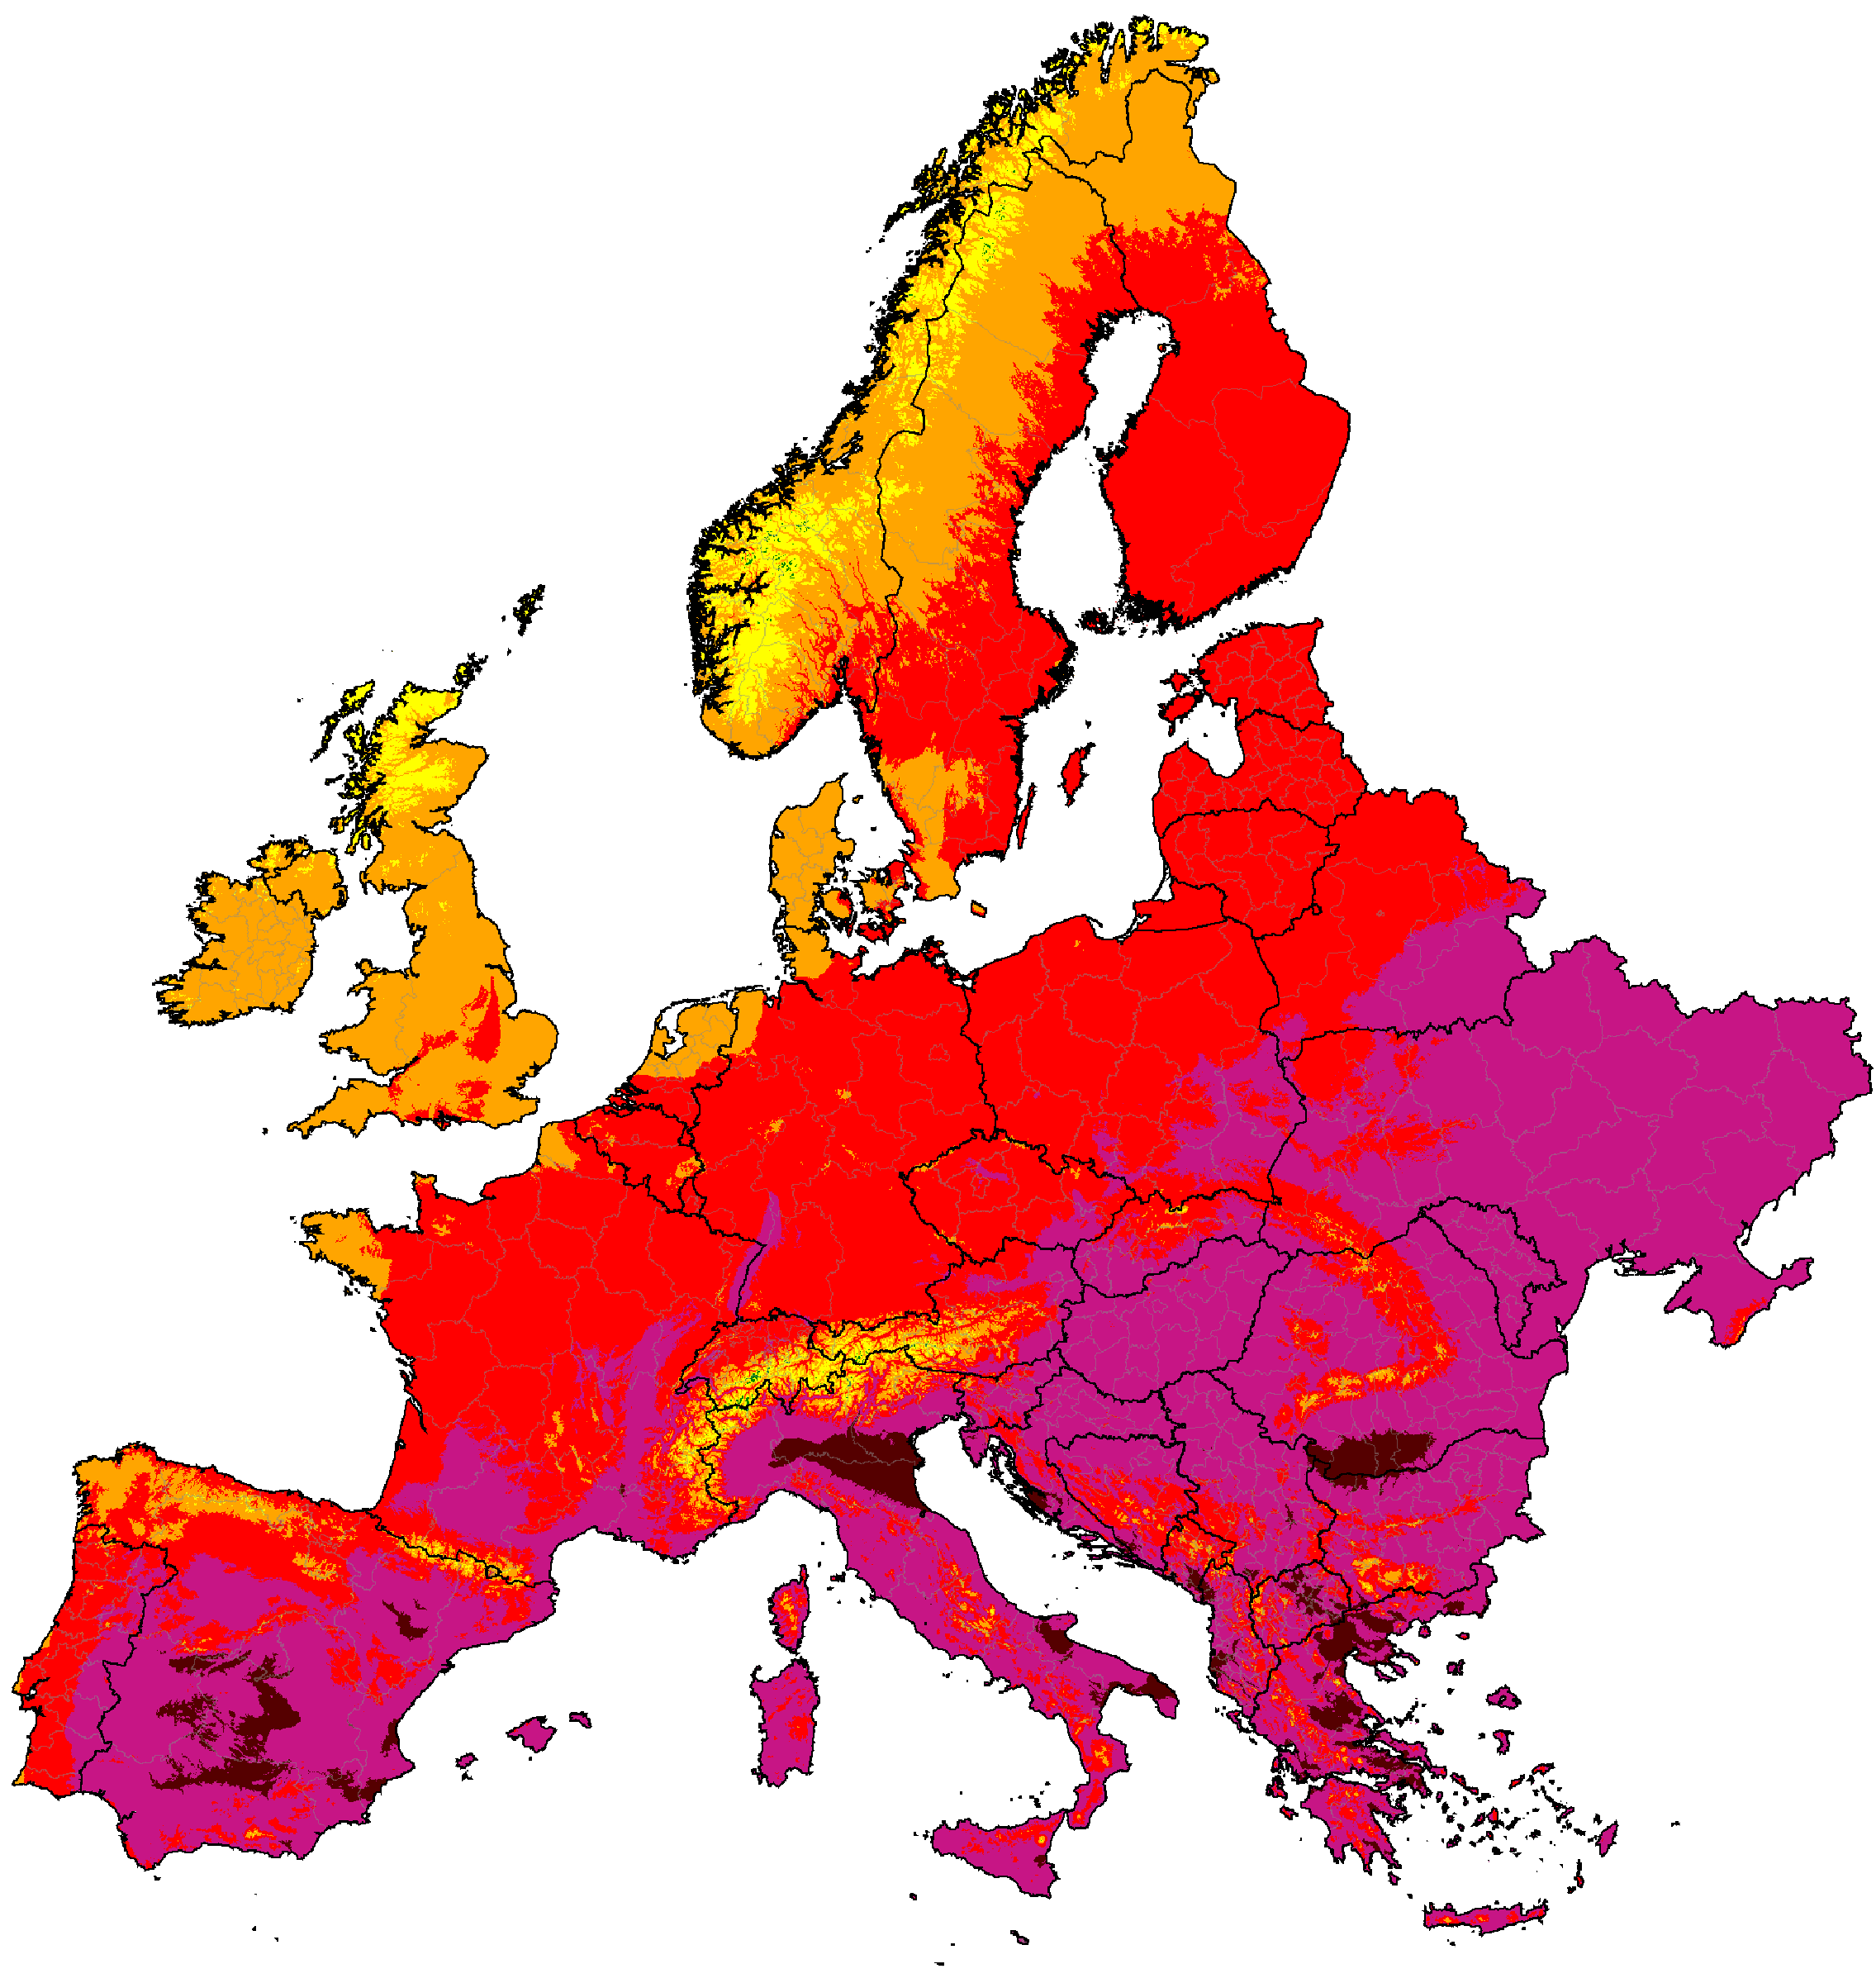
Europe distribution of classifications (projections are SSP5-8.5 high emissions normals)
Note: Due to the complexity of the system, only the most common climates in each map are labeled.
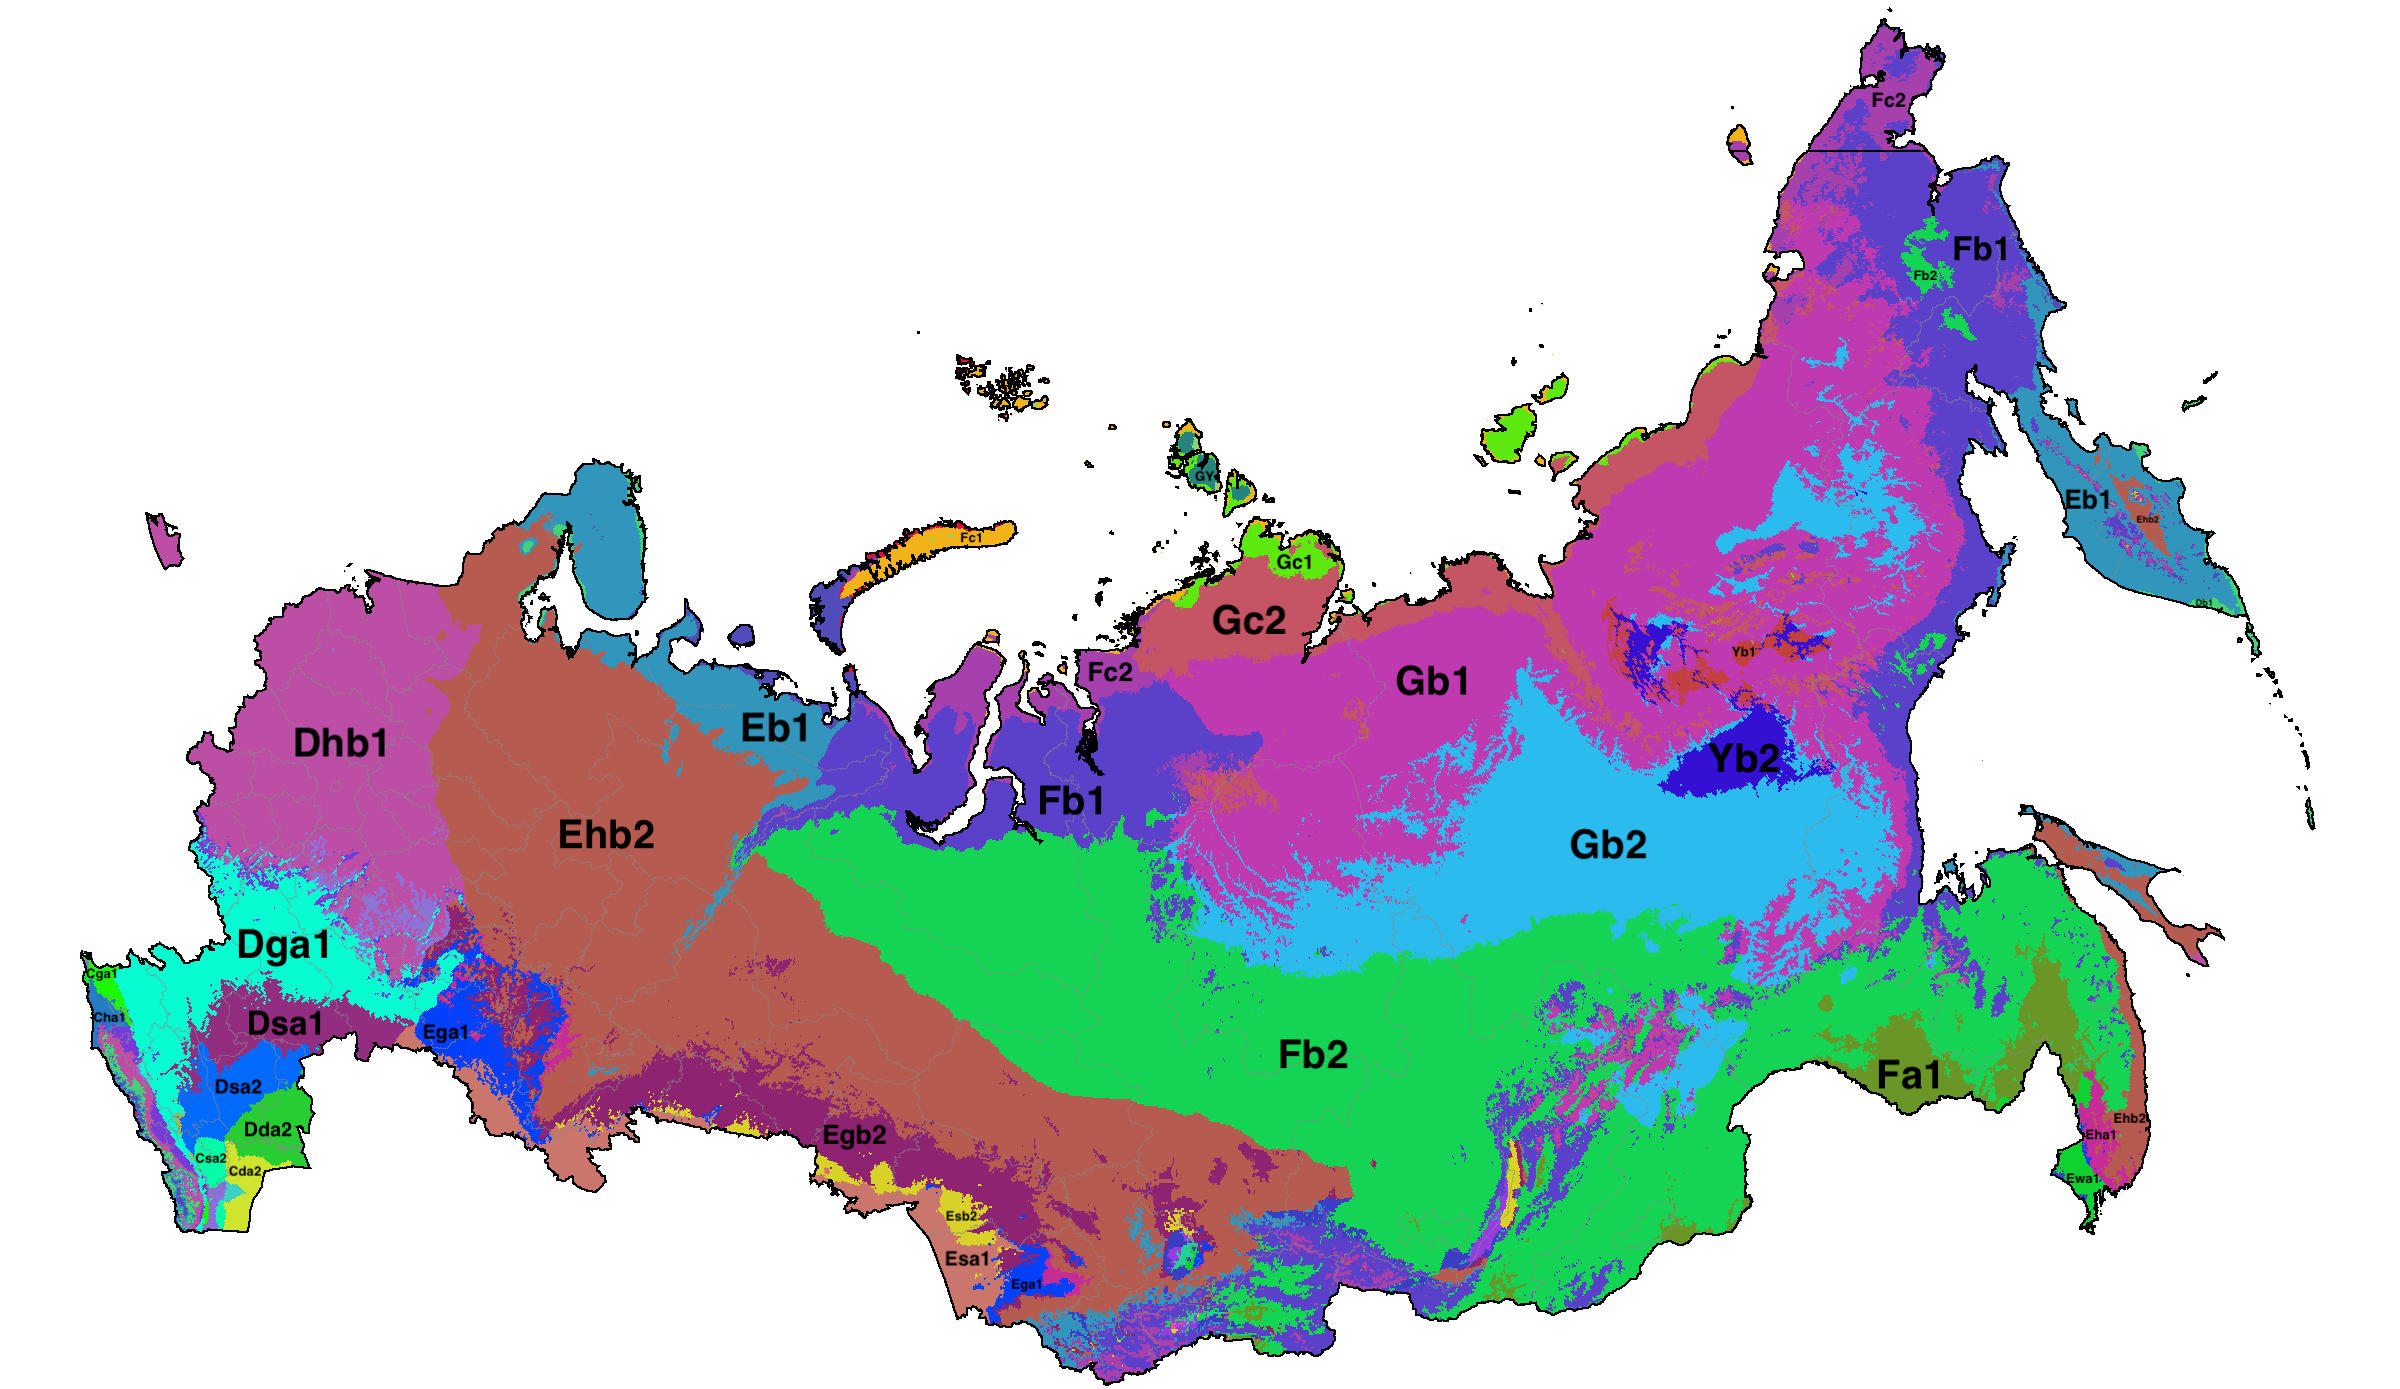
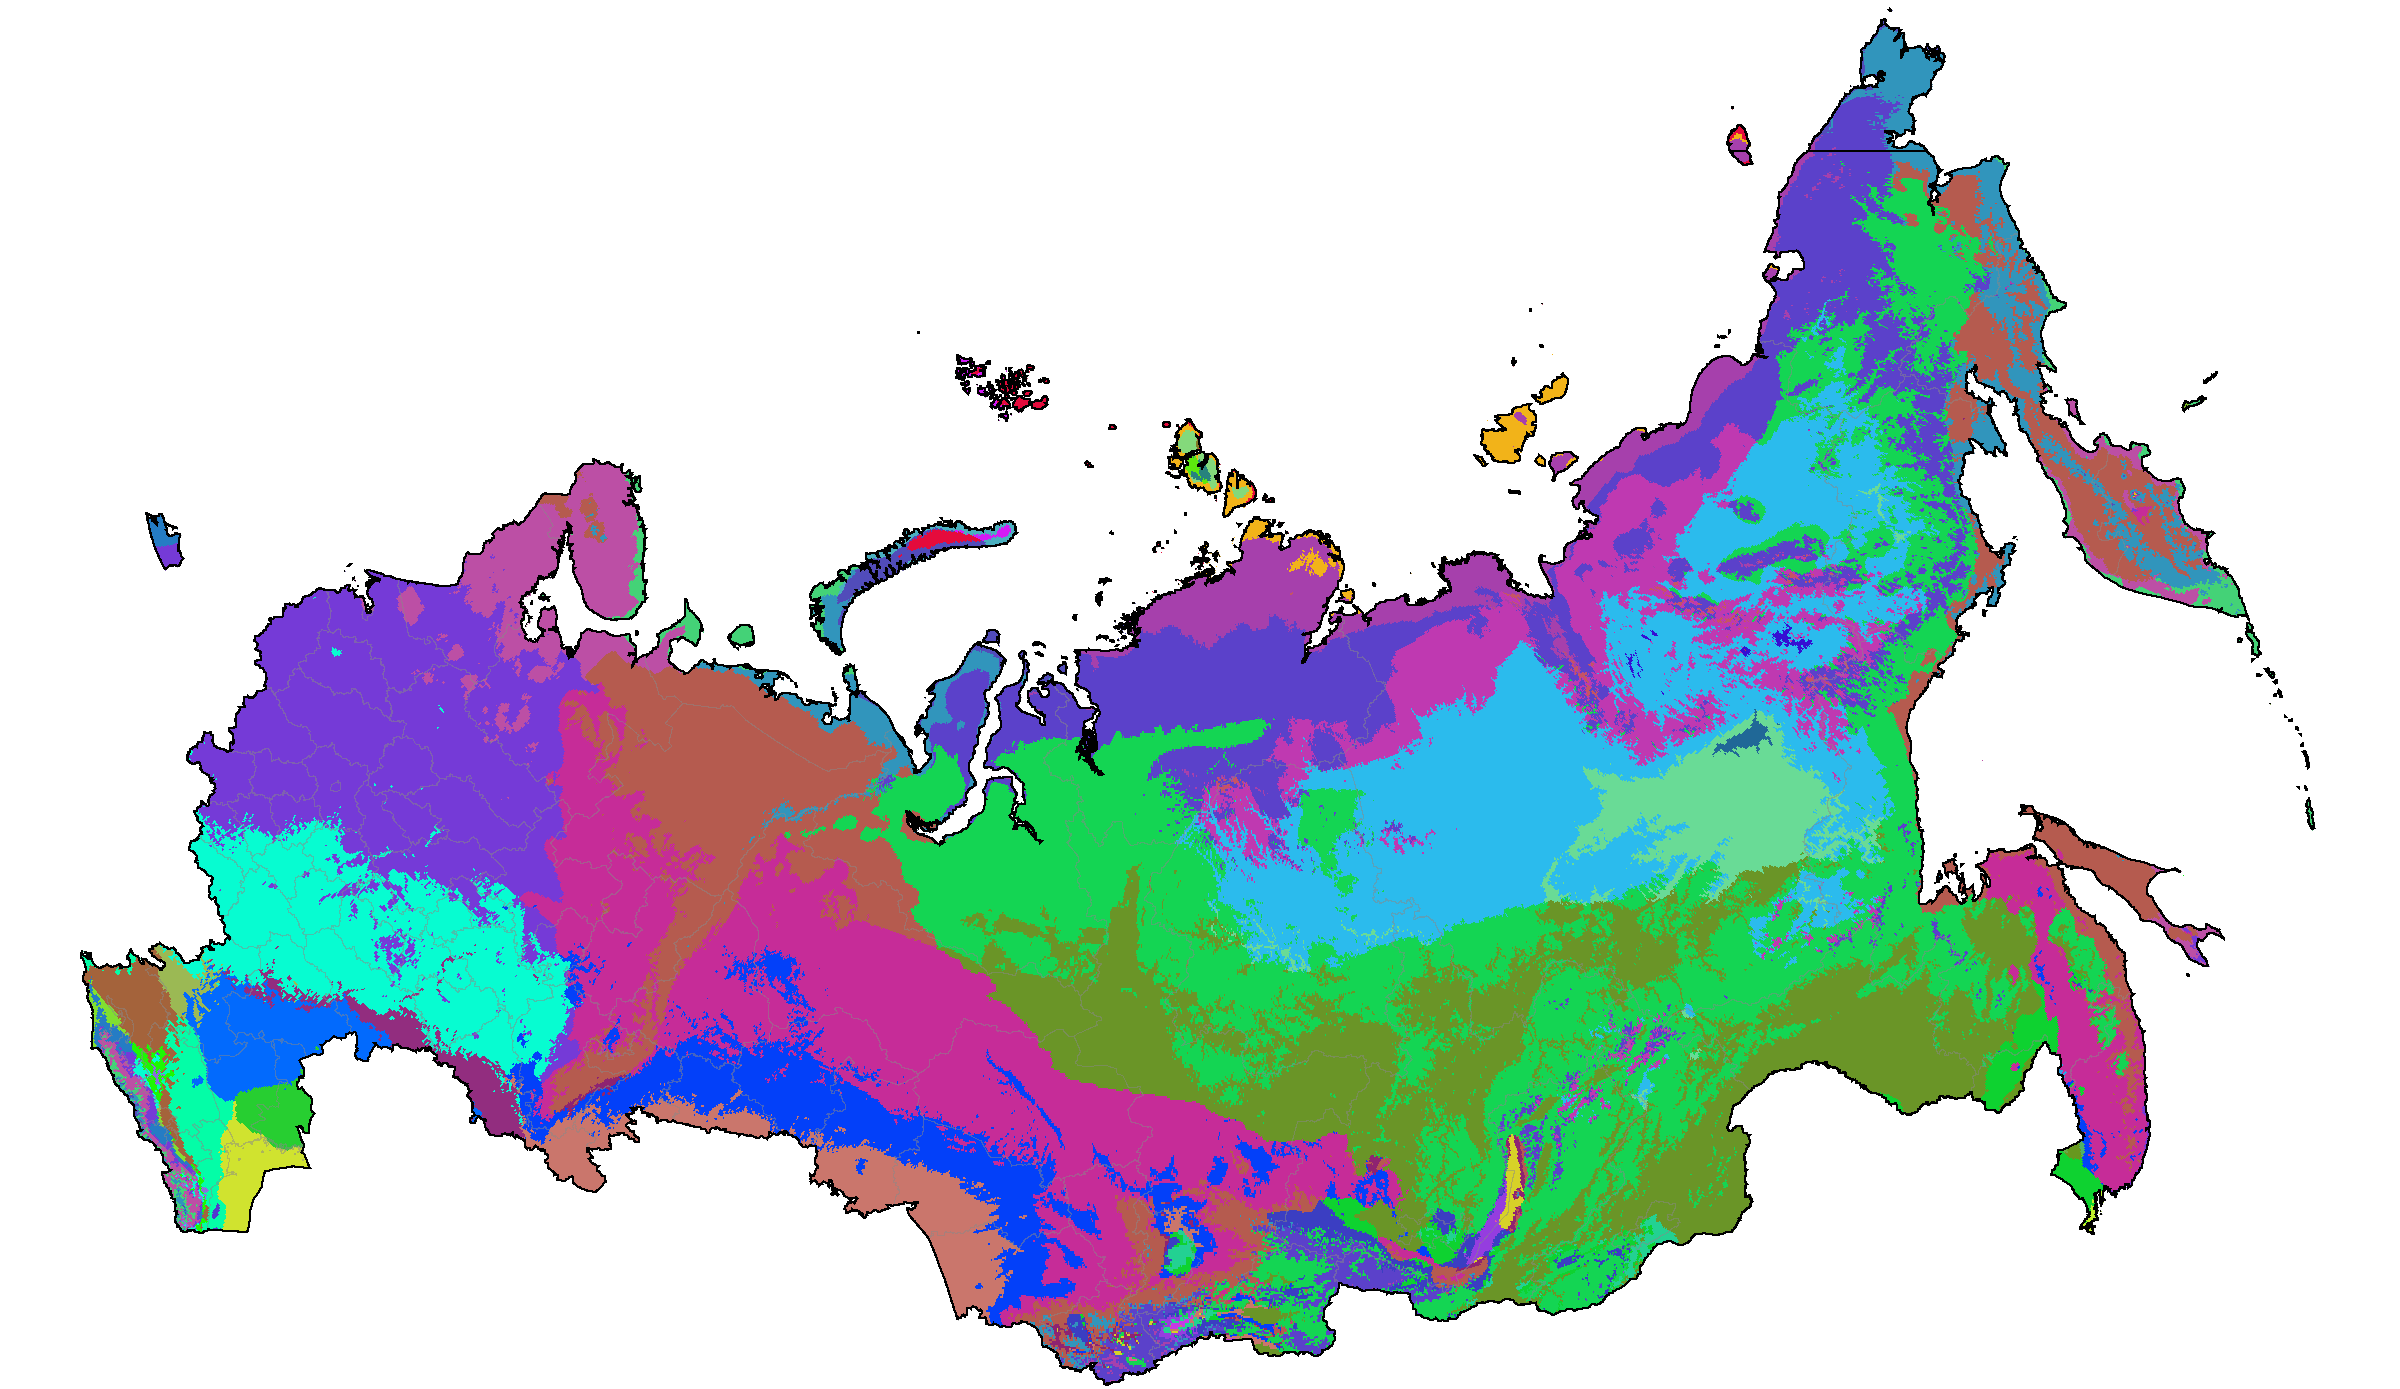
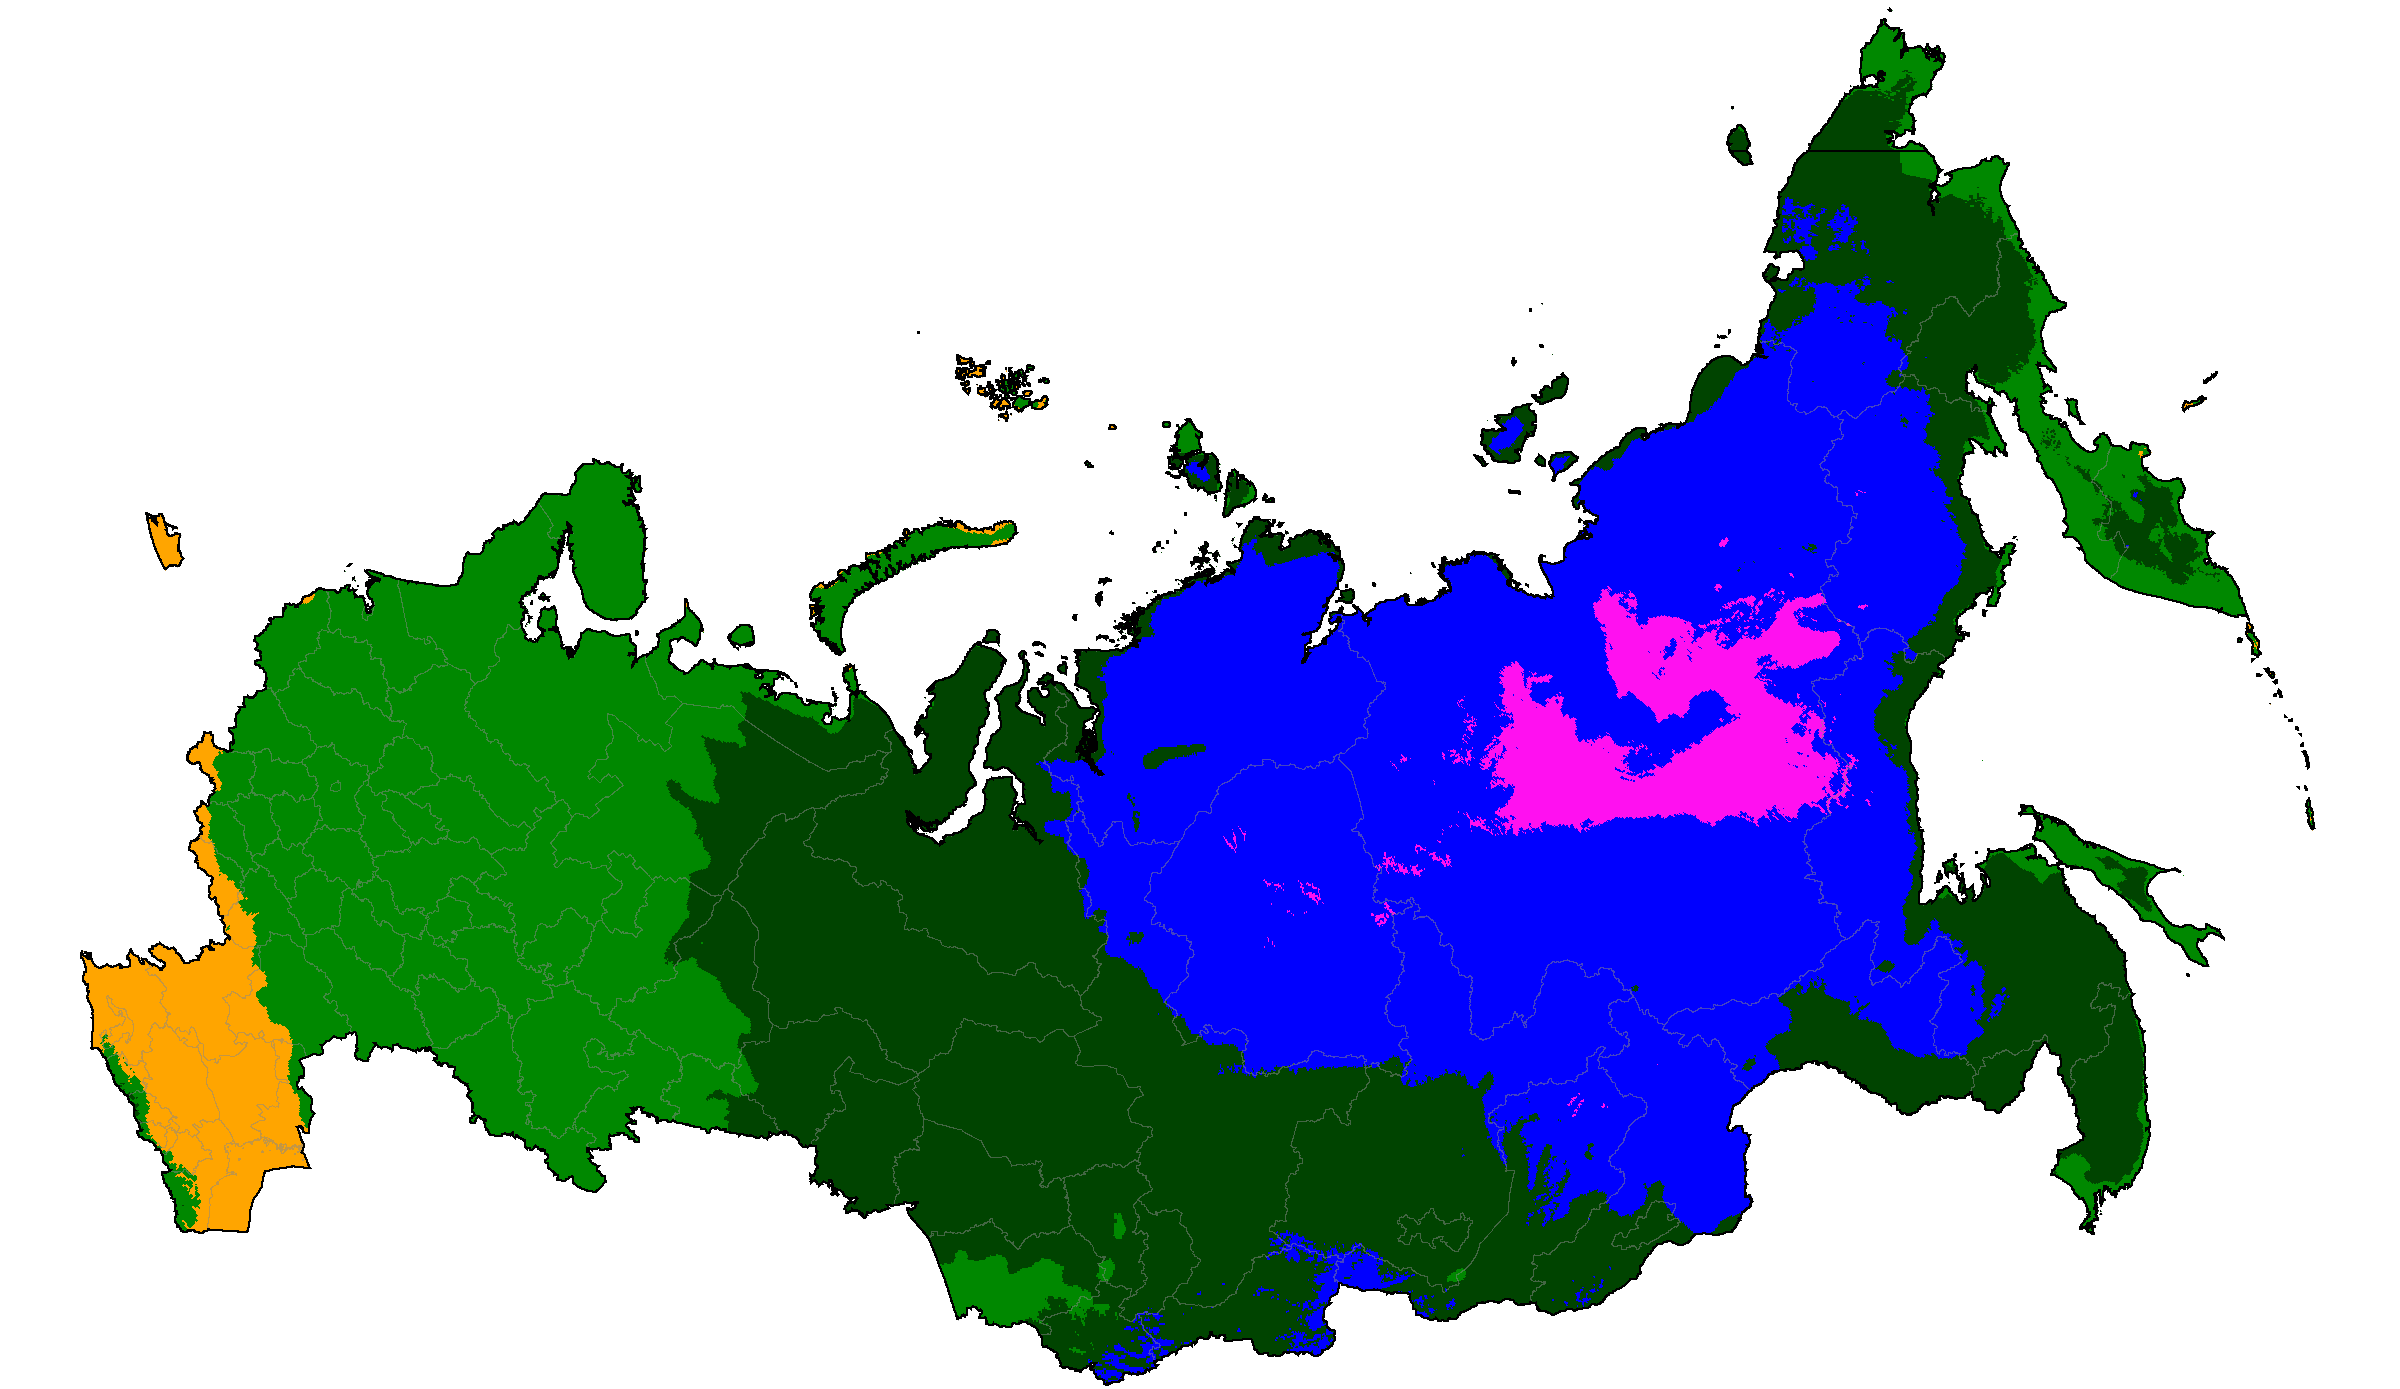
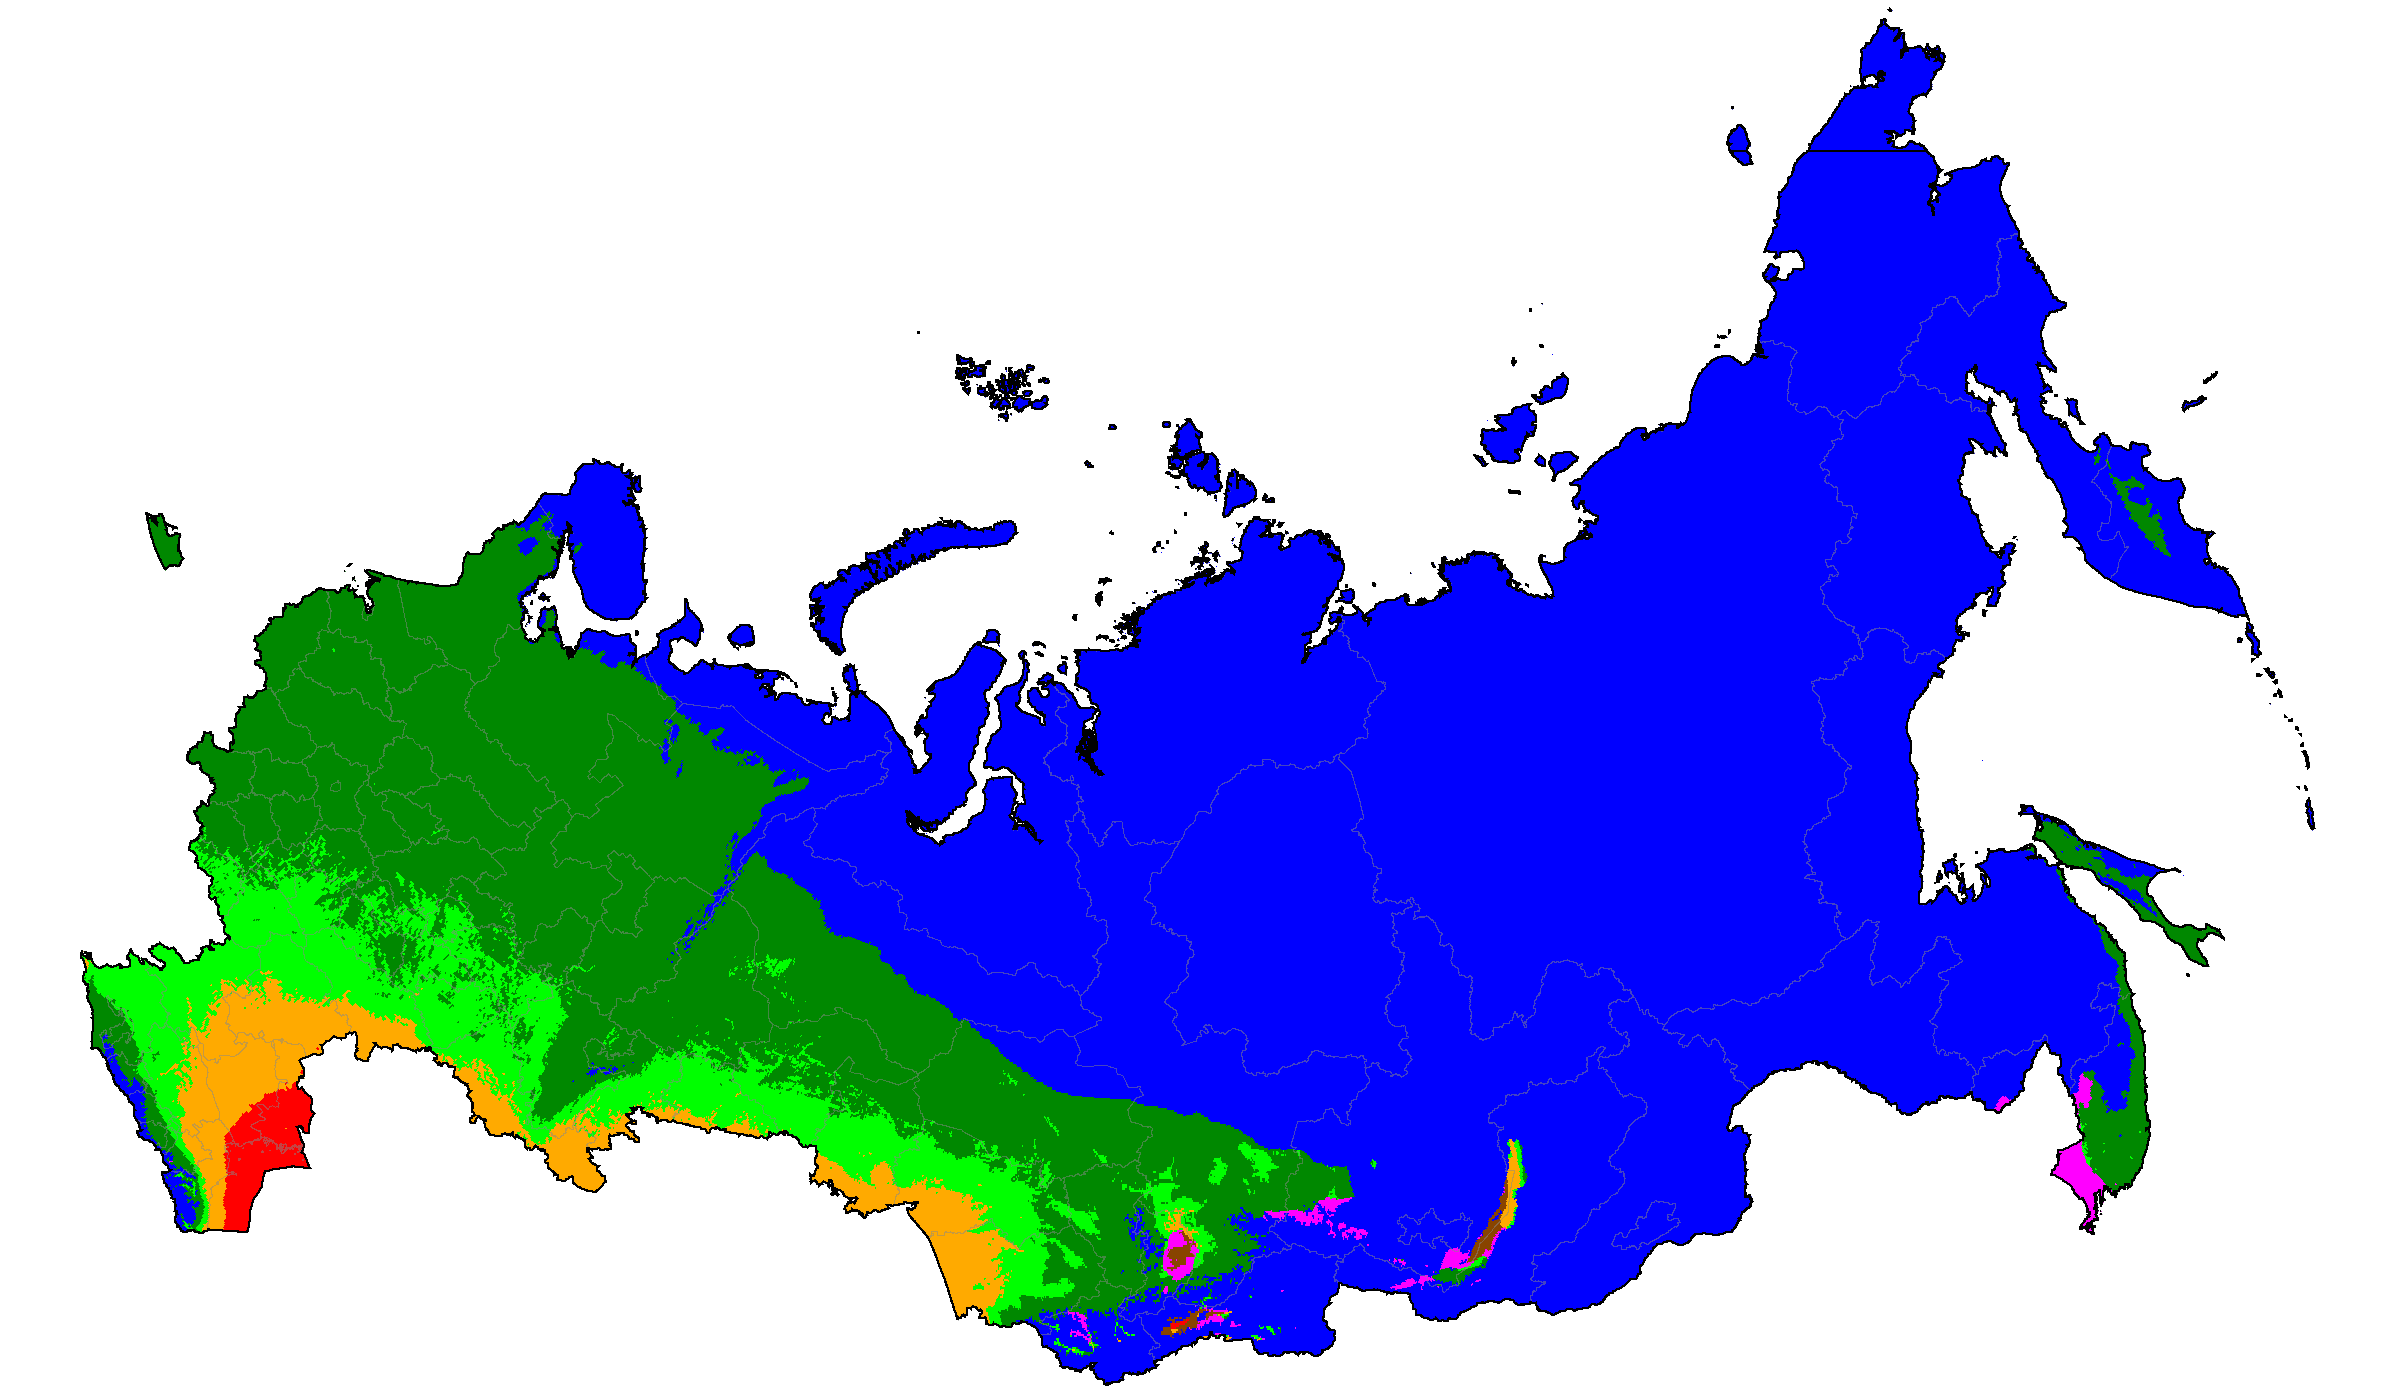
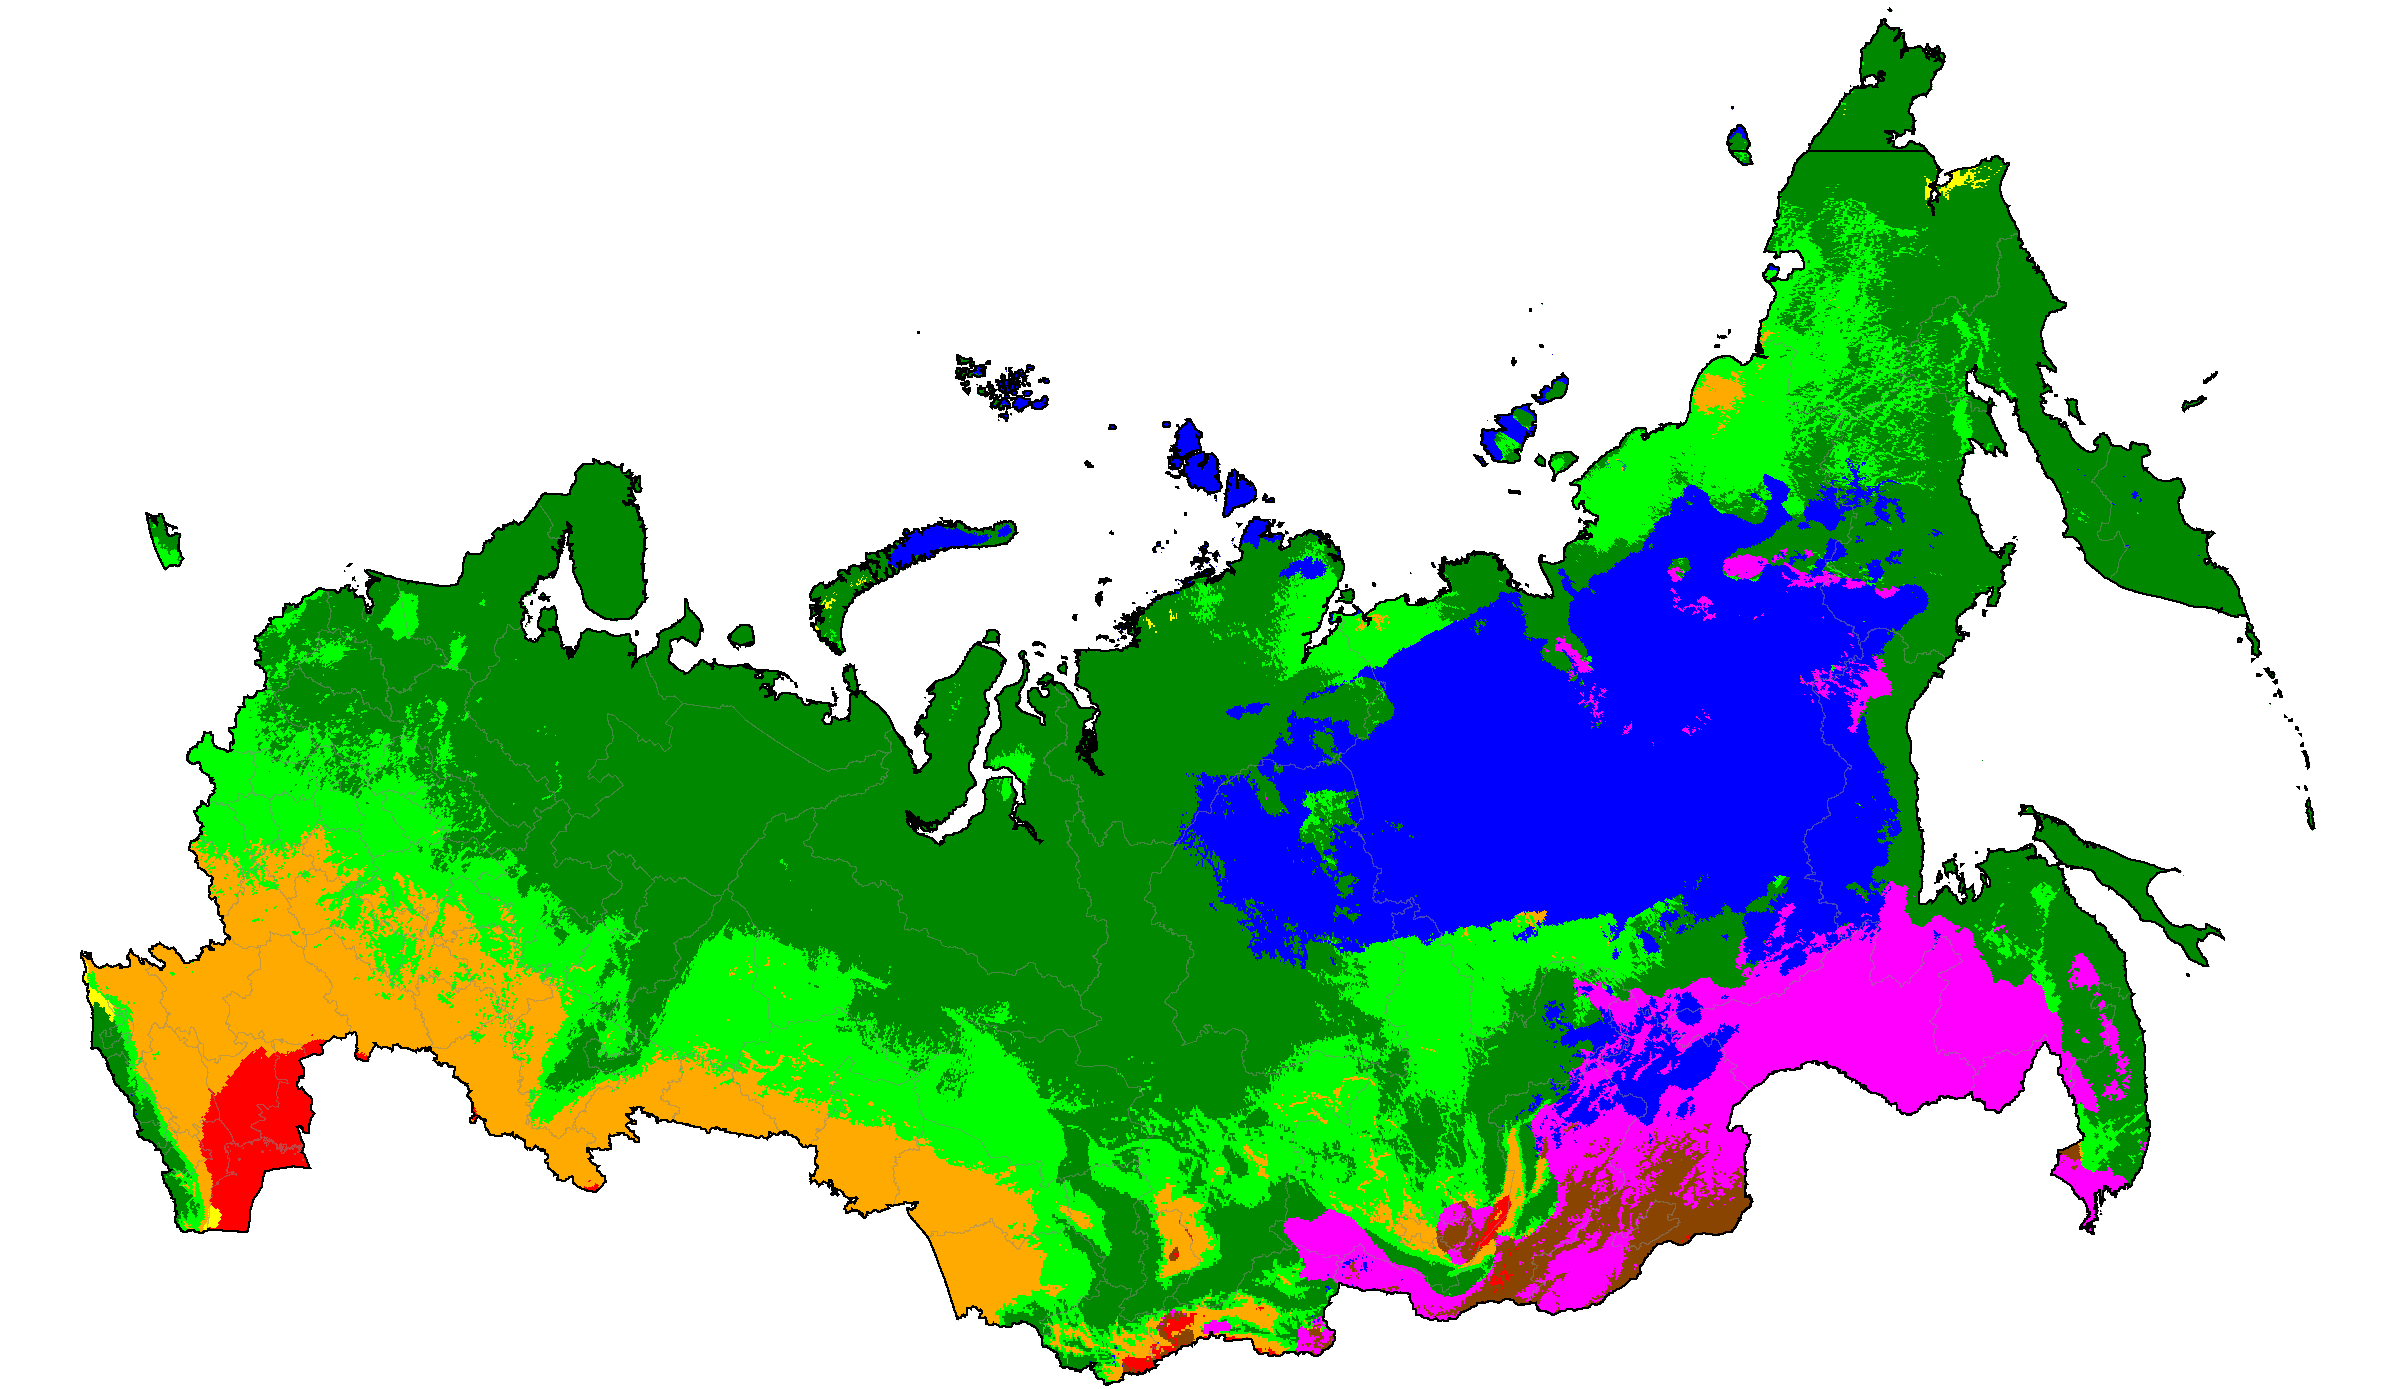
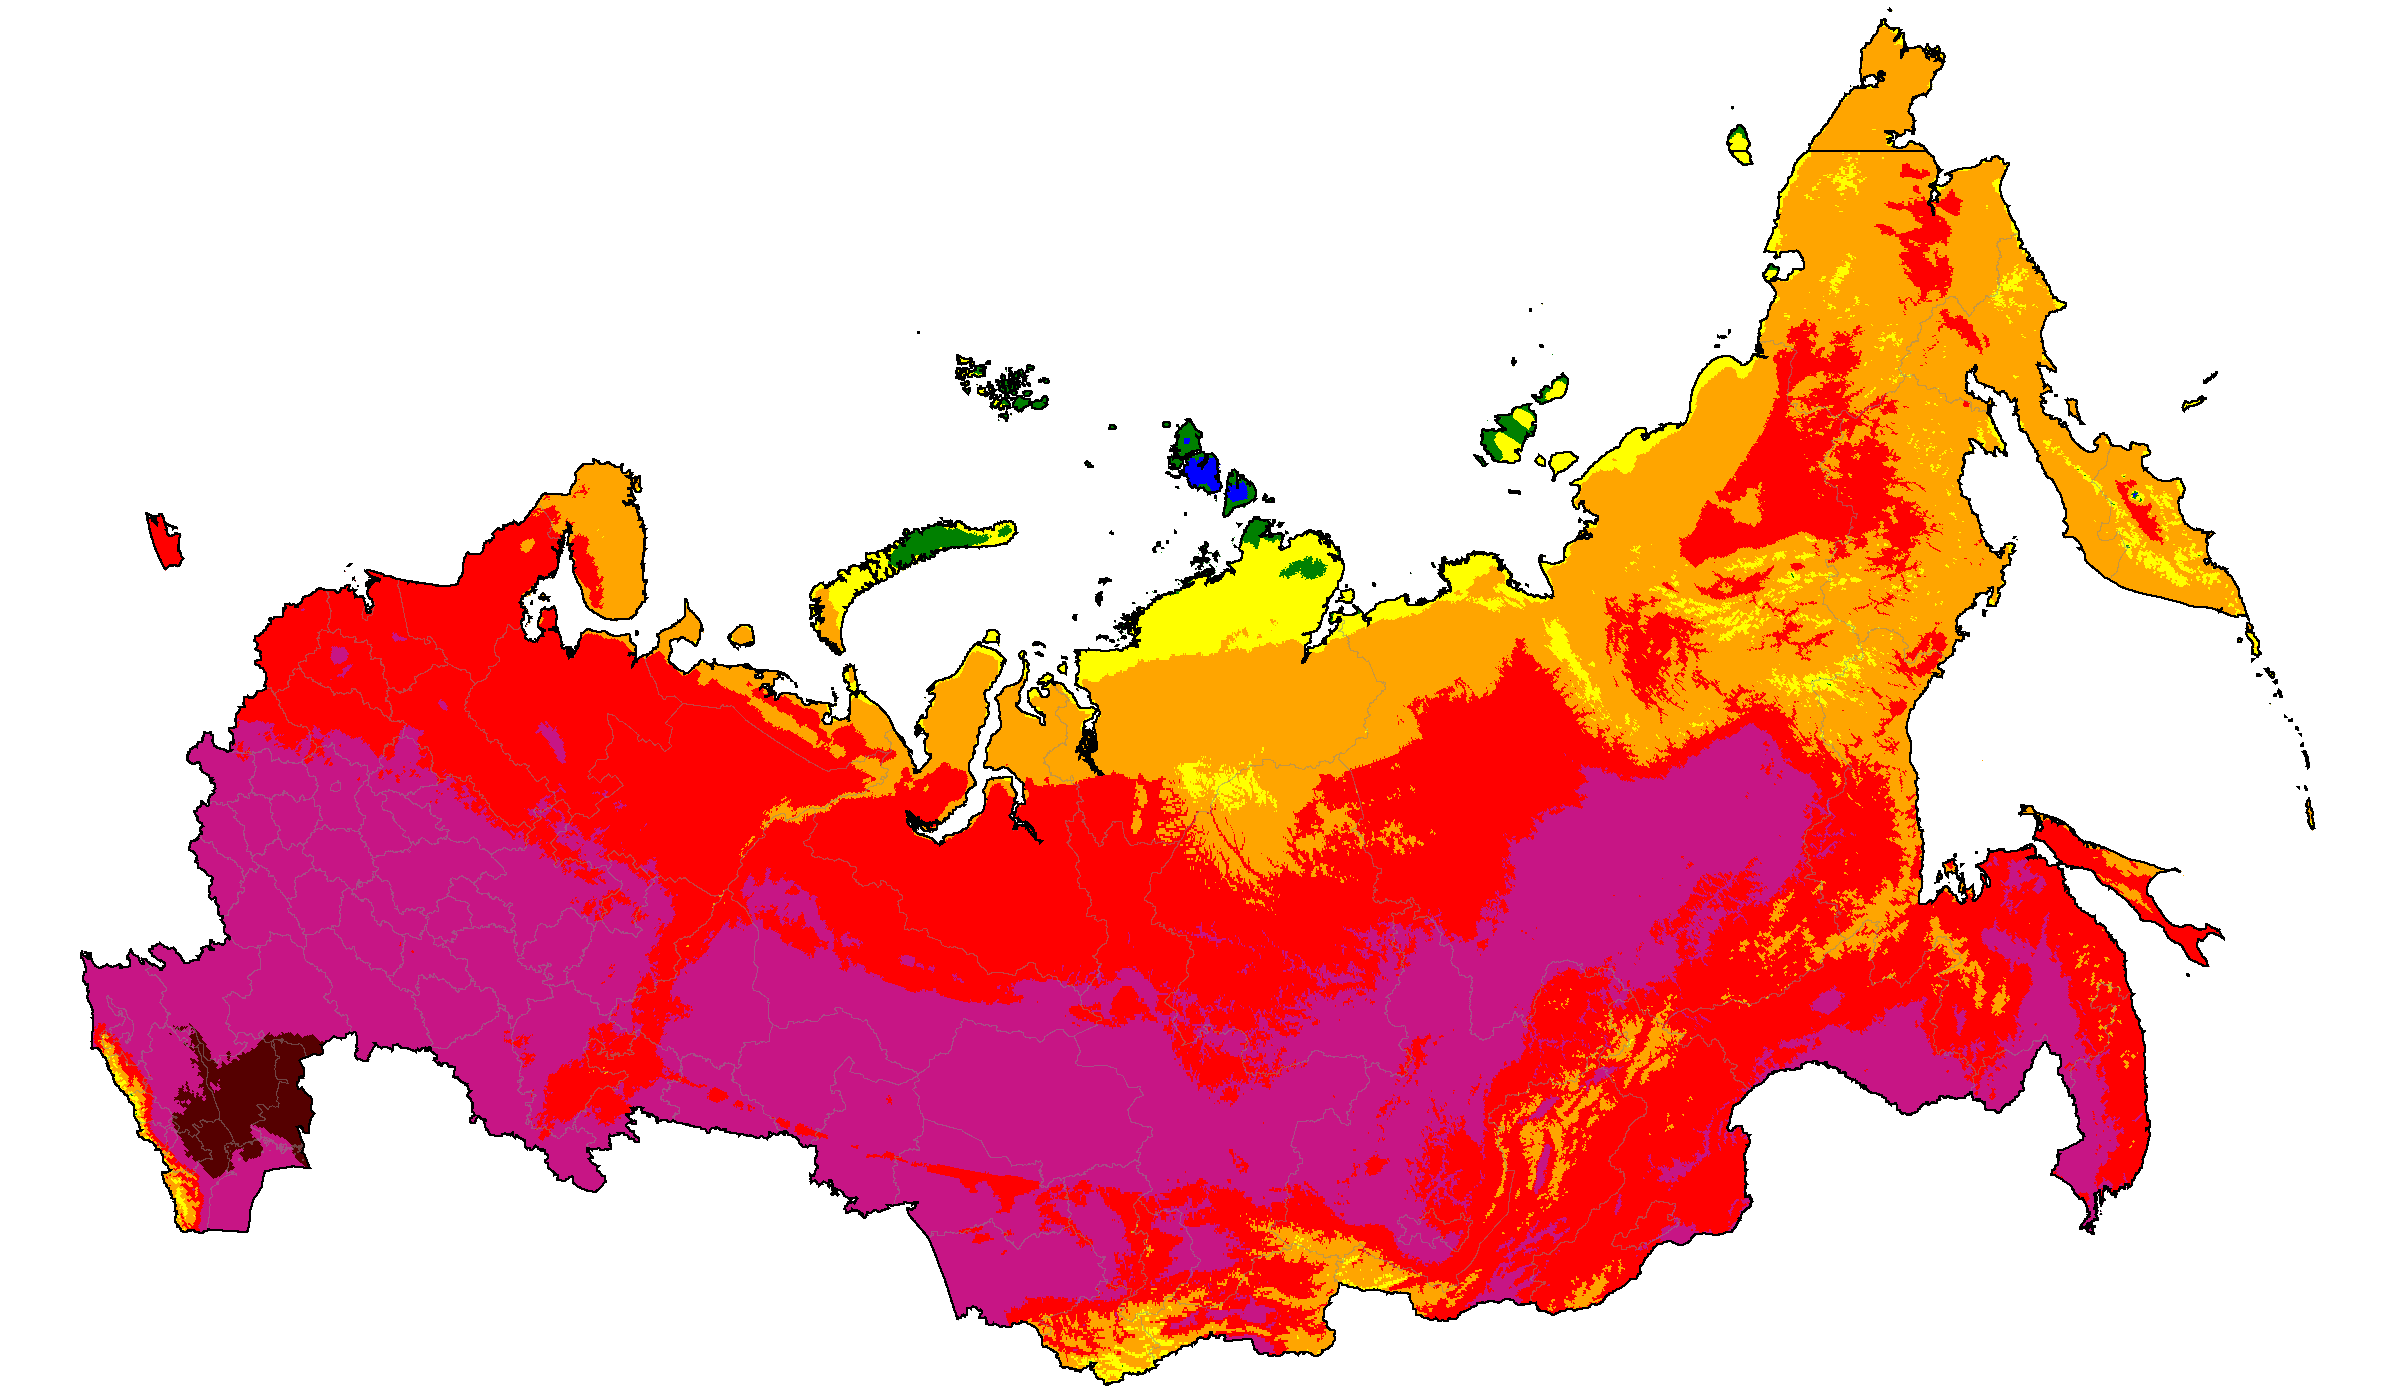
Russia distribution of winter categories (projections are SSP5-8.5 high emissions normals)
Note: Due to the complexity of the system, only the most common climates in each map are labeled. The line visible in eastern Russia is a cartographic artifact of the International Date Line (180° meridian), not a political boundary.
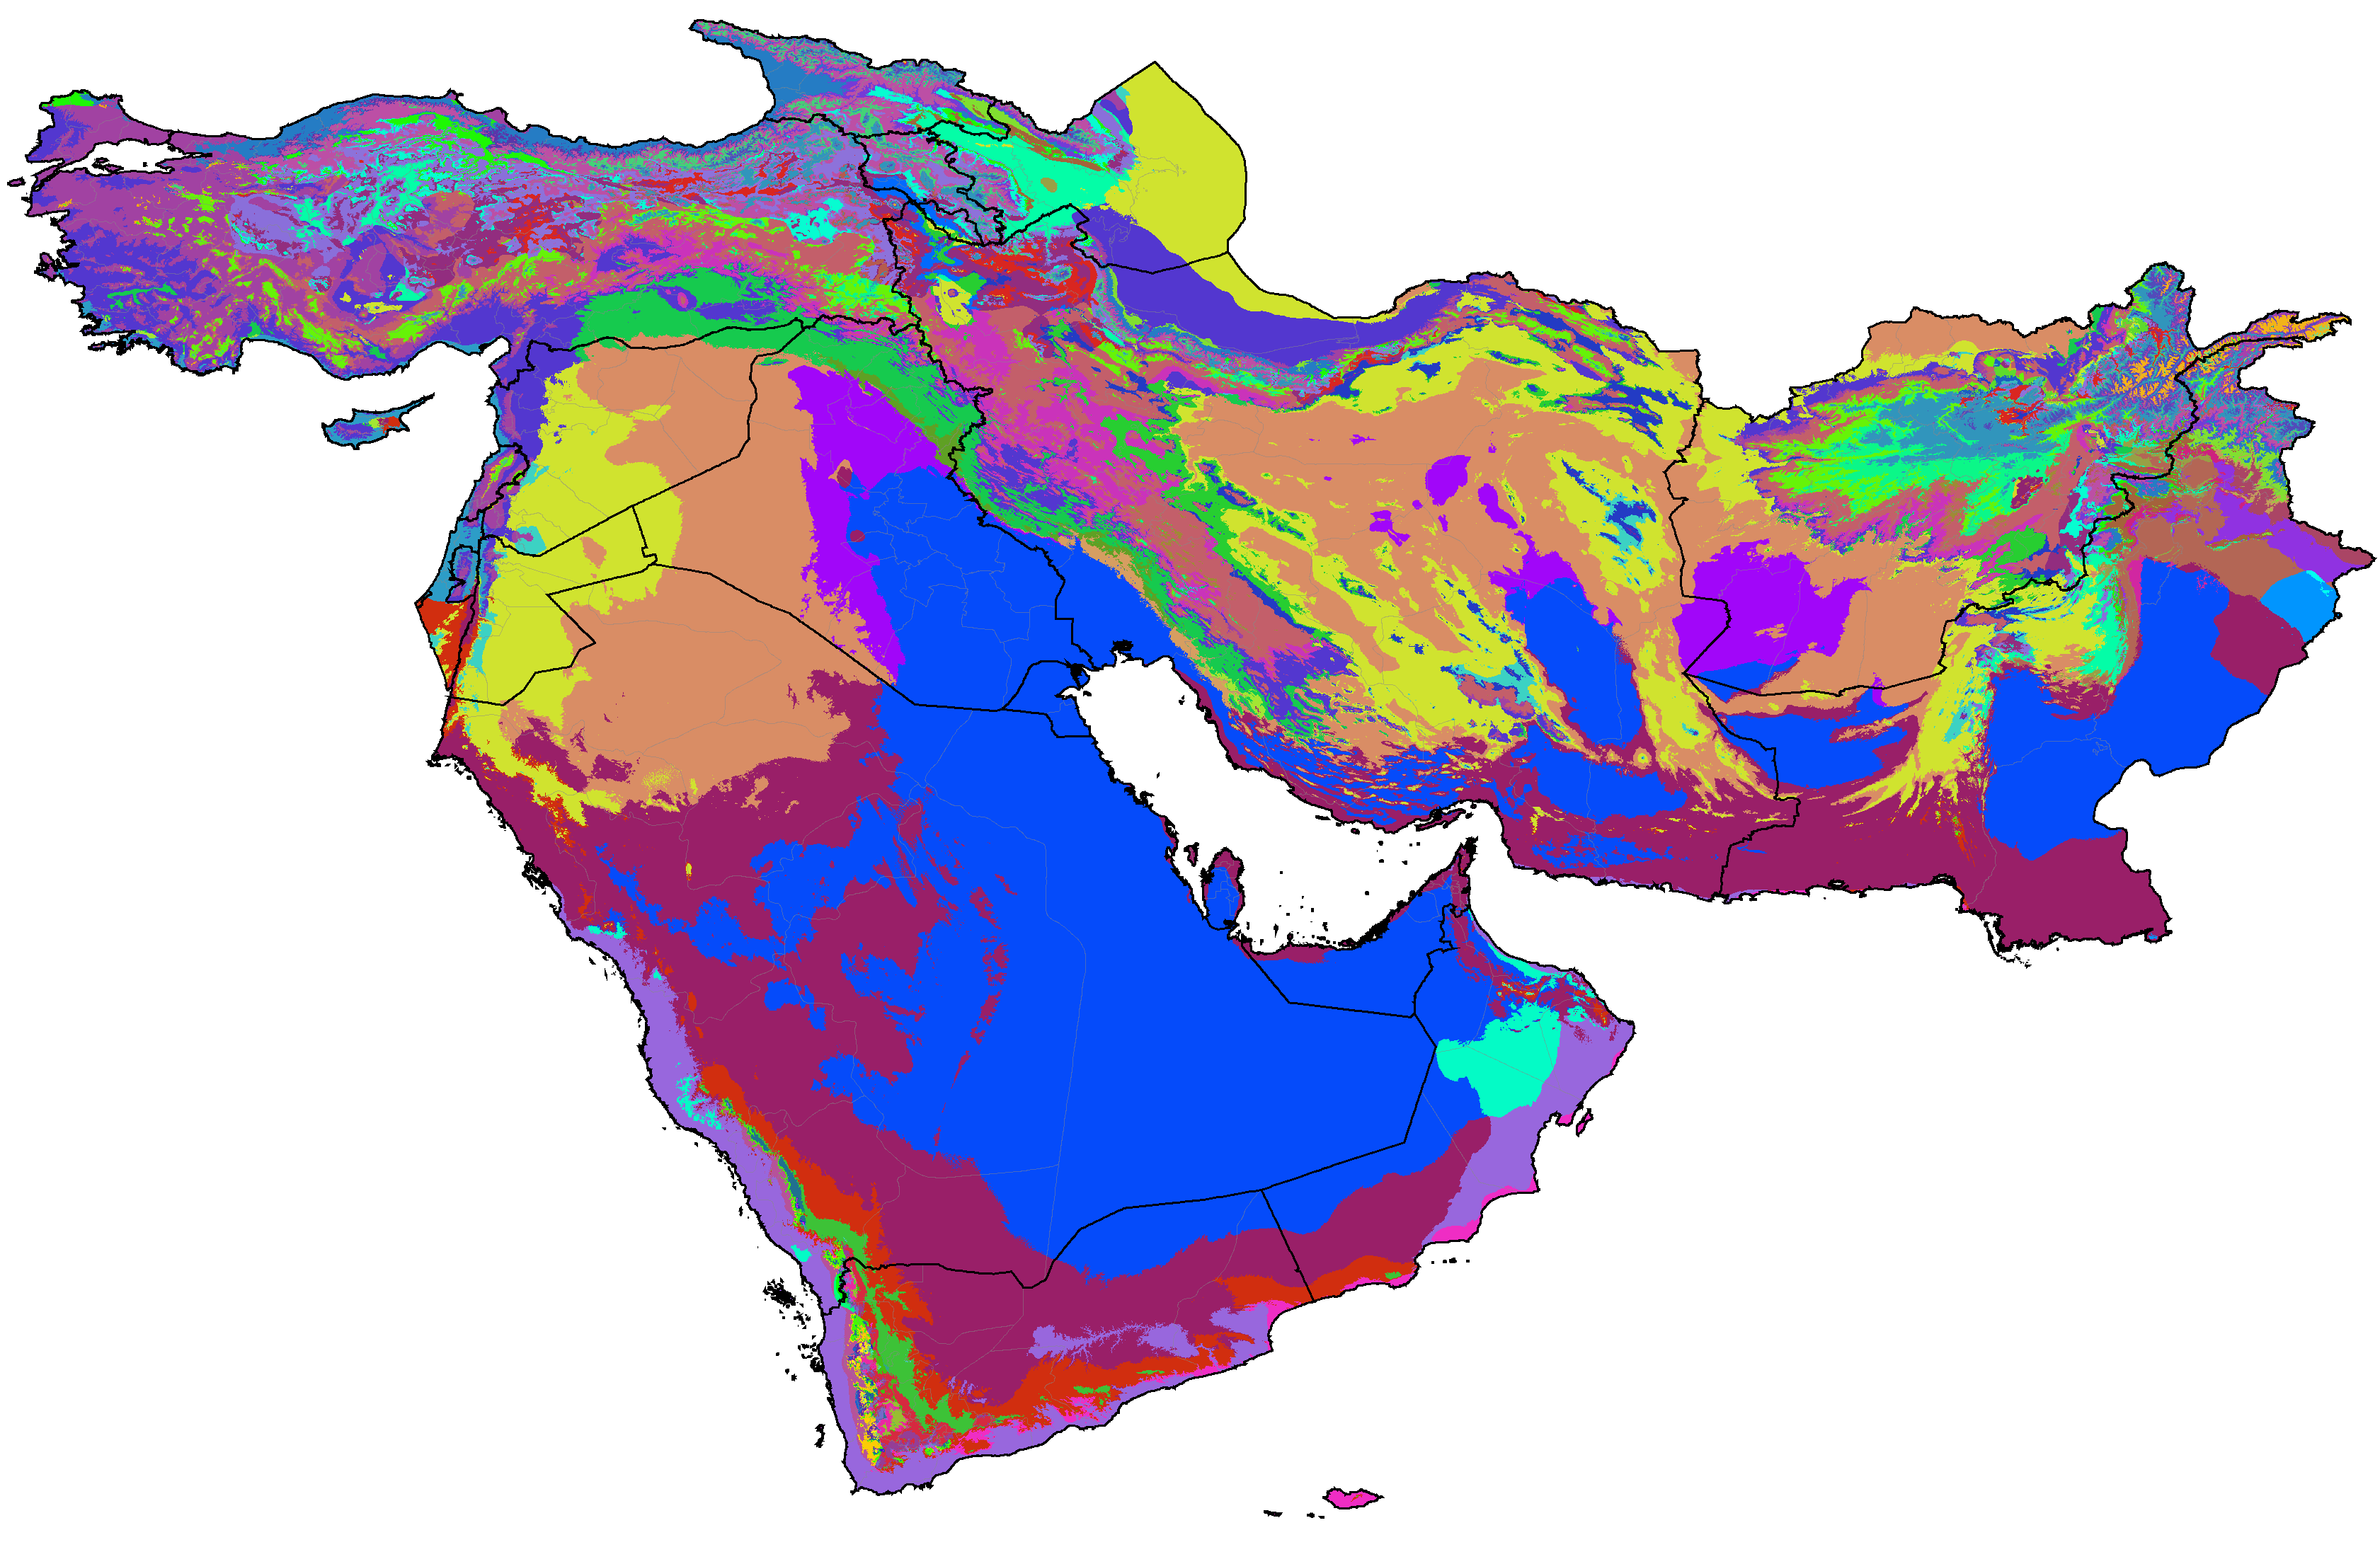
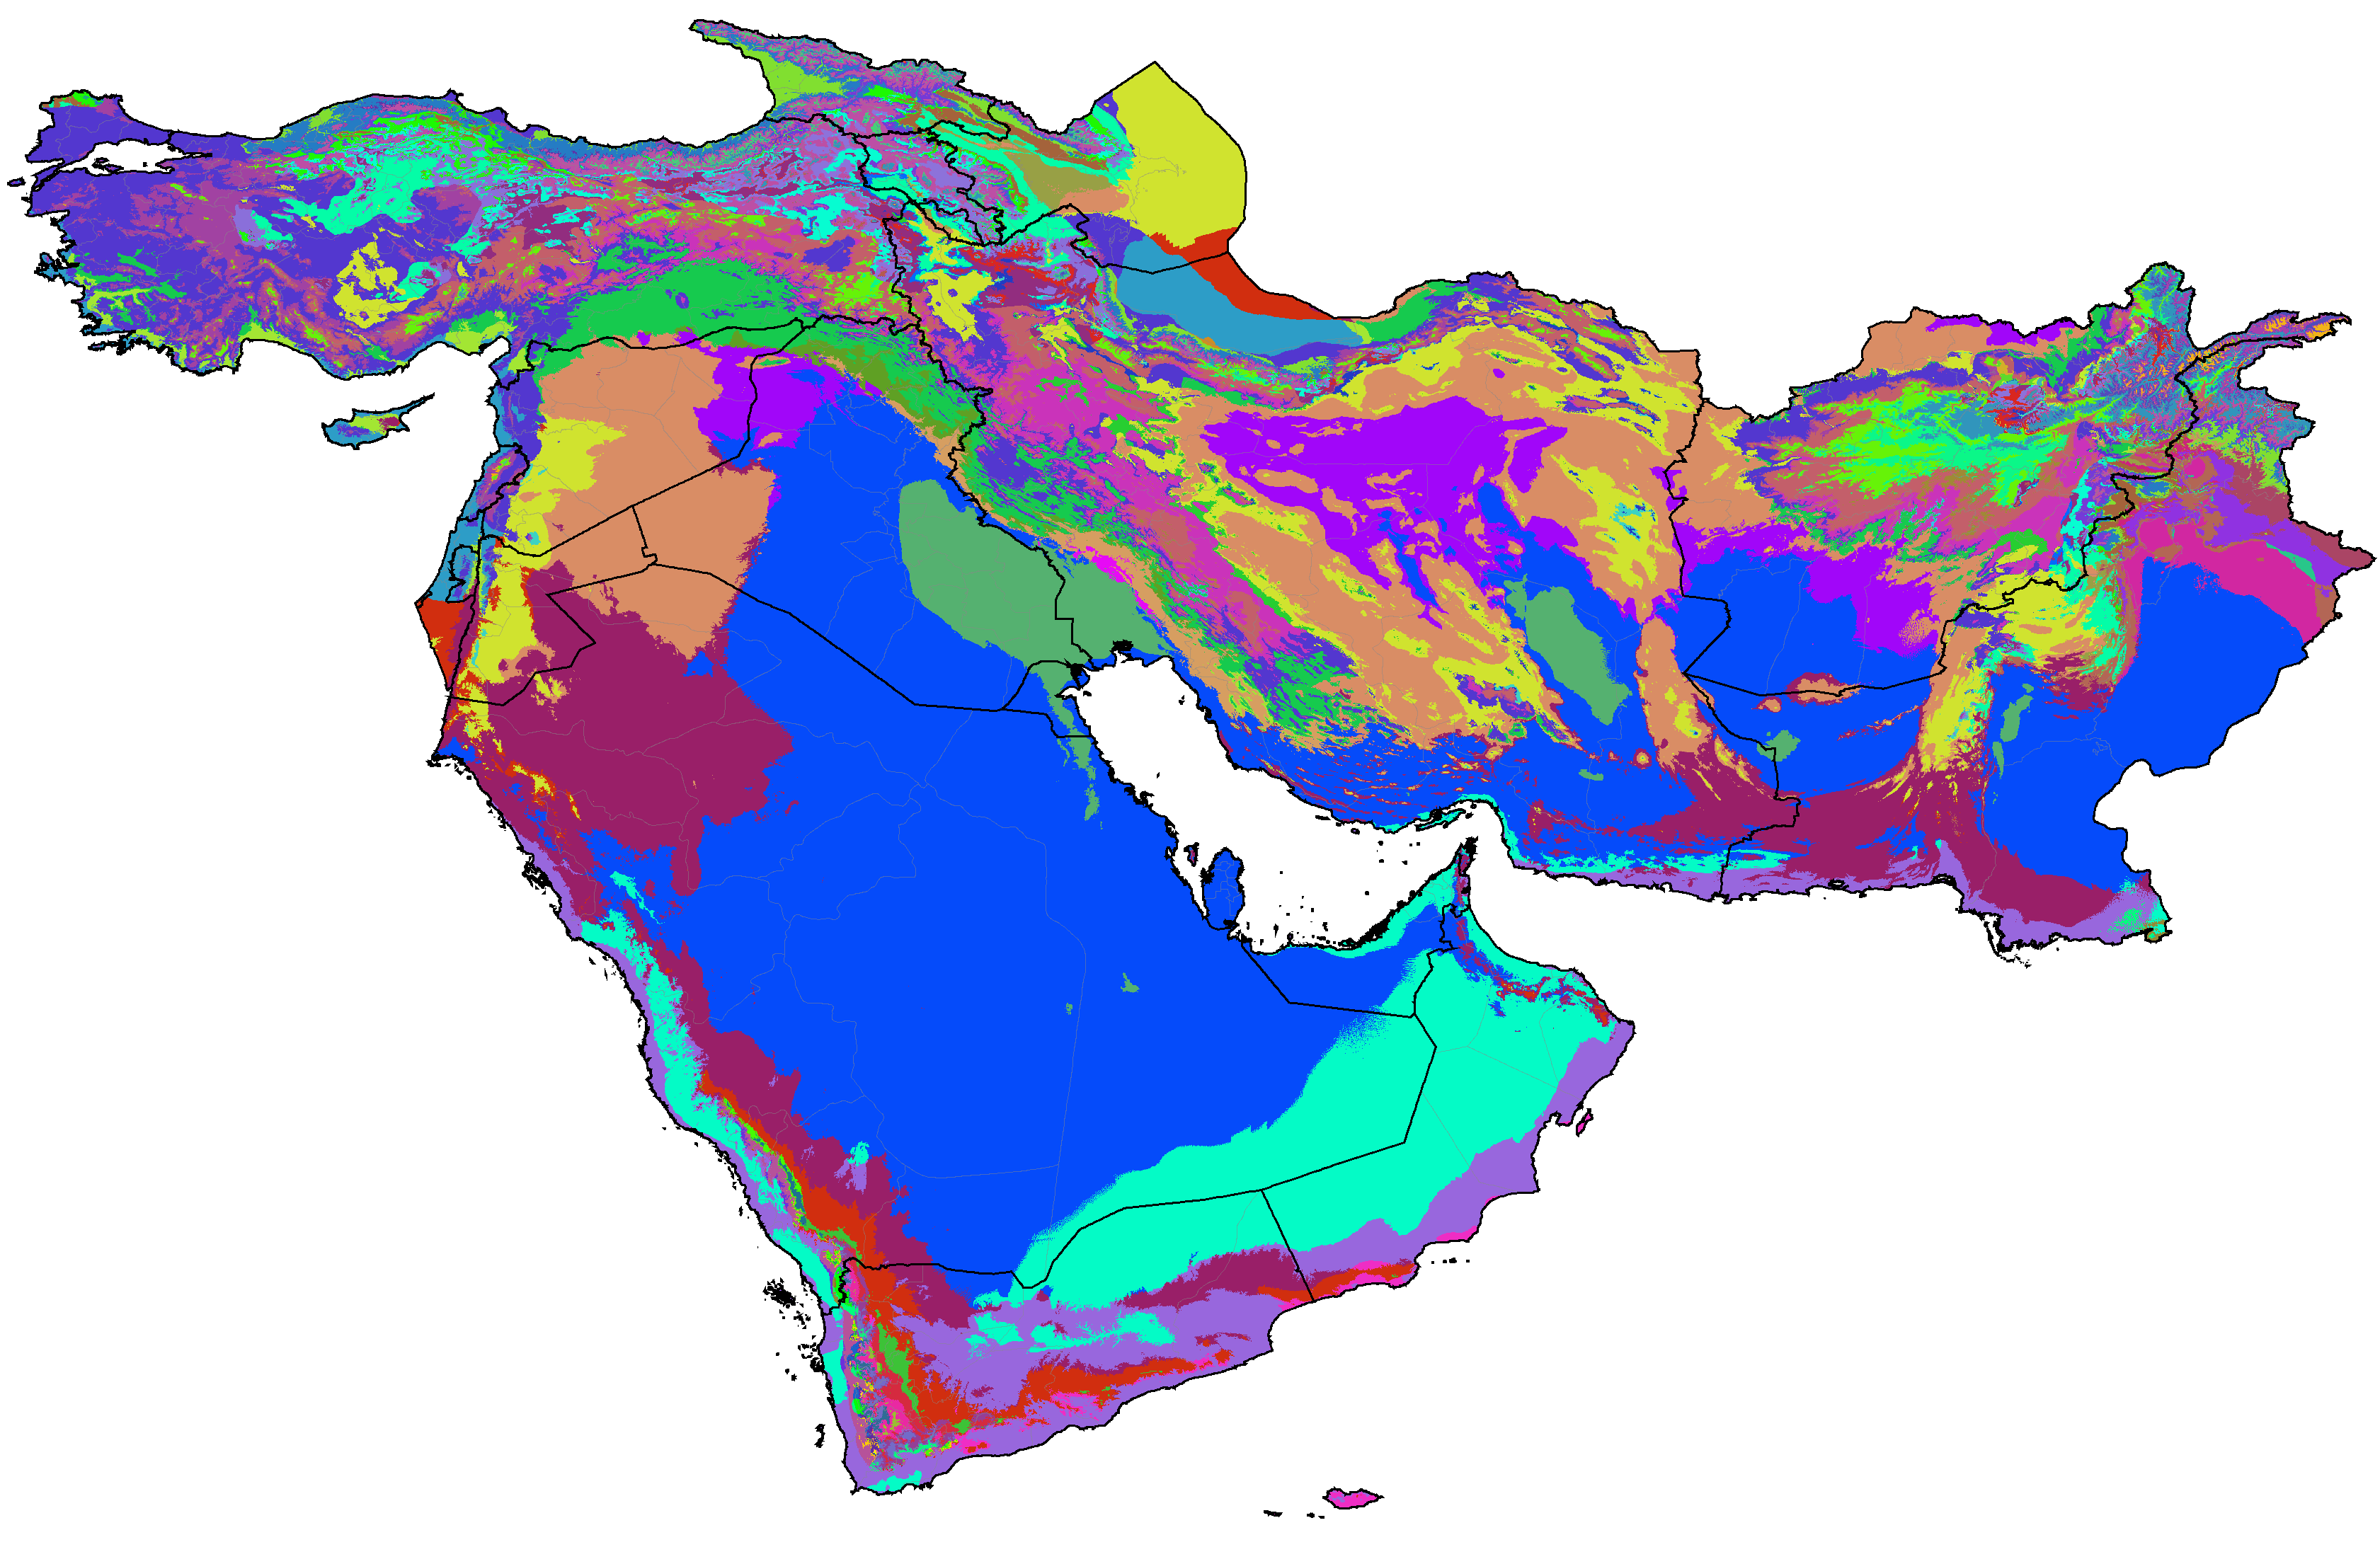
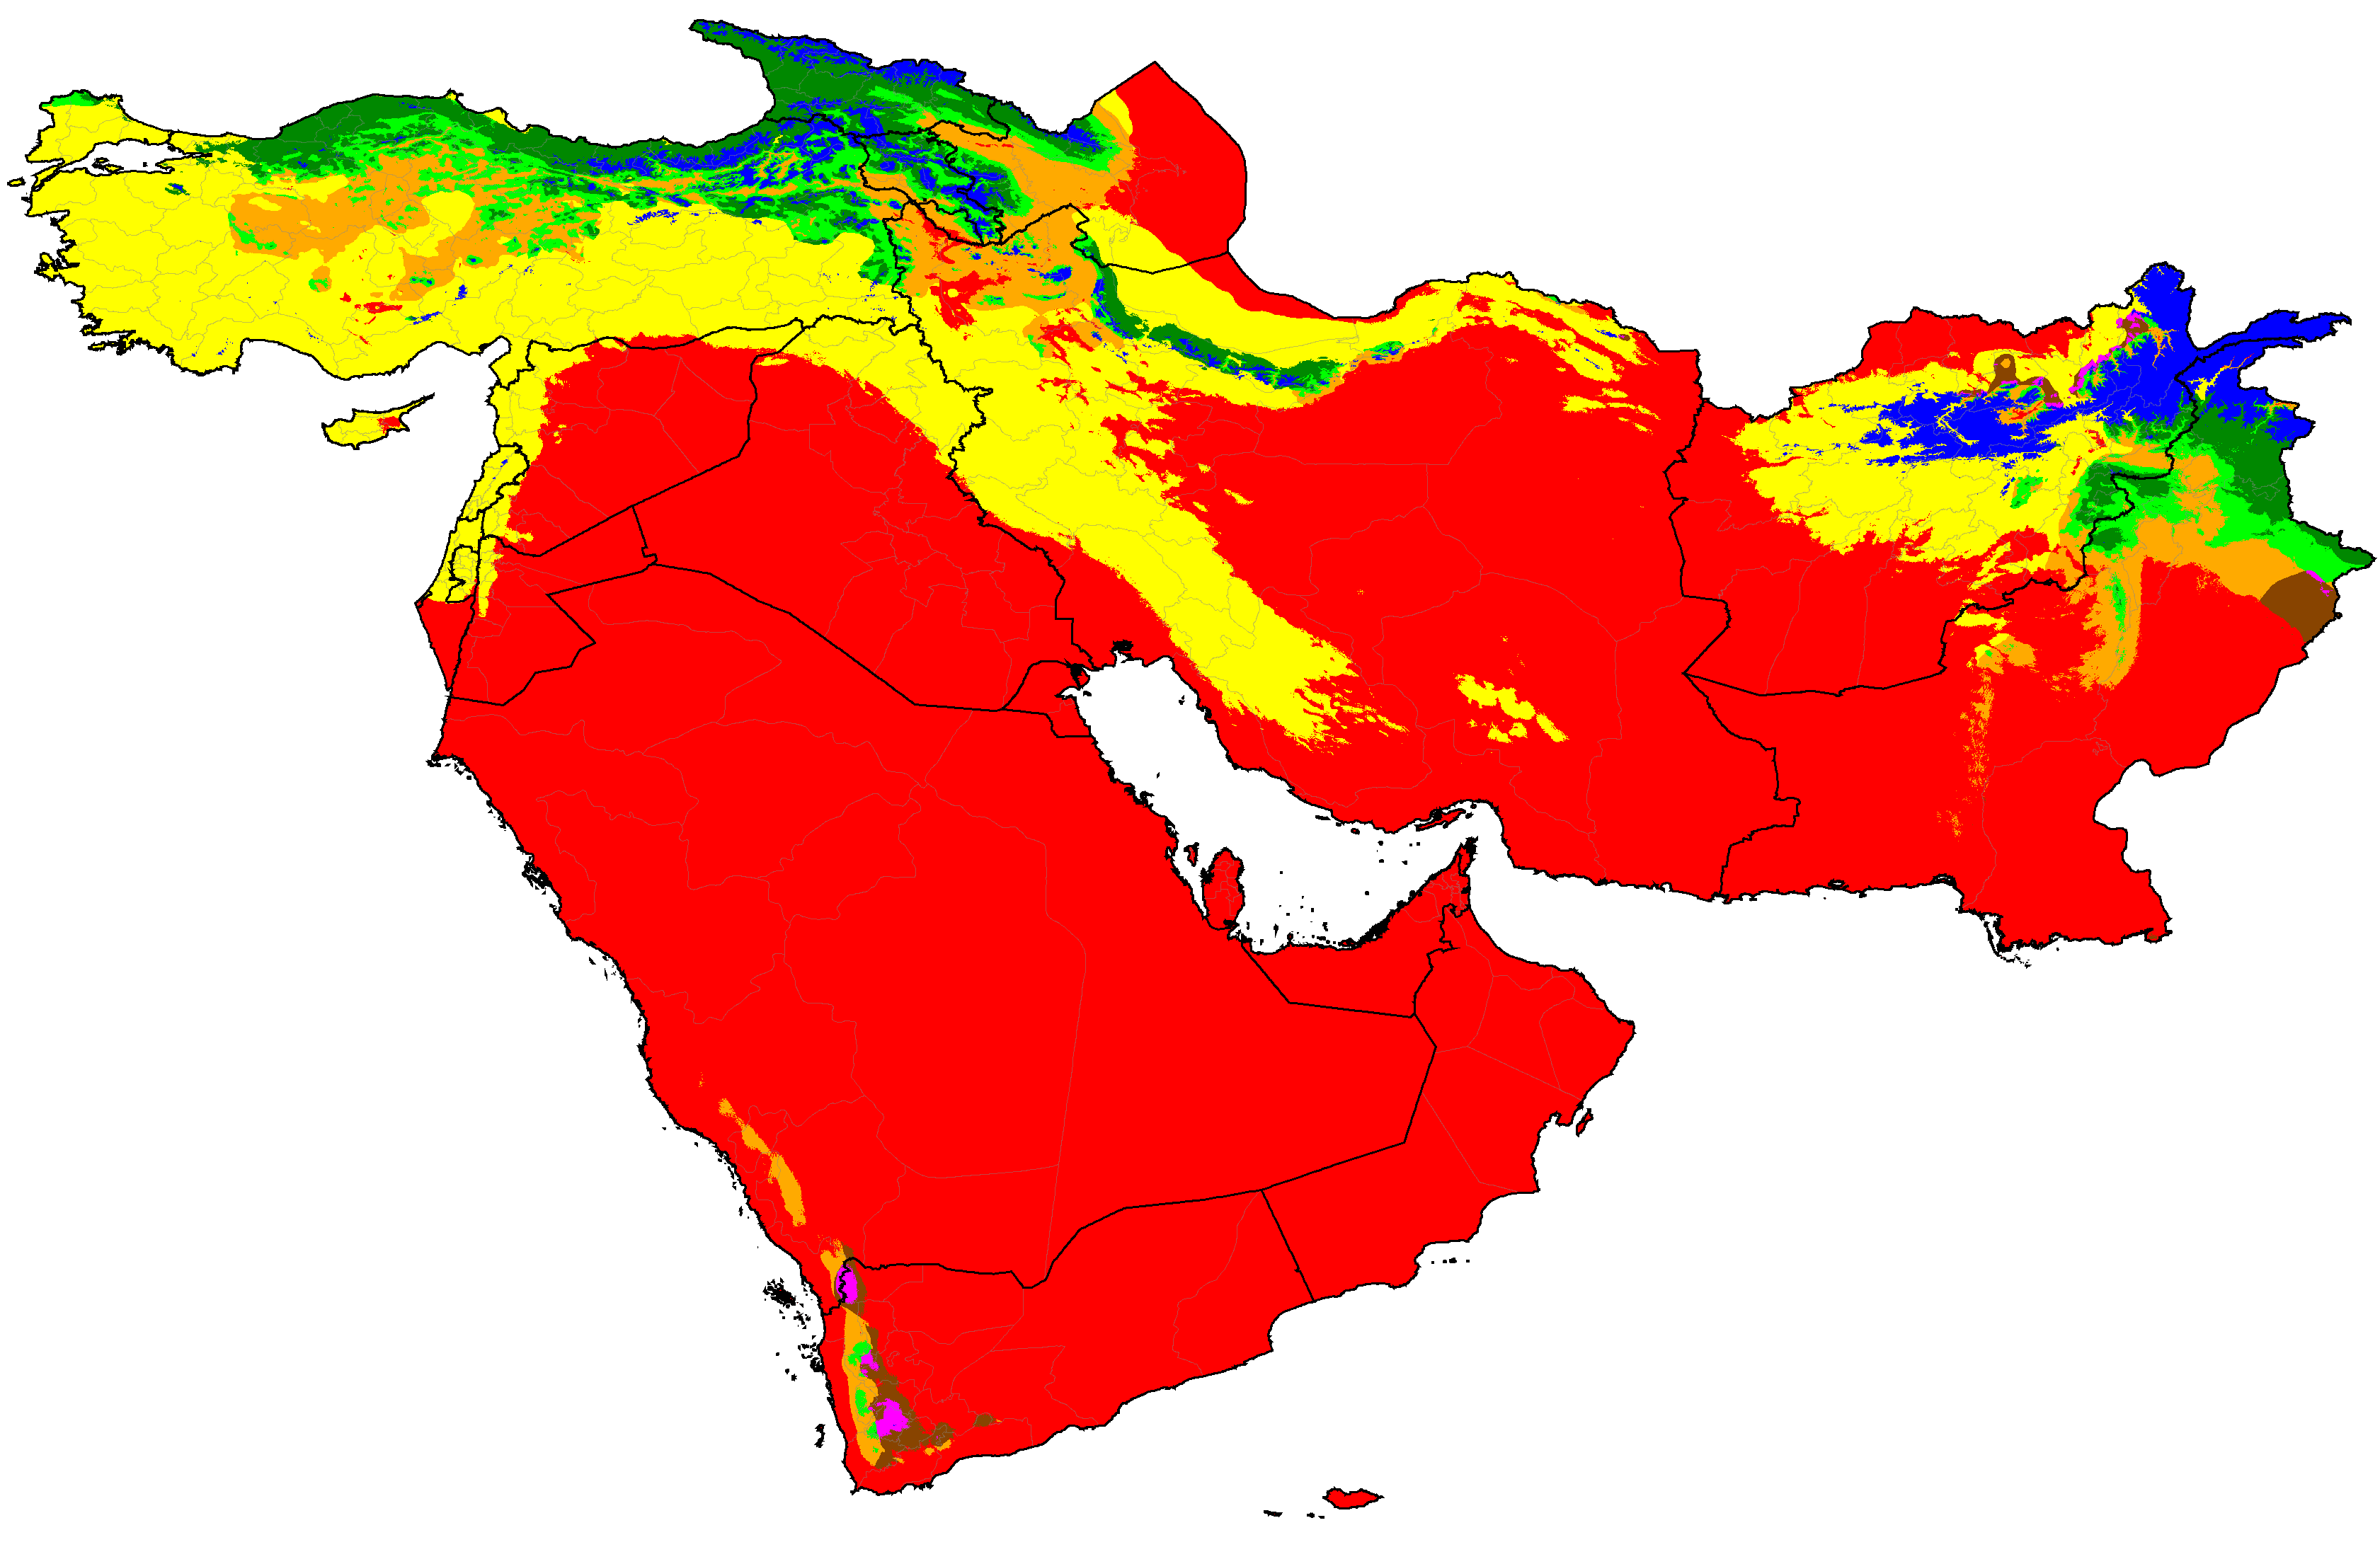
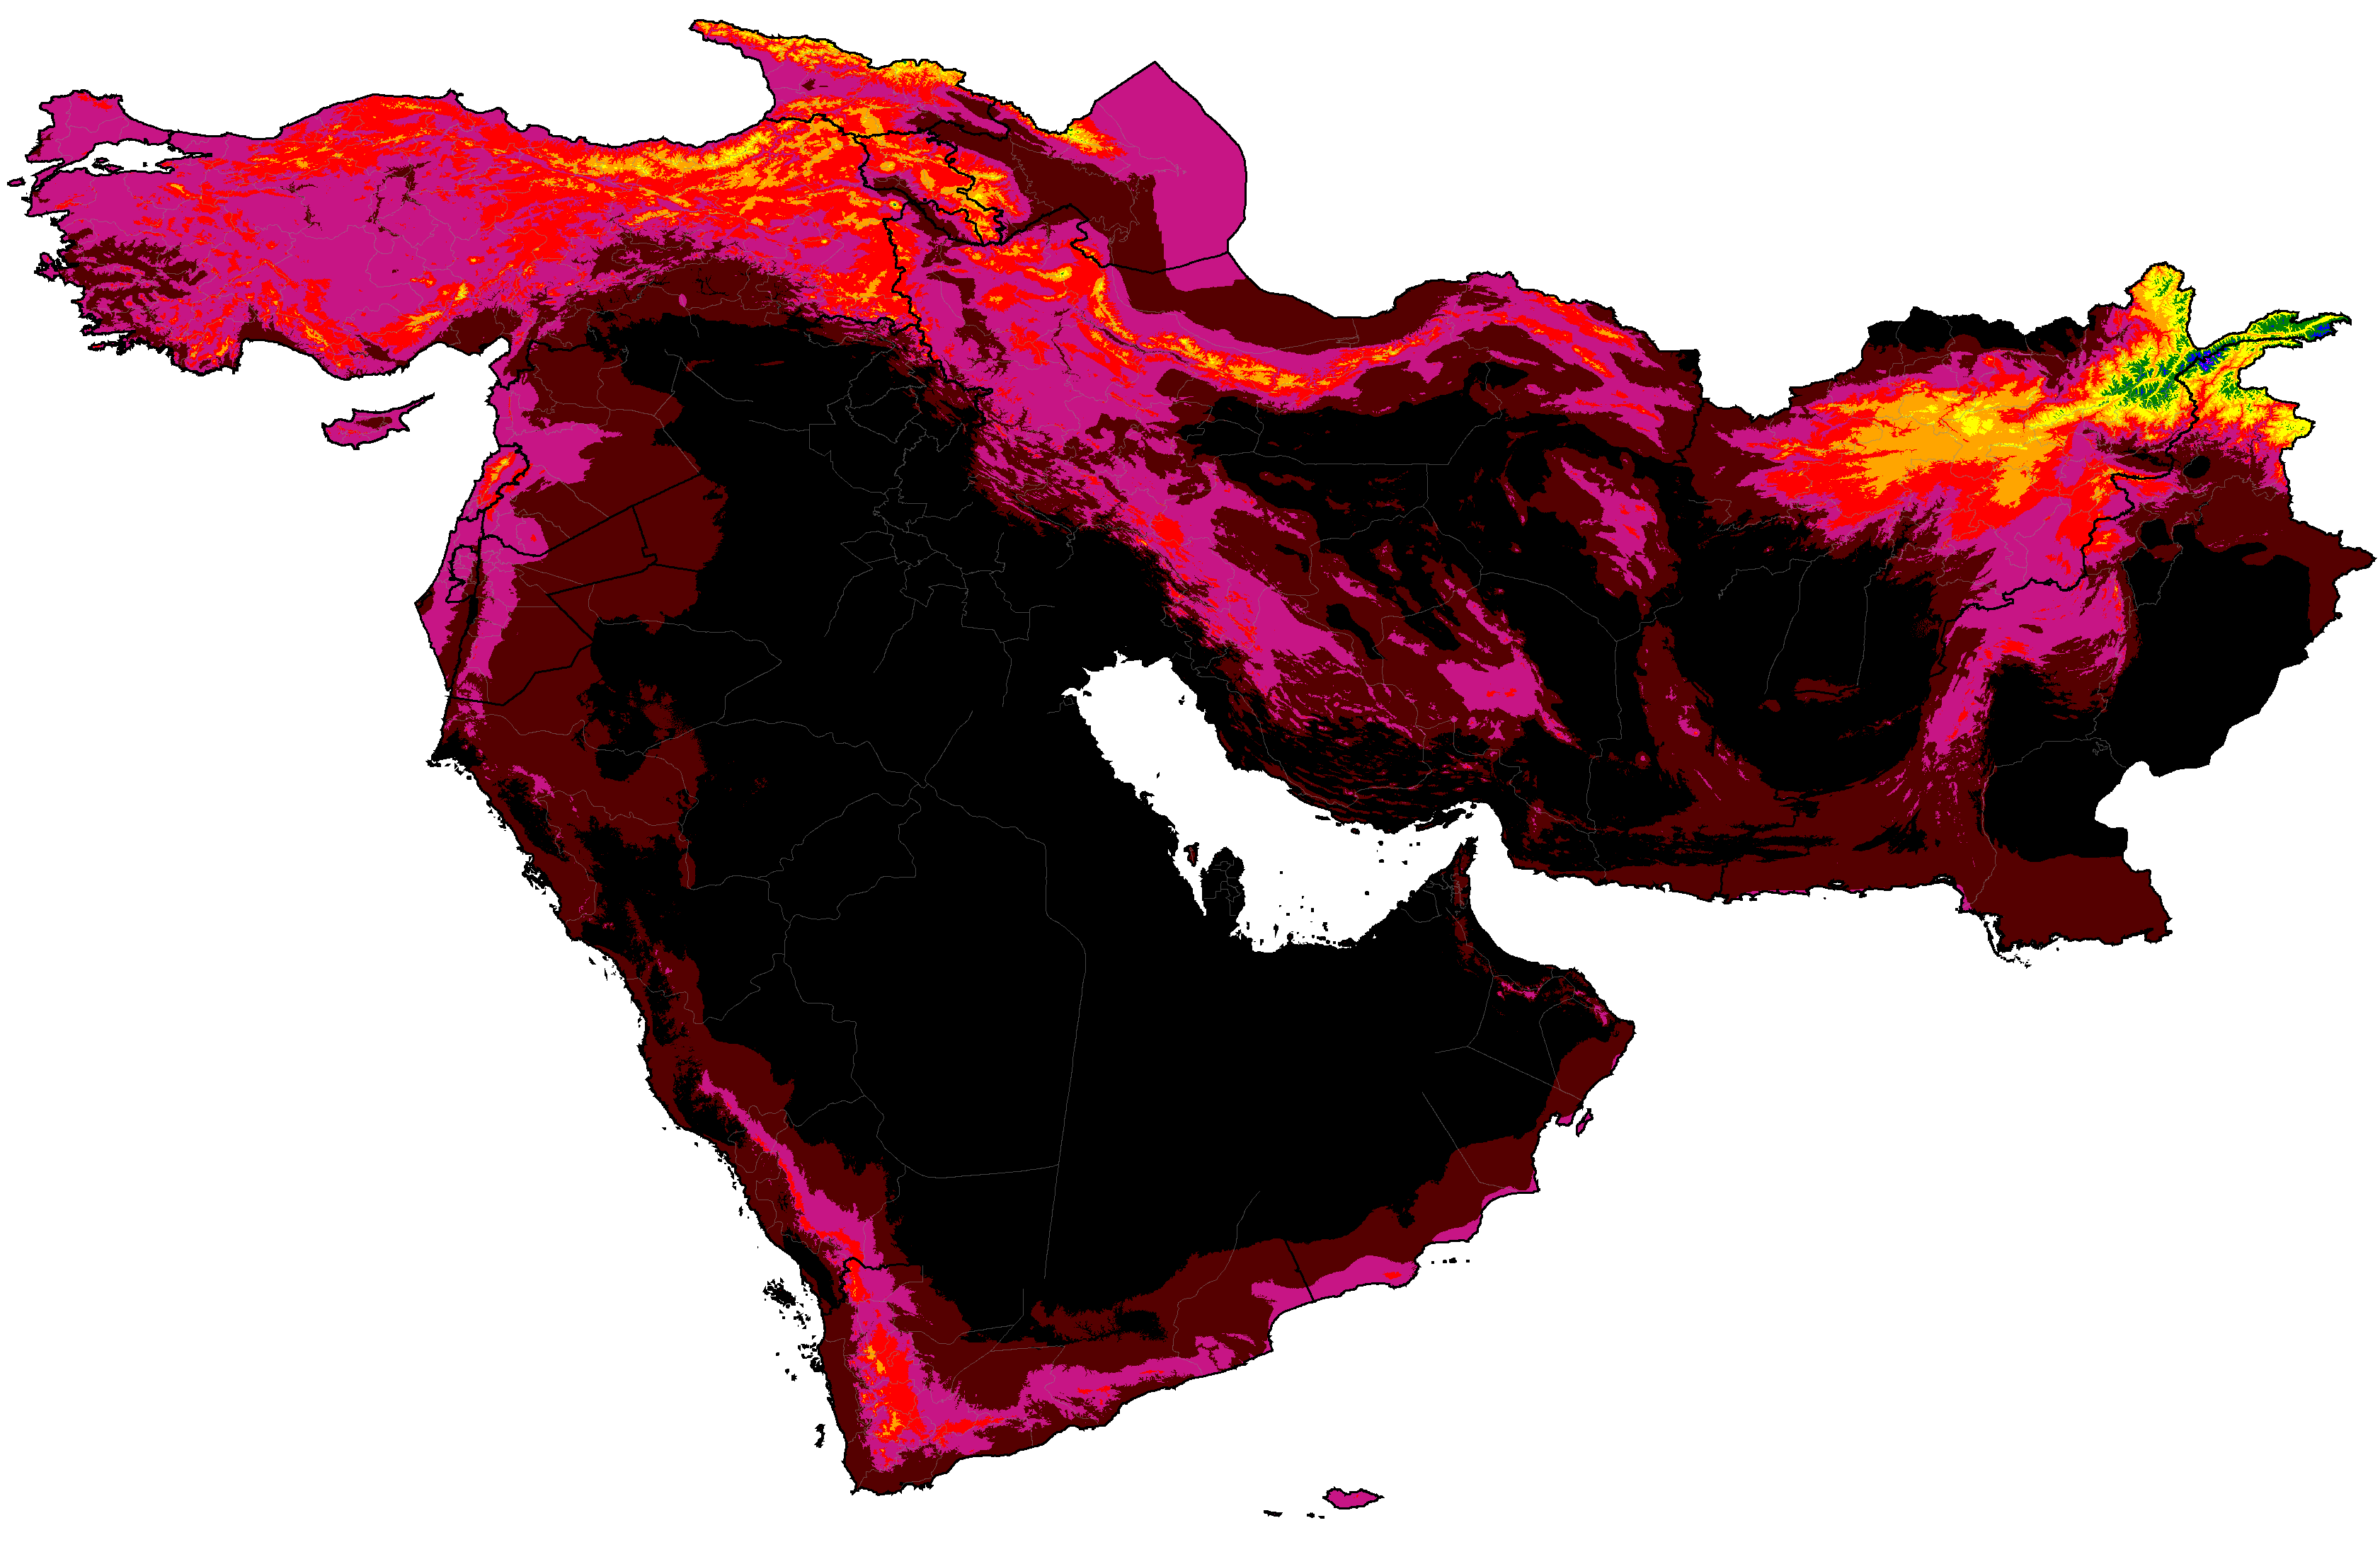
West Asia distribution of winter categories (projections are SSP5-8.5 high emissions normals)
Note: Due to the complexity of the system, only the most common climates in each map are labeled.
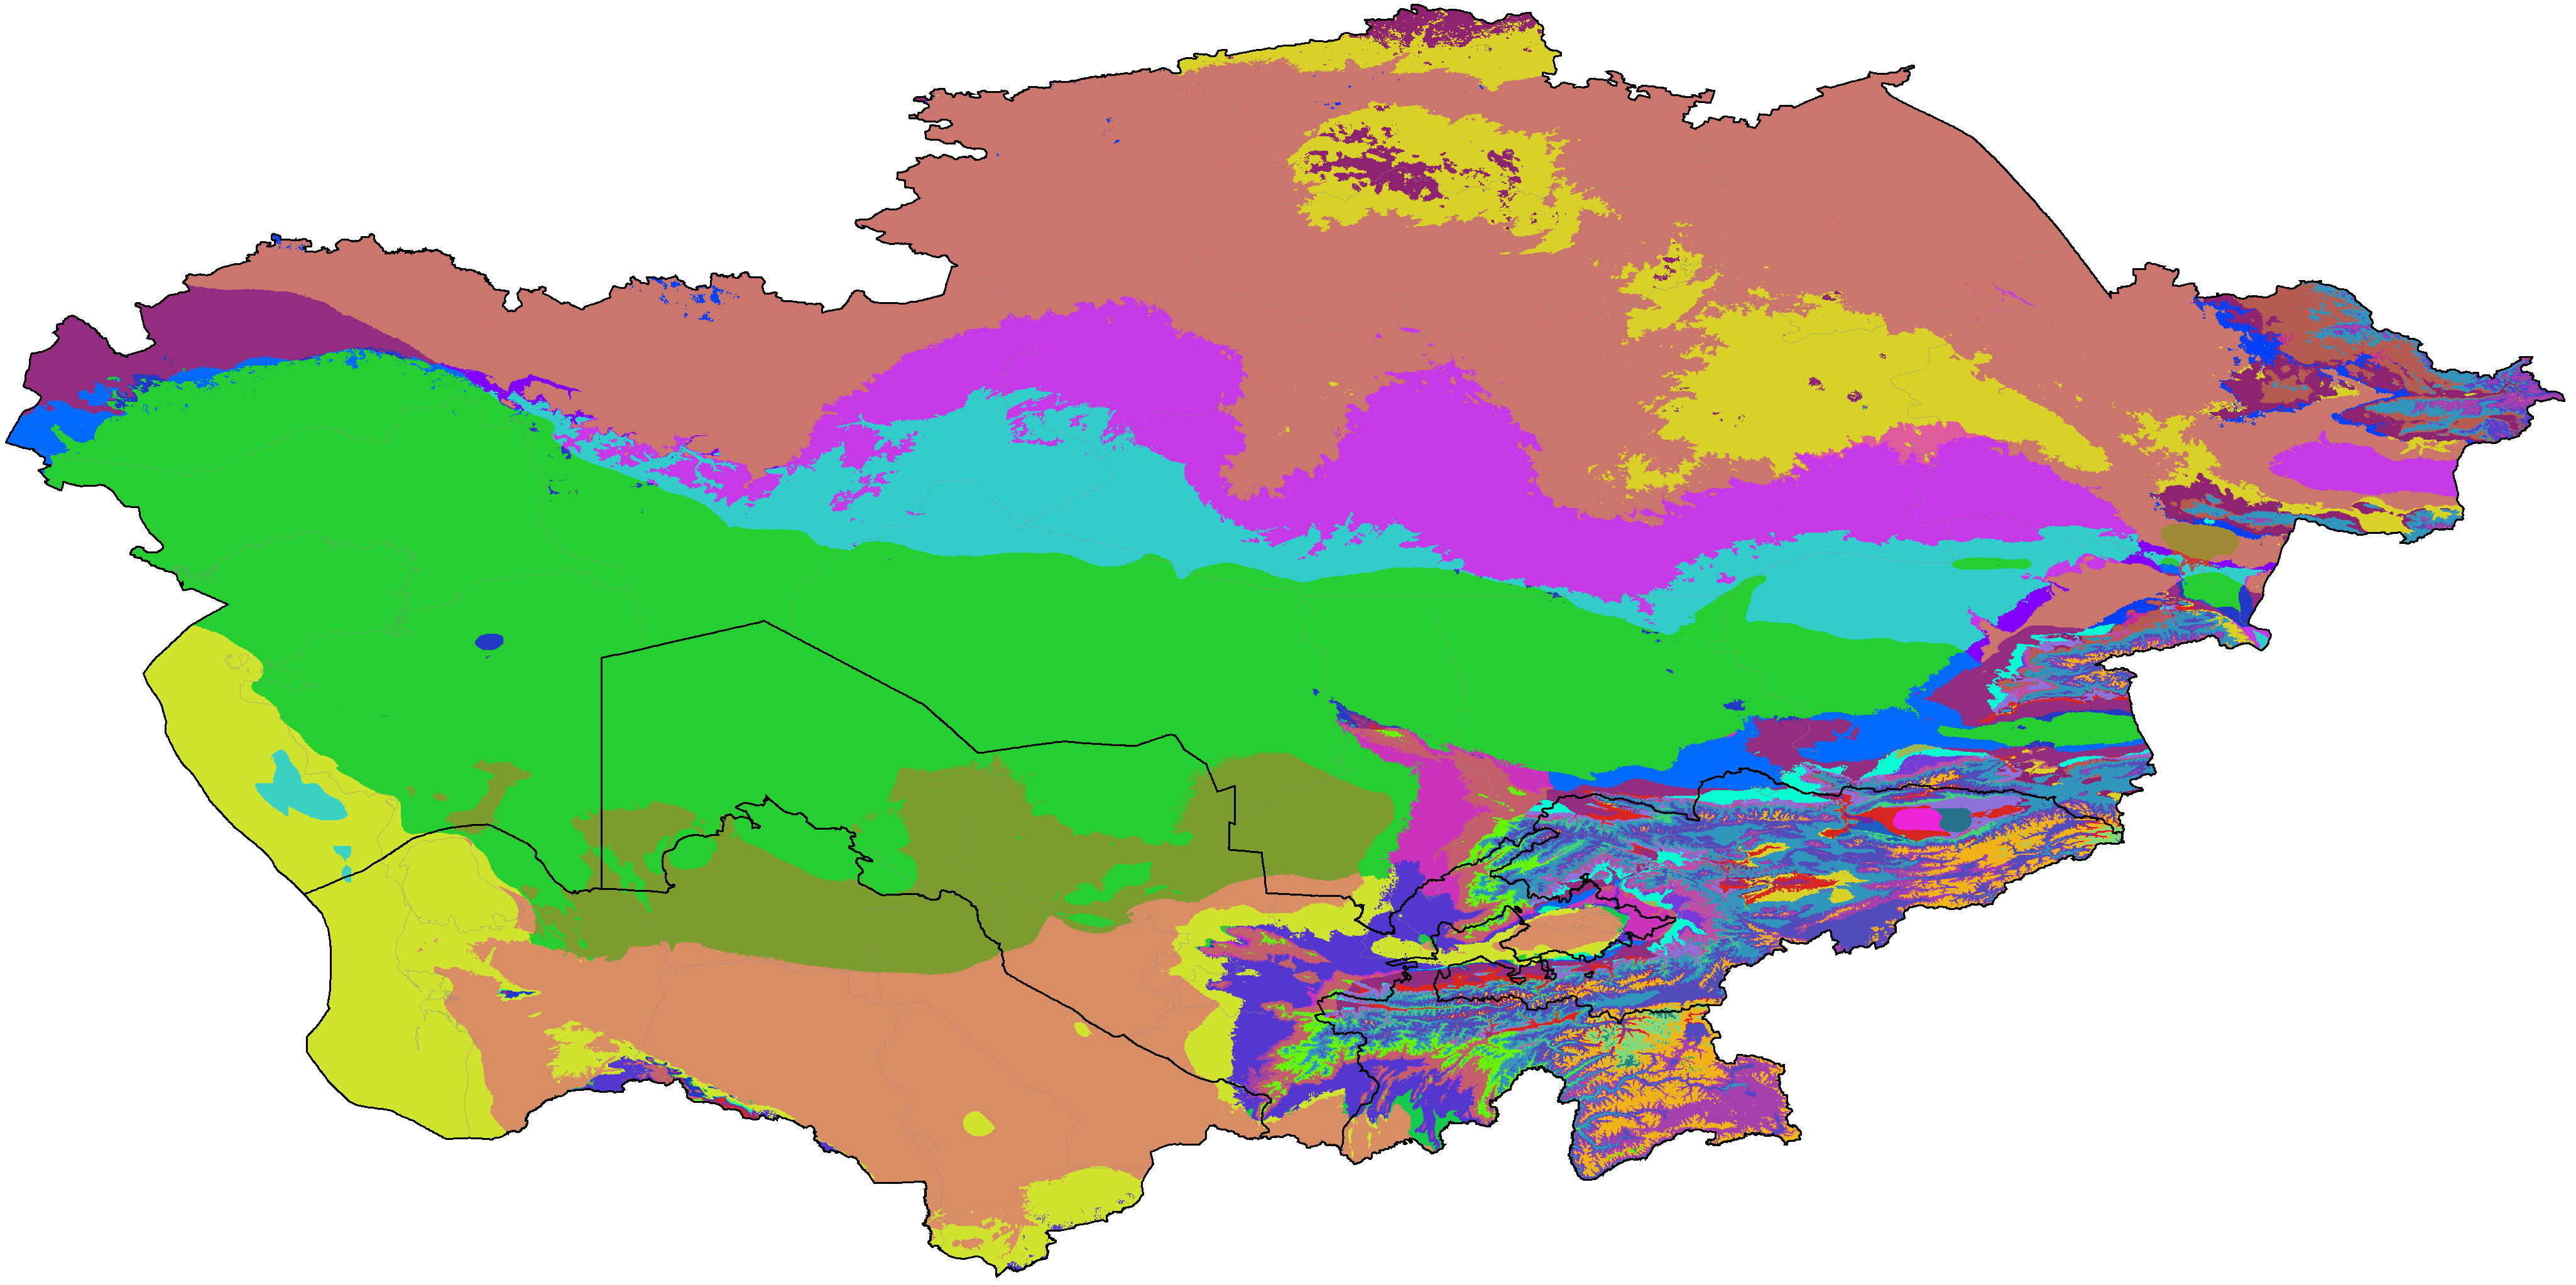
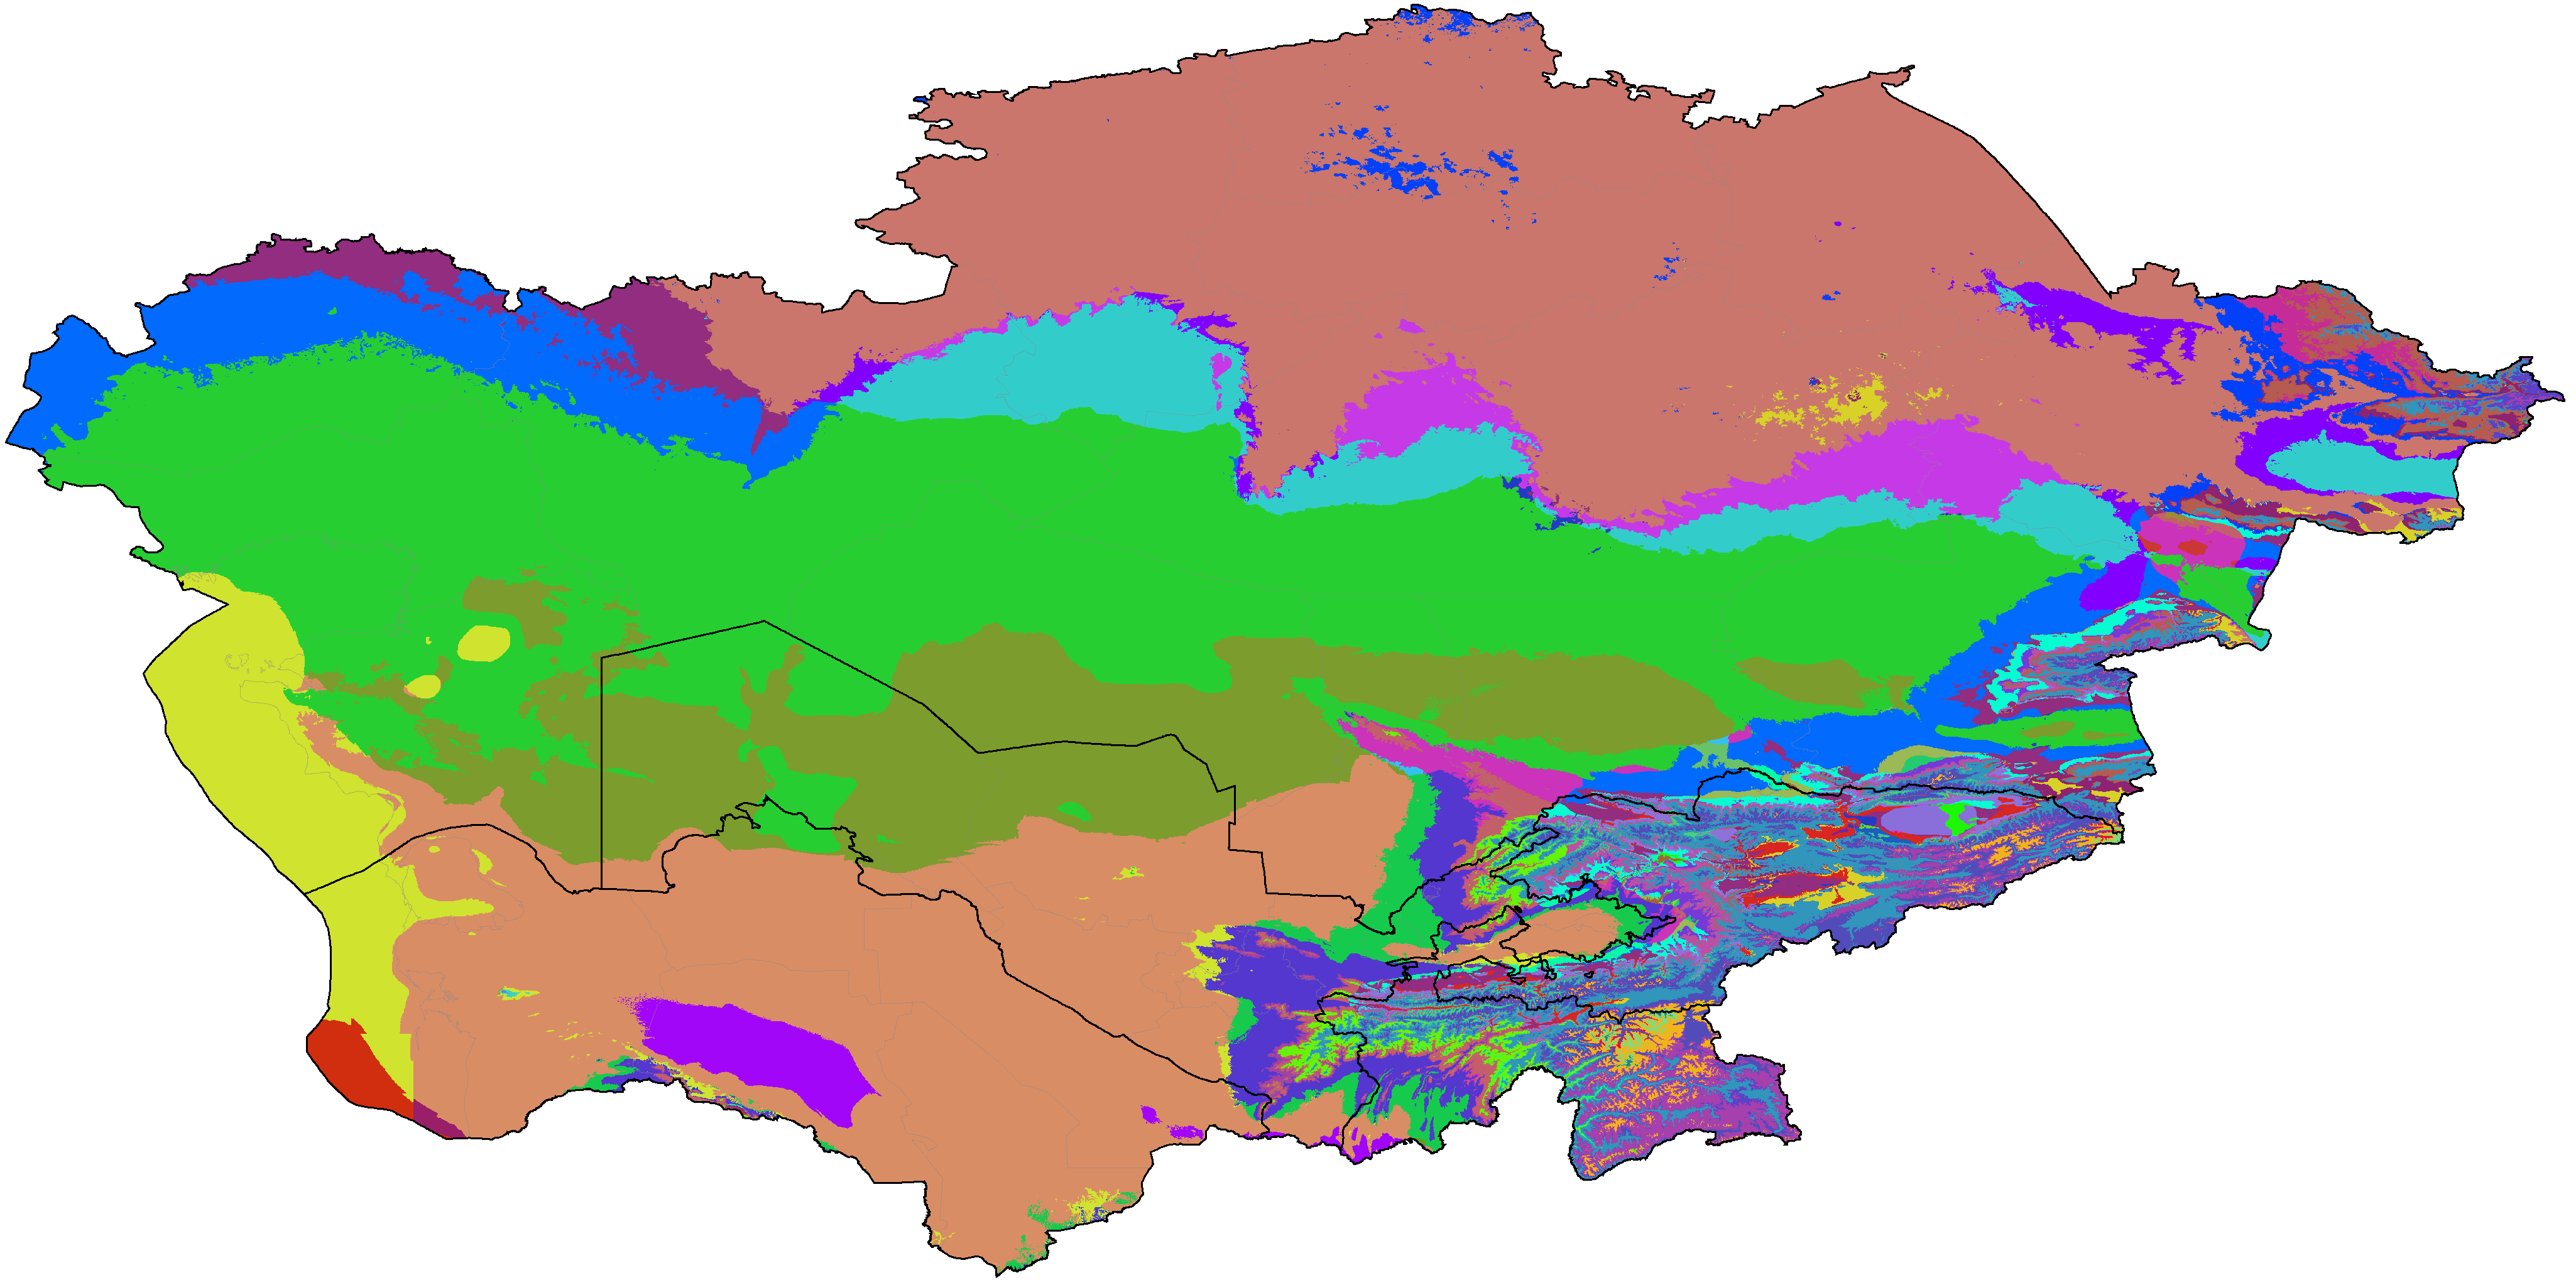
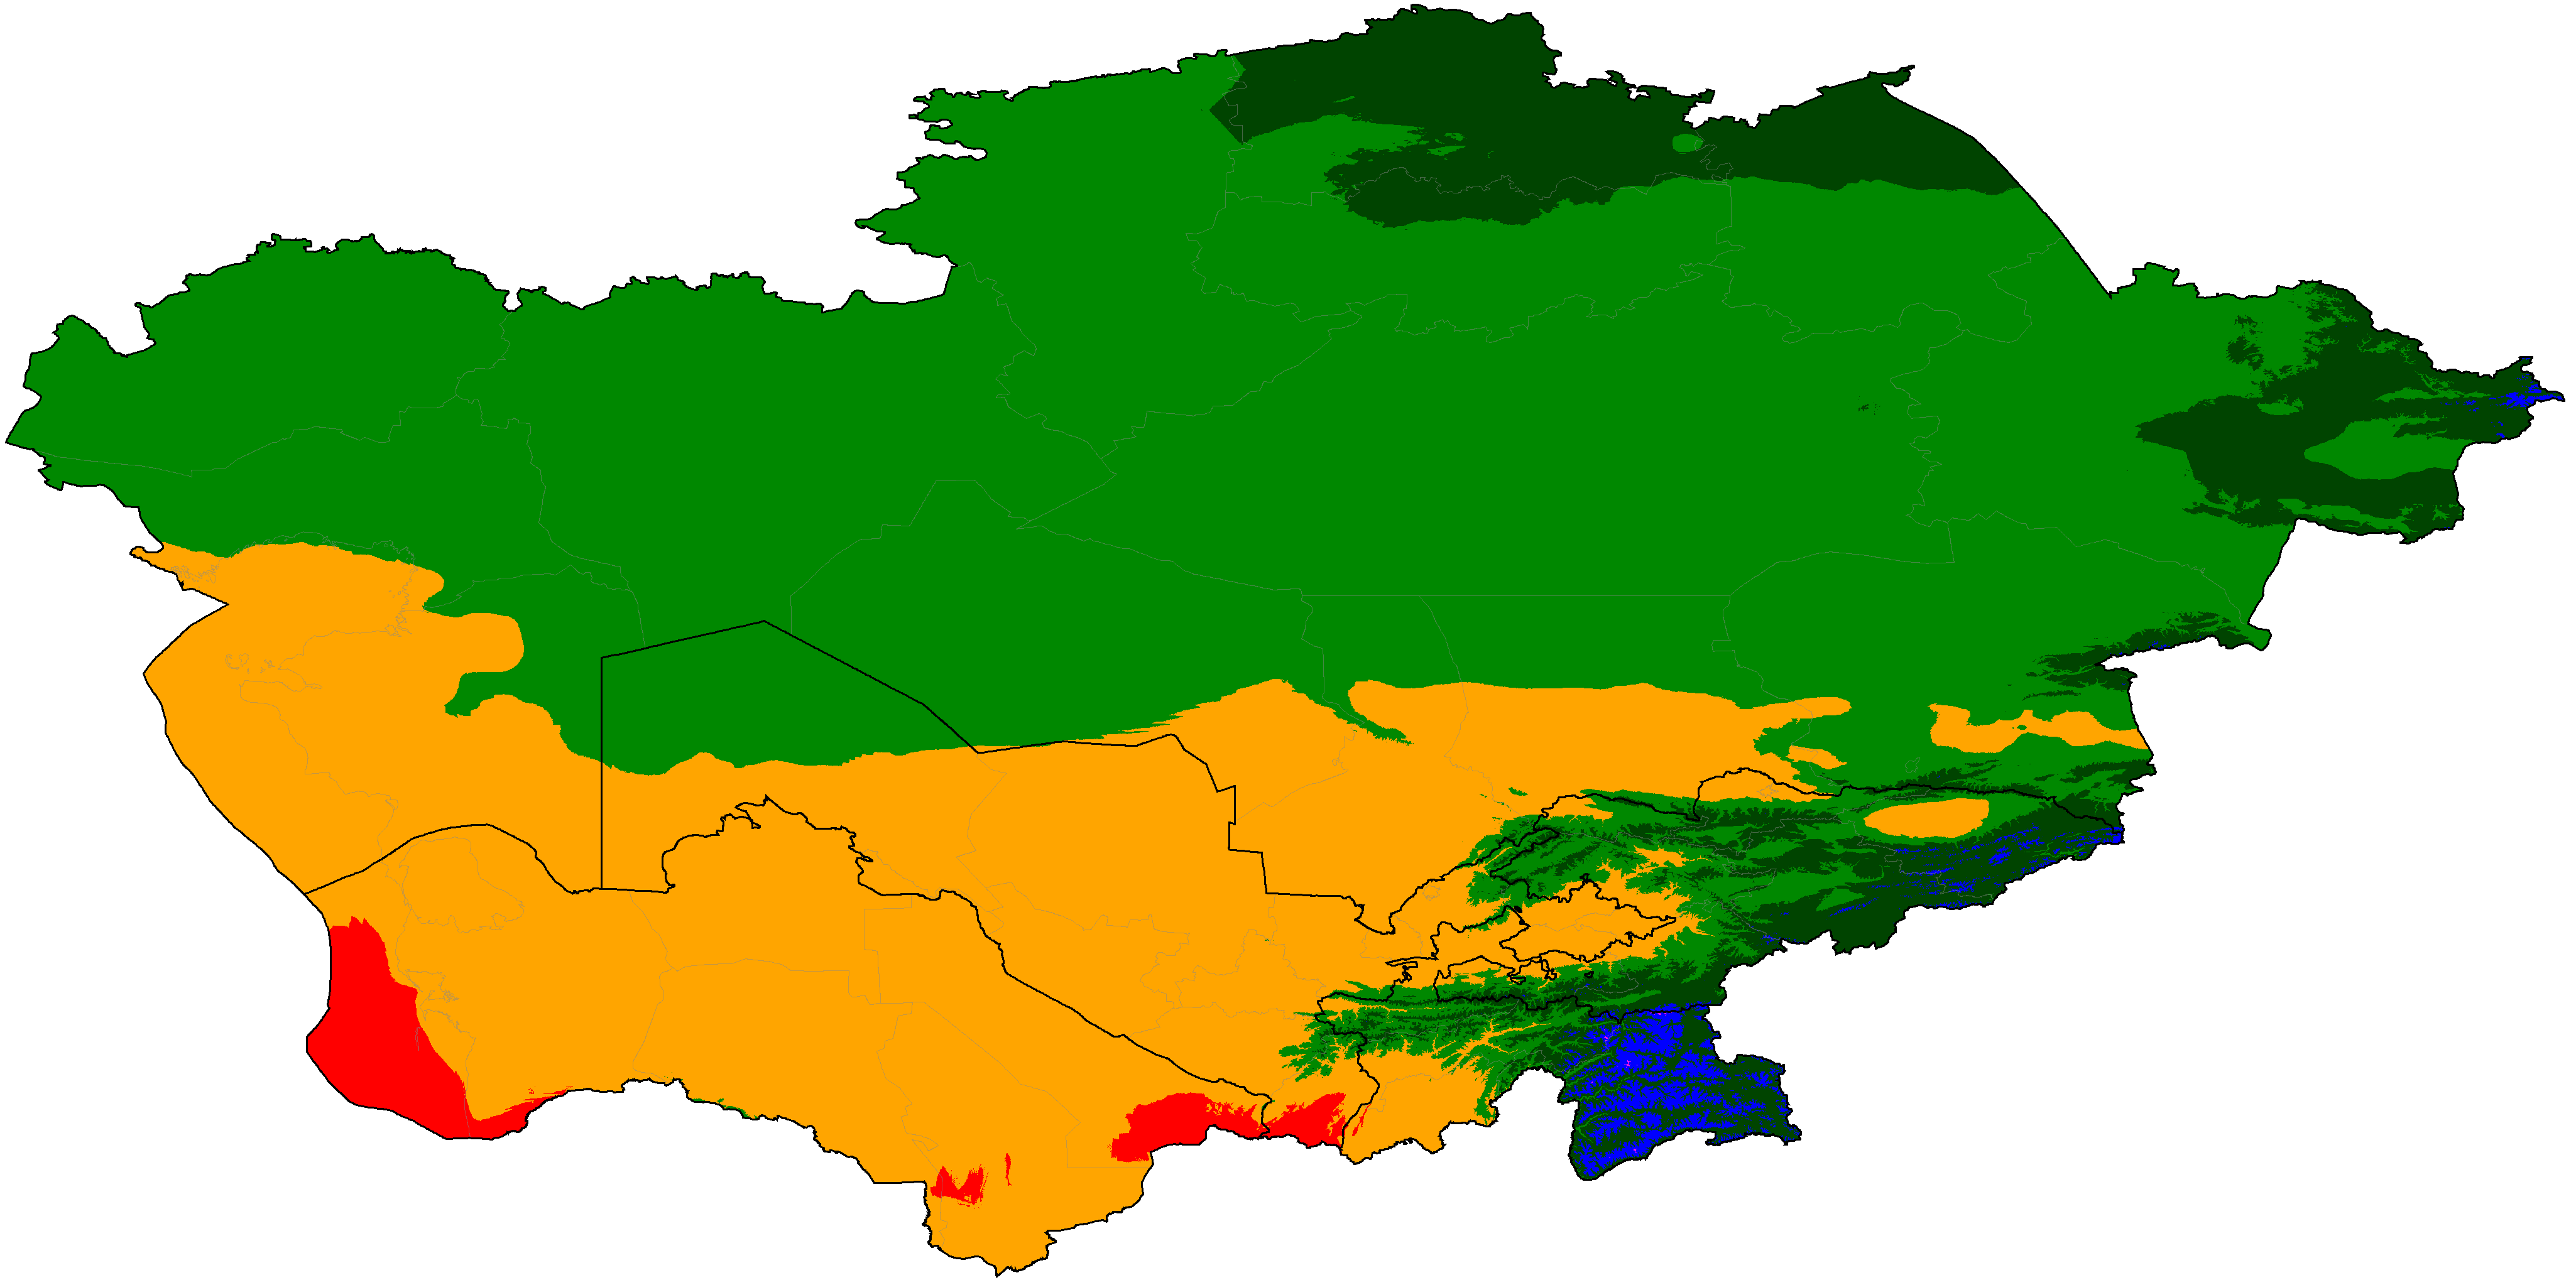
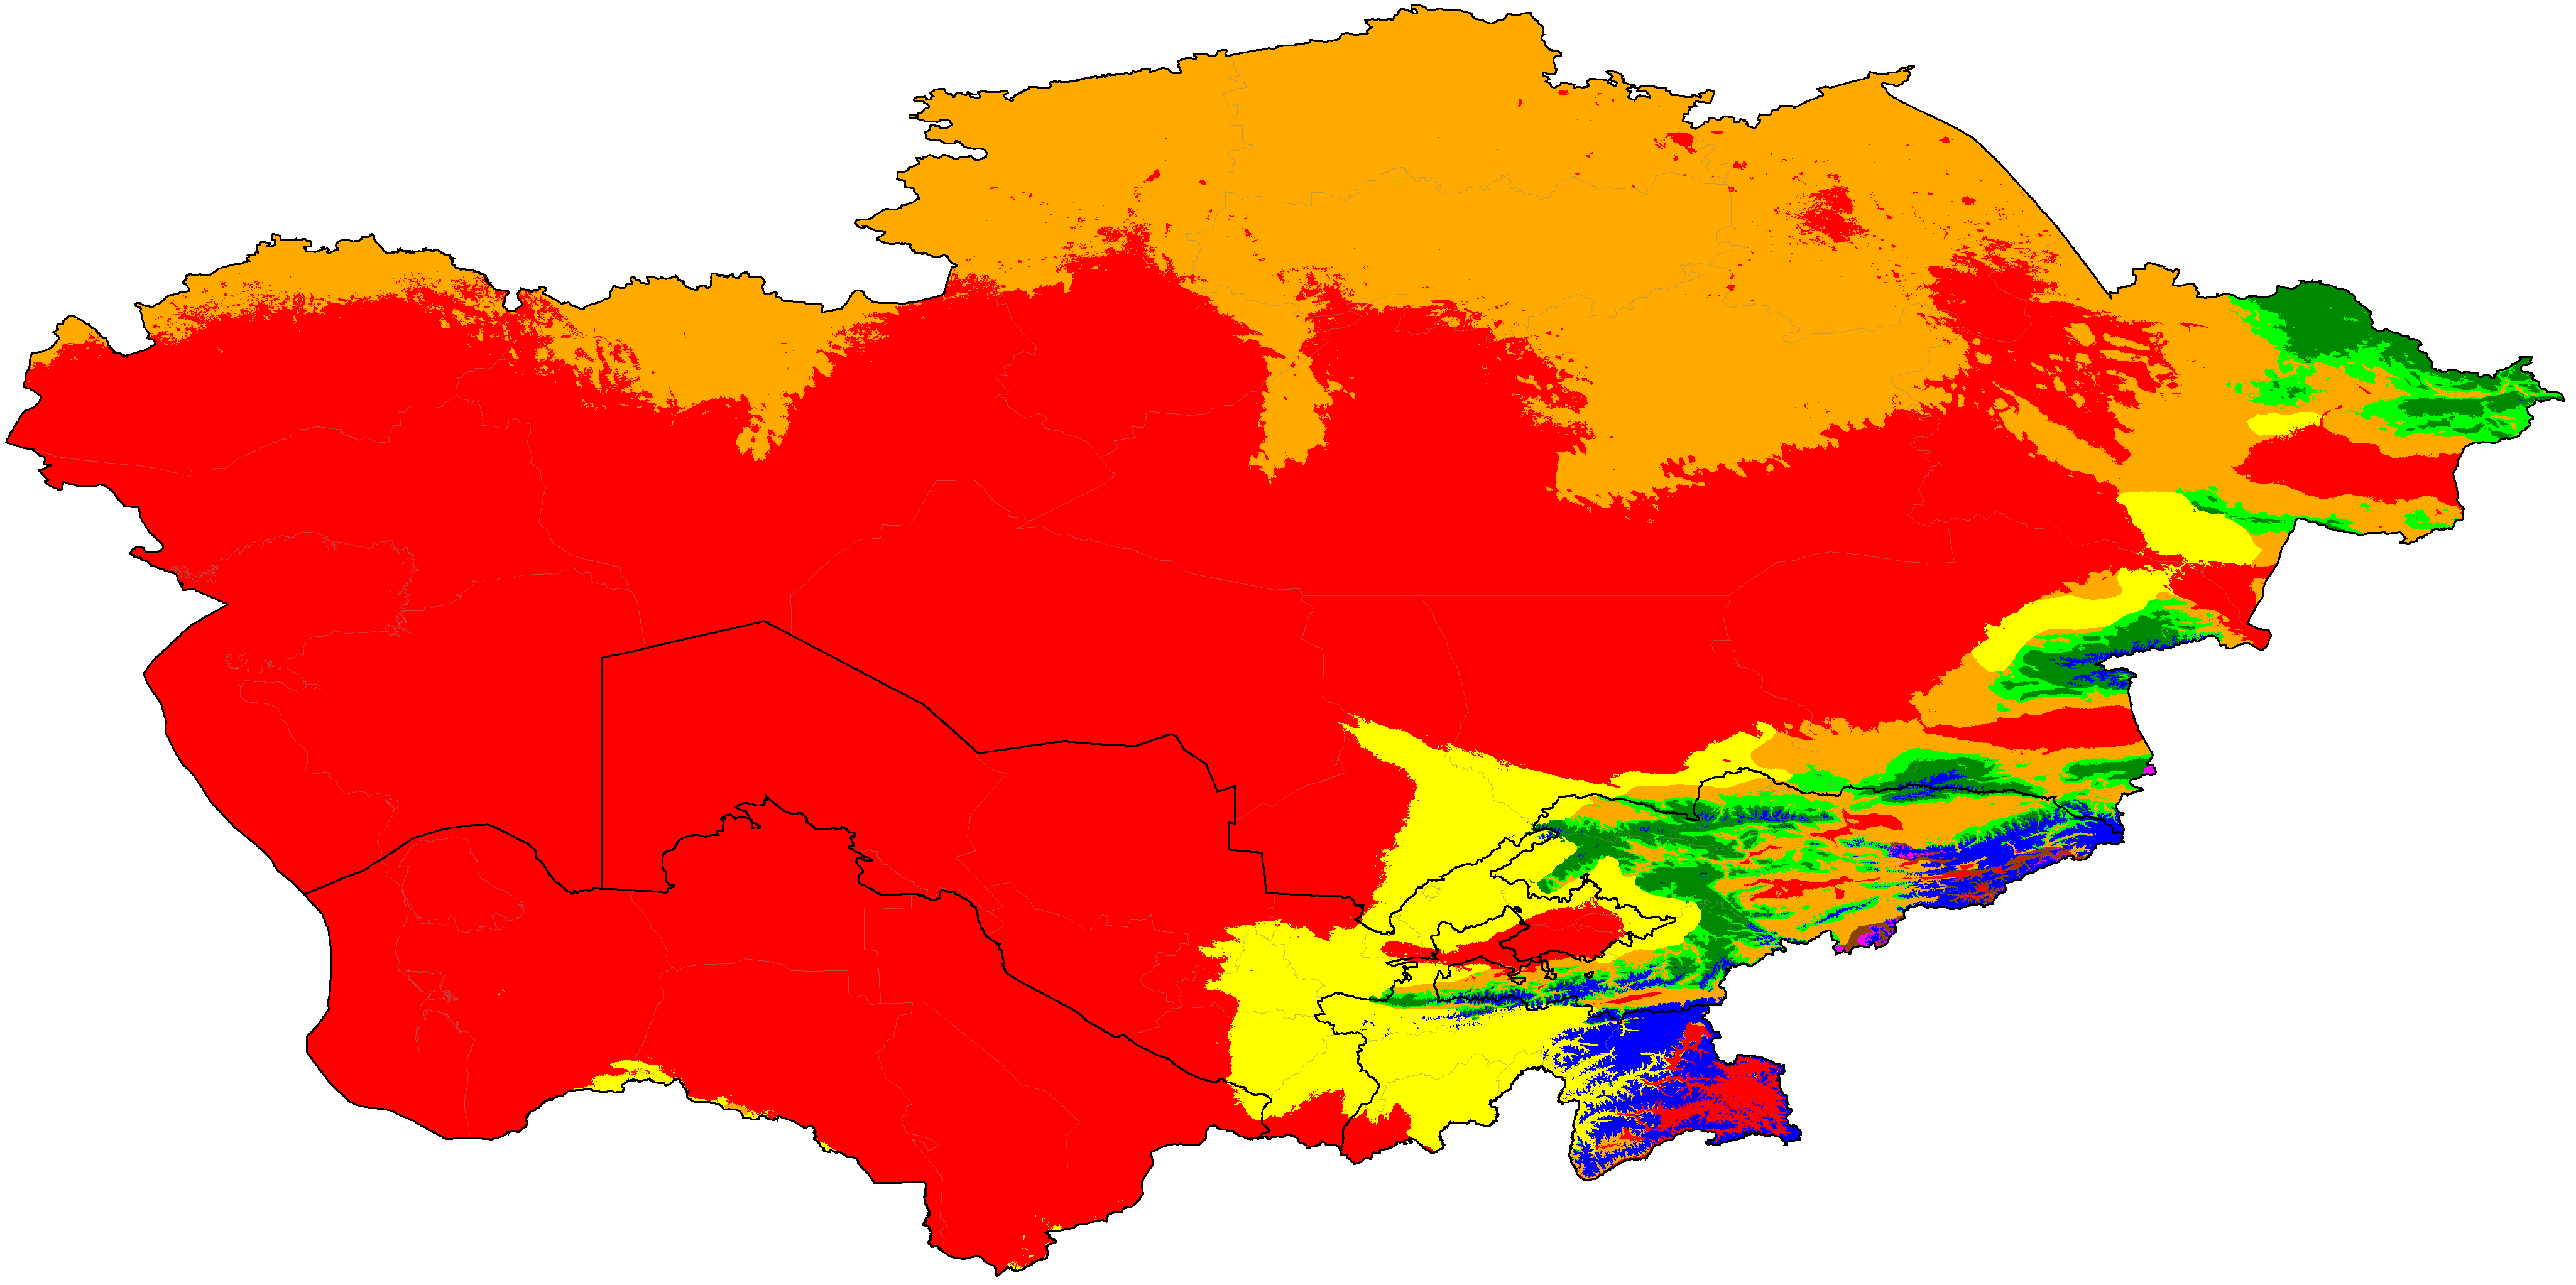
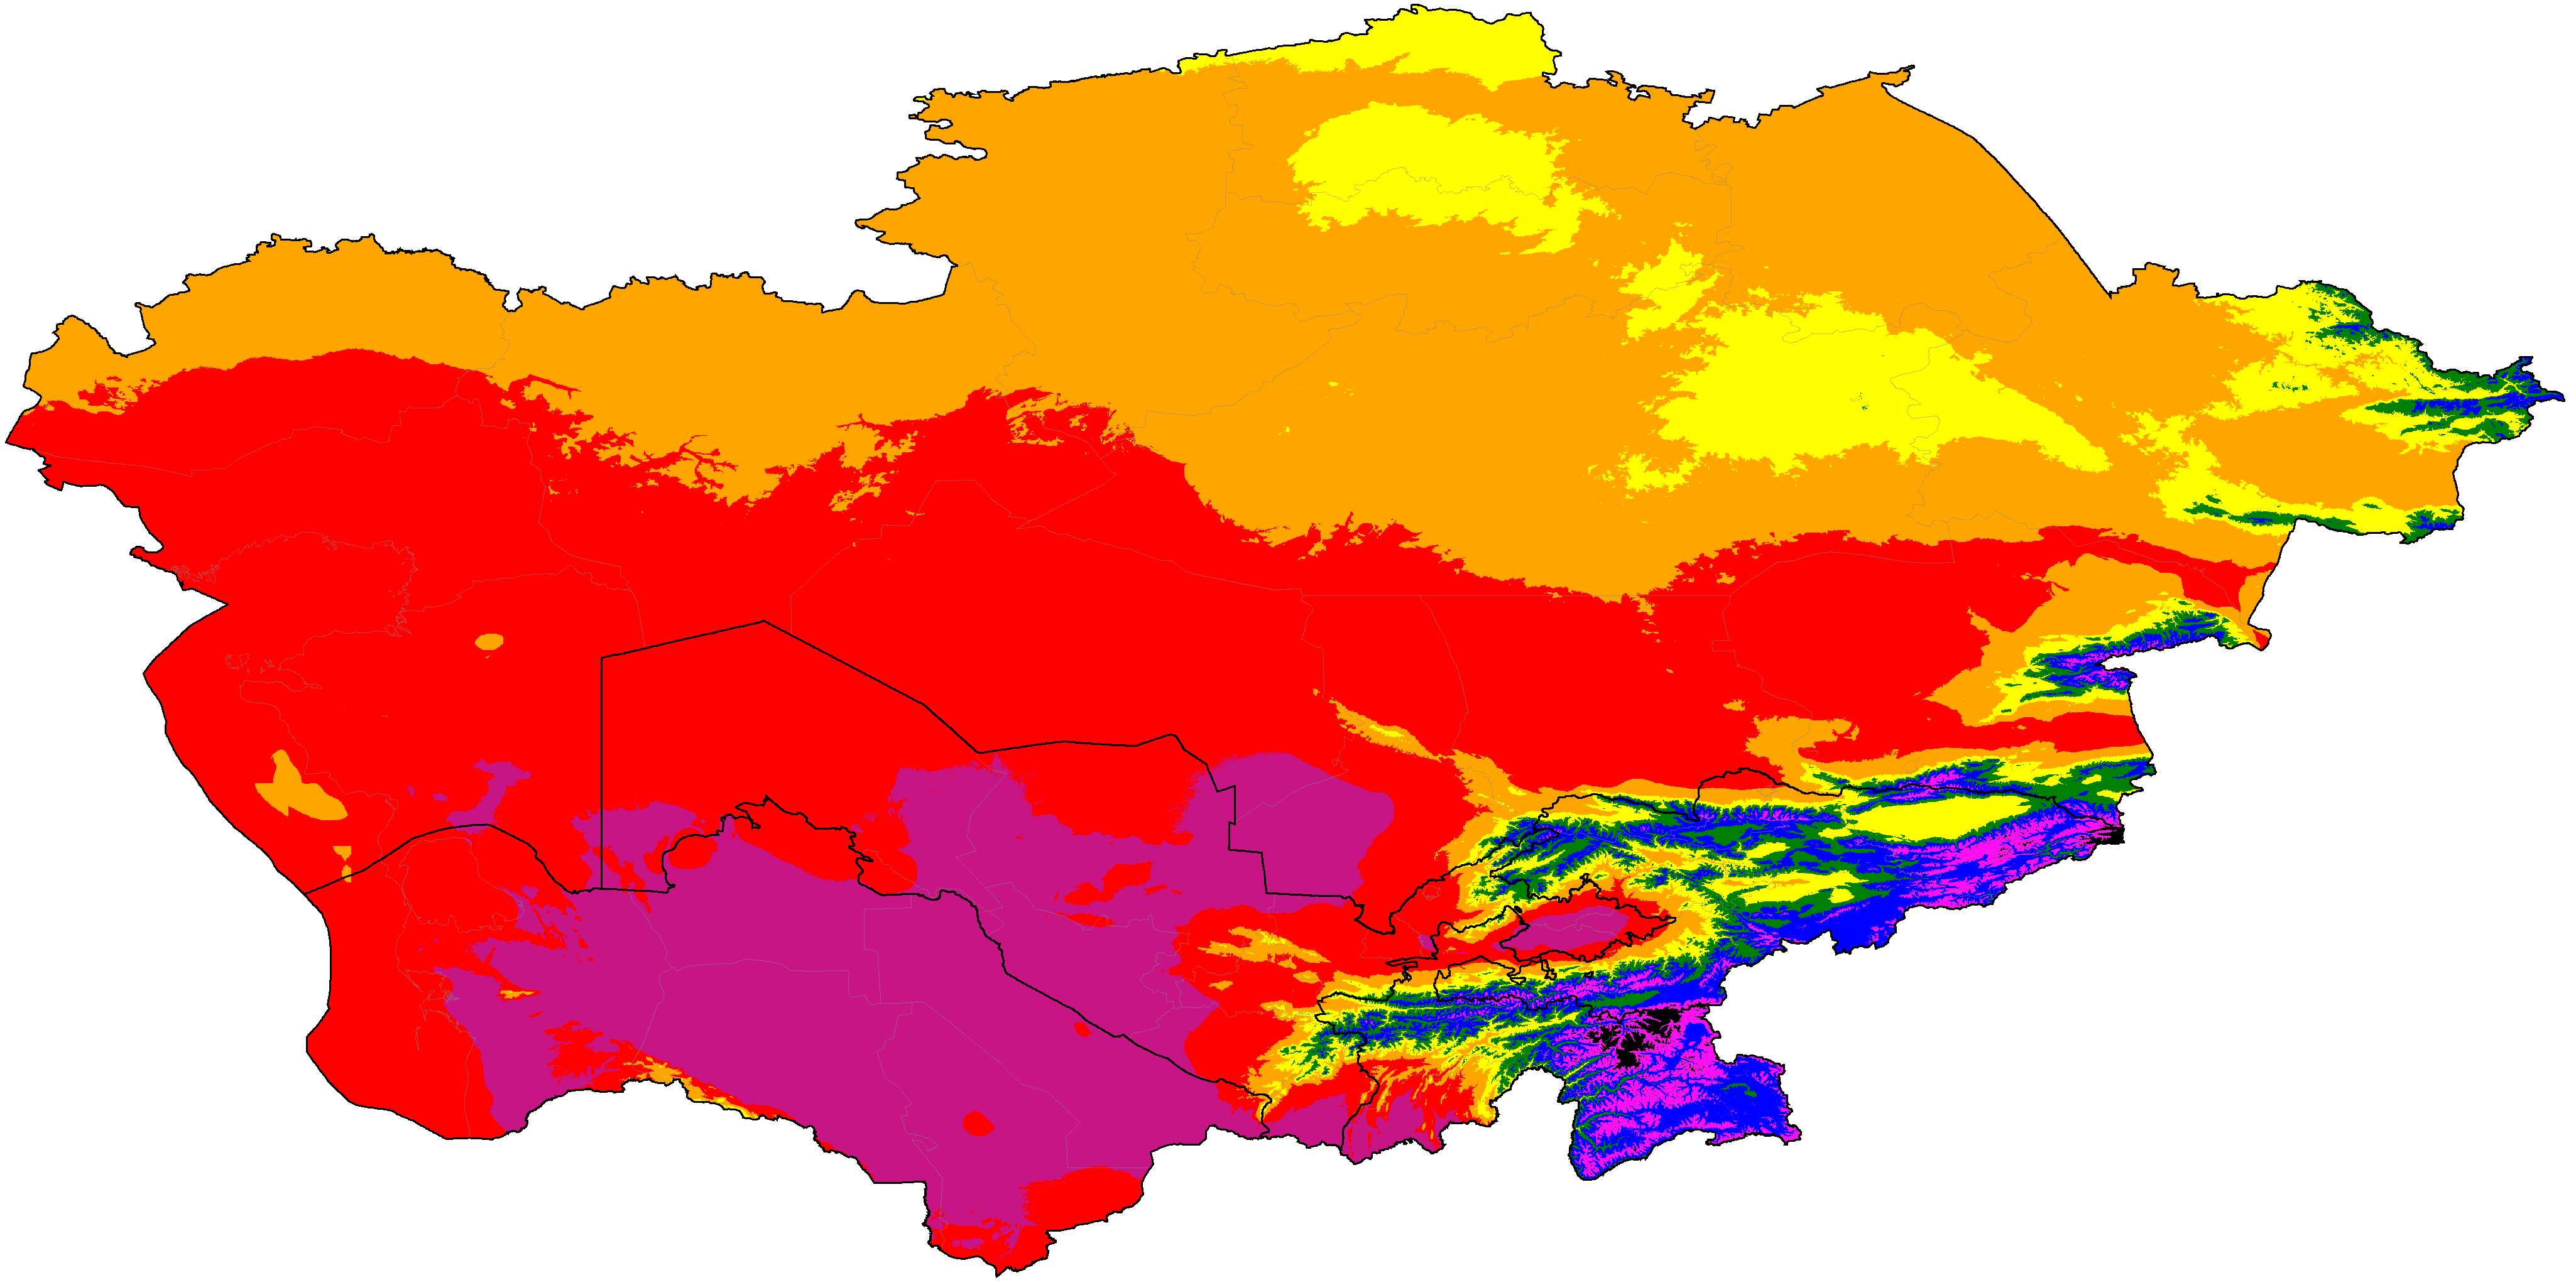
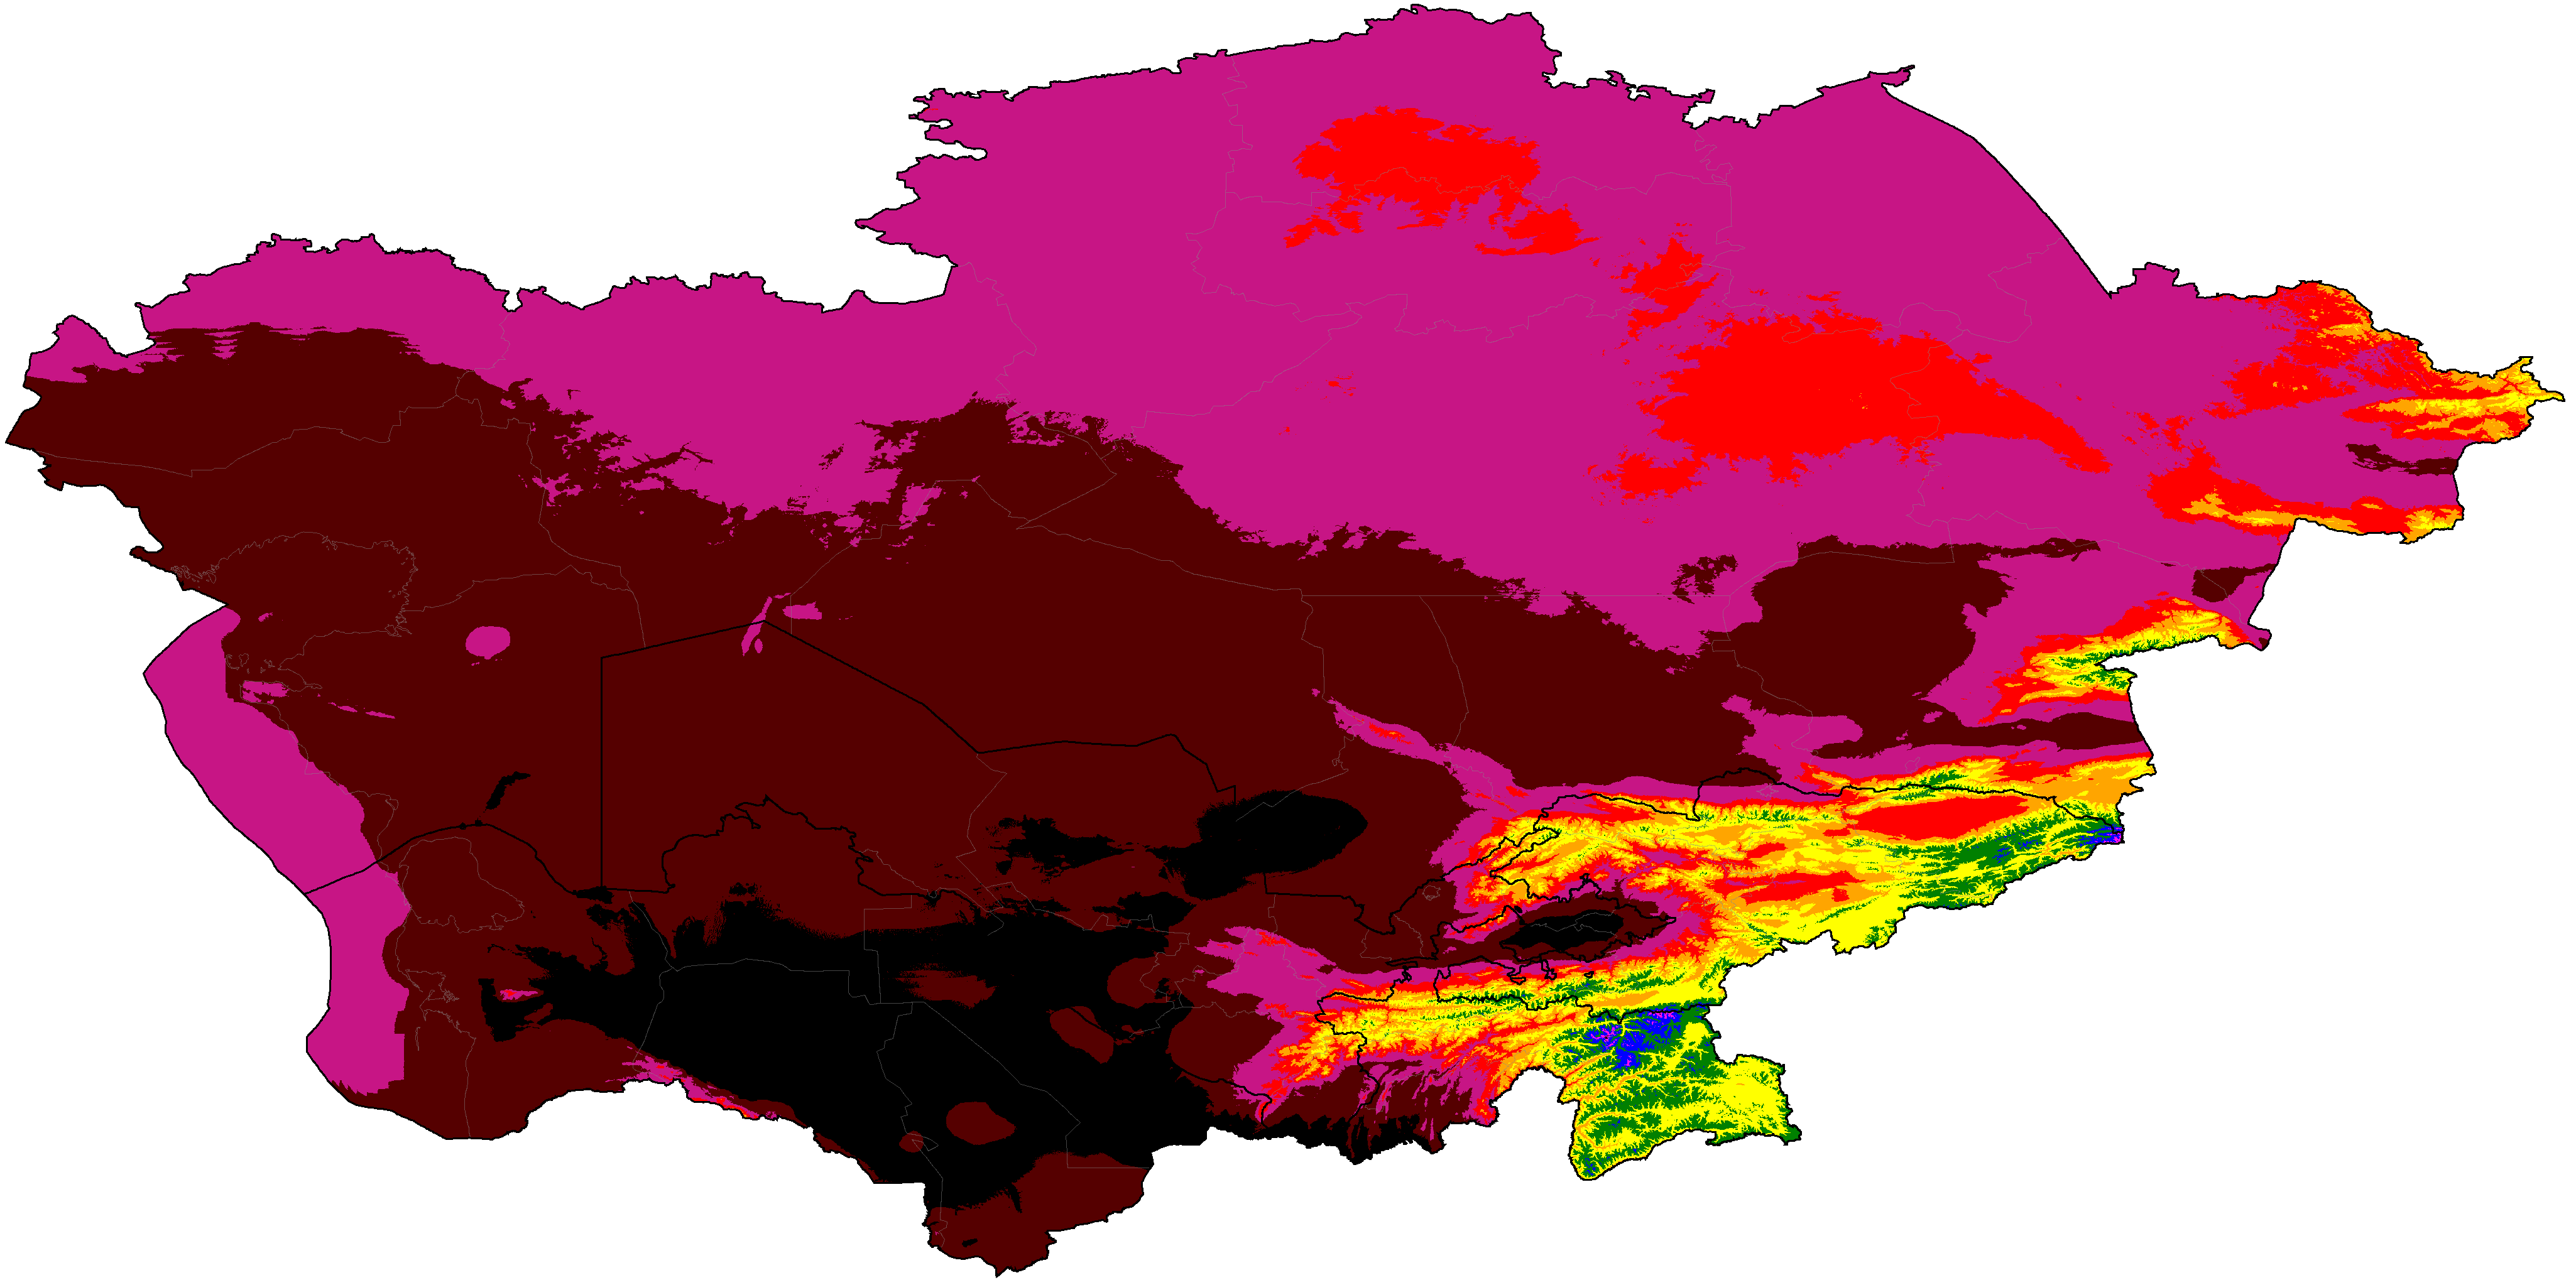
Central Asia distribution of winter categories (projections are SSP5-8.5 high emissions normals)
Note: Due to the complexity of the system, only the most common climates in each map are labeled.
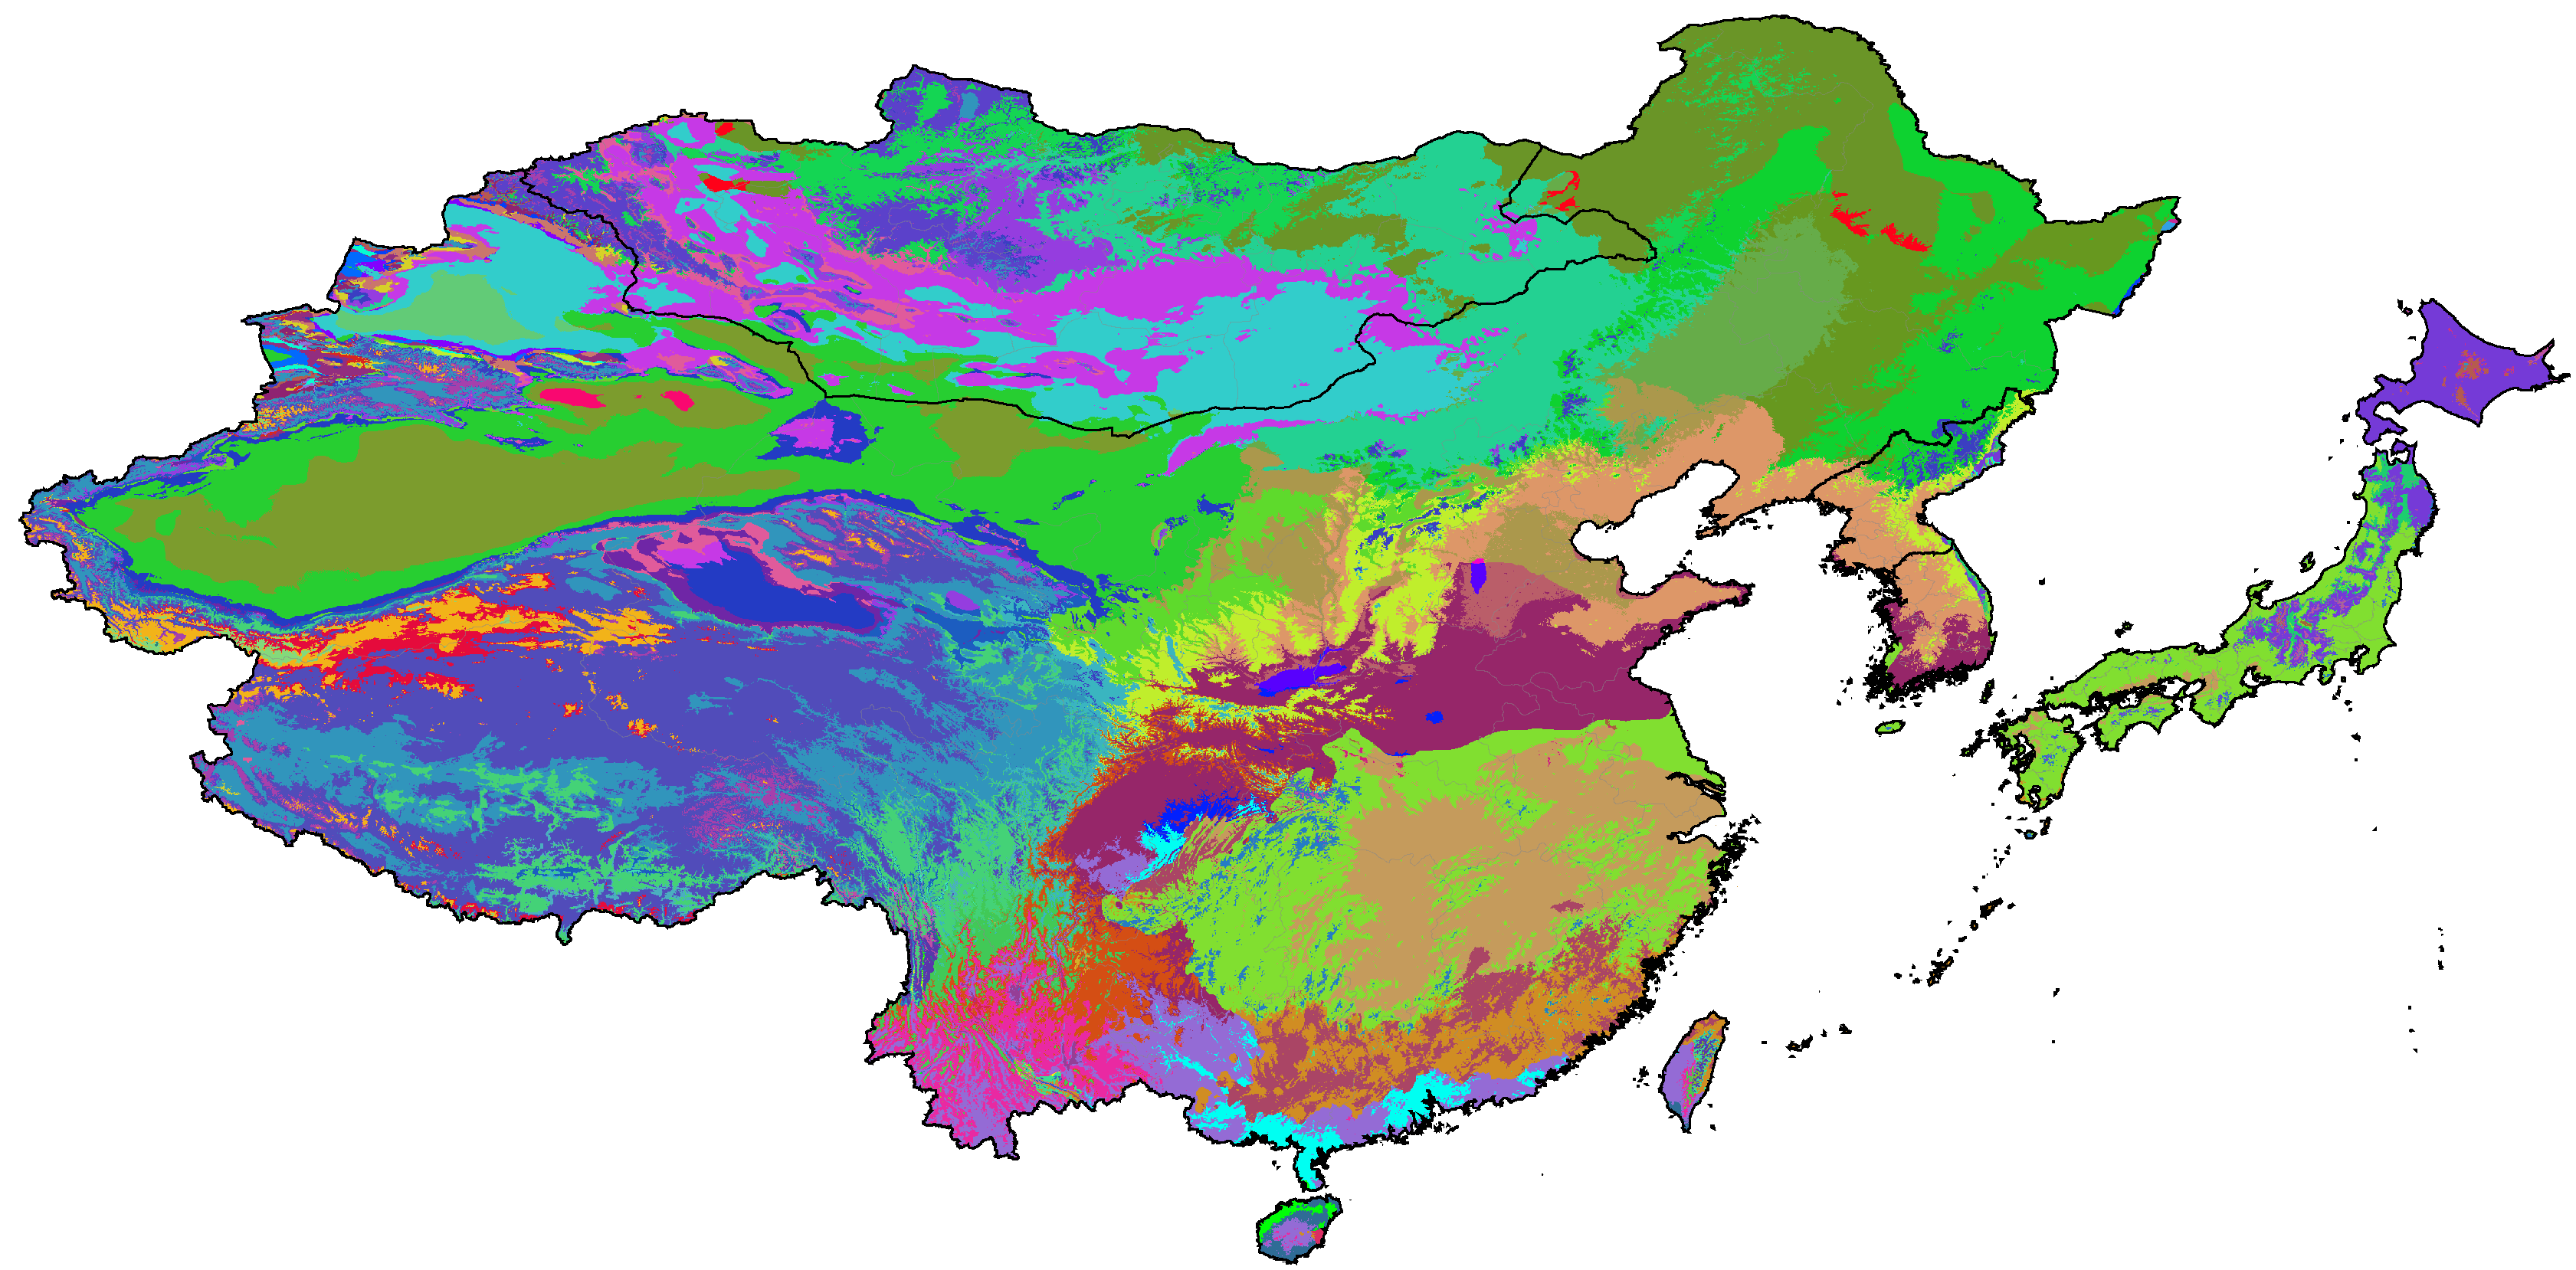
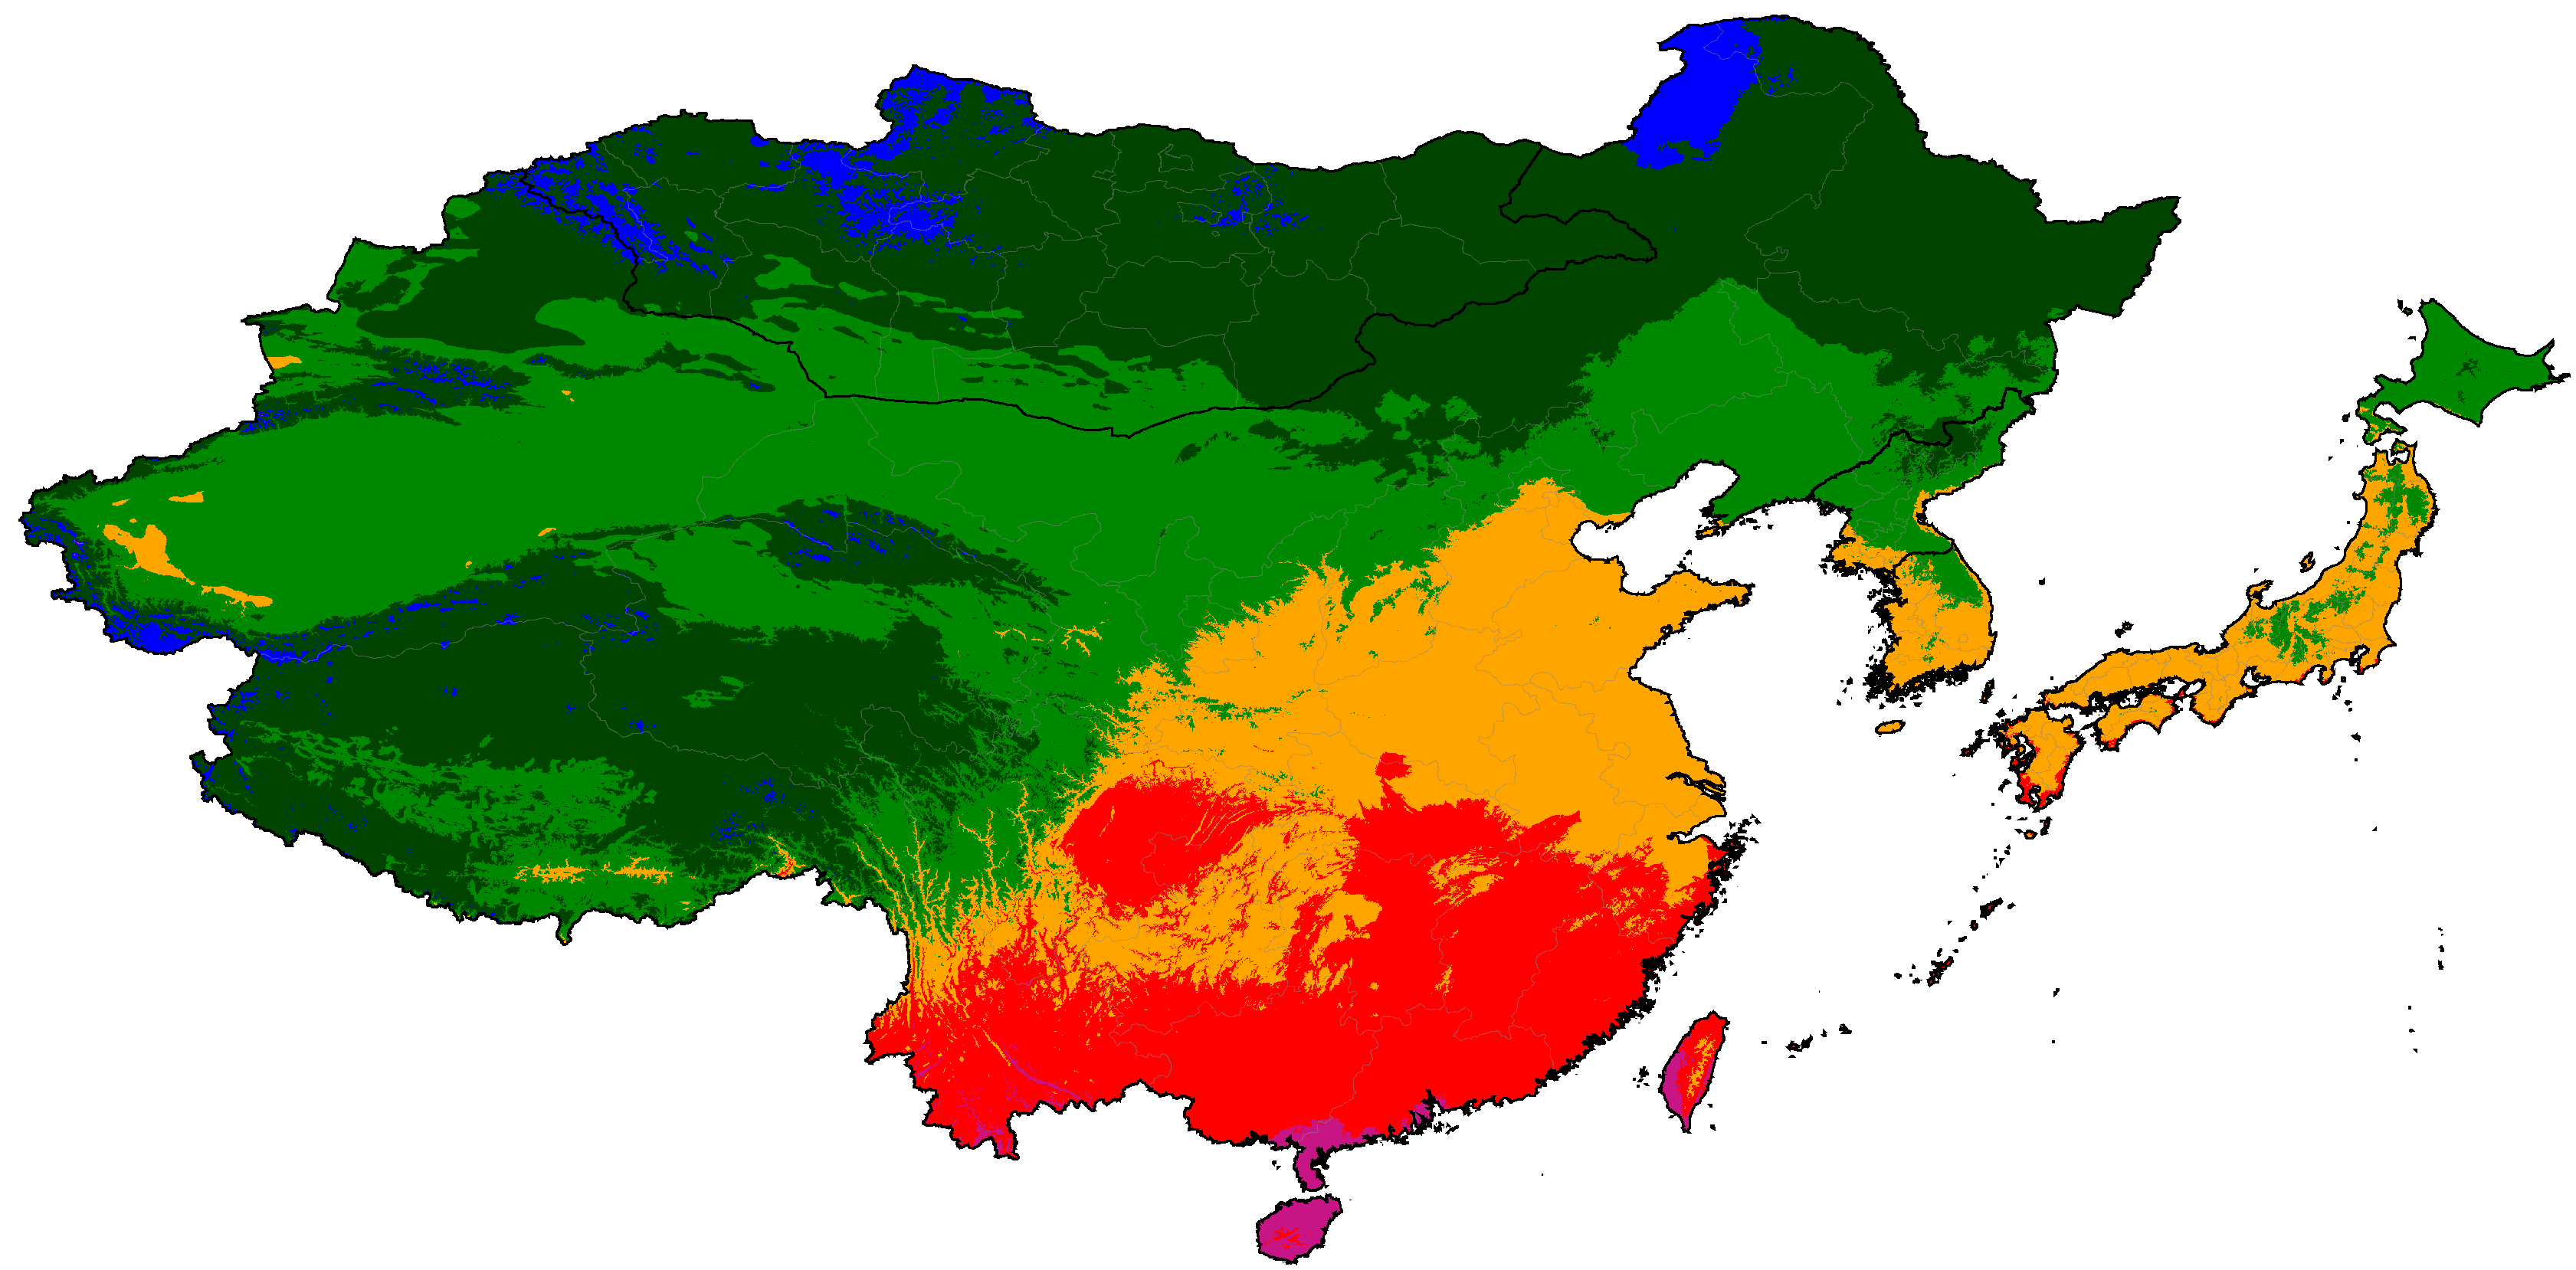
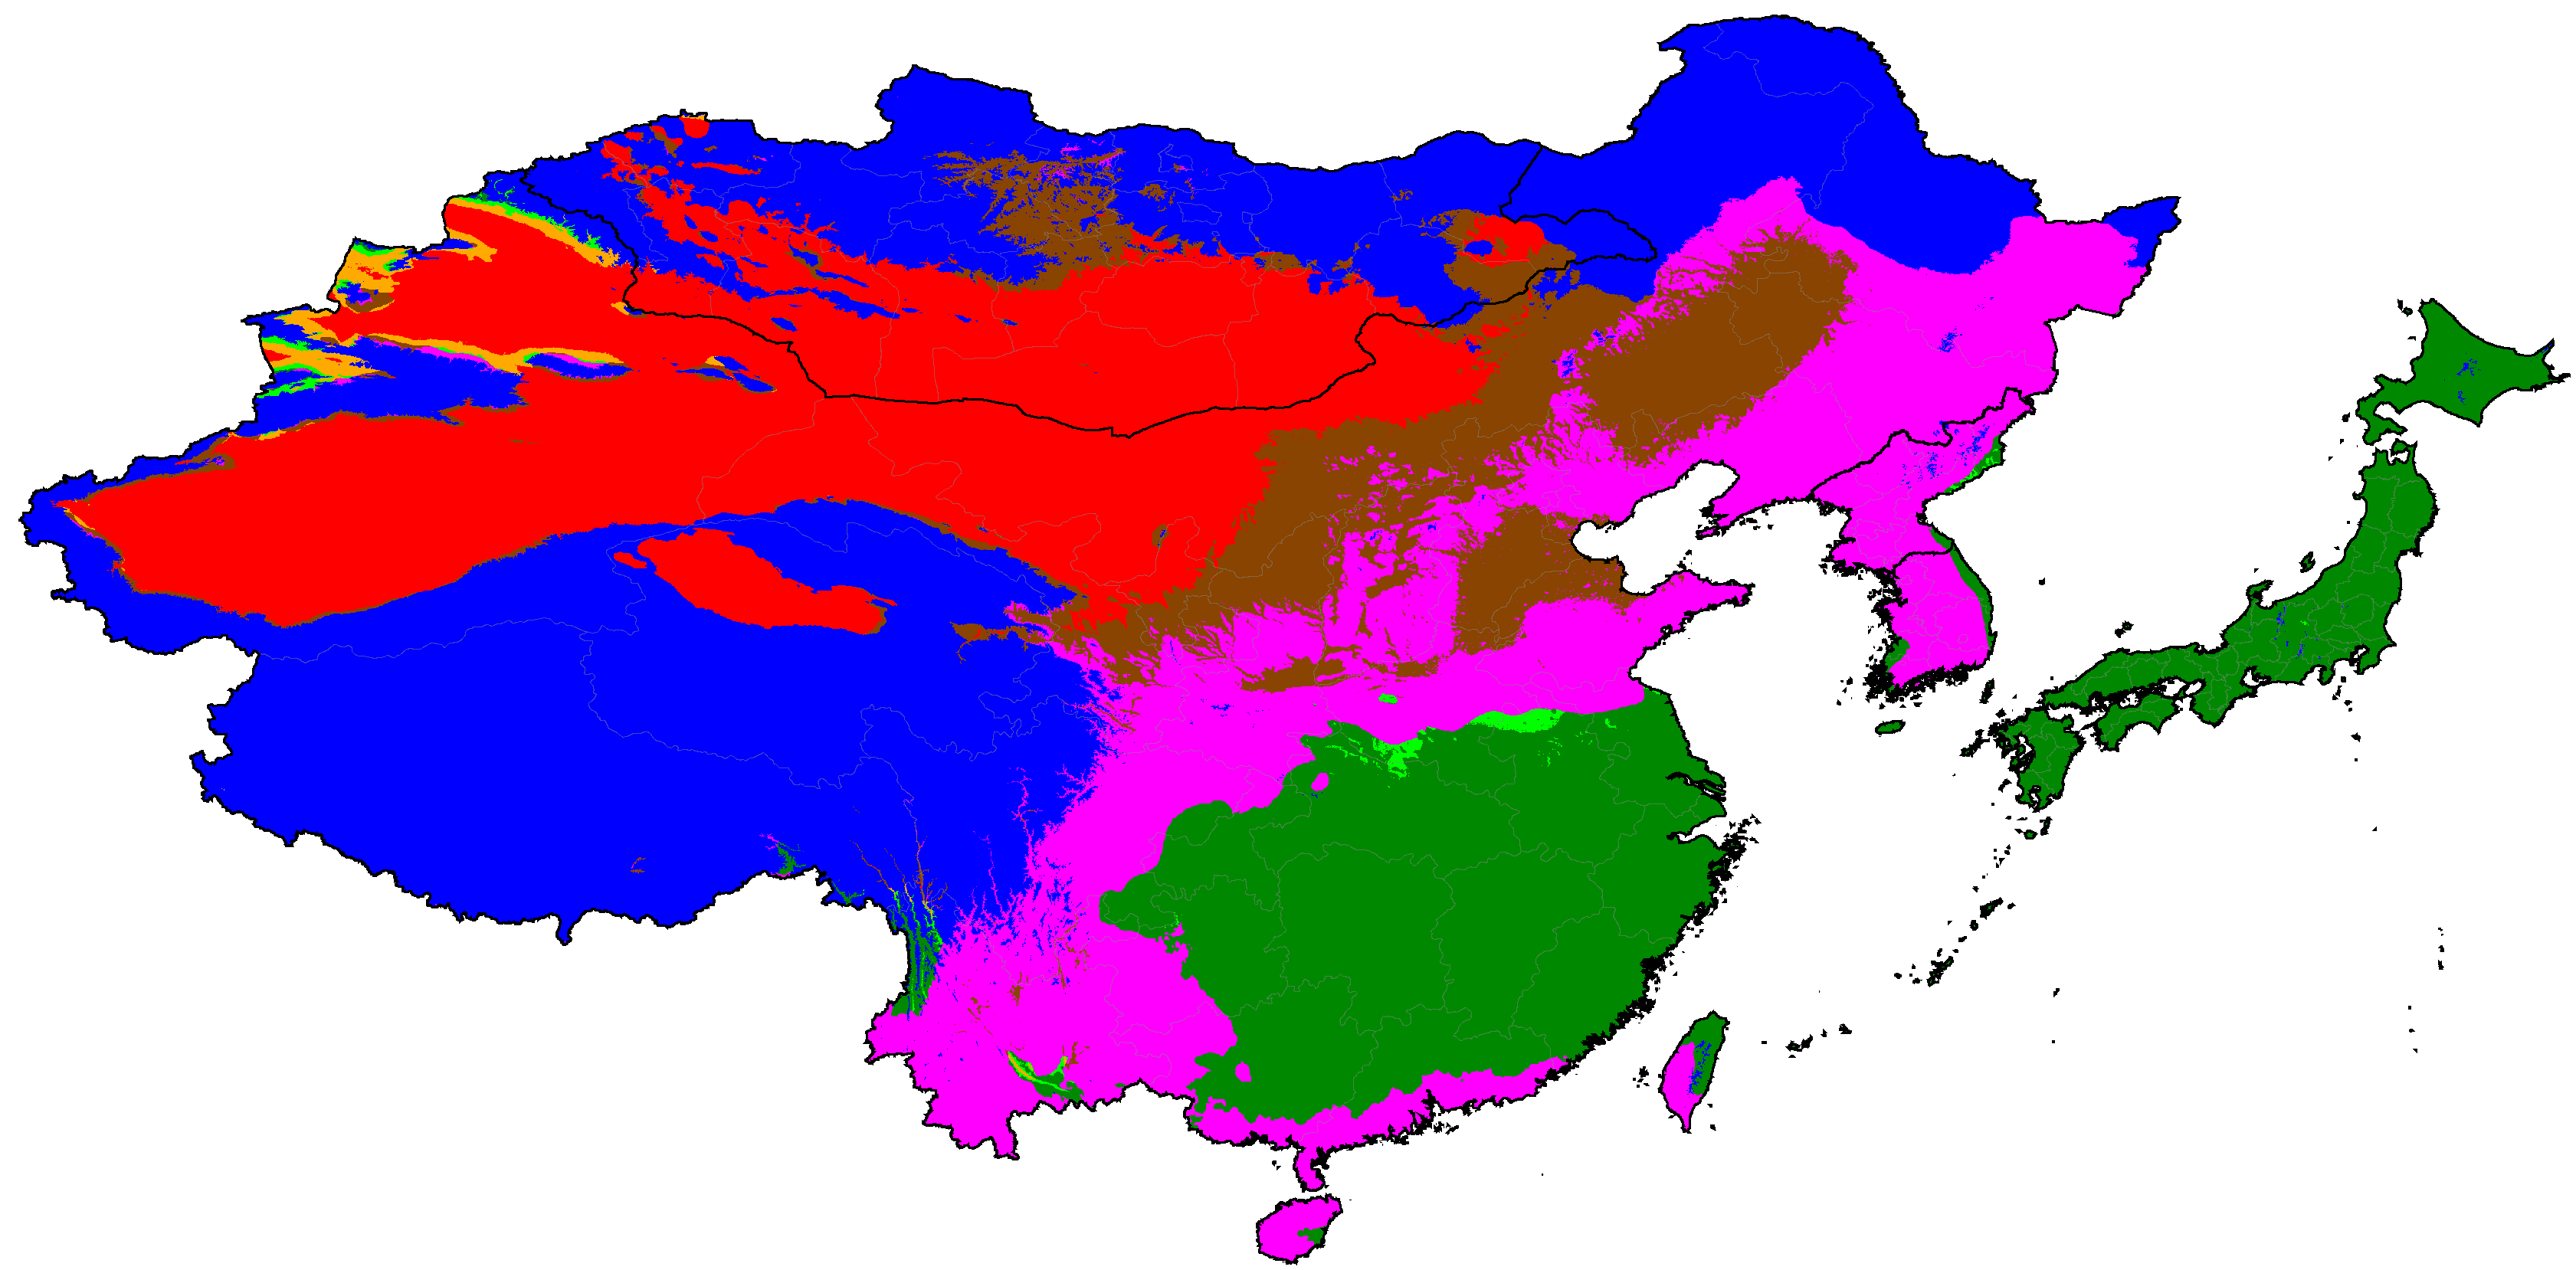
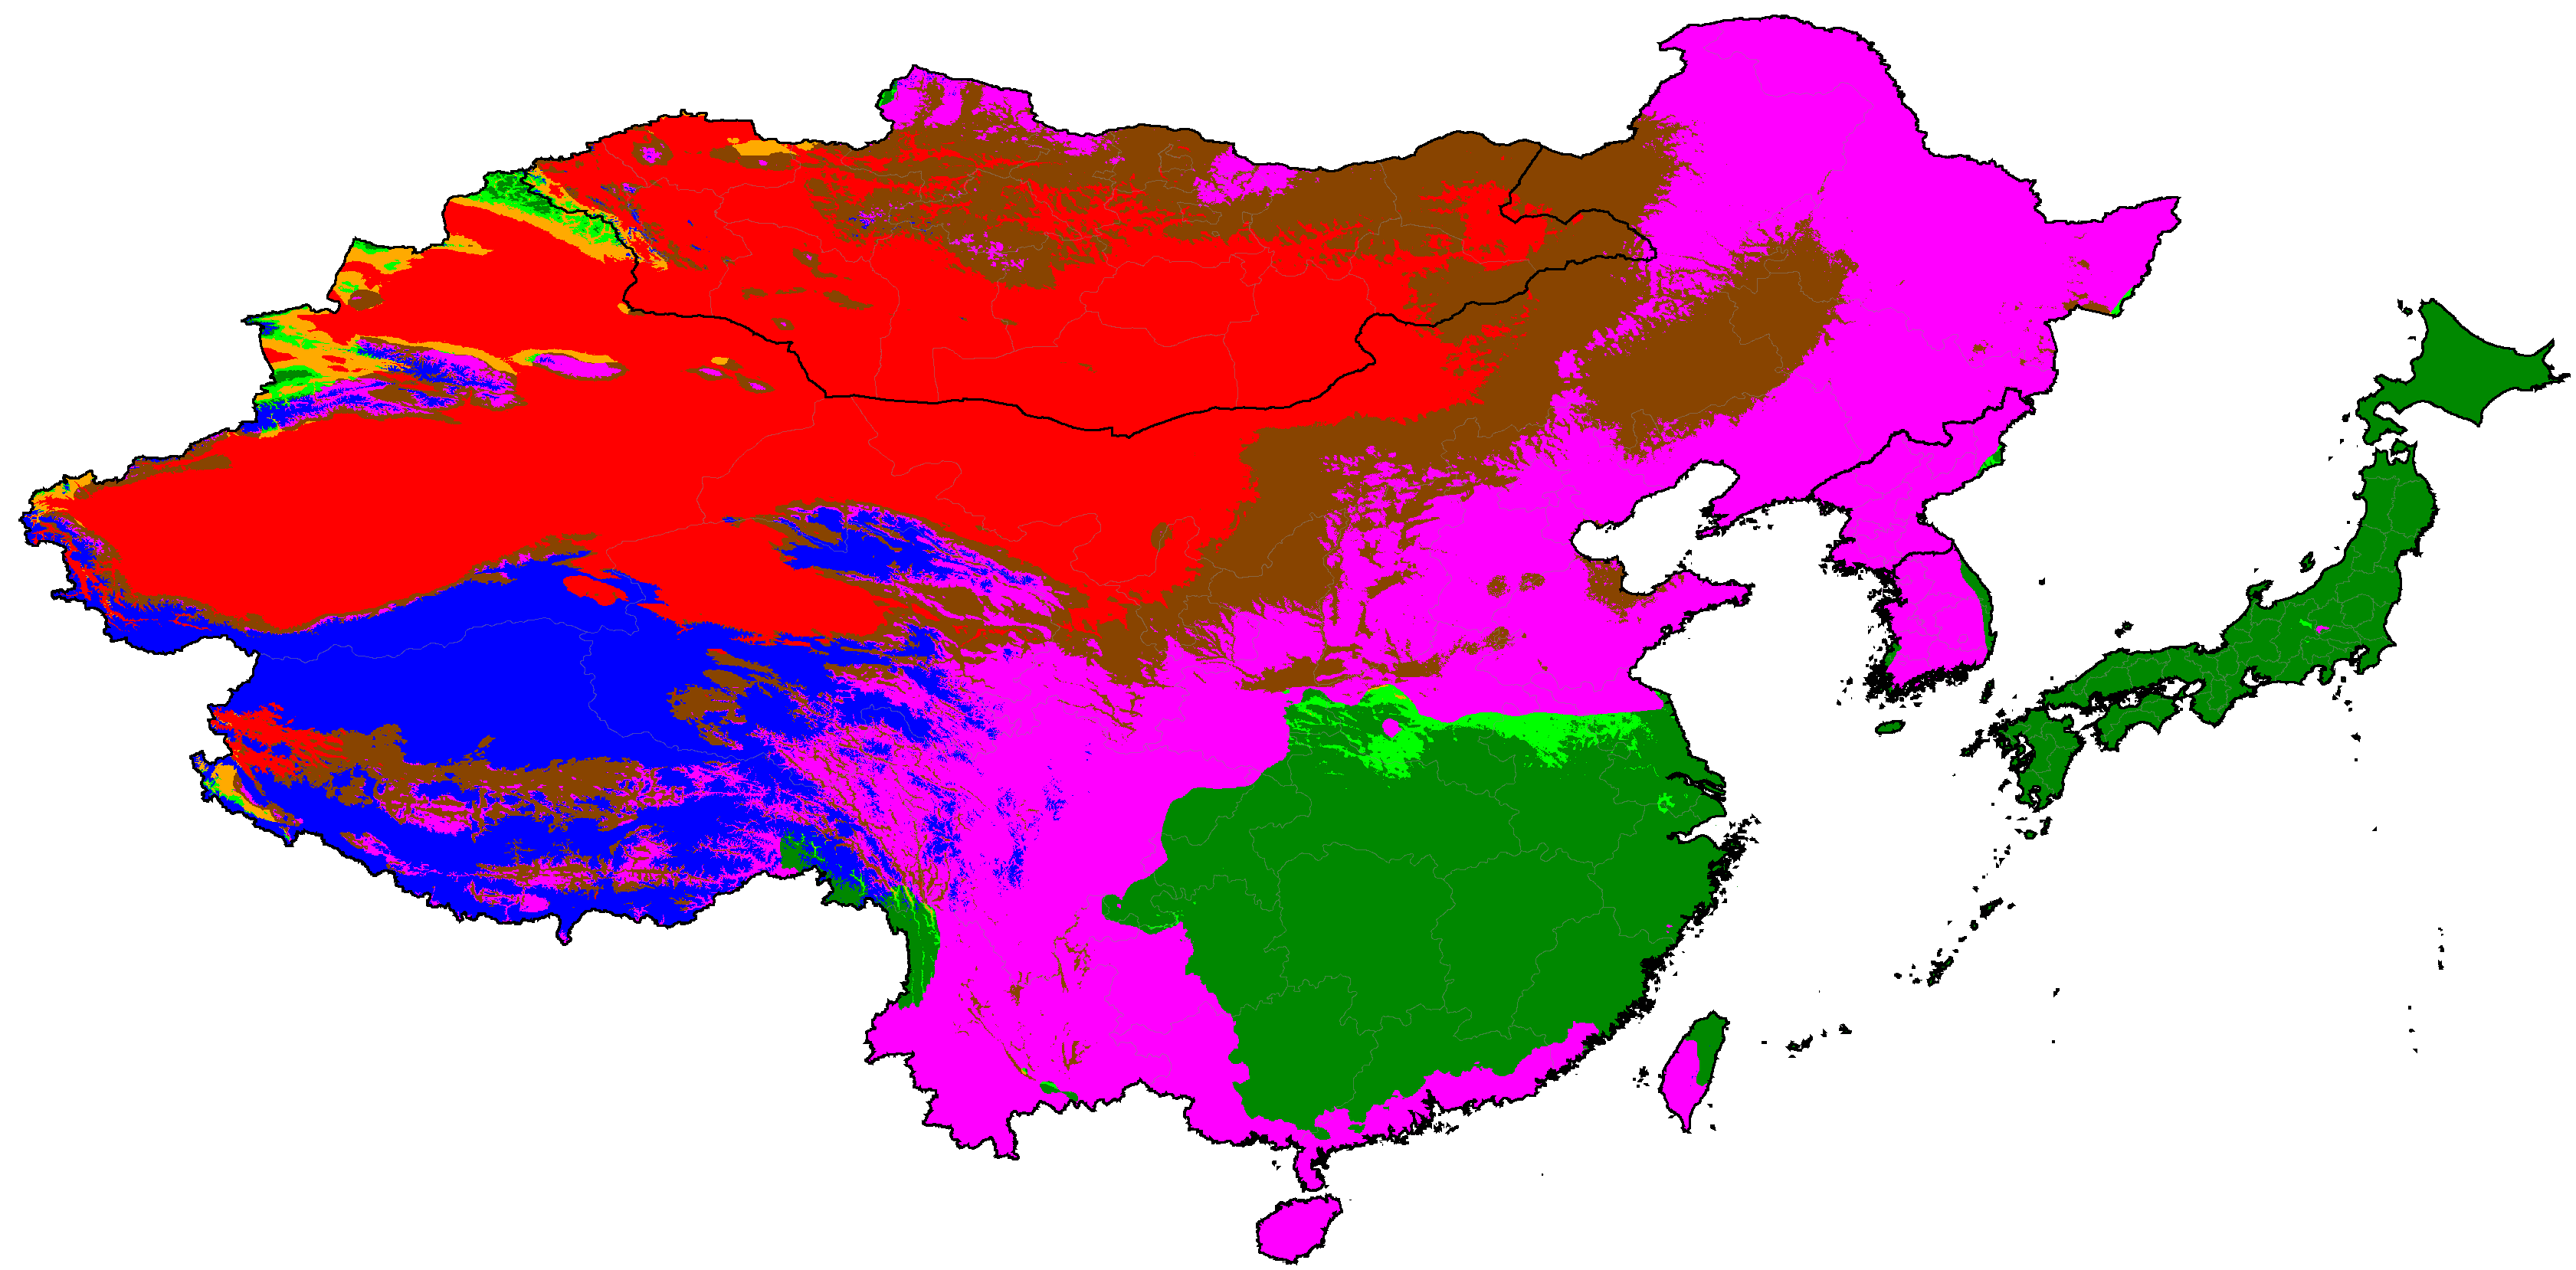
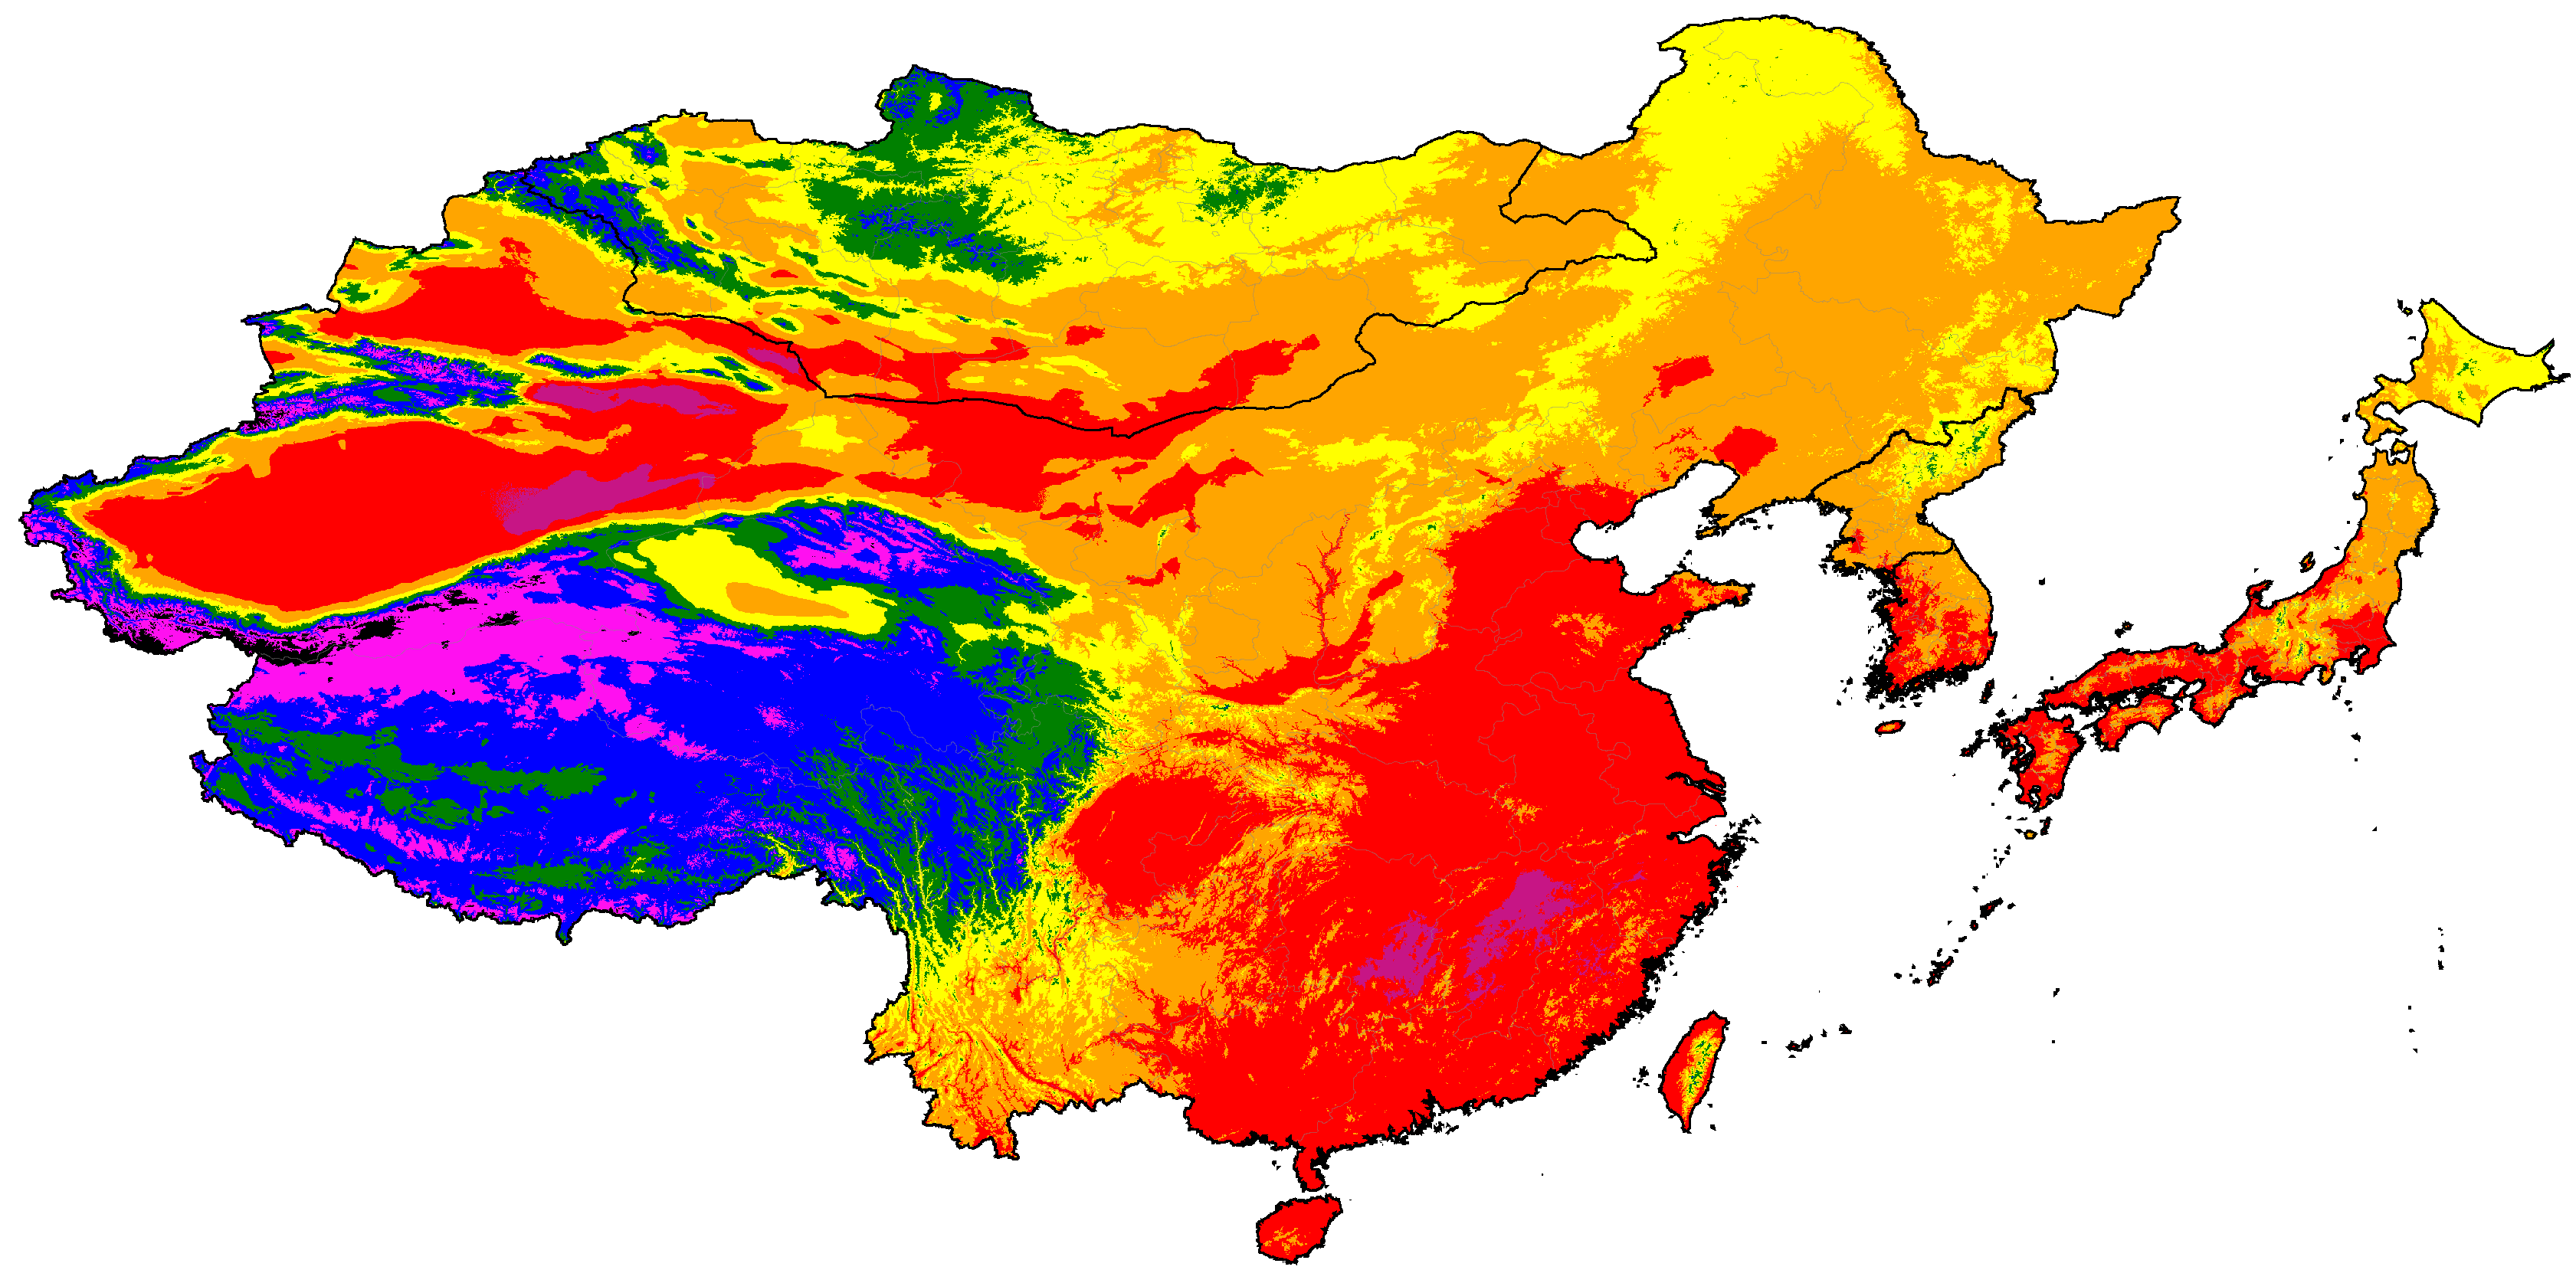
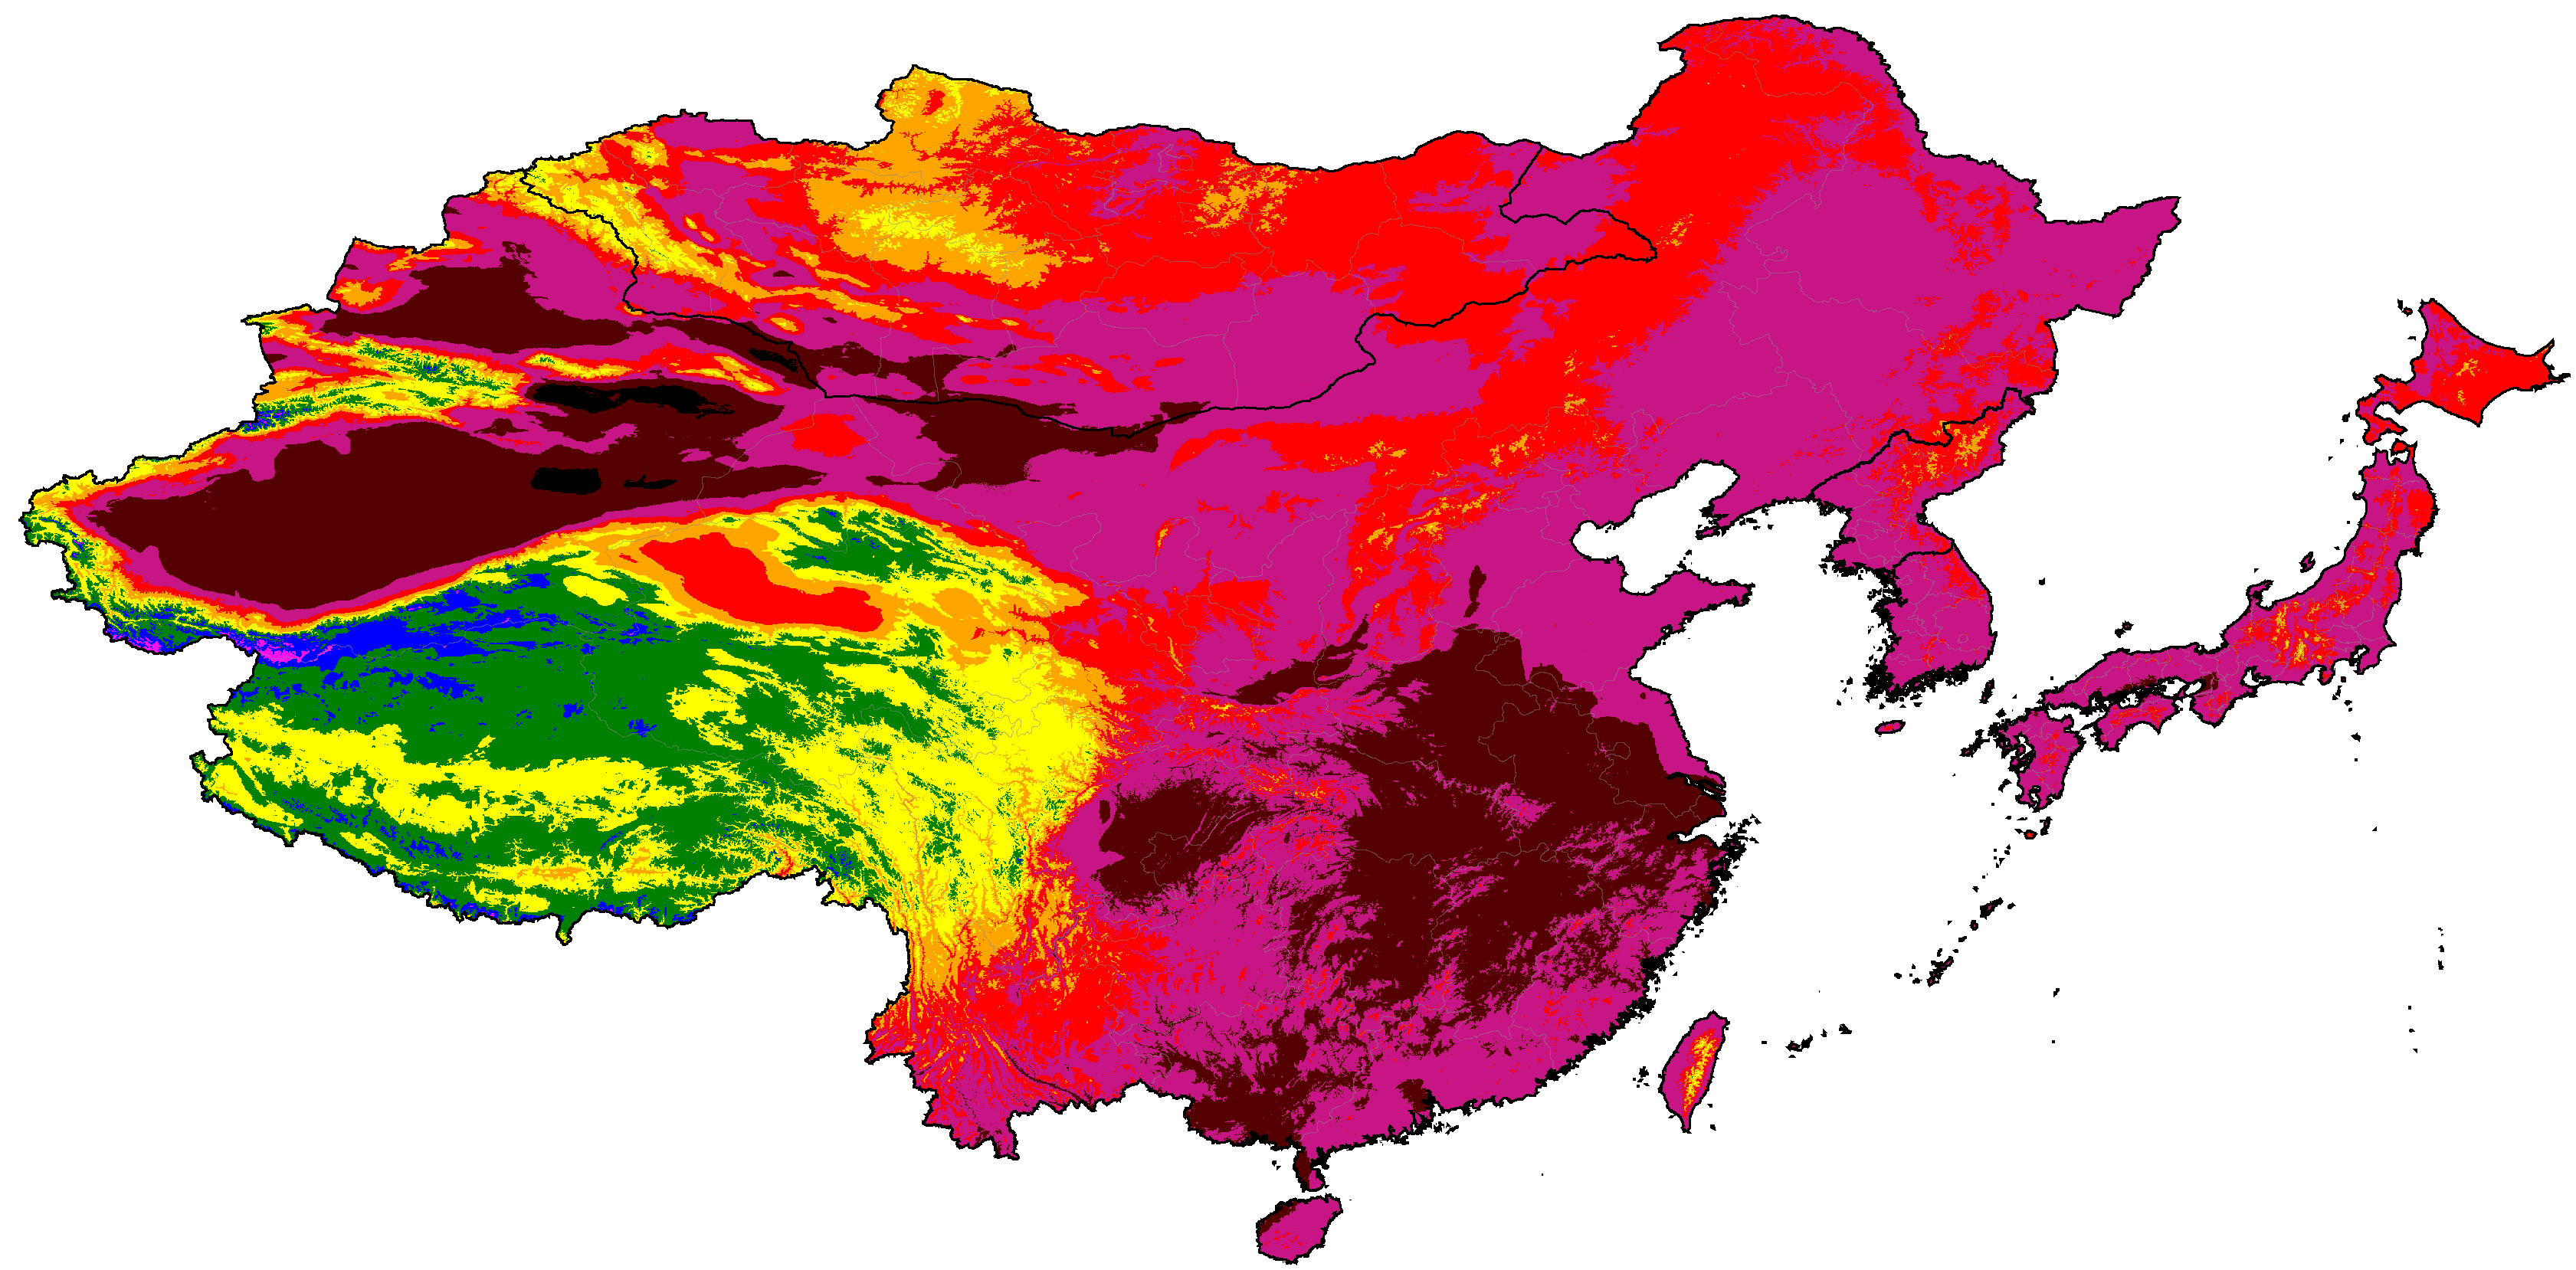
East Asia distribution of winter categories (projections are SSP5-8.5 high emissions normals)
Note: Due to the complexity of the system, only the most common climates in each map are labeled.
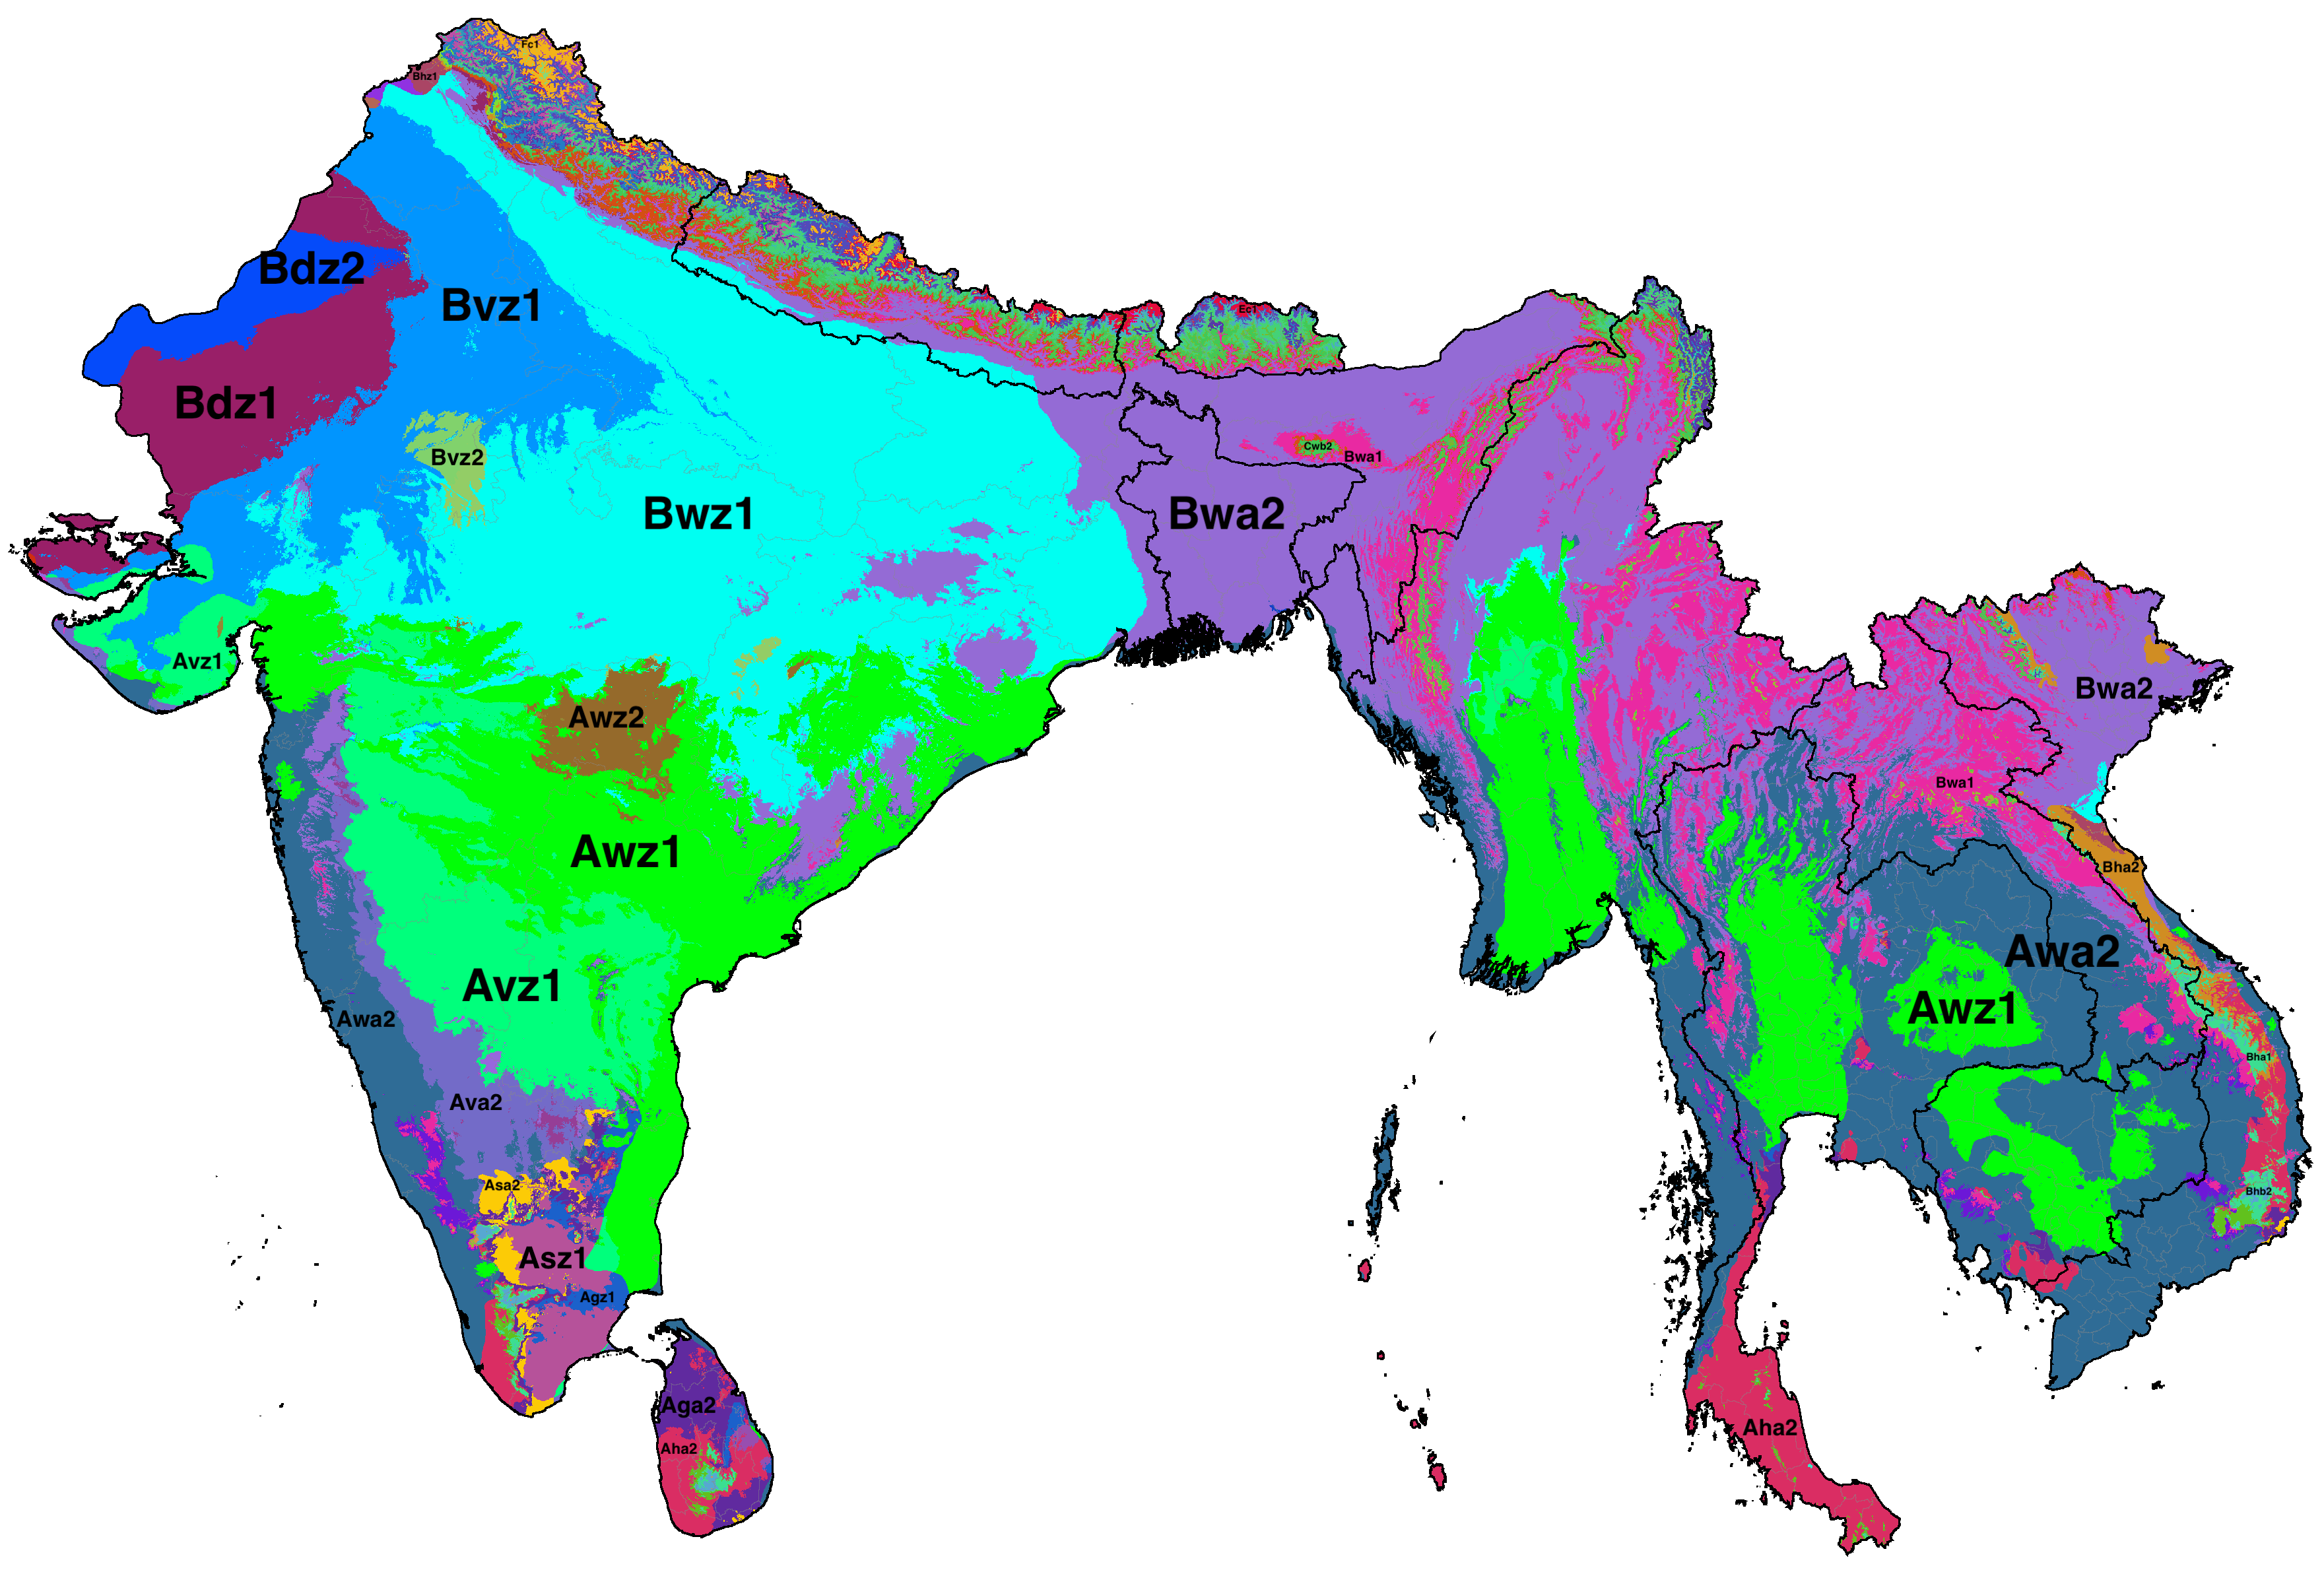
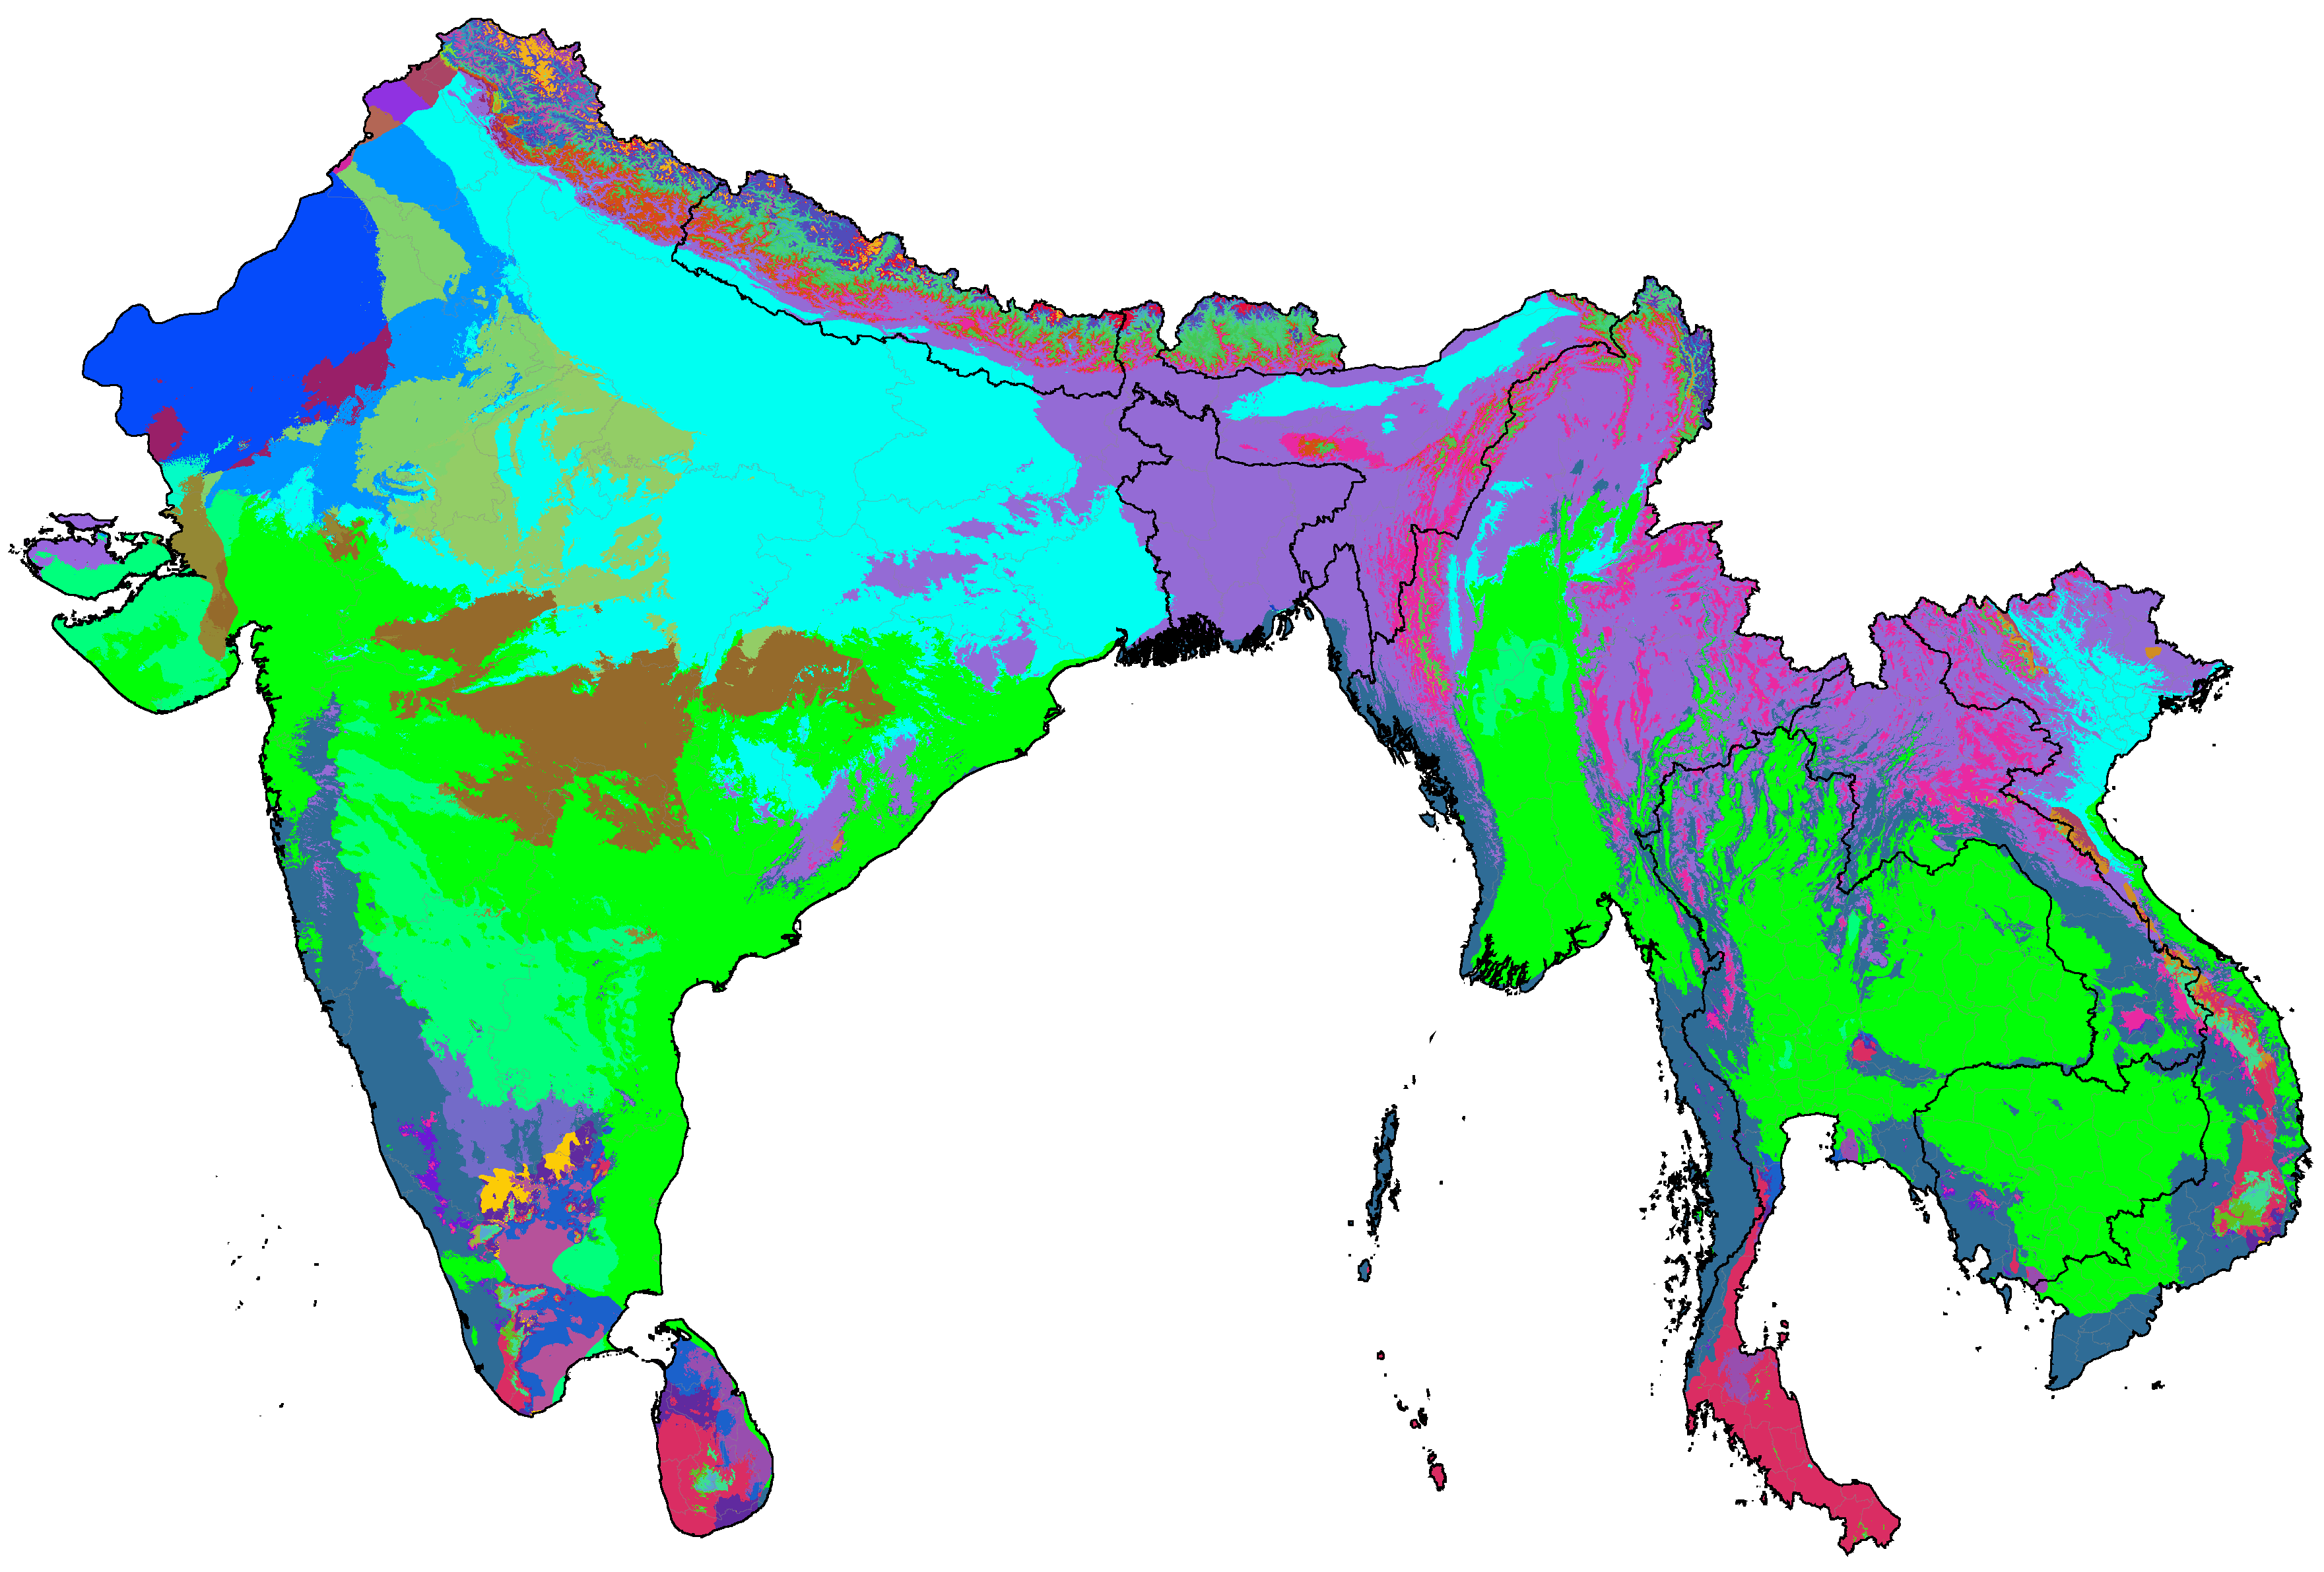
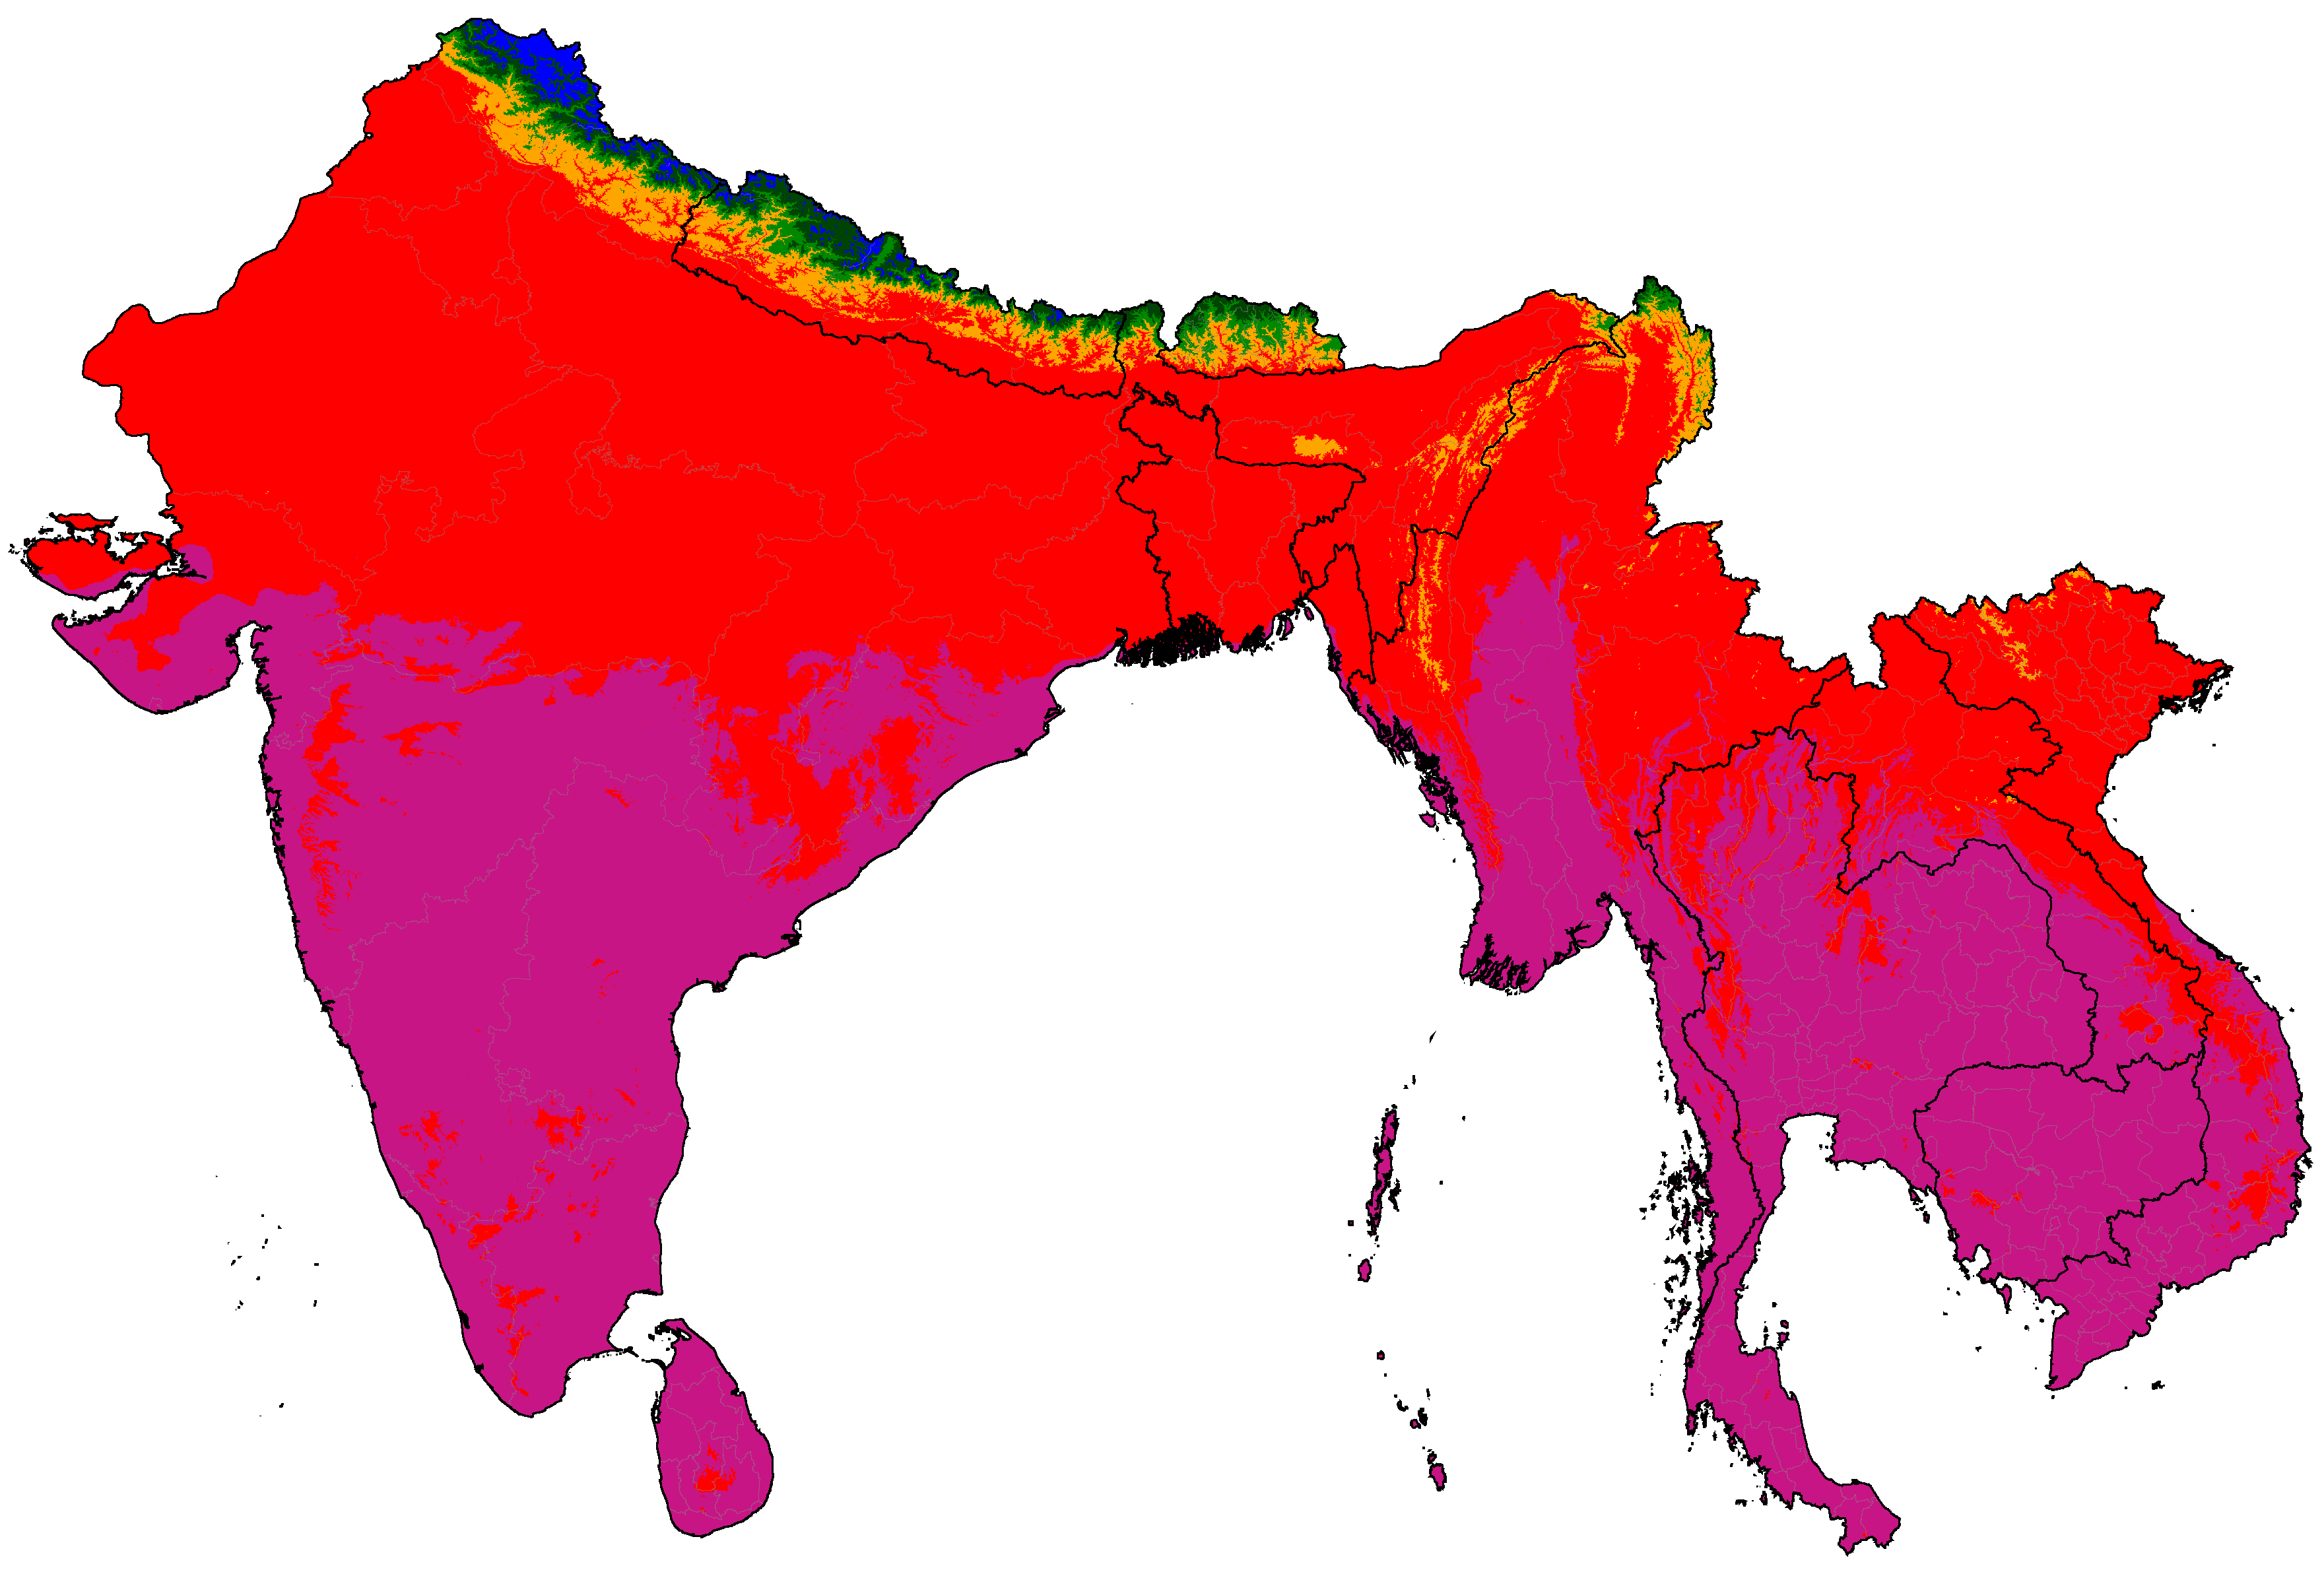
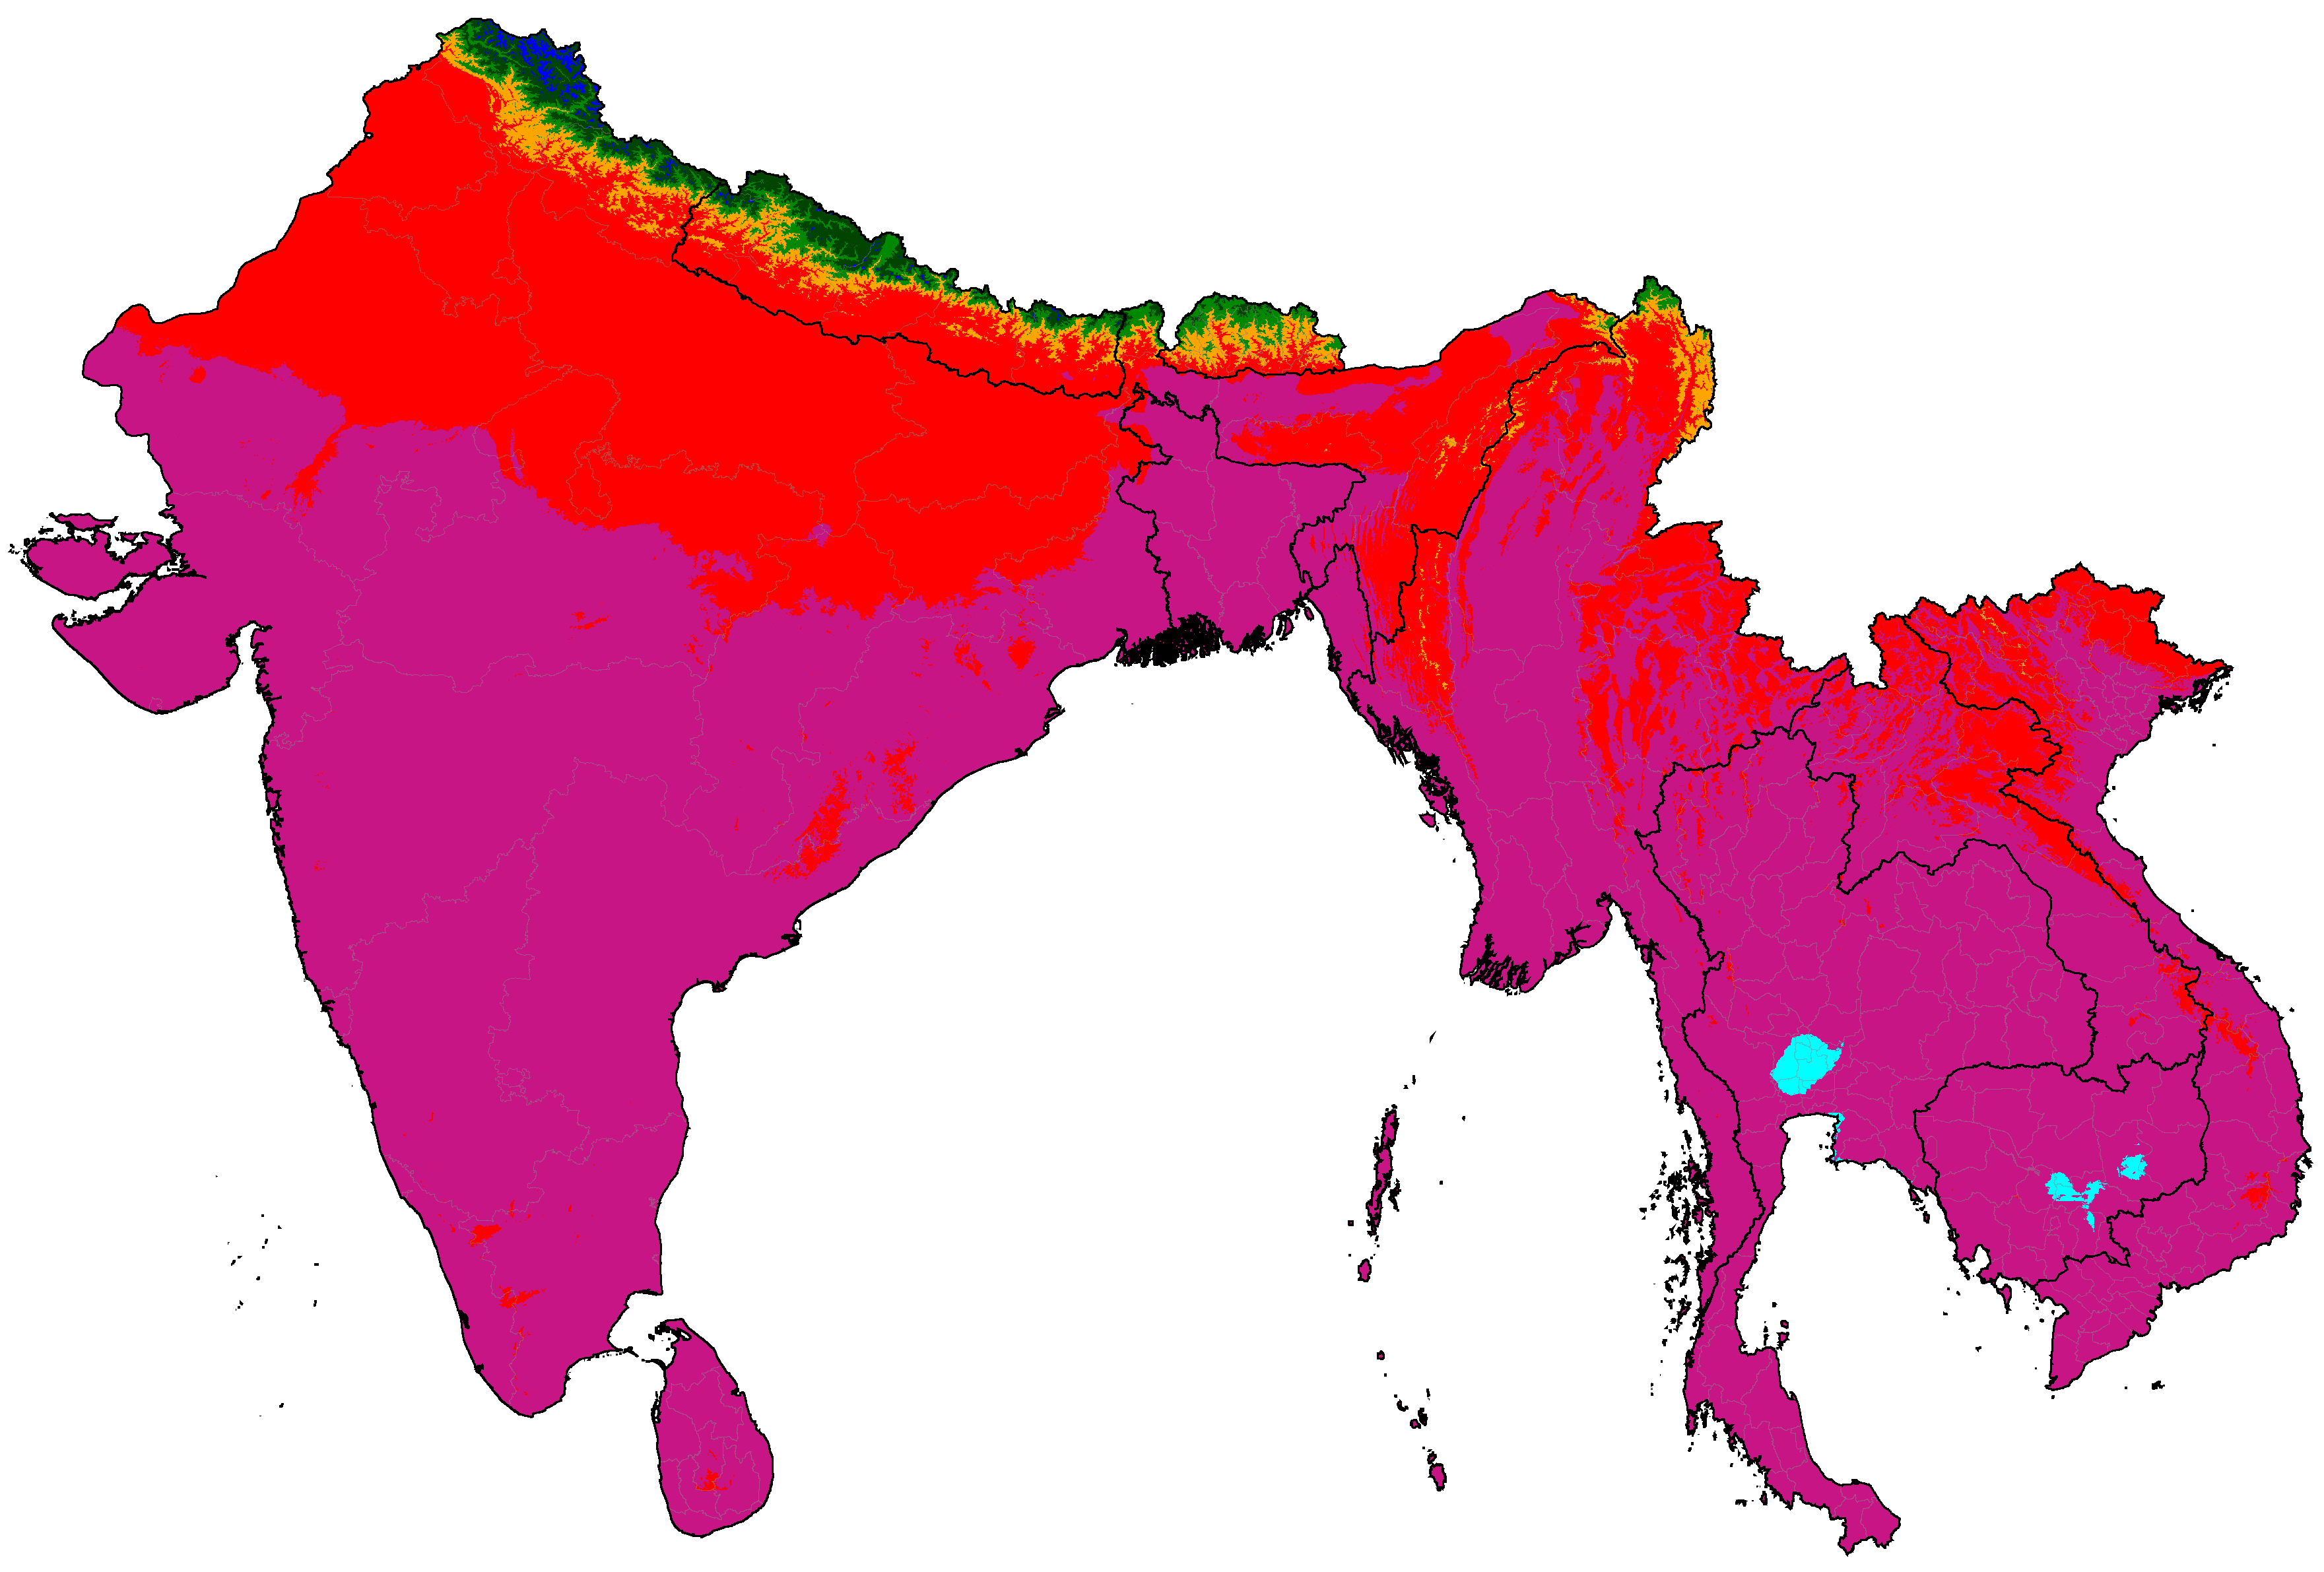
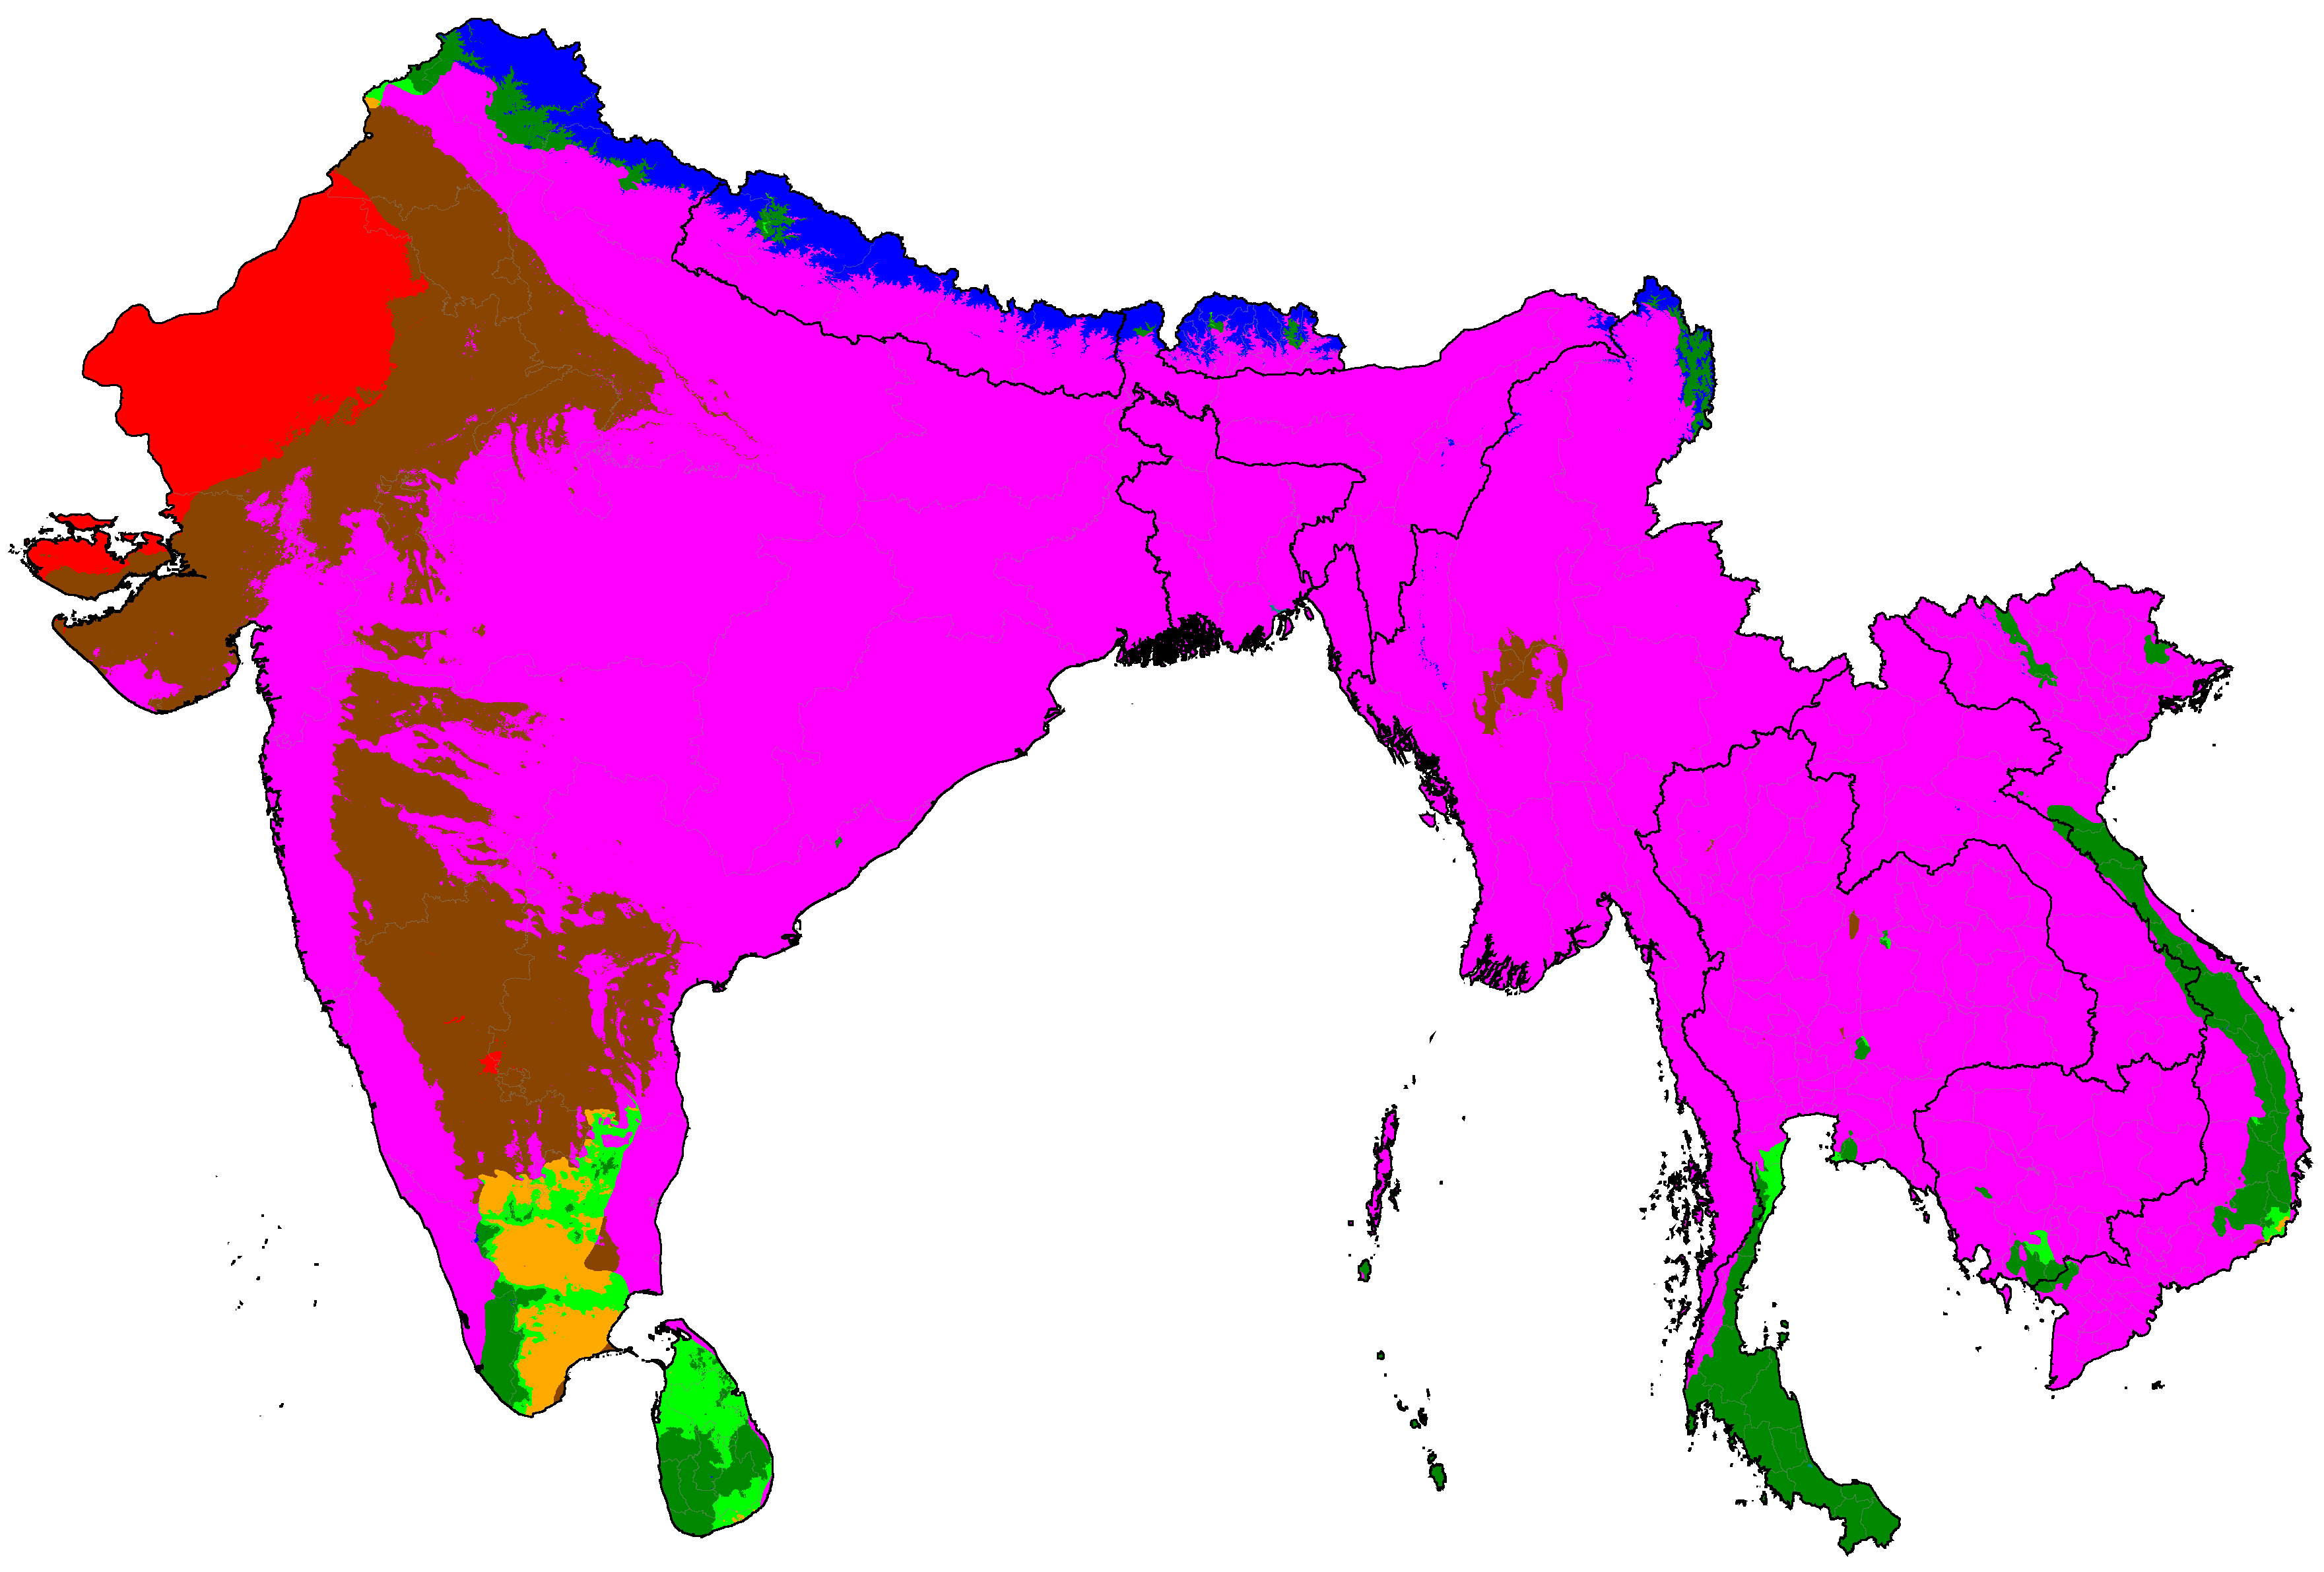
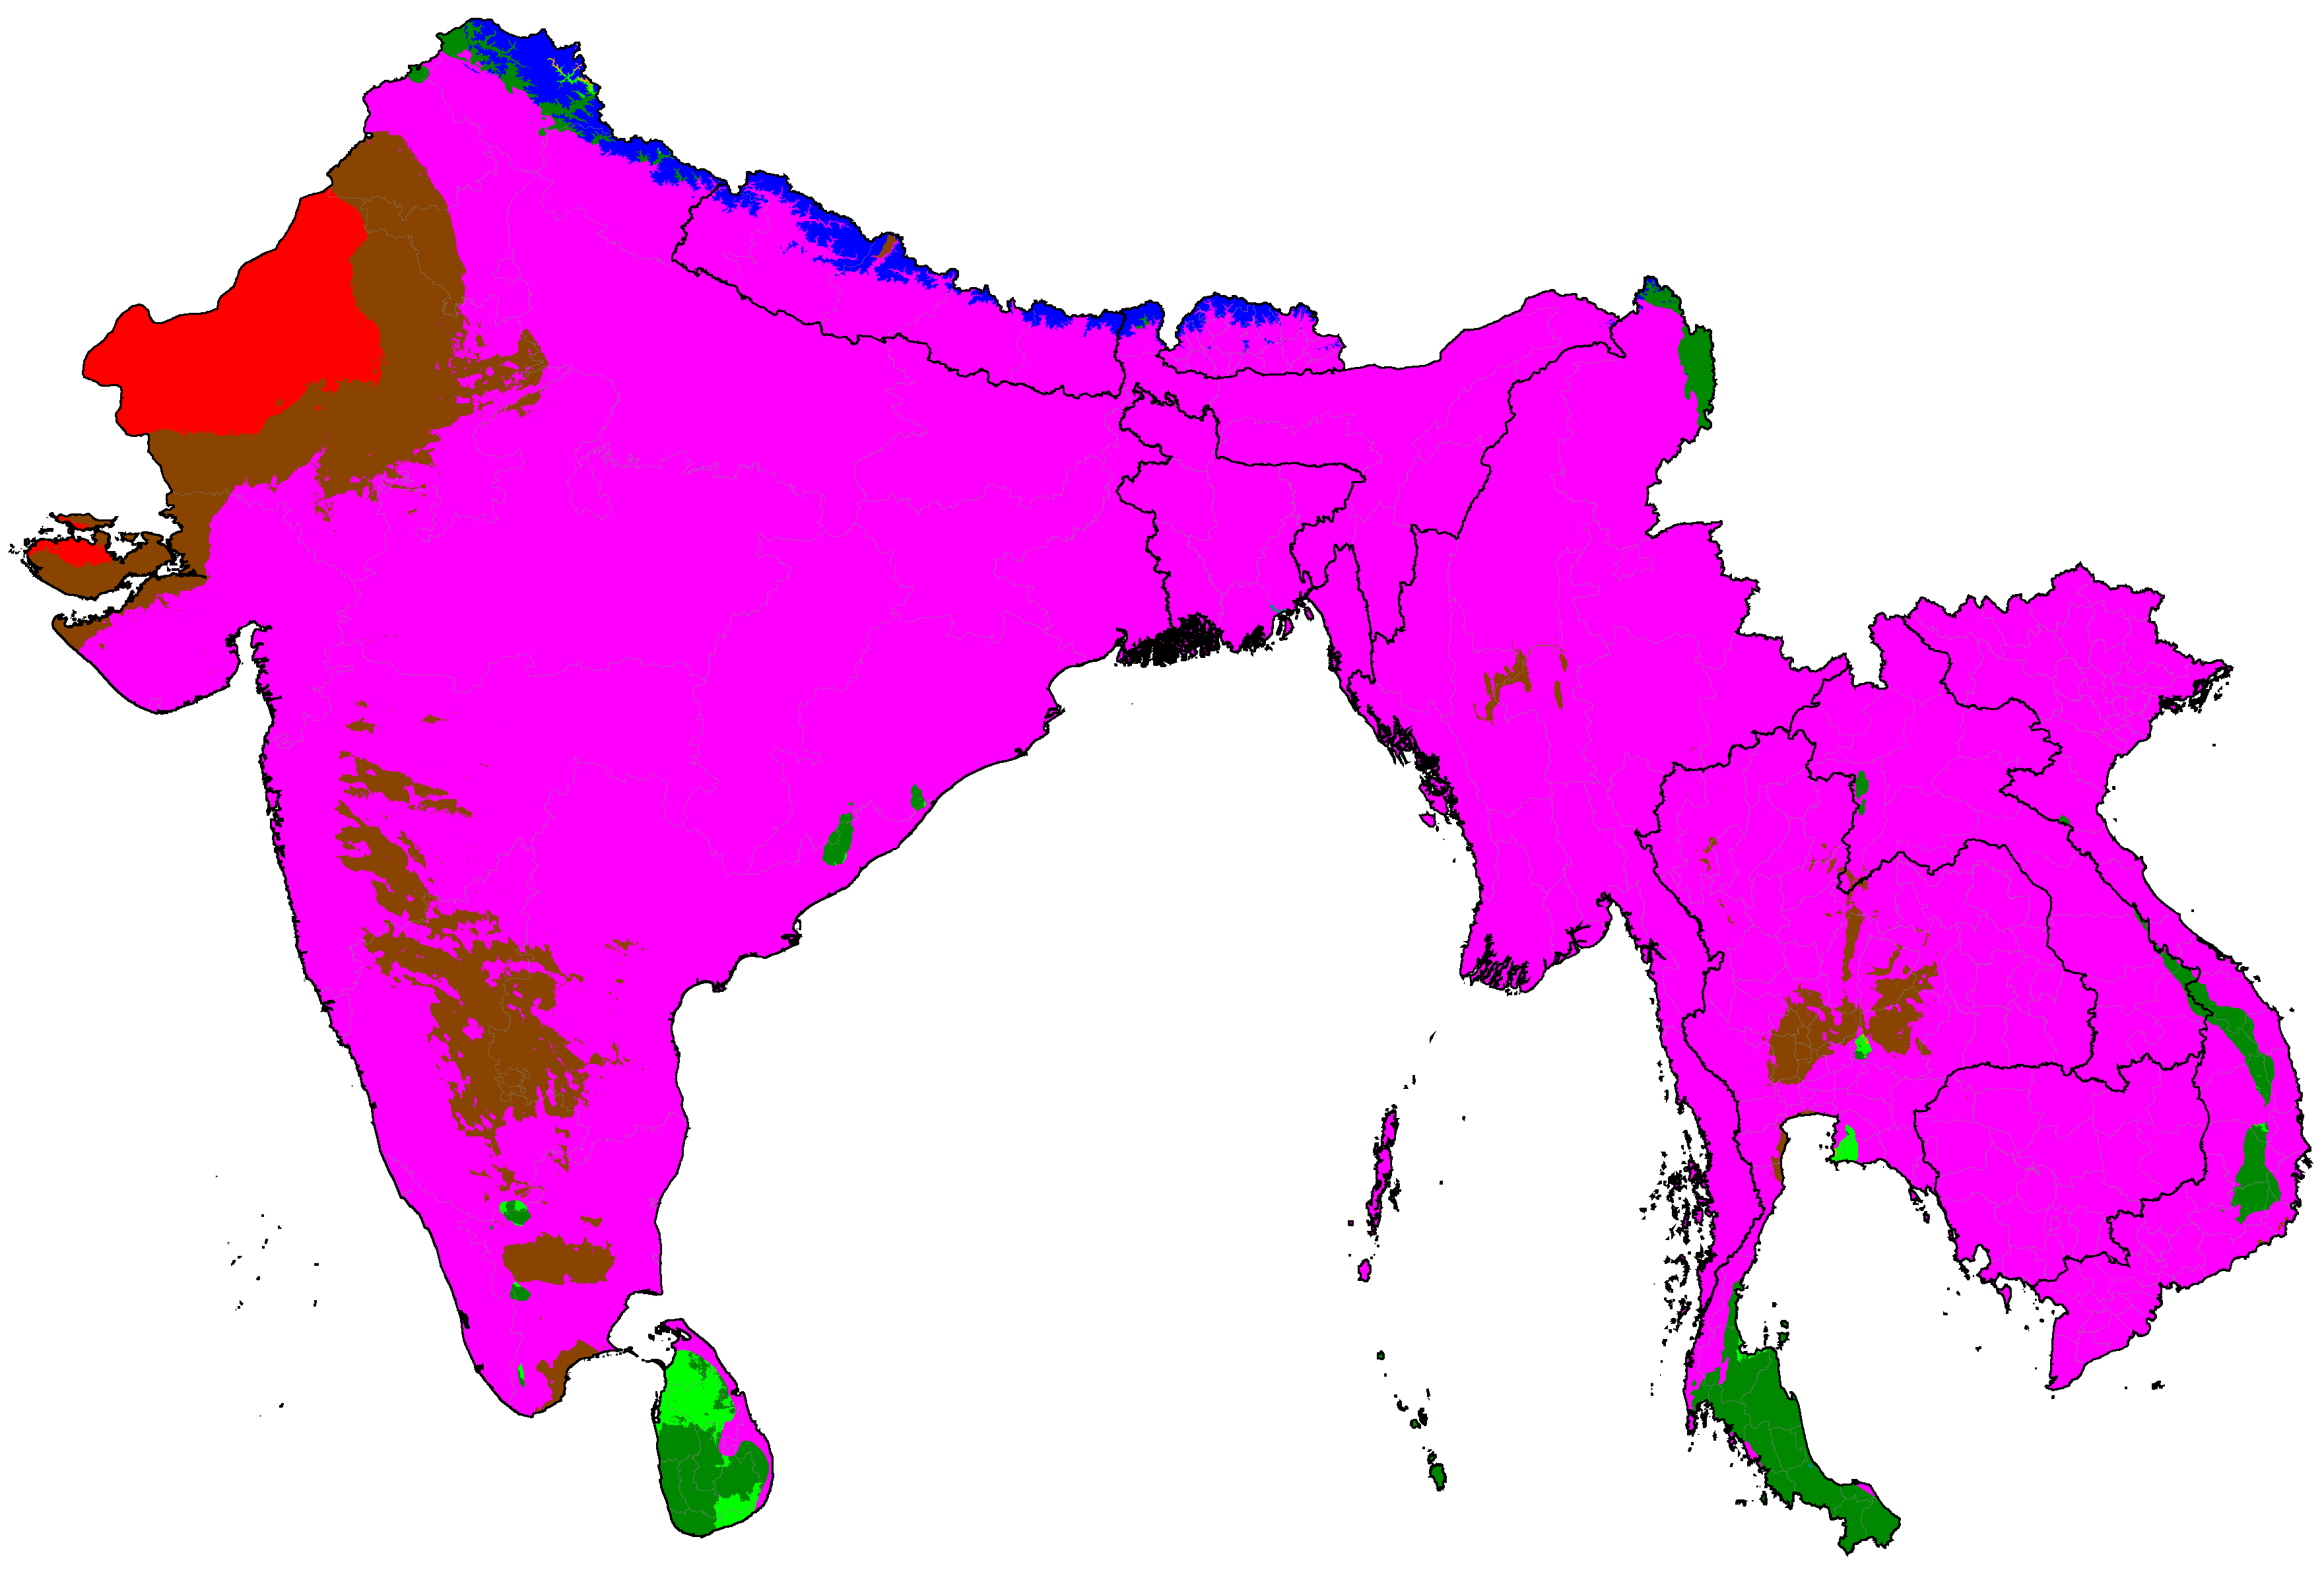
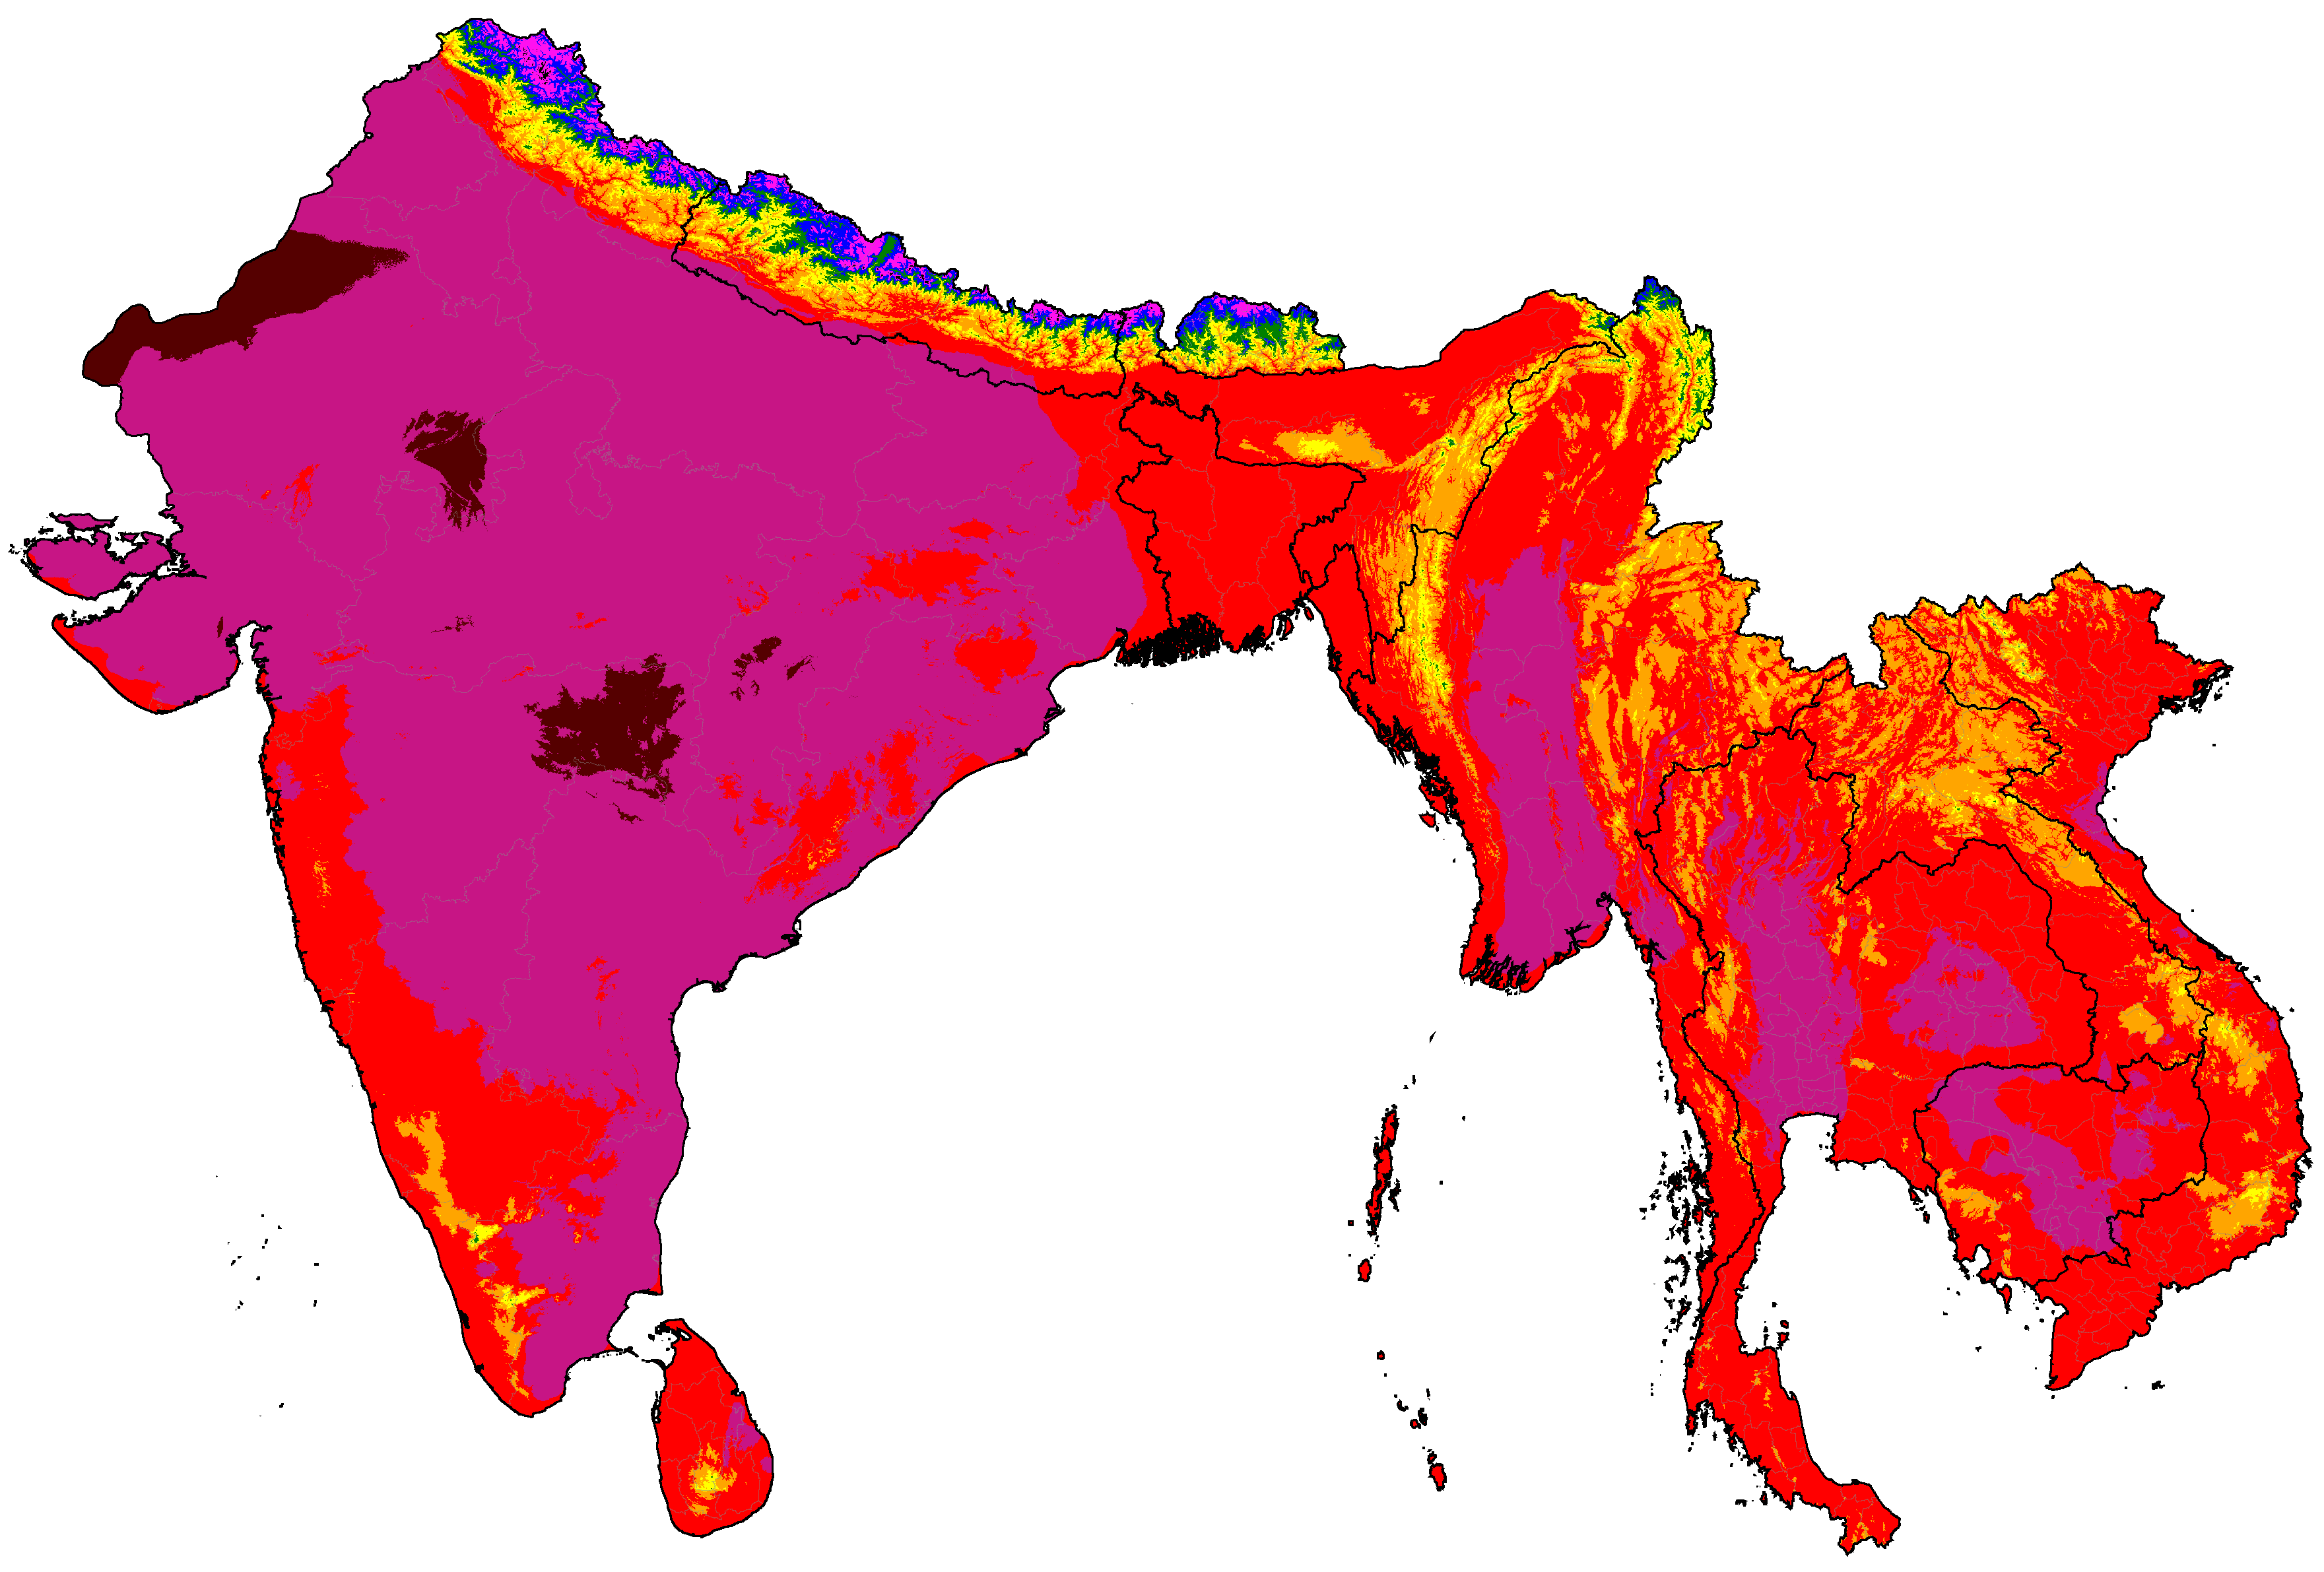
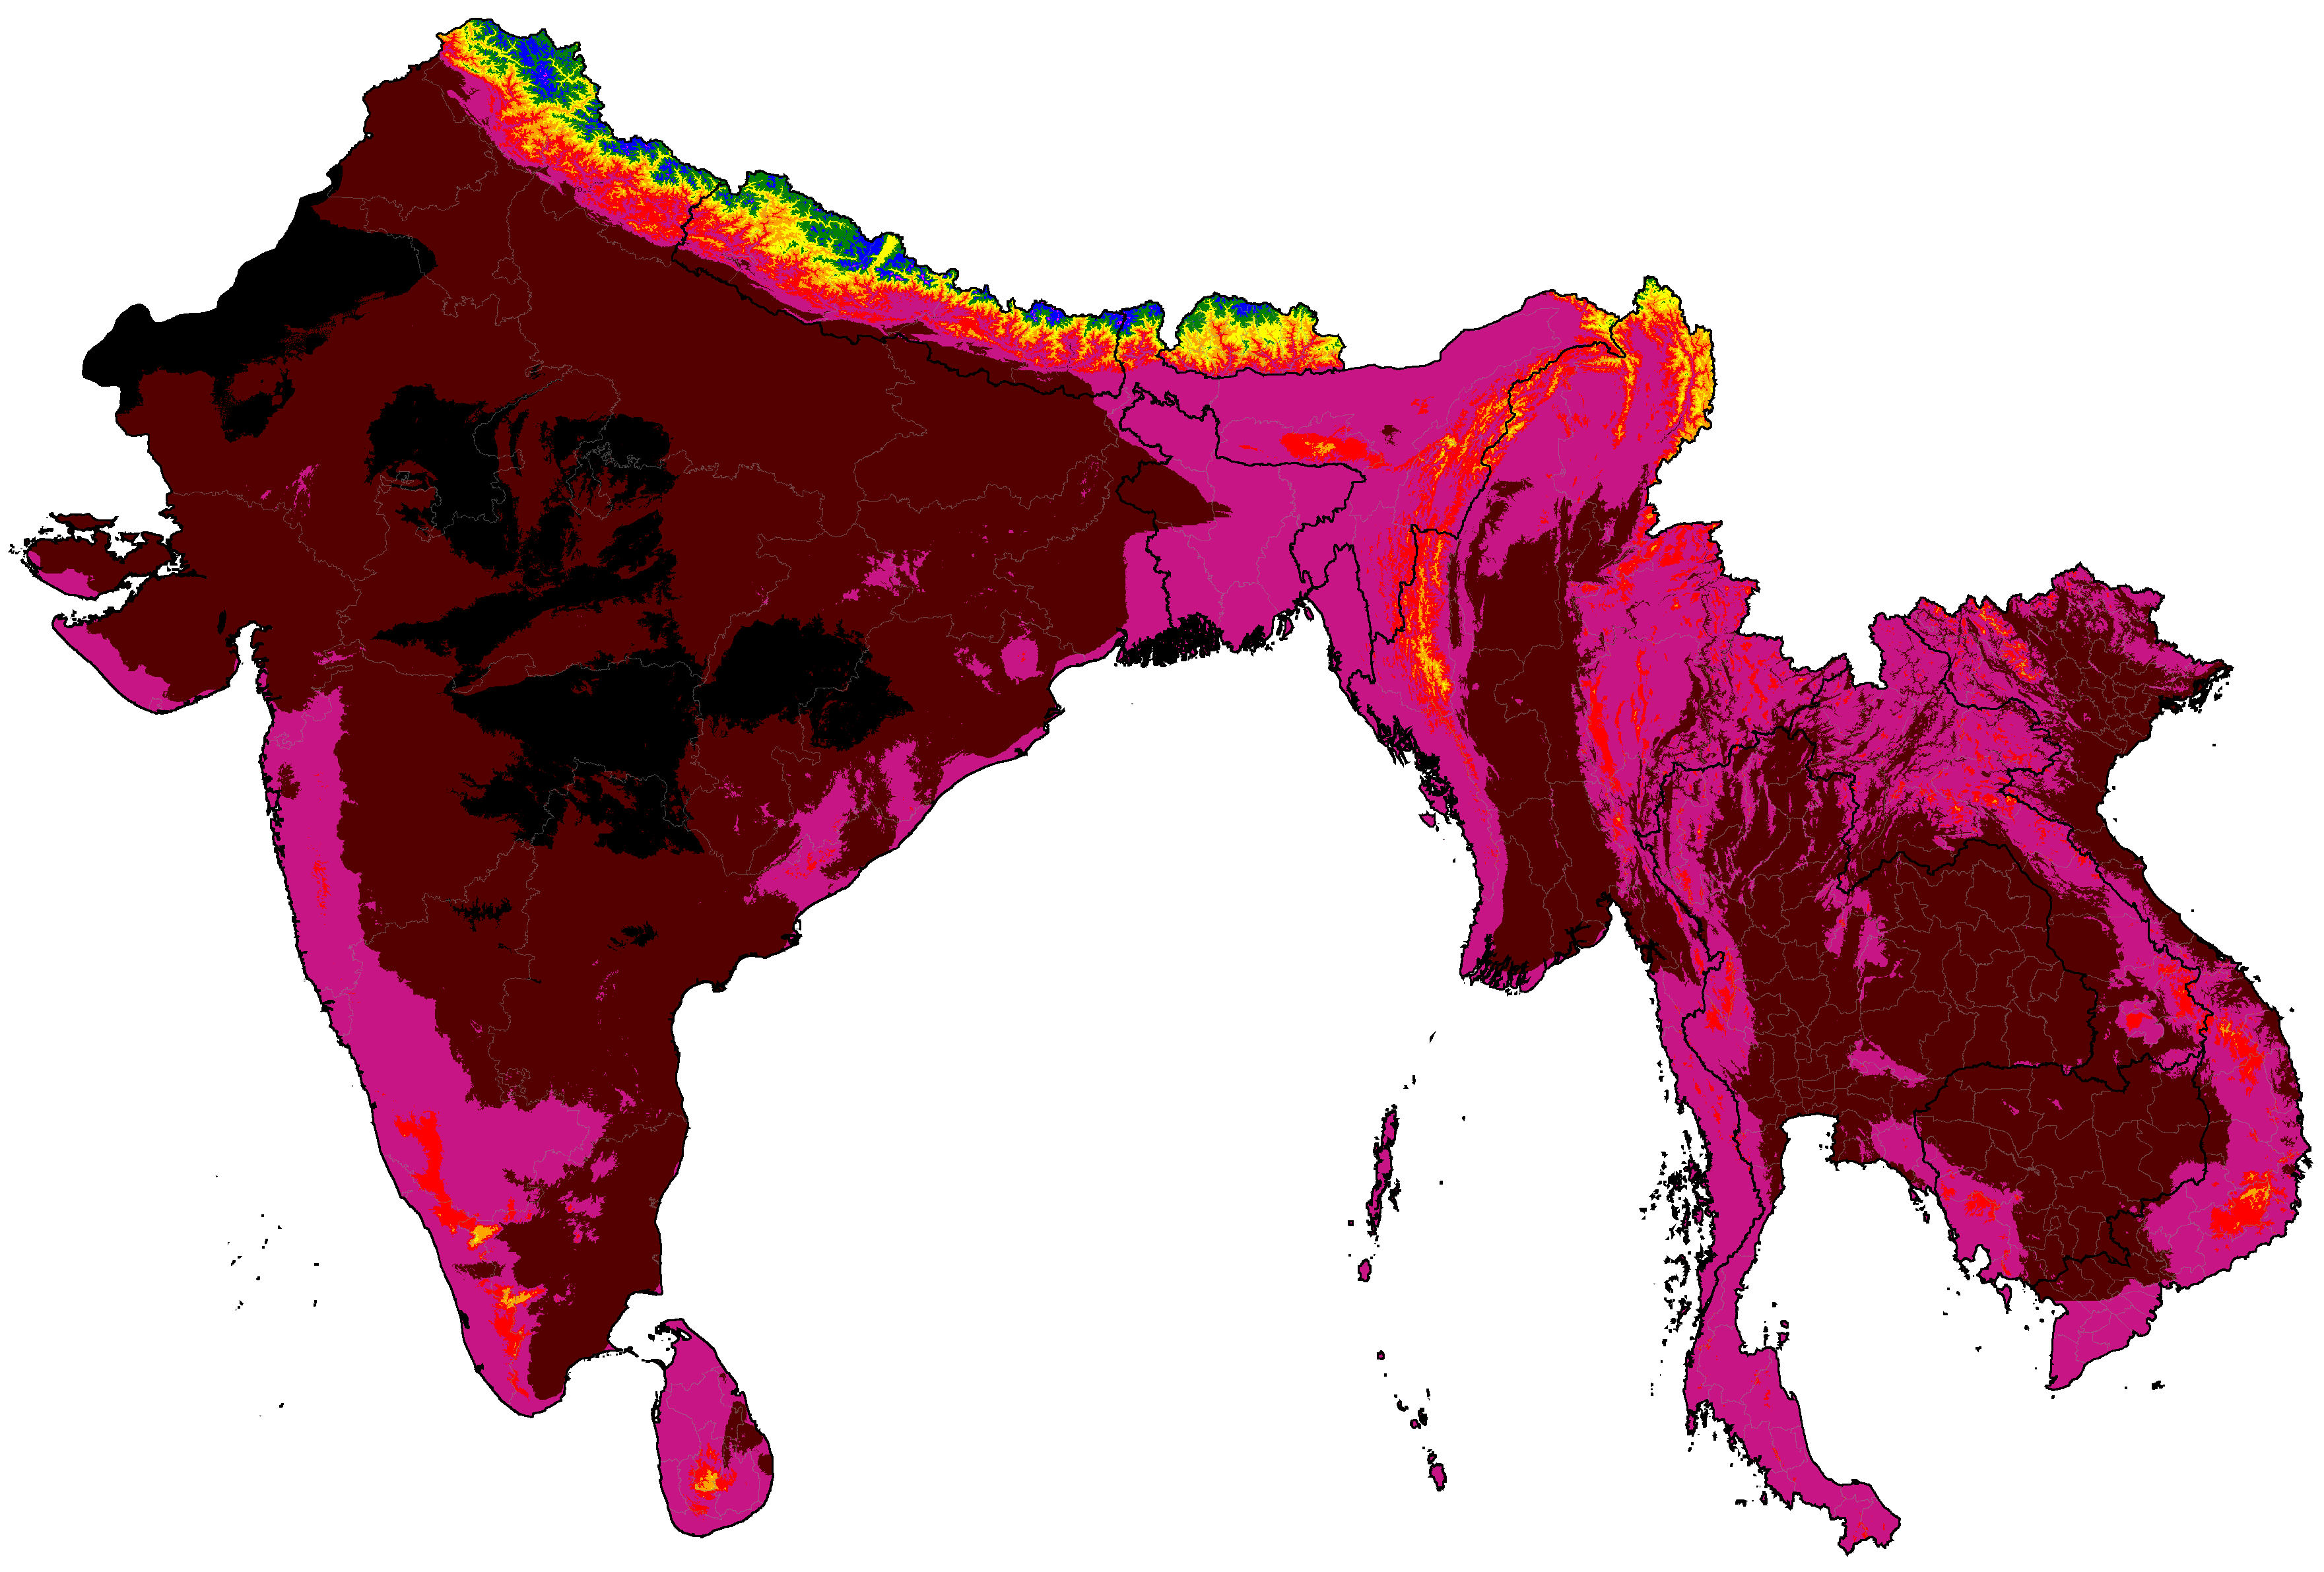
South Asia distribution of winter categories (projections are SSP5-8.5 high emissions normals)
Note: Due to the complexity of the system, only the most common climates in each map are labeled.
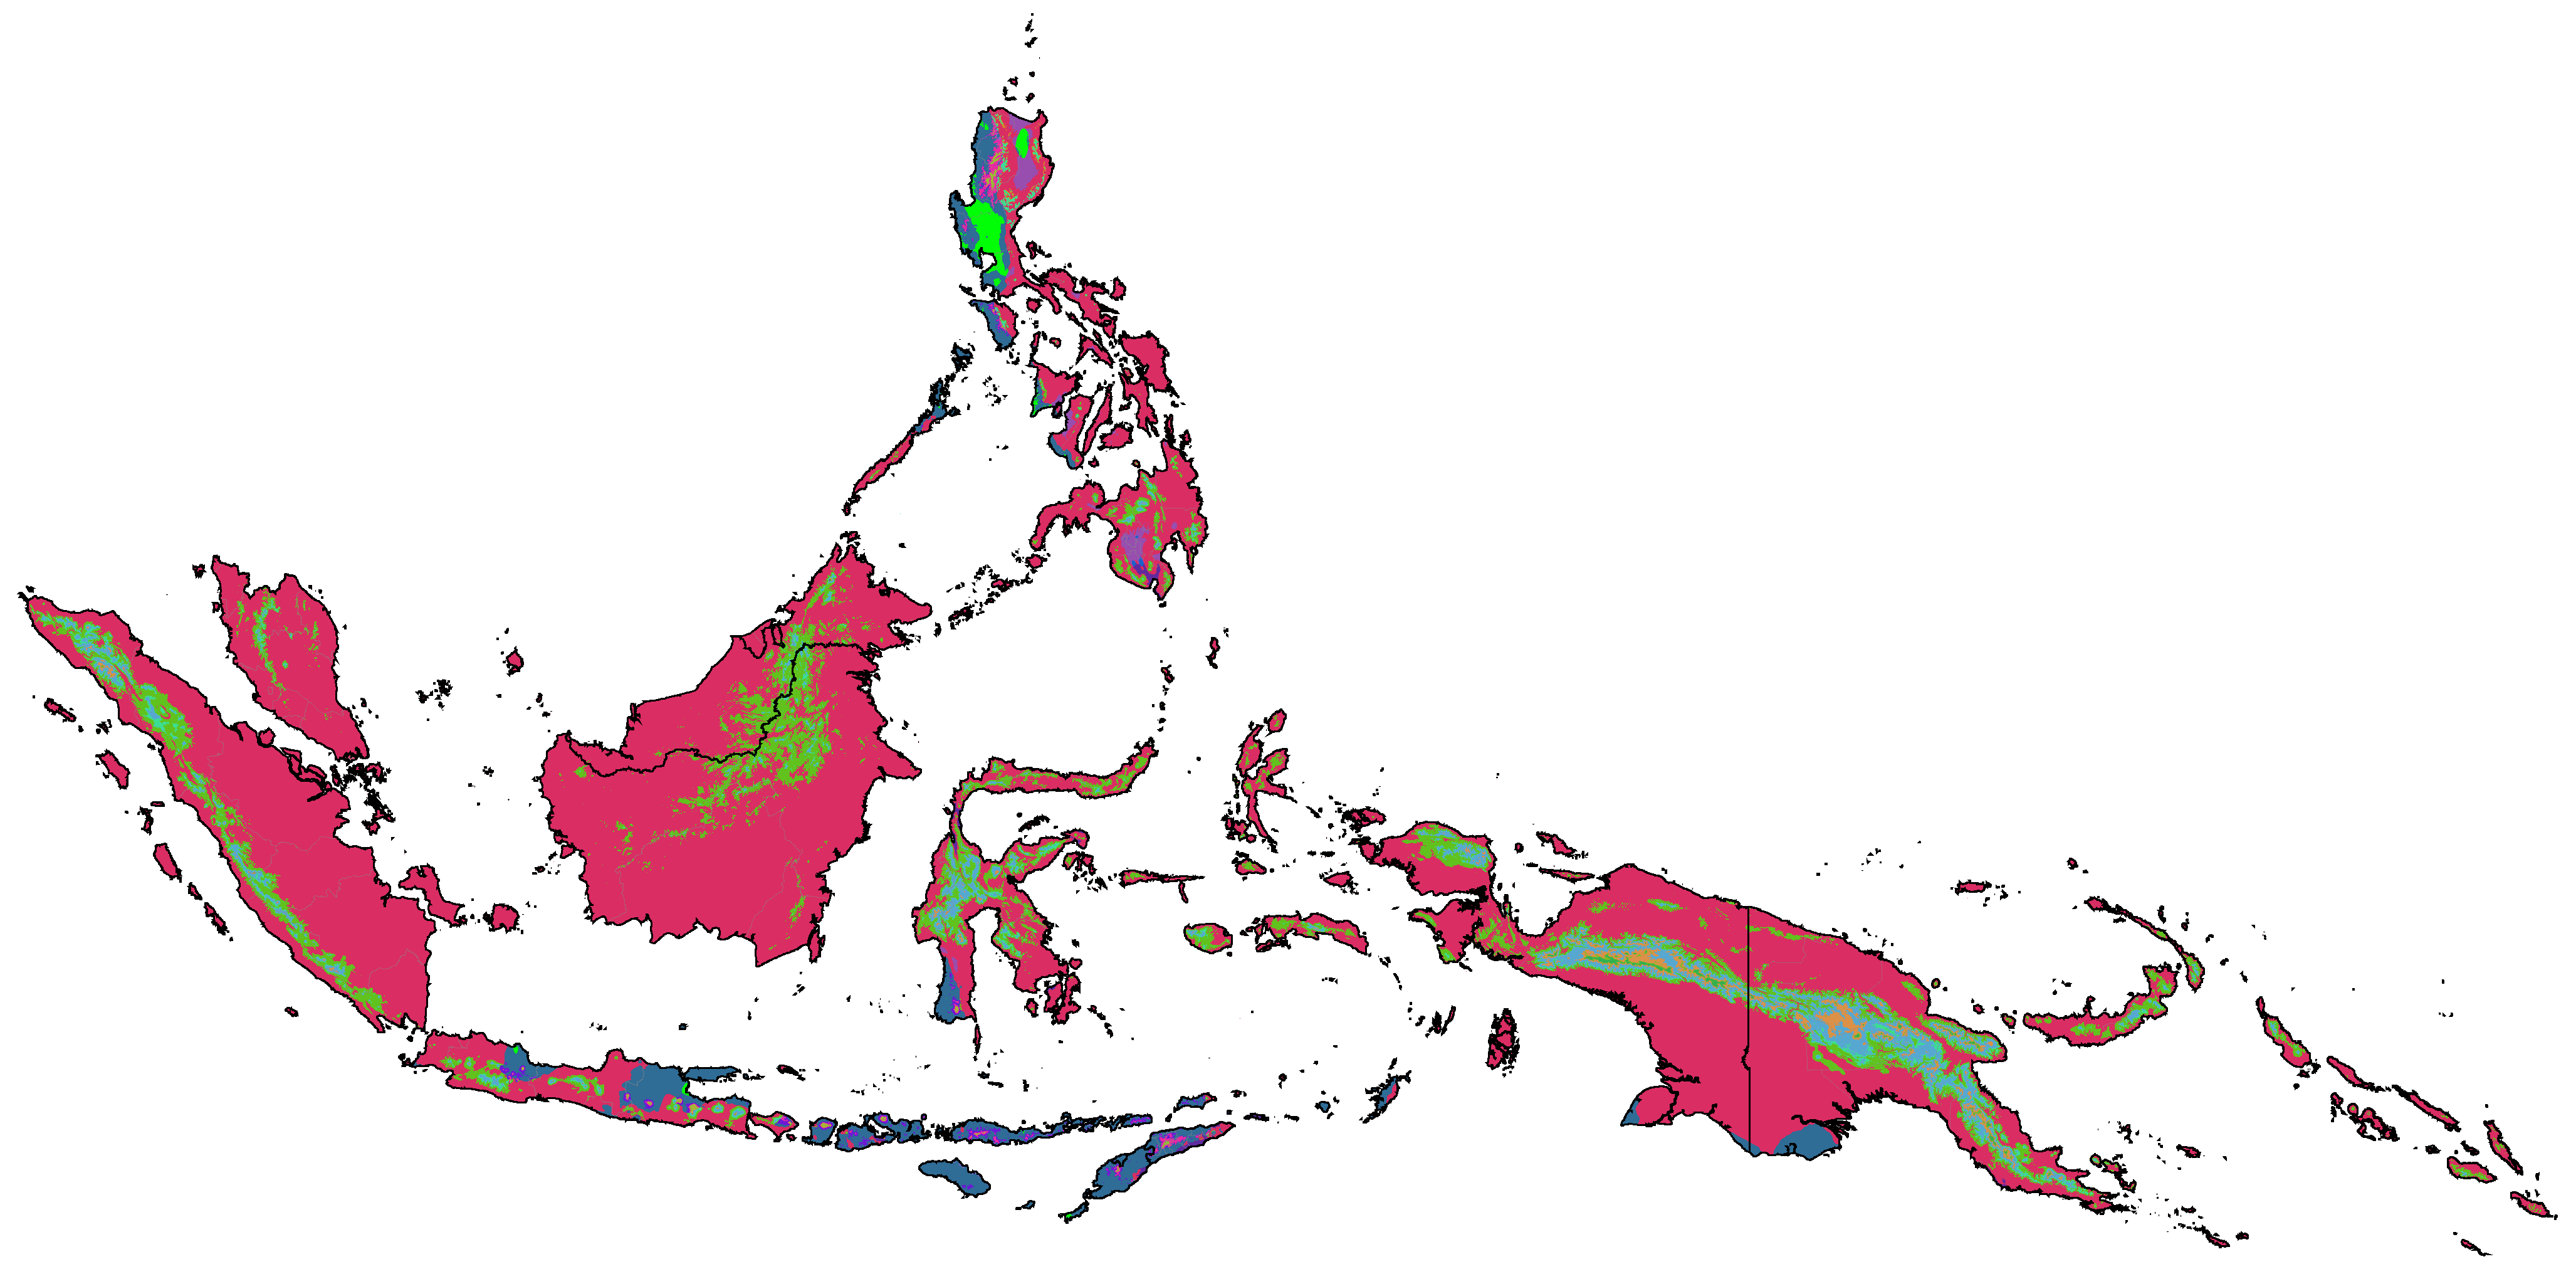
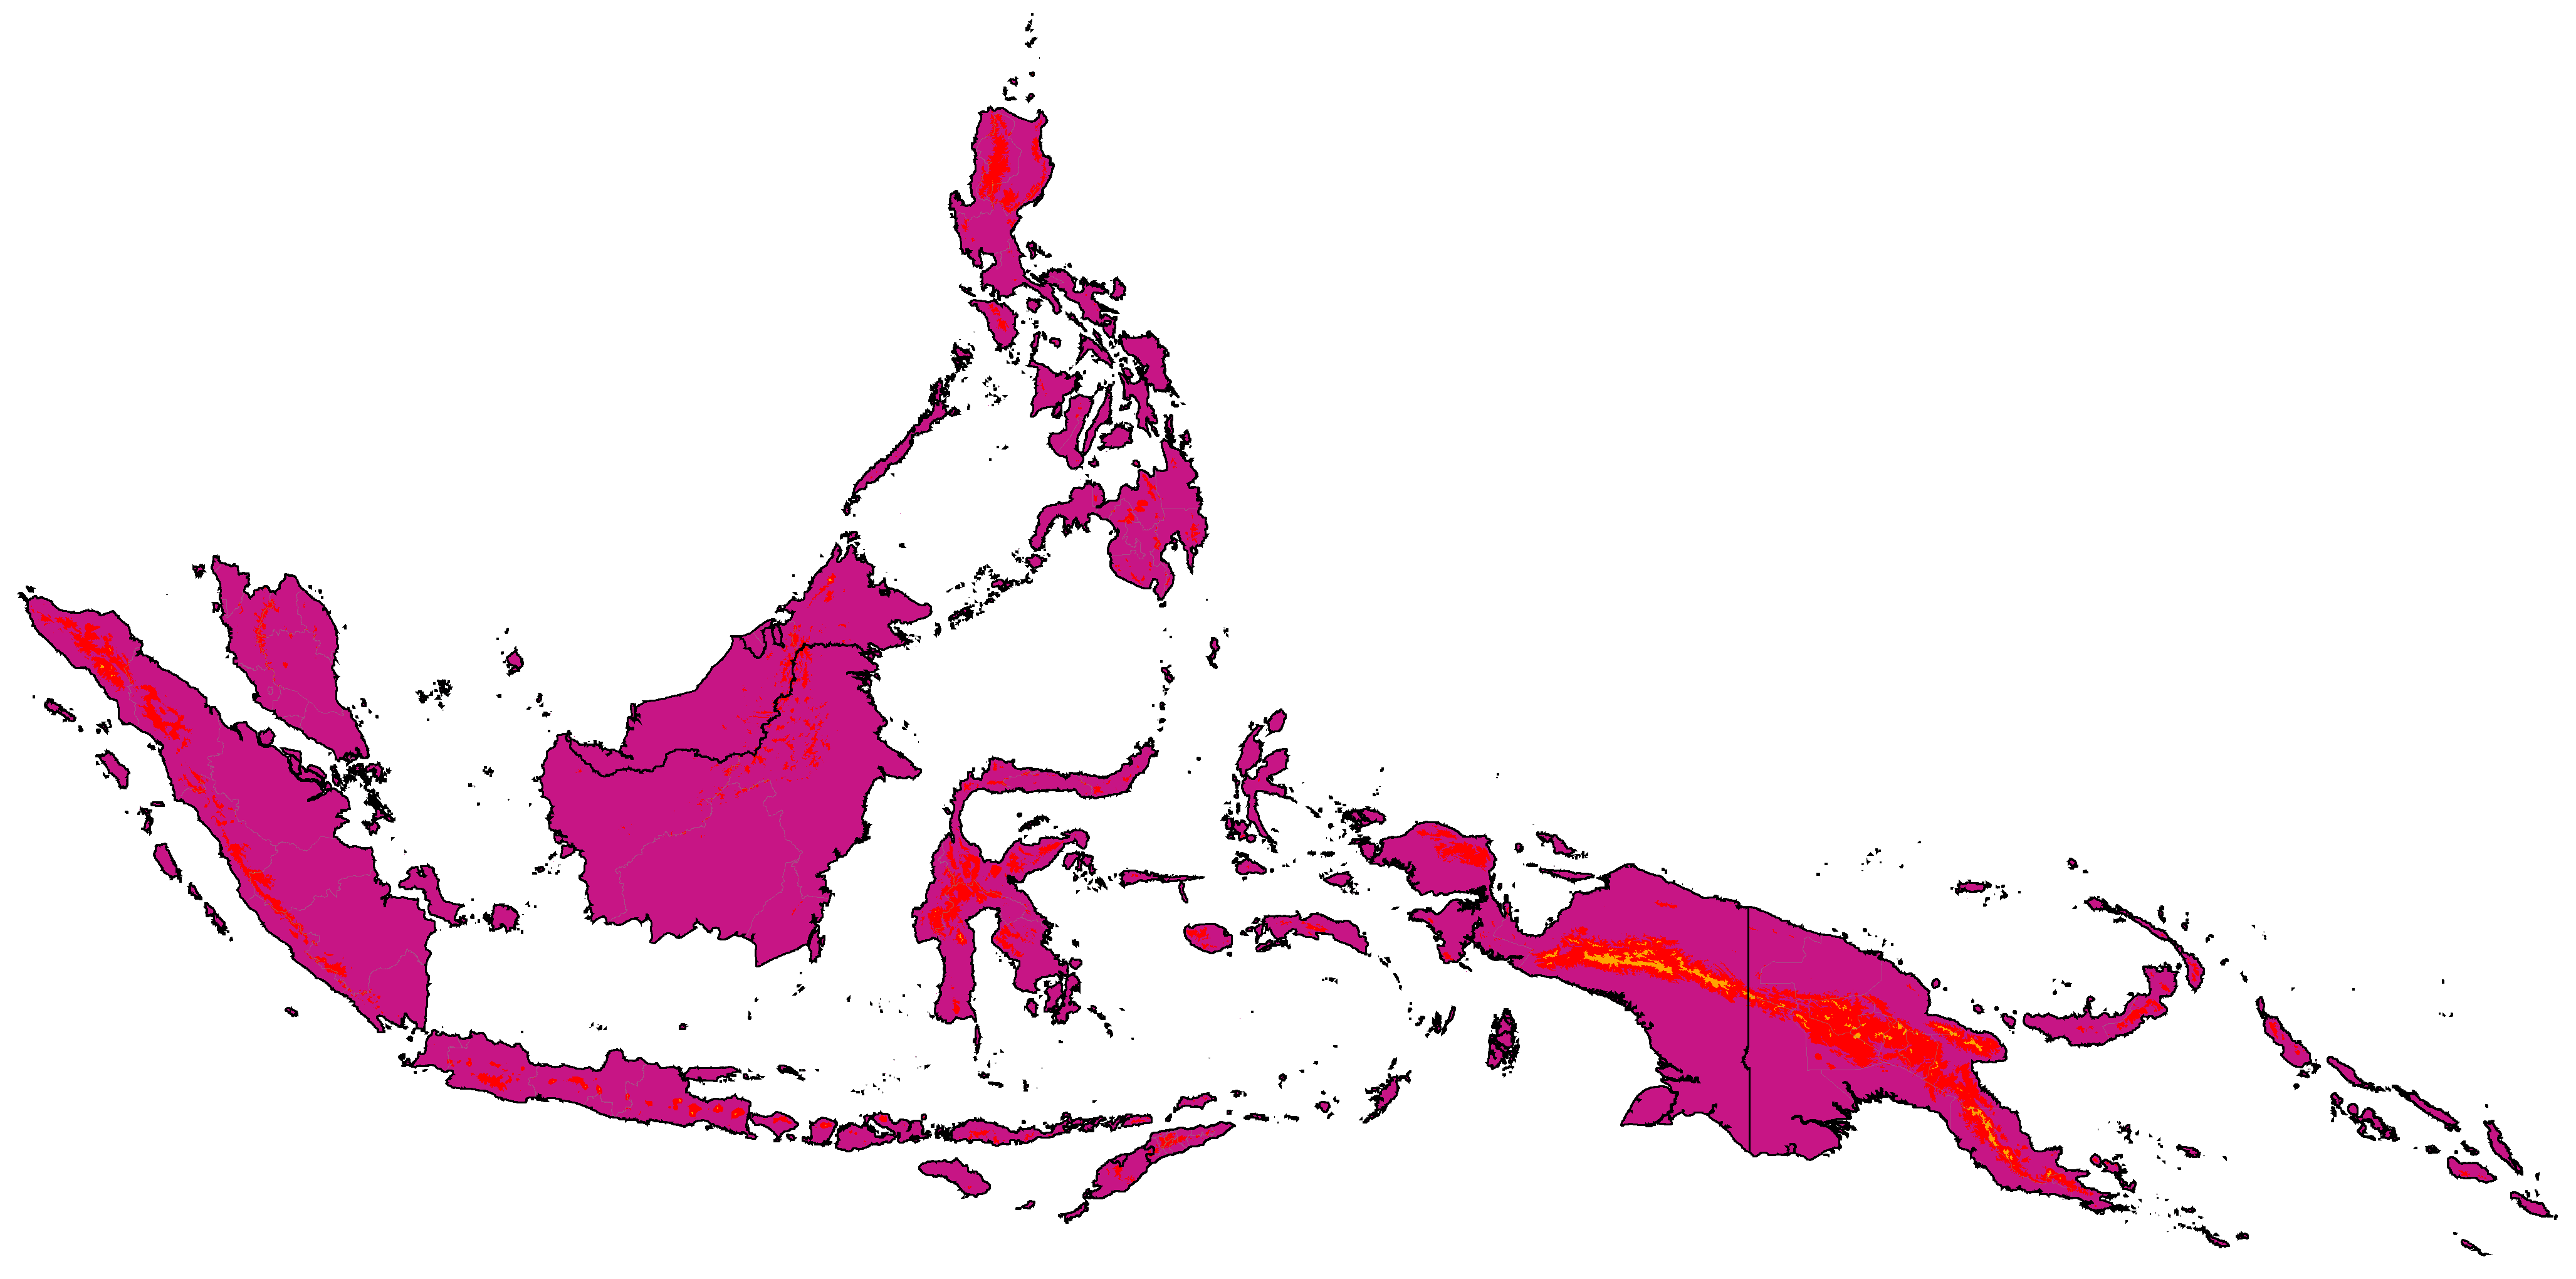
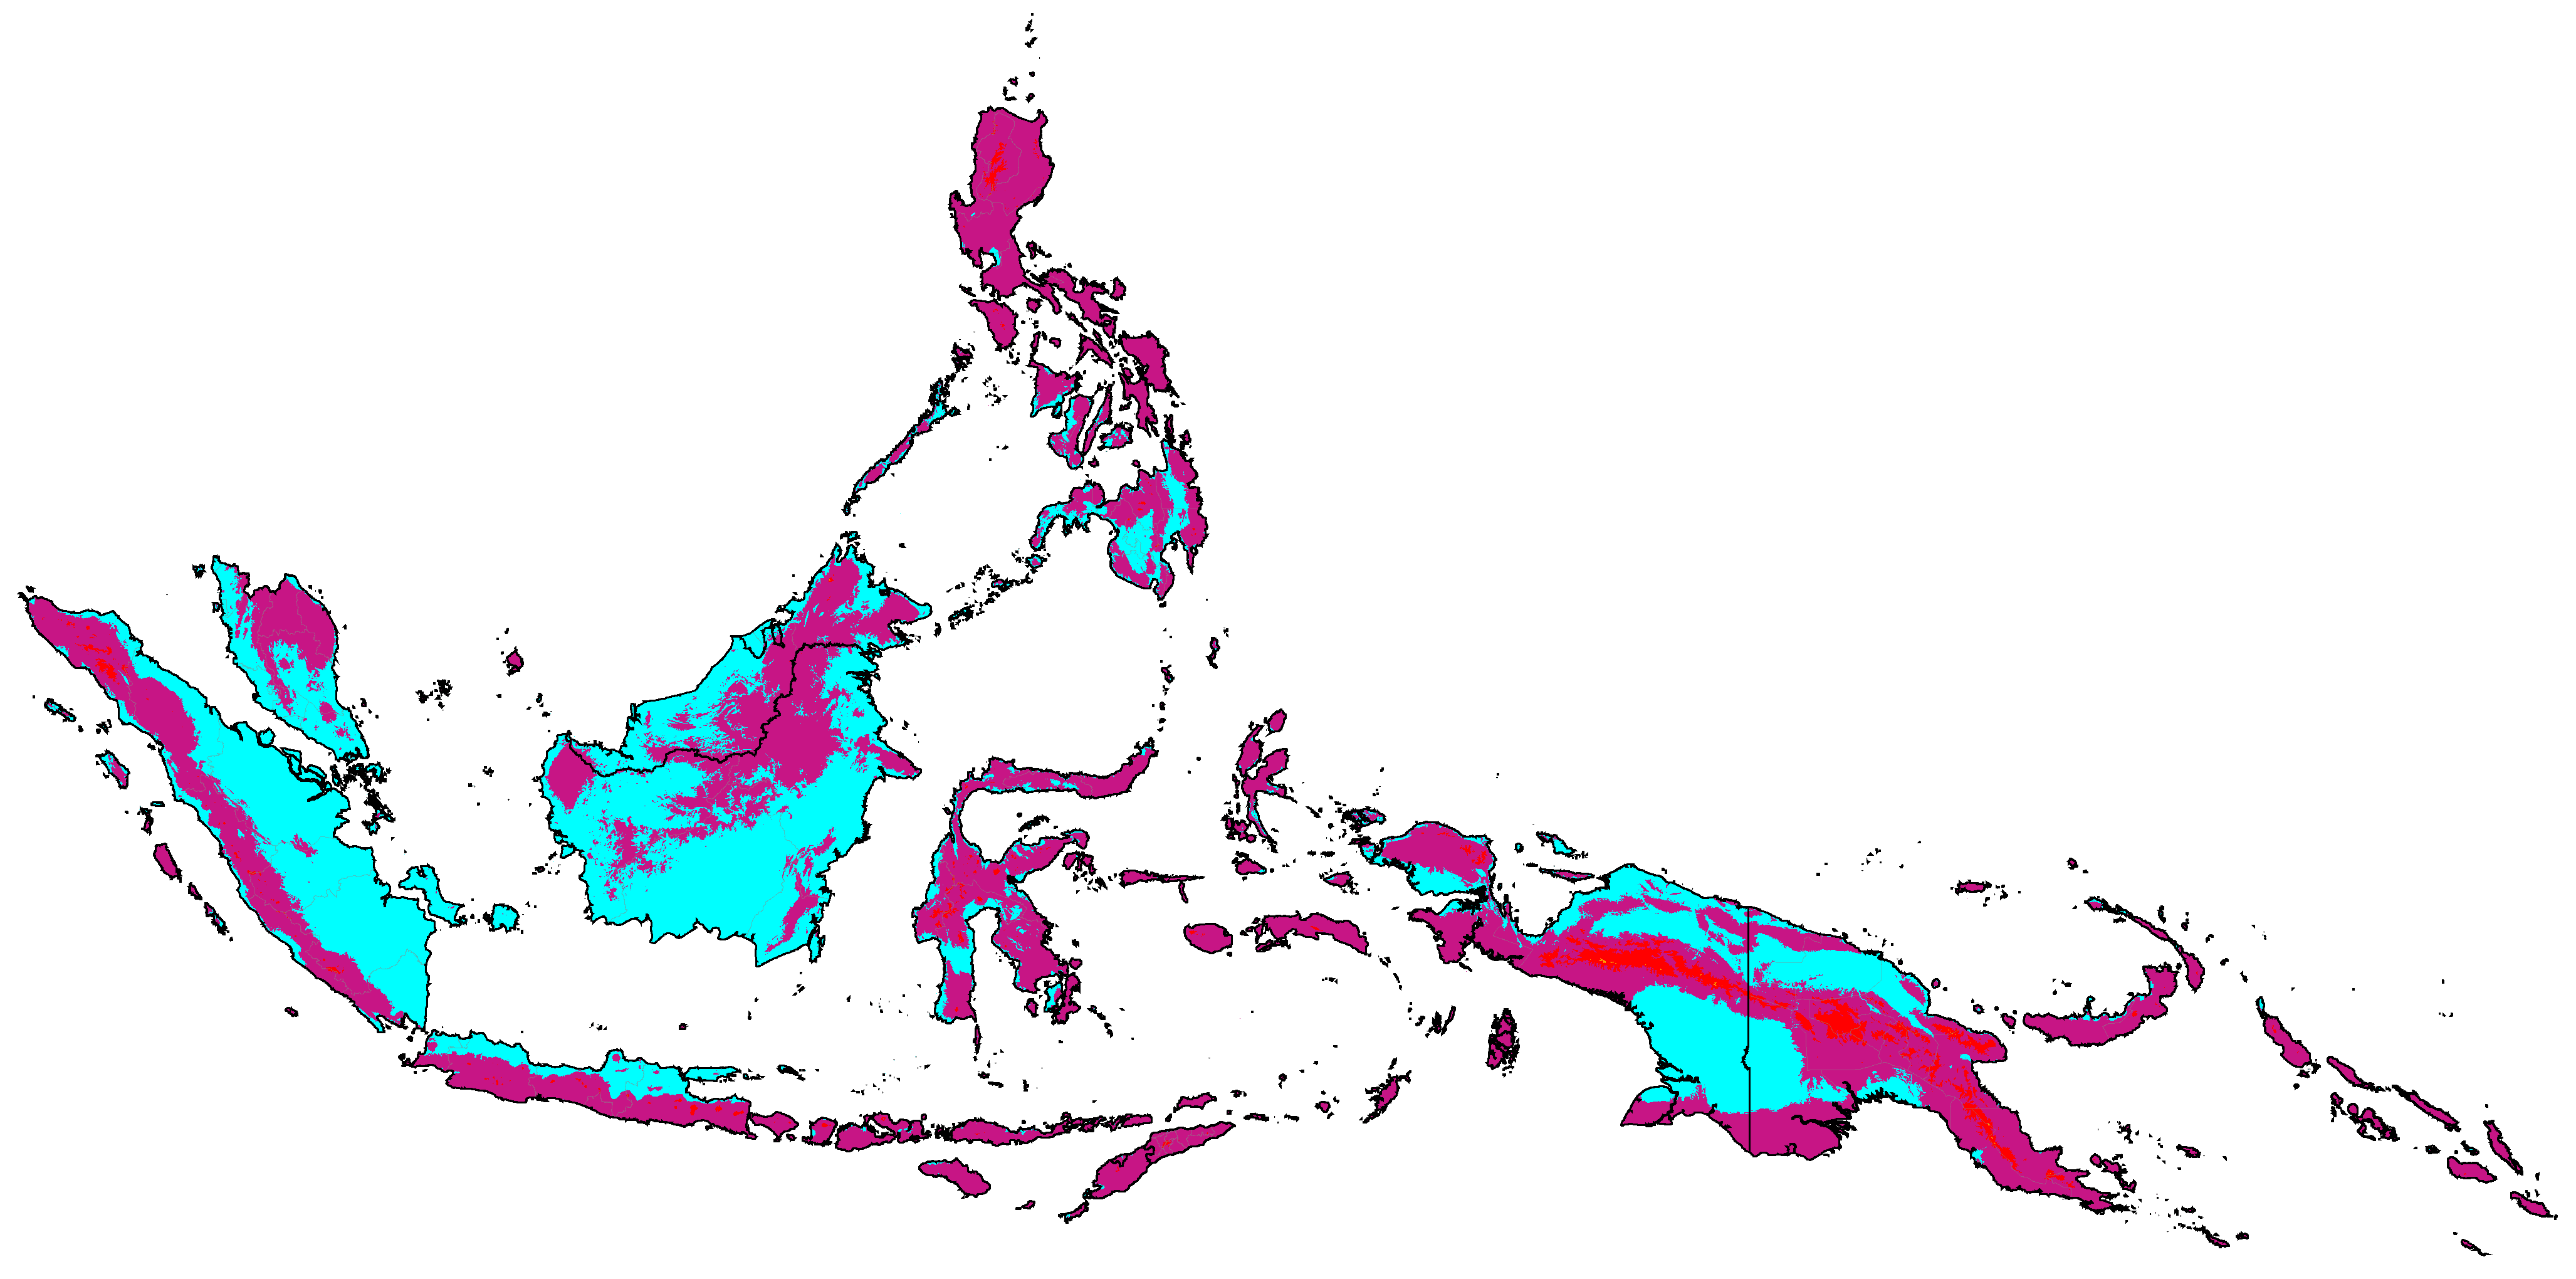
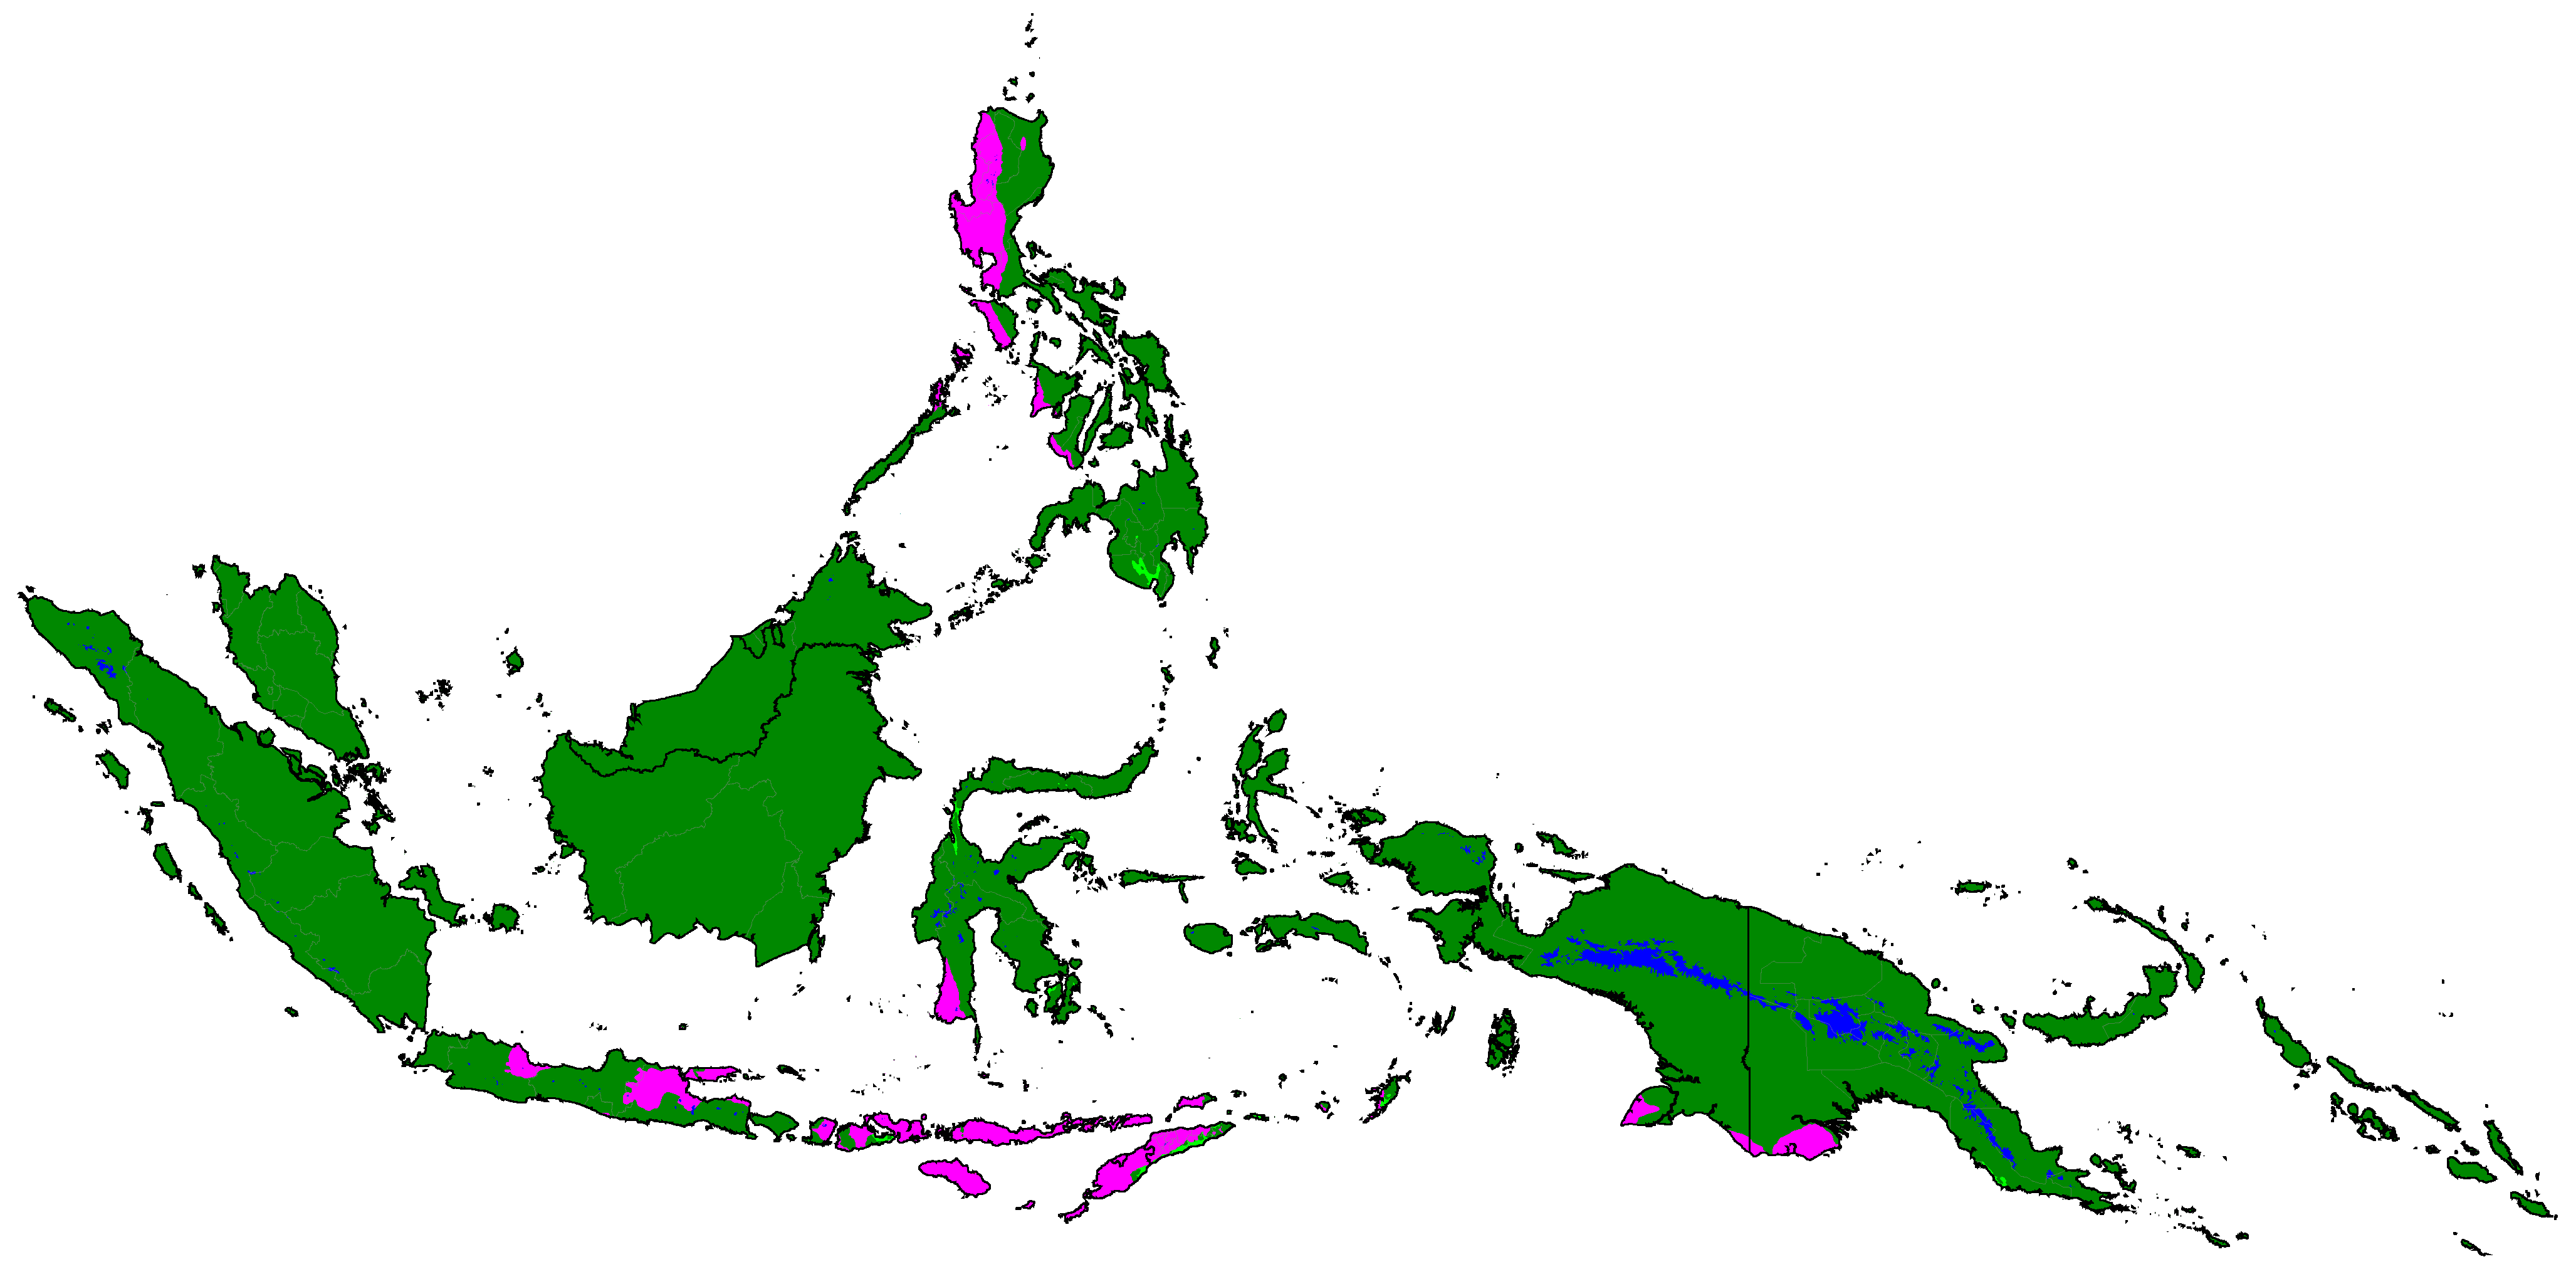
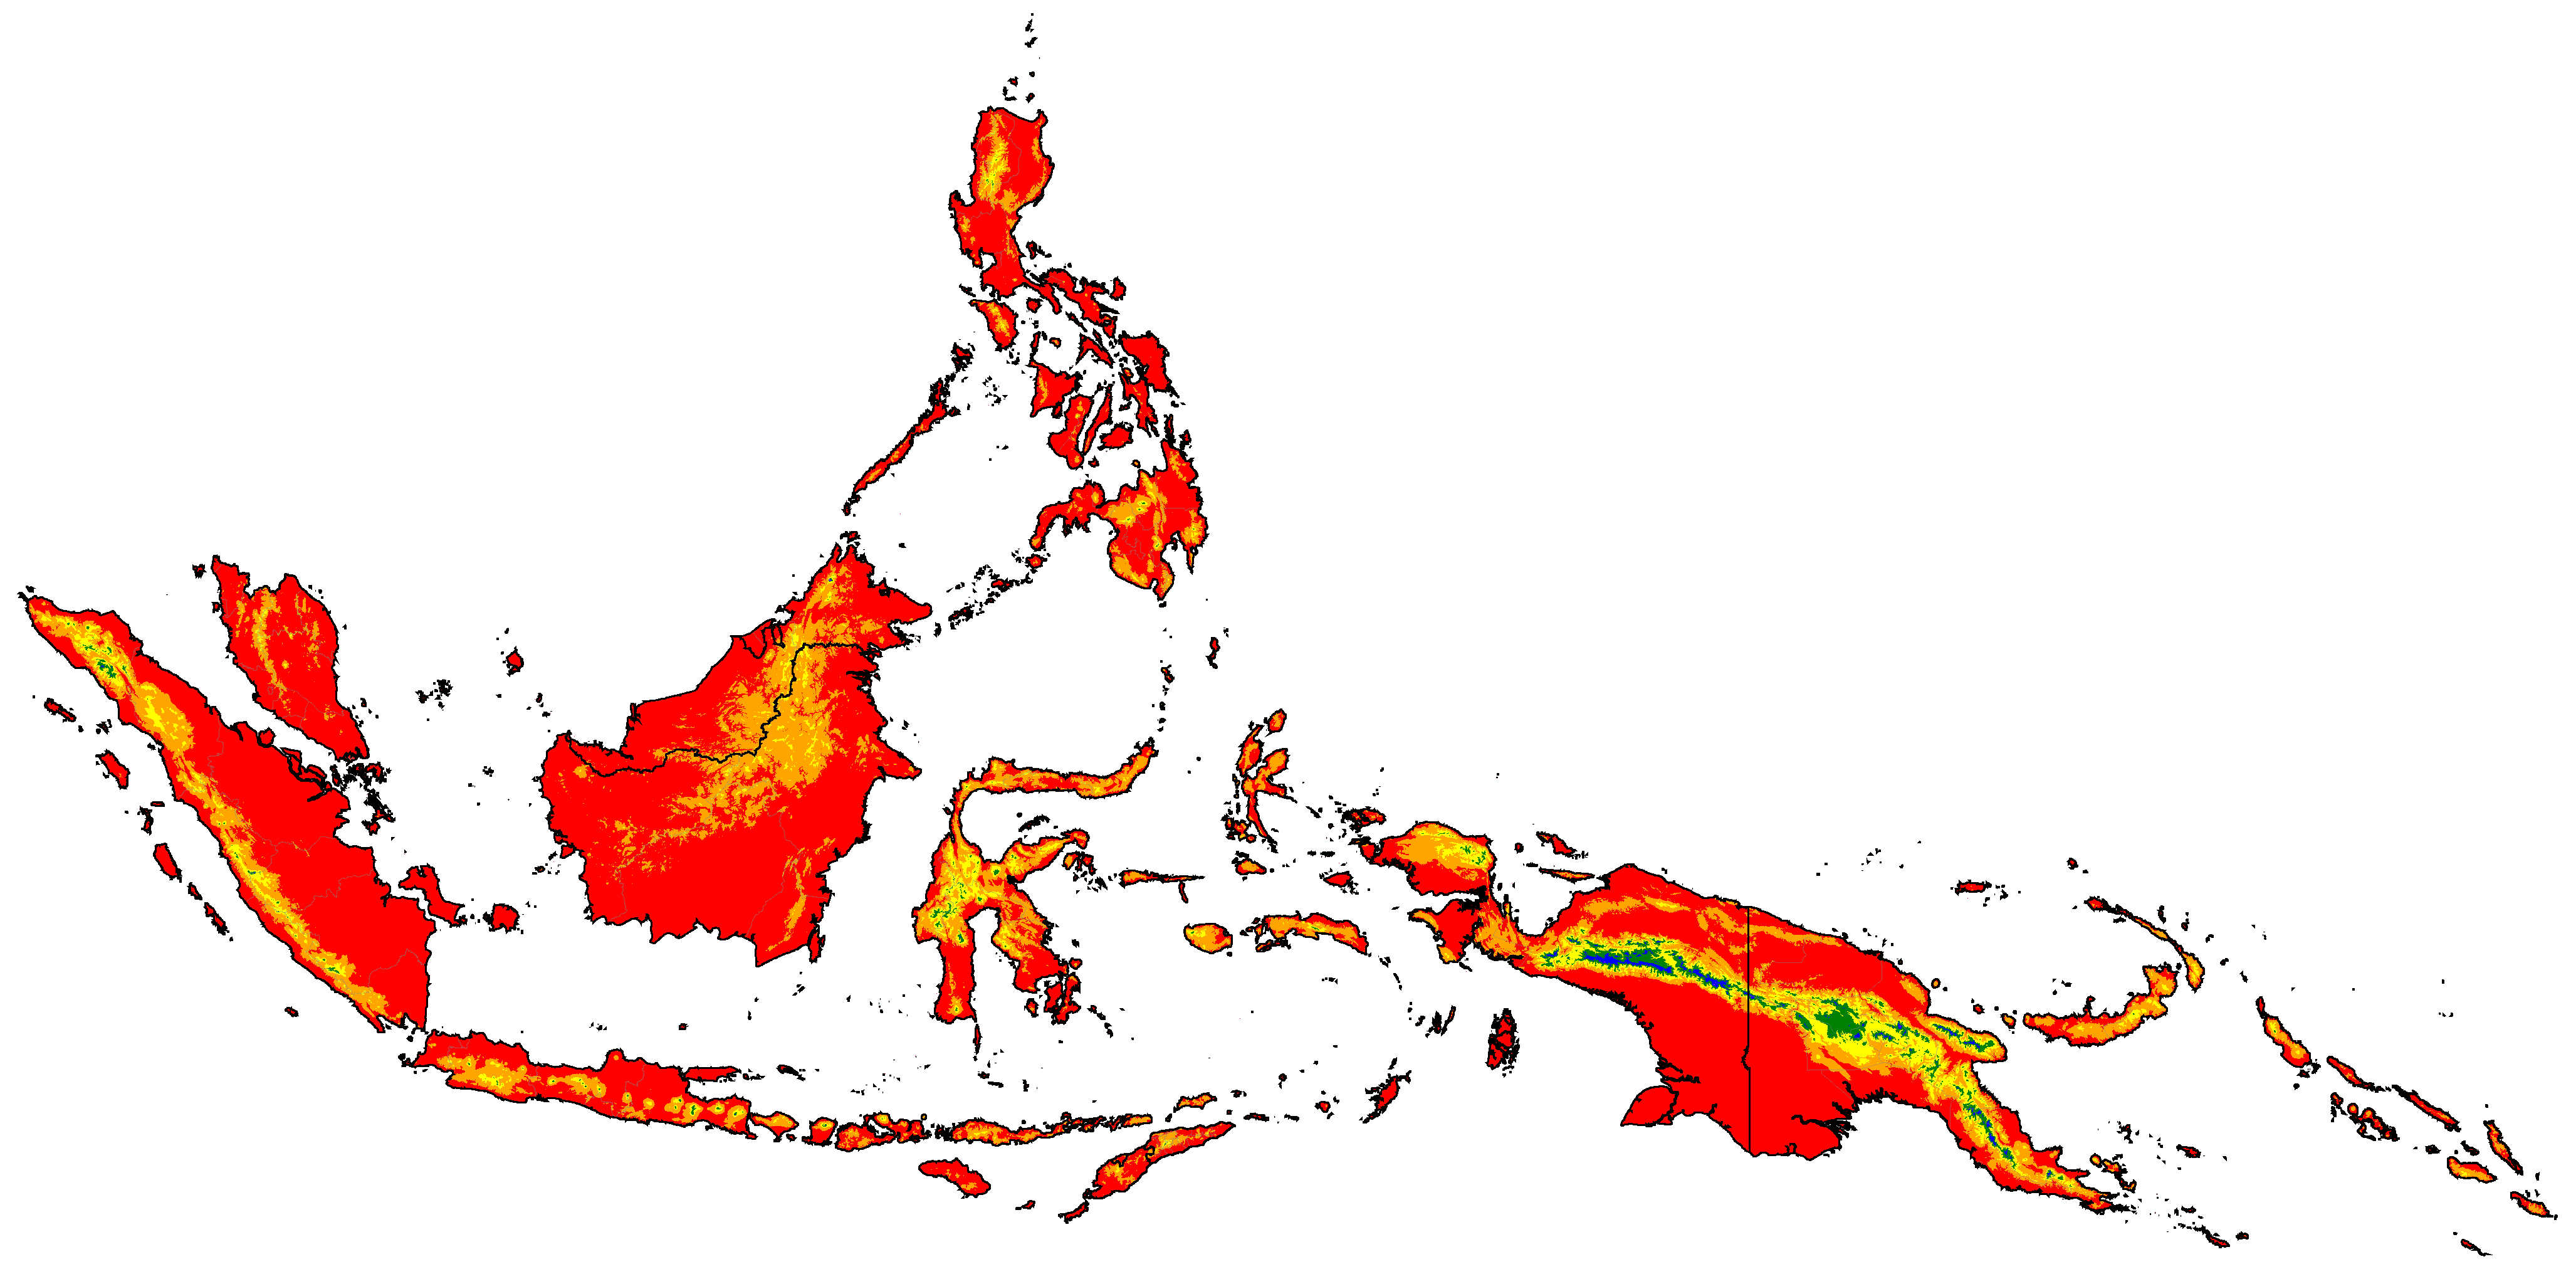
Maritime Southeast Asia distribution of winter categories (projections are SSP5-8.5 high emissions normals)
Note: Due to the complexity of the system, only the most common climates in each map are labeled.
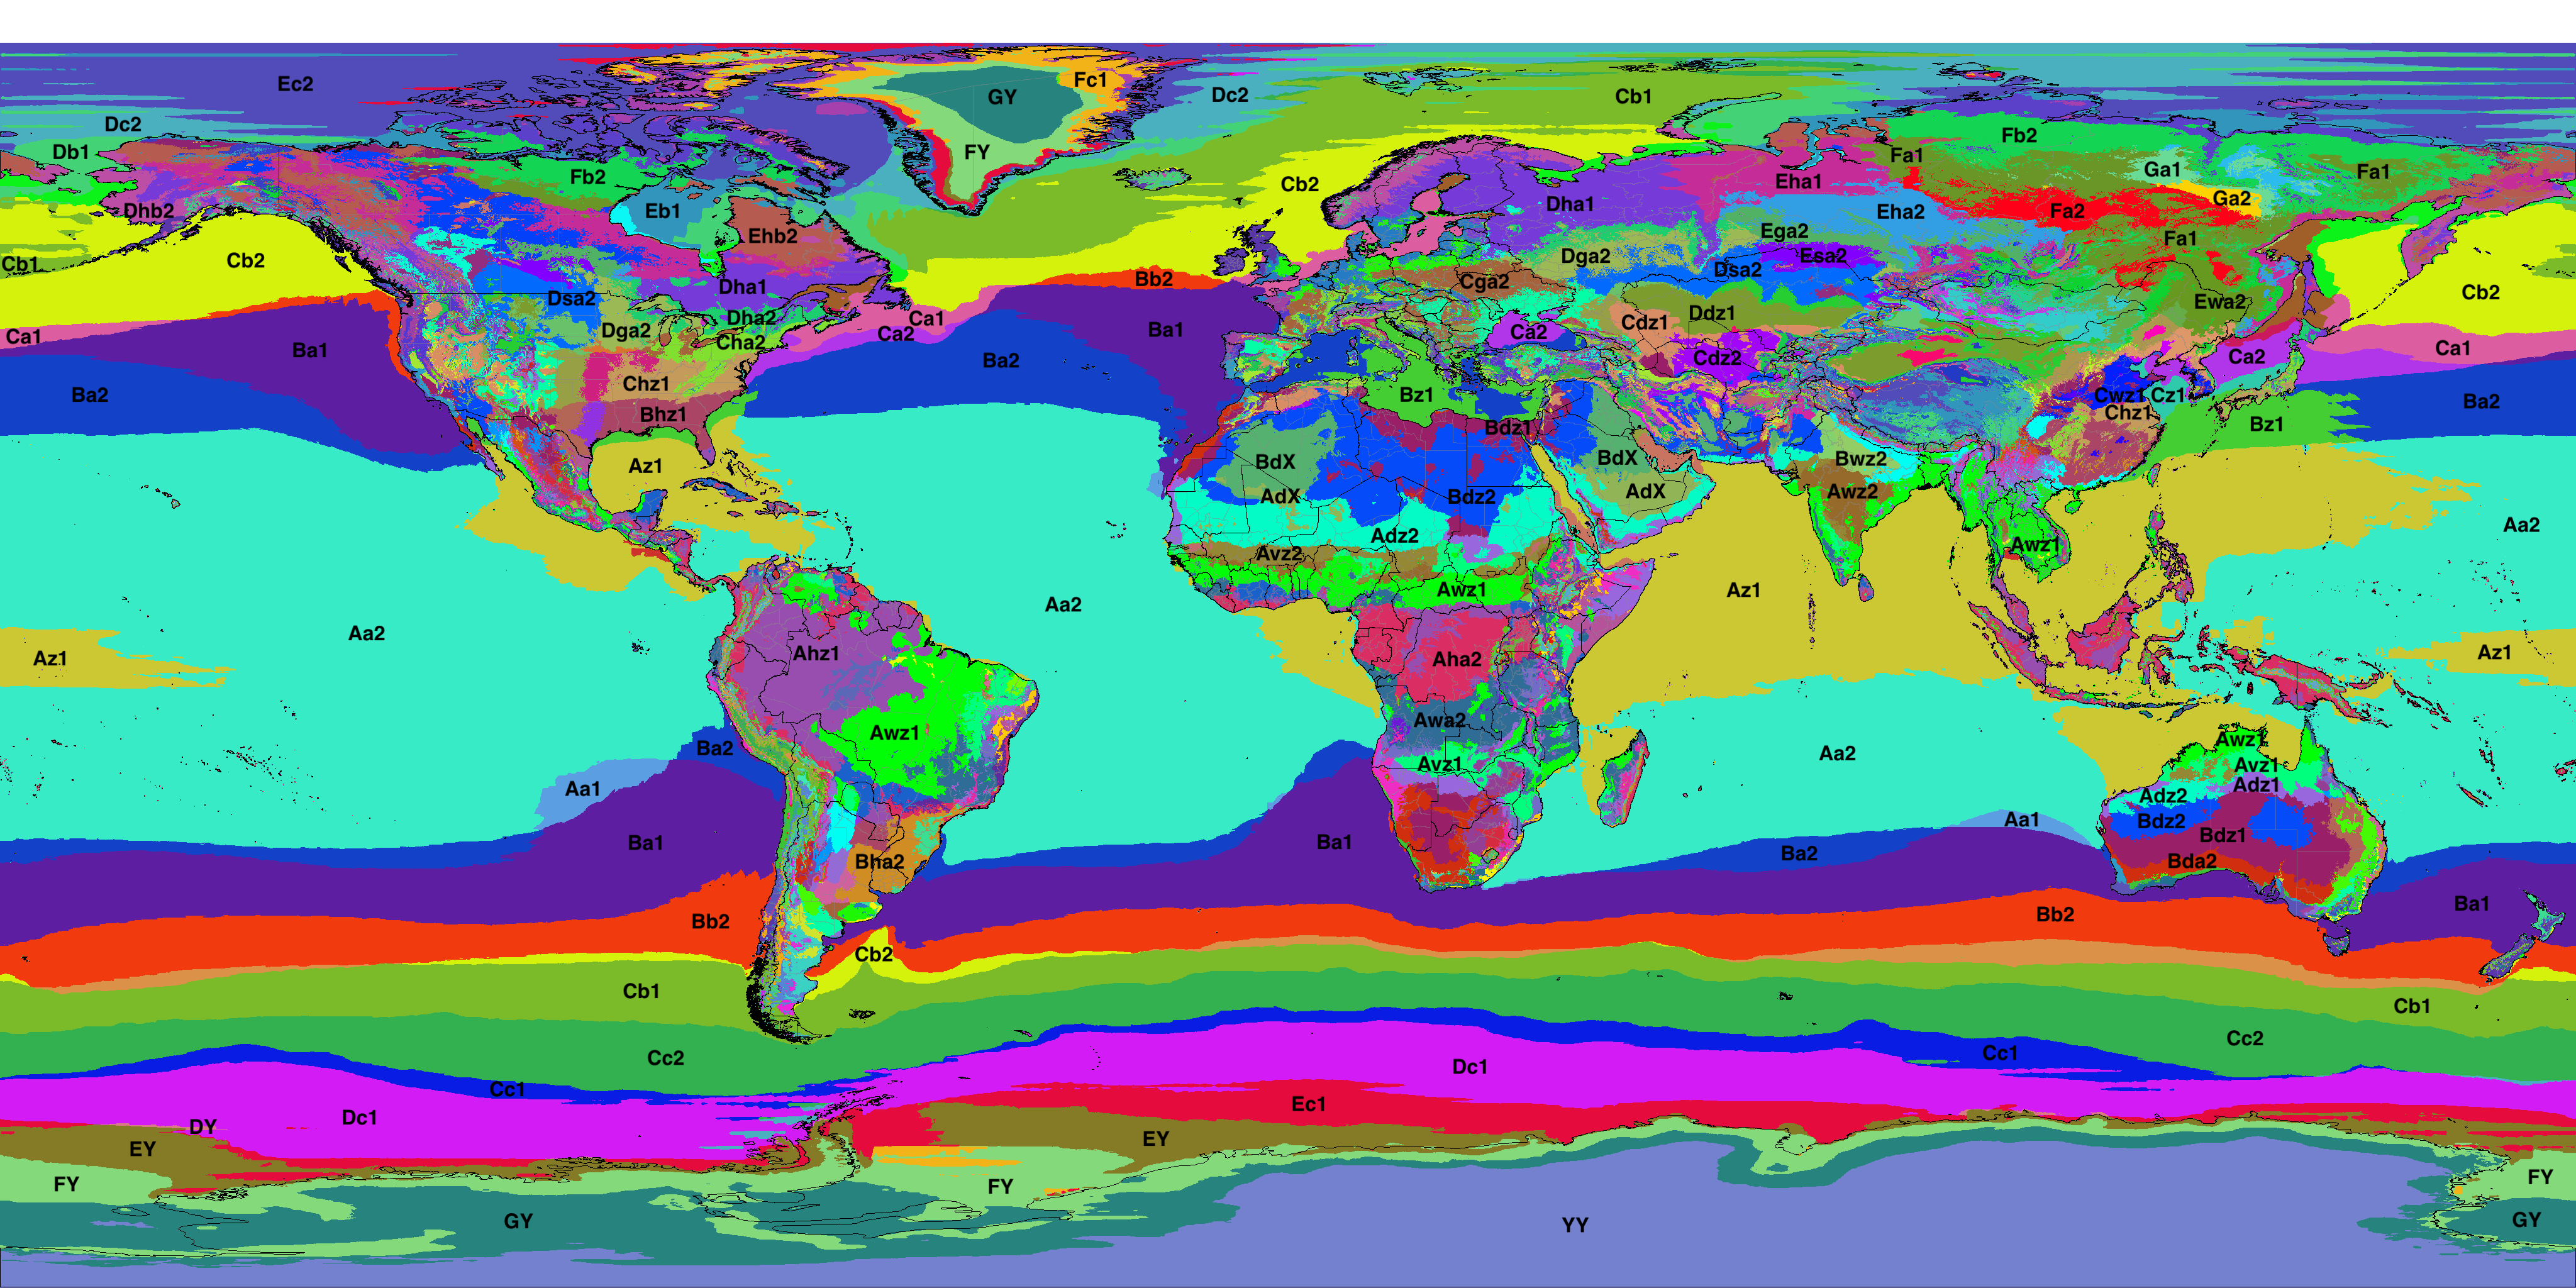
Global distribution of winter categories (projections are SSP5-8.5 high emissions normals)


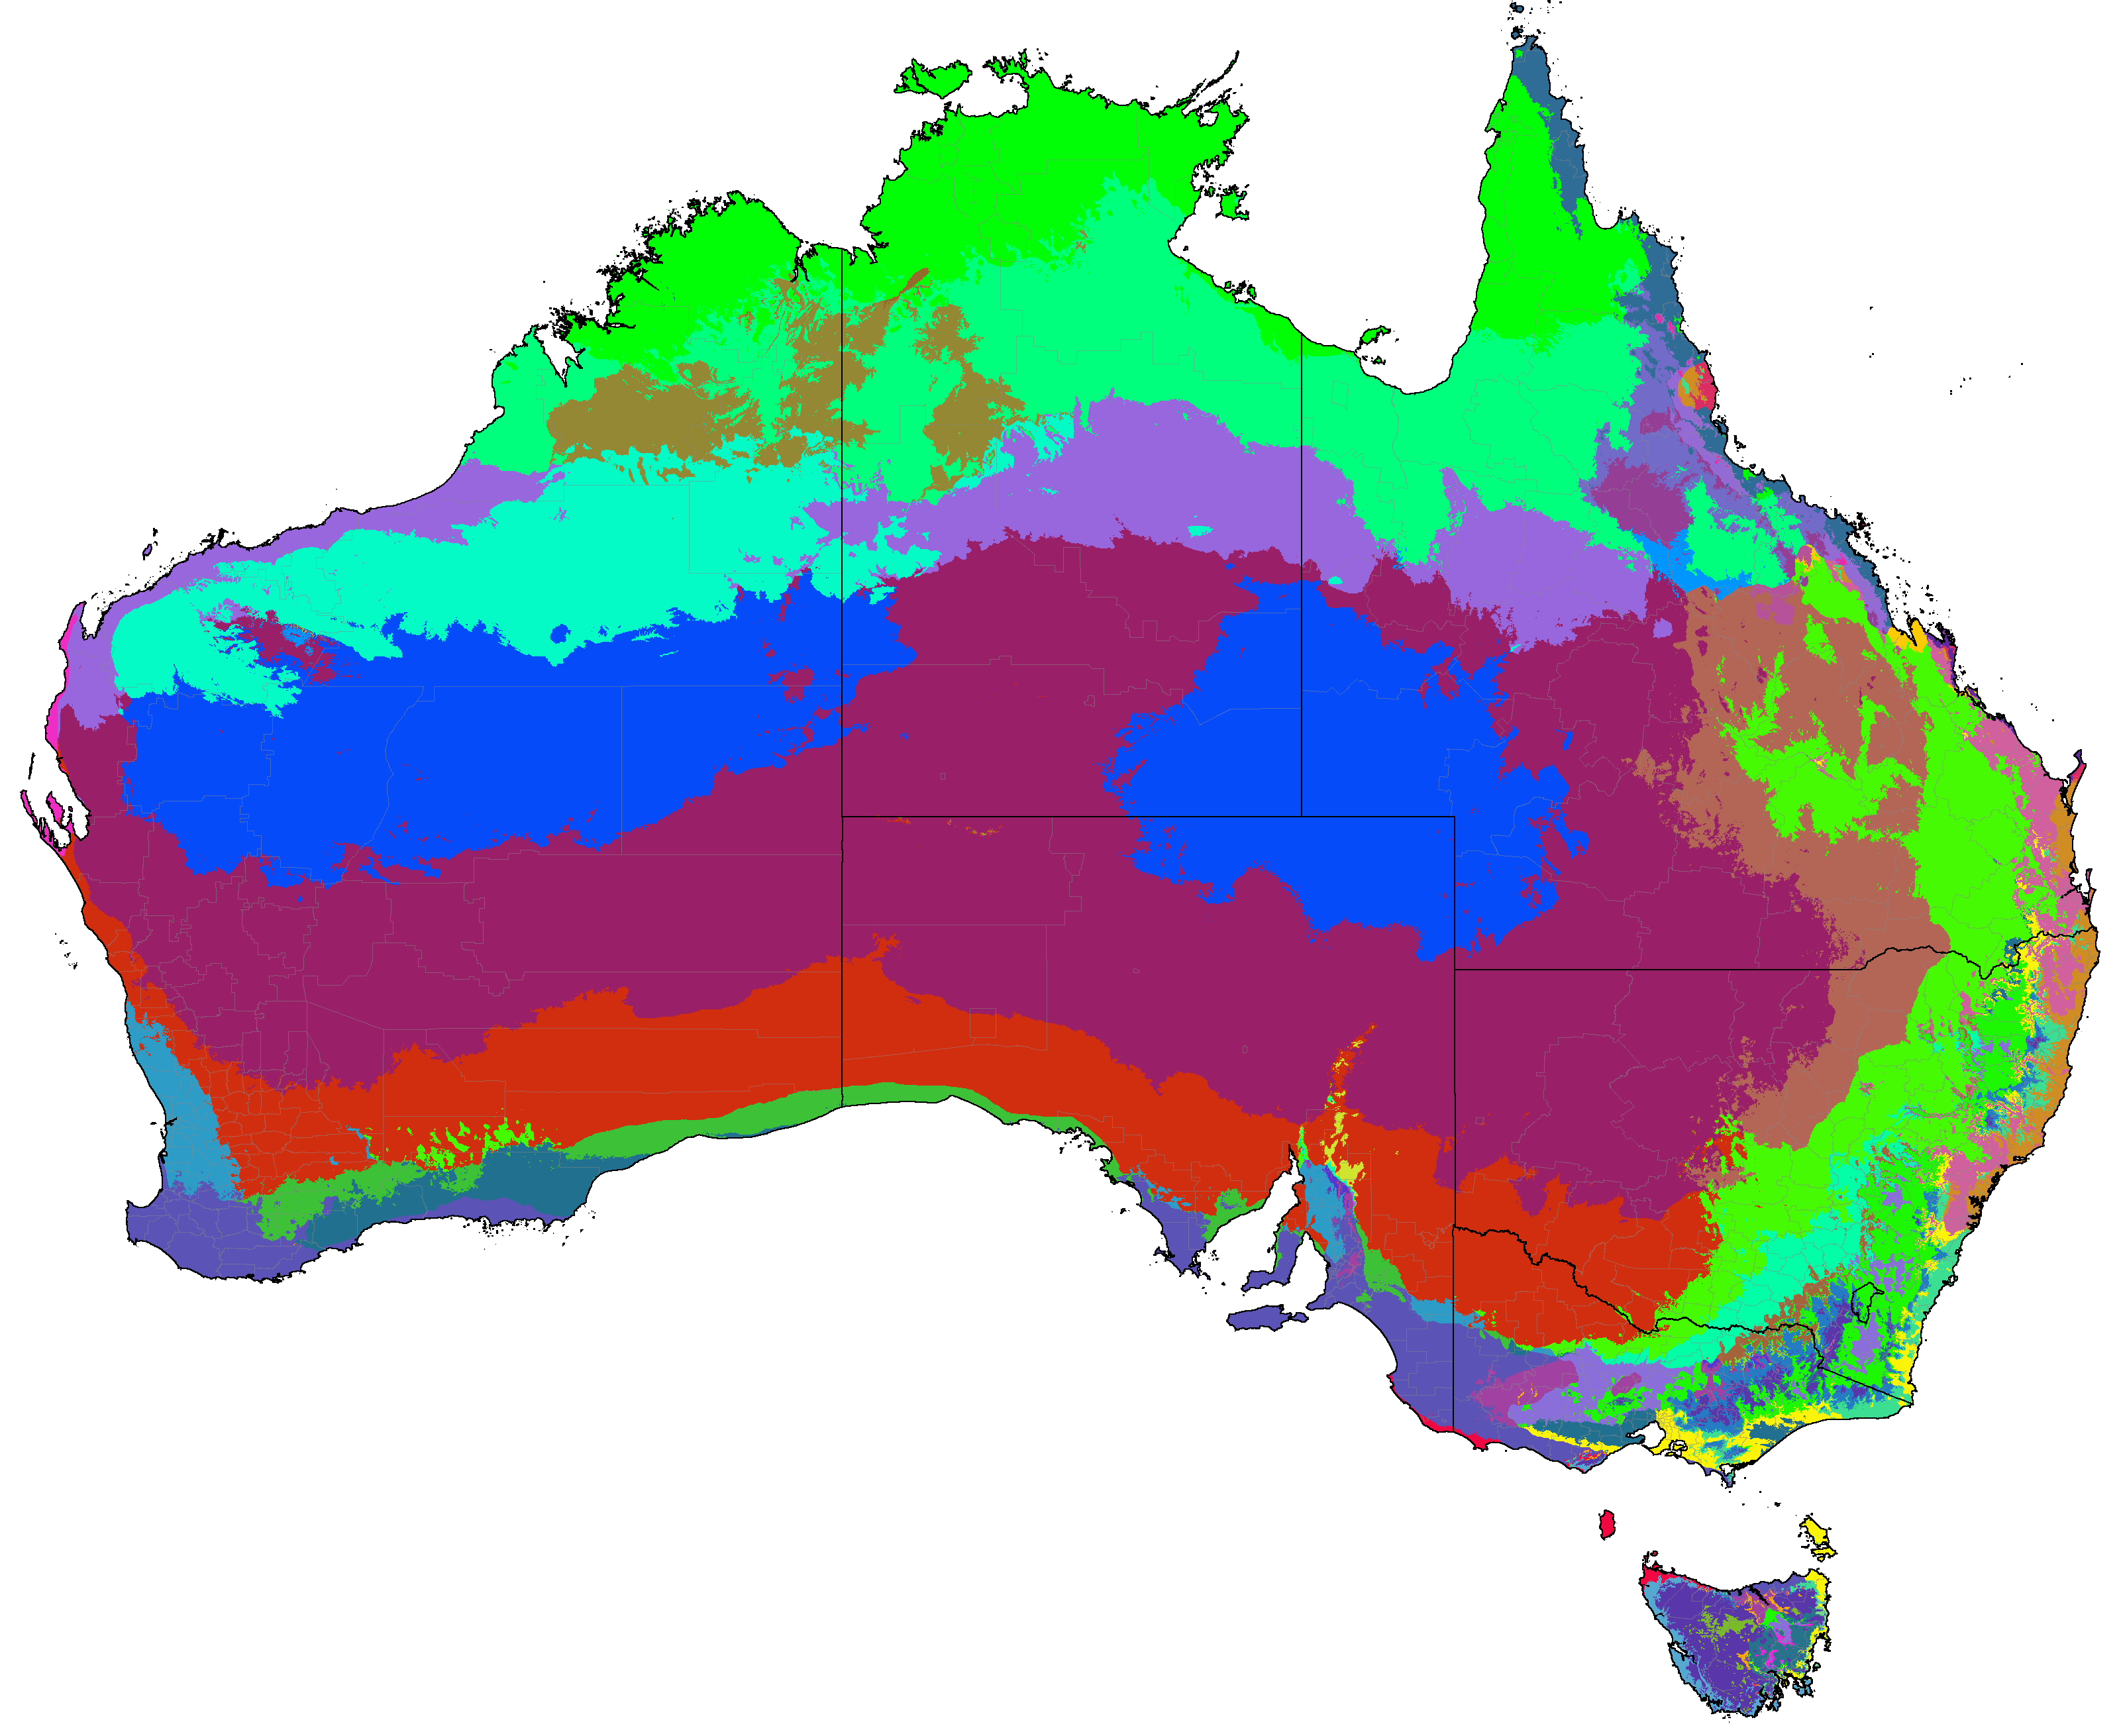
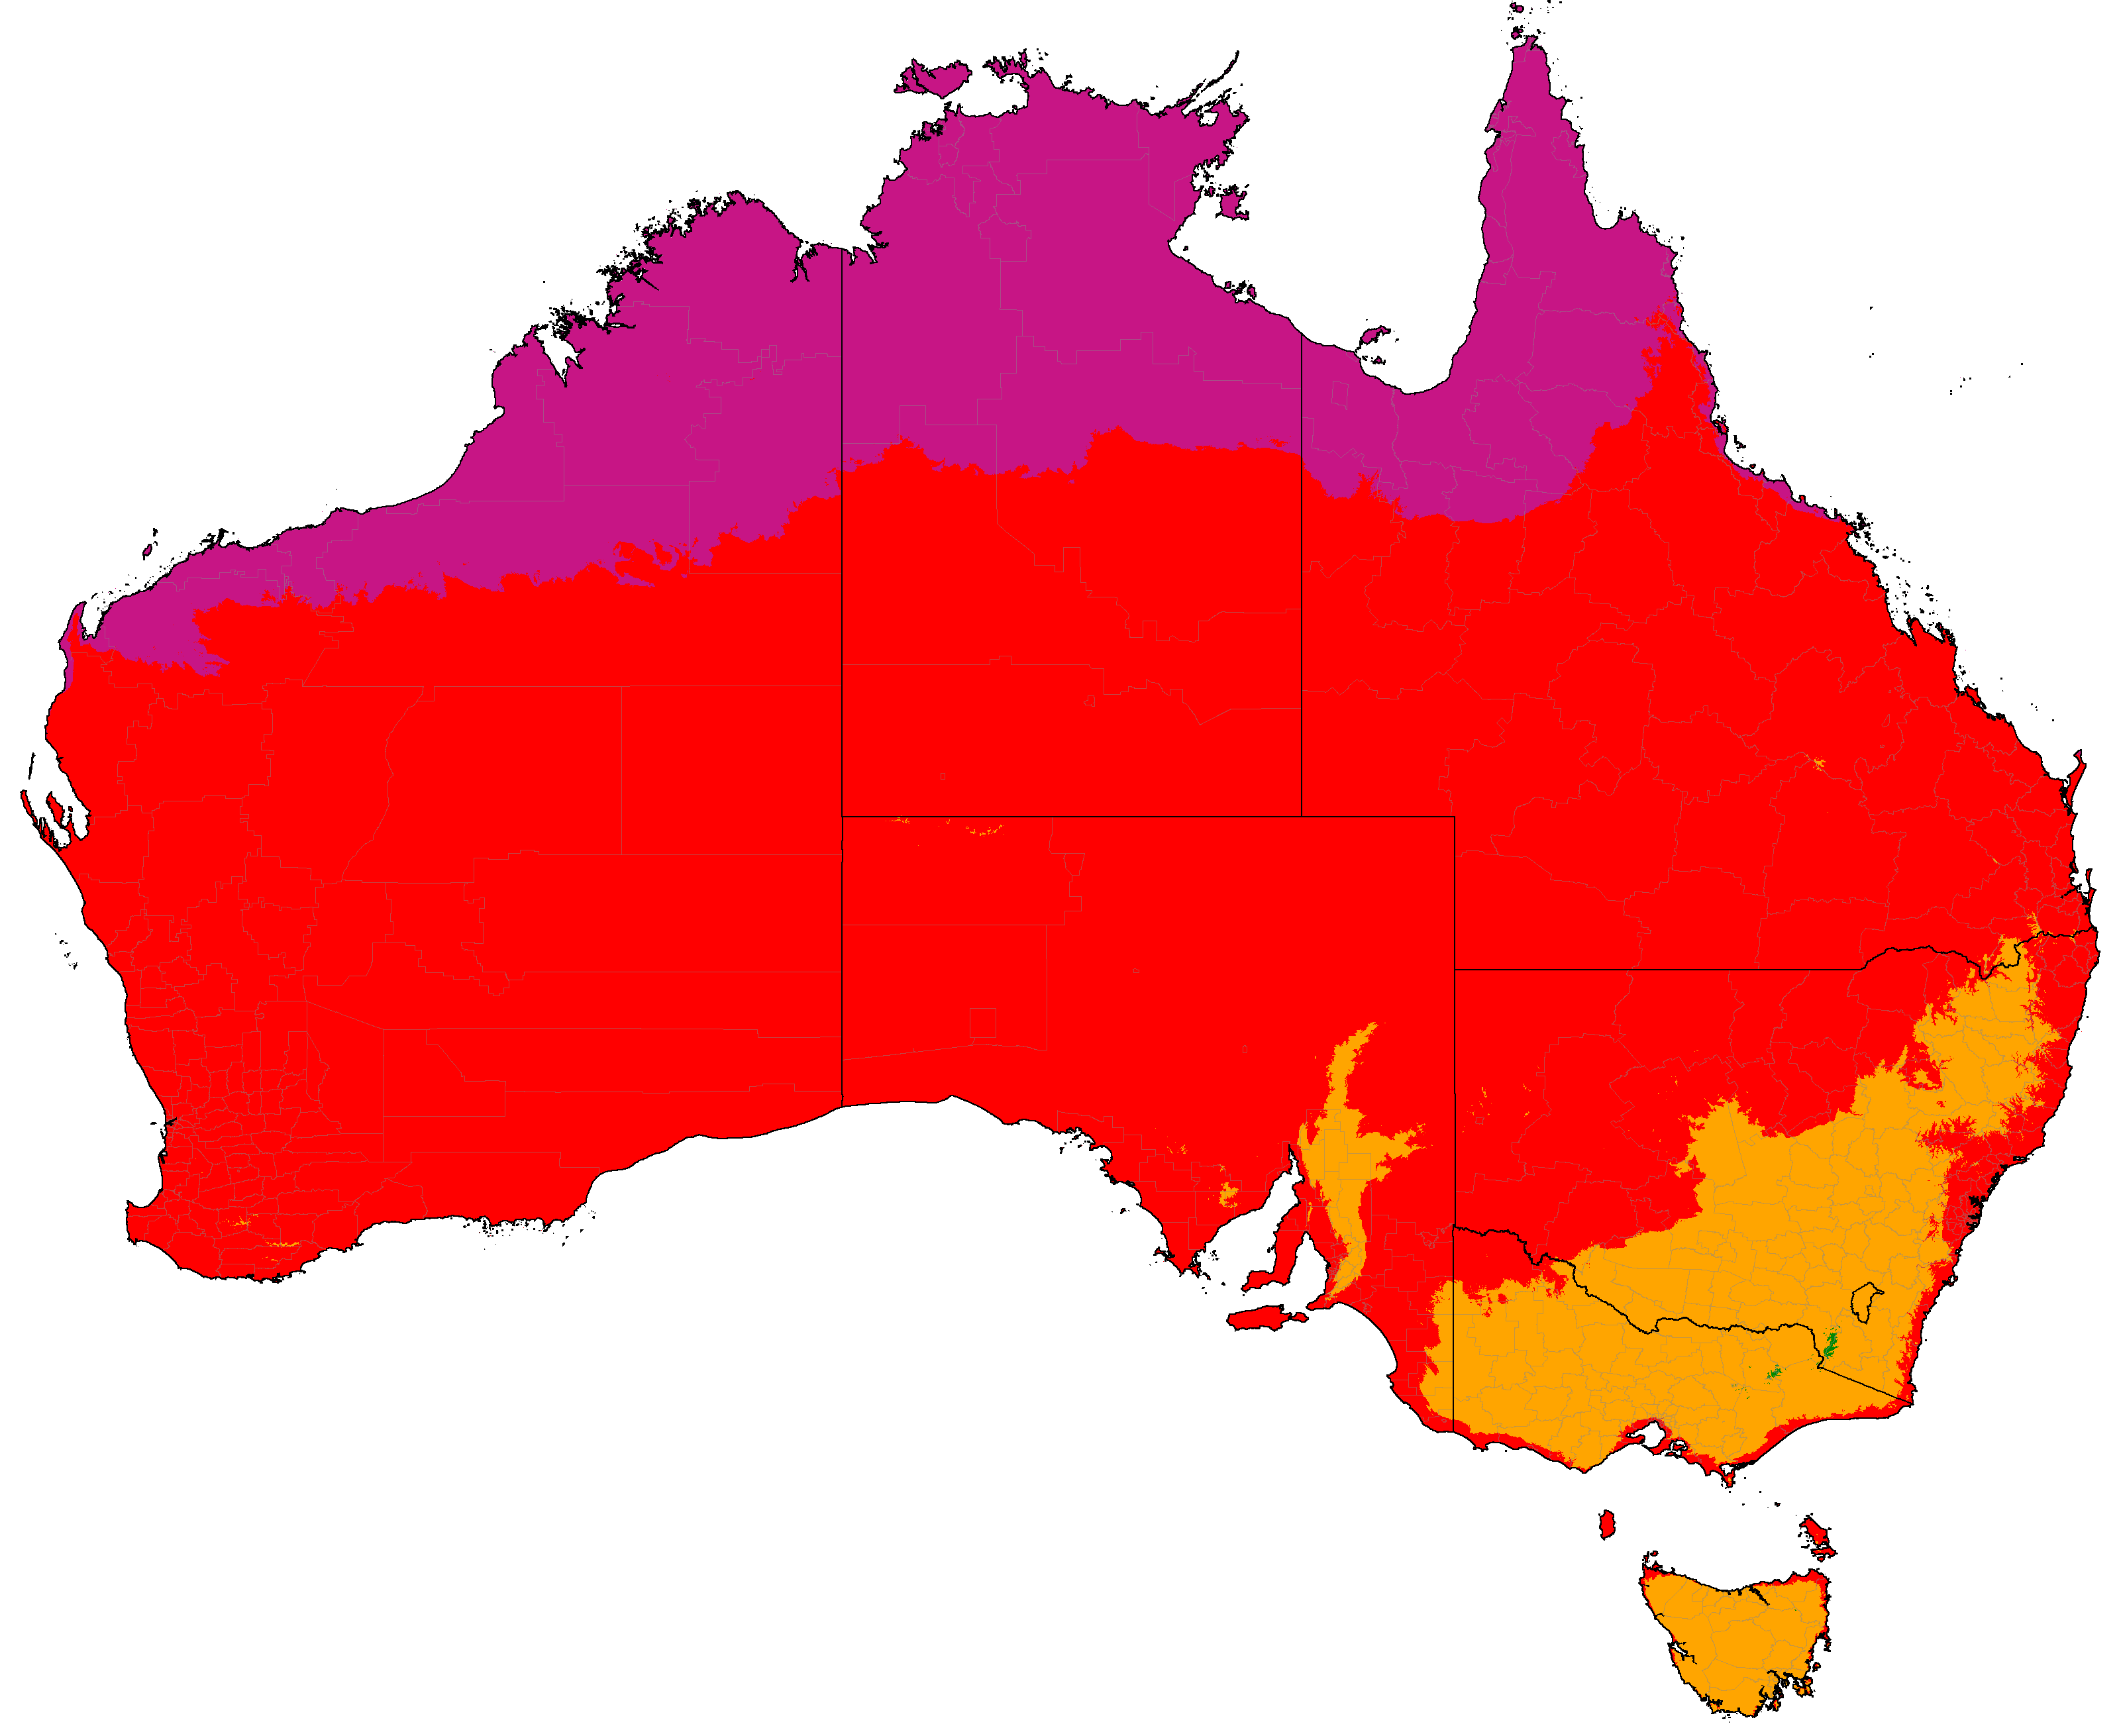
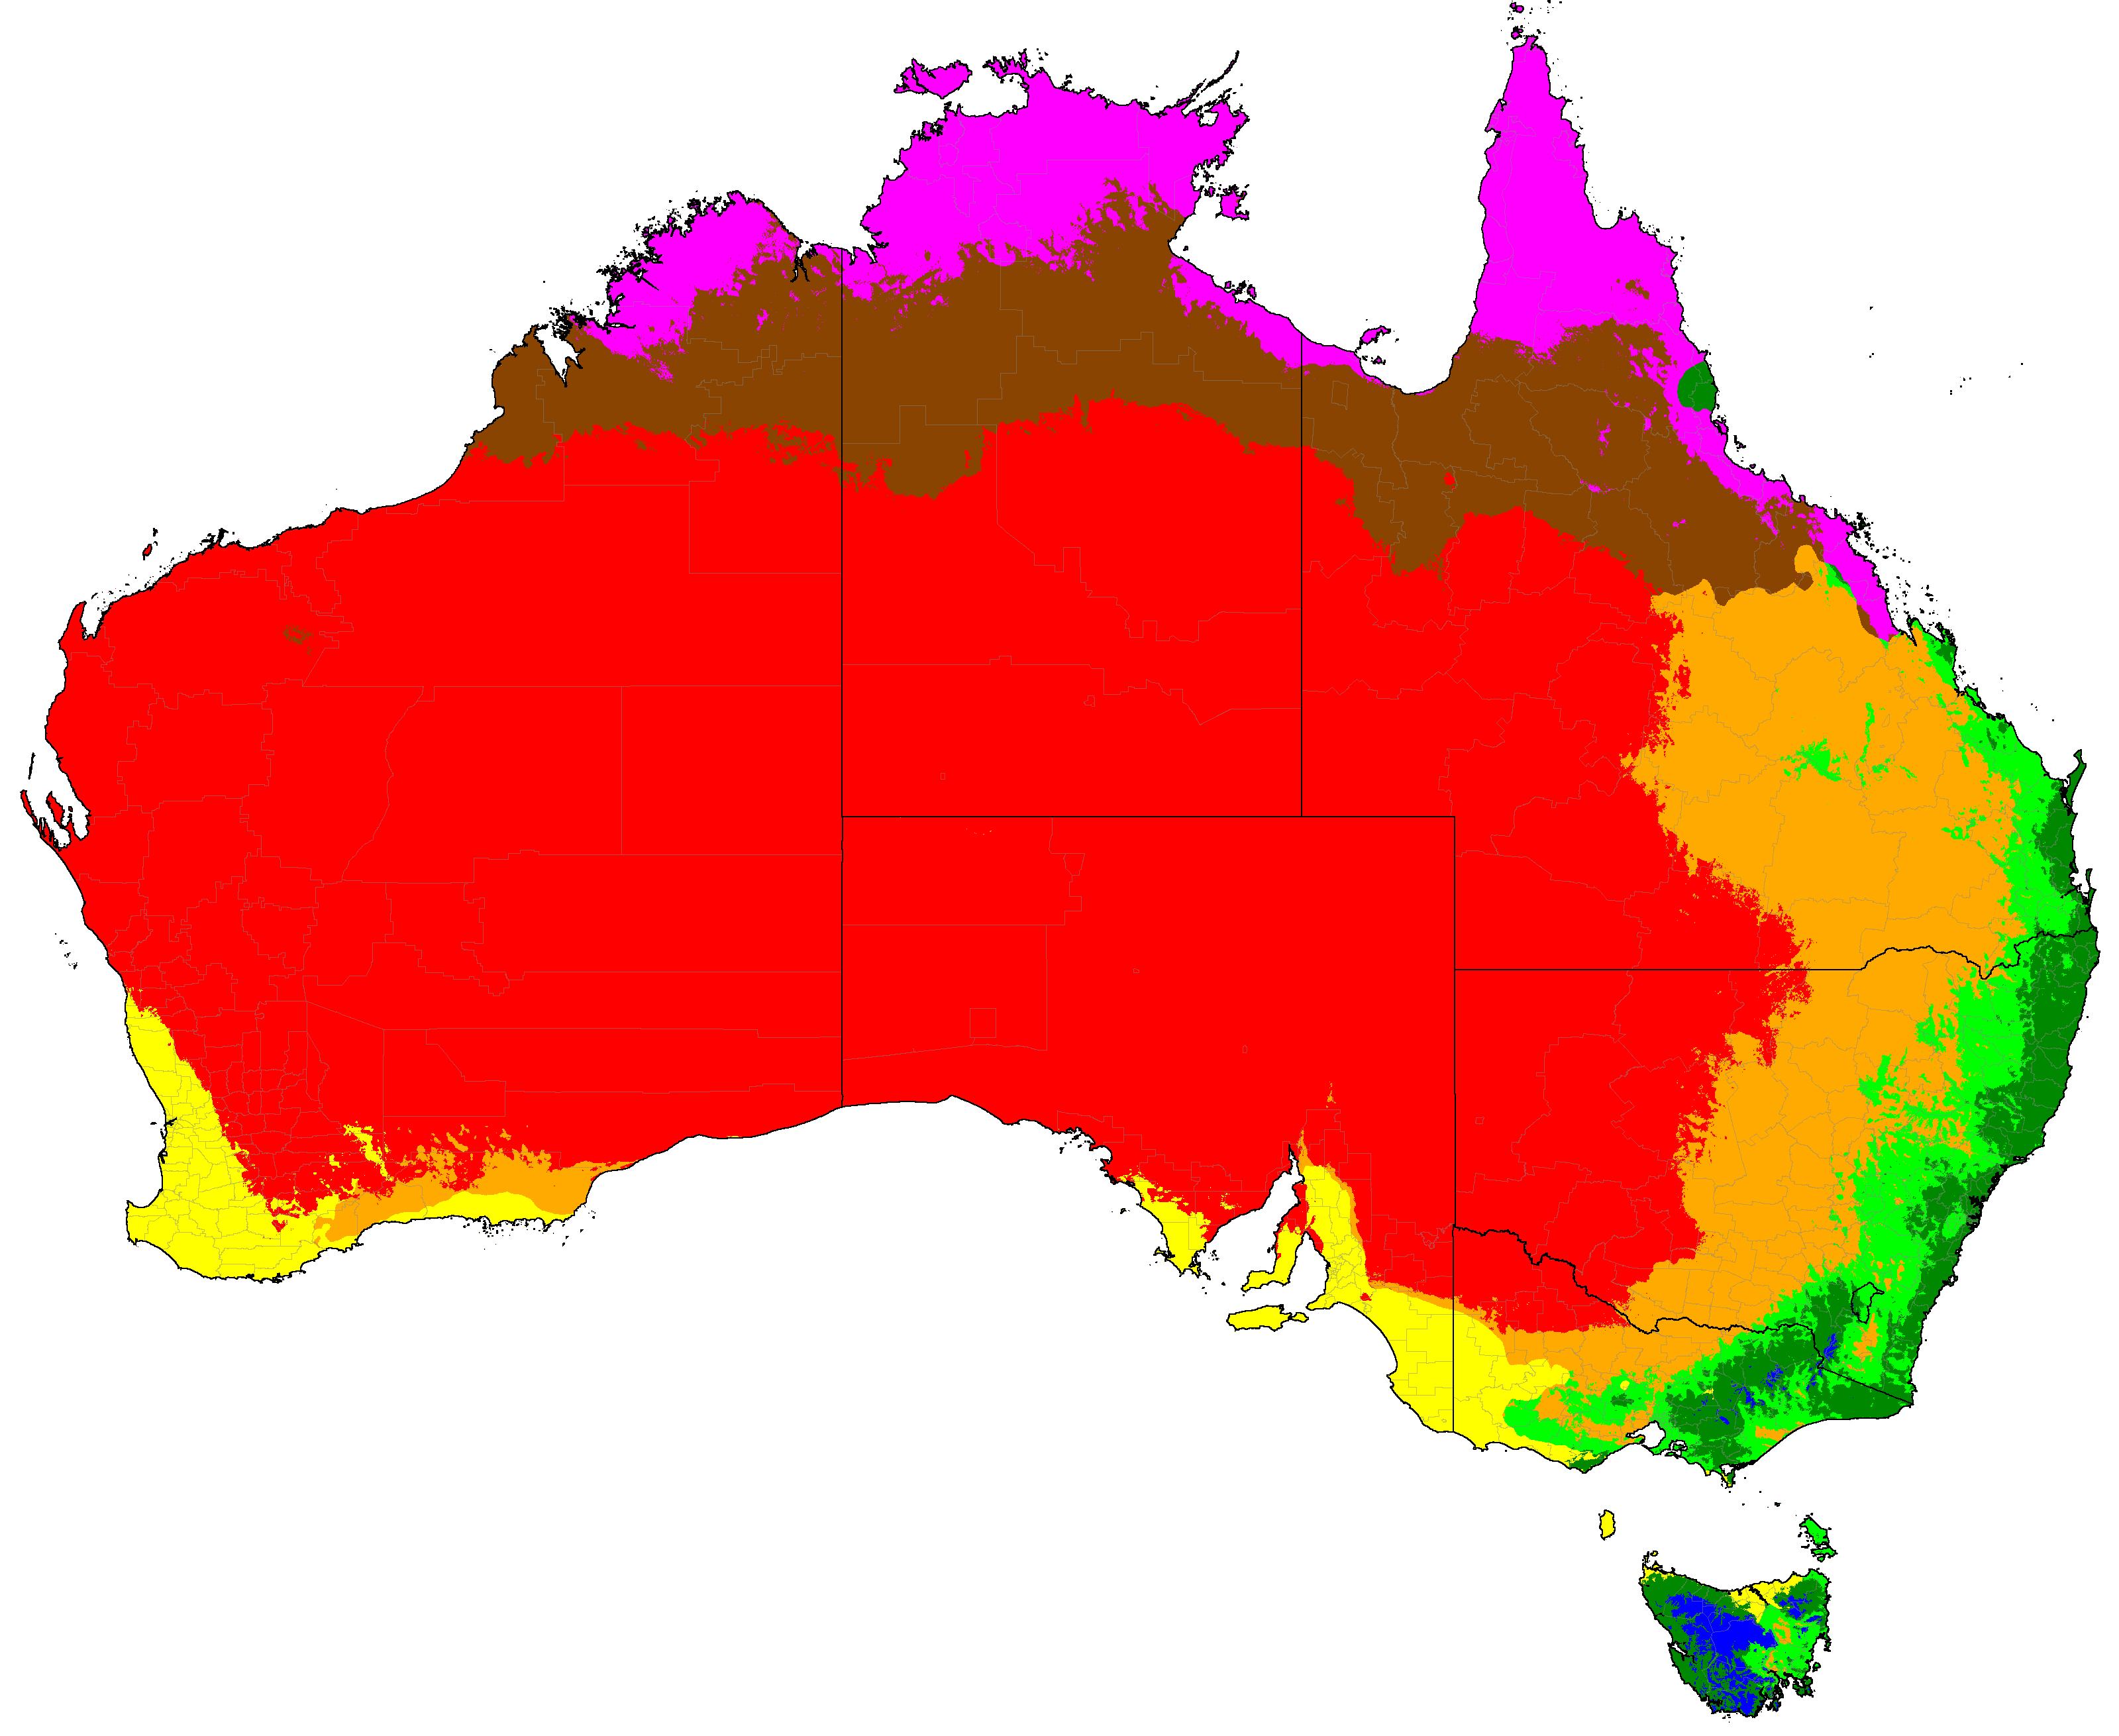
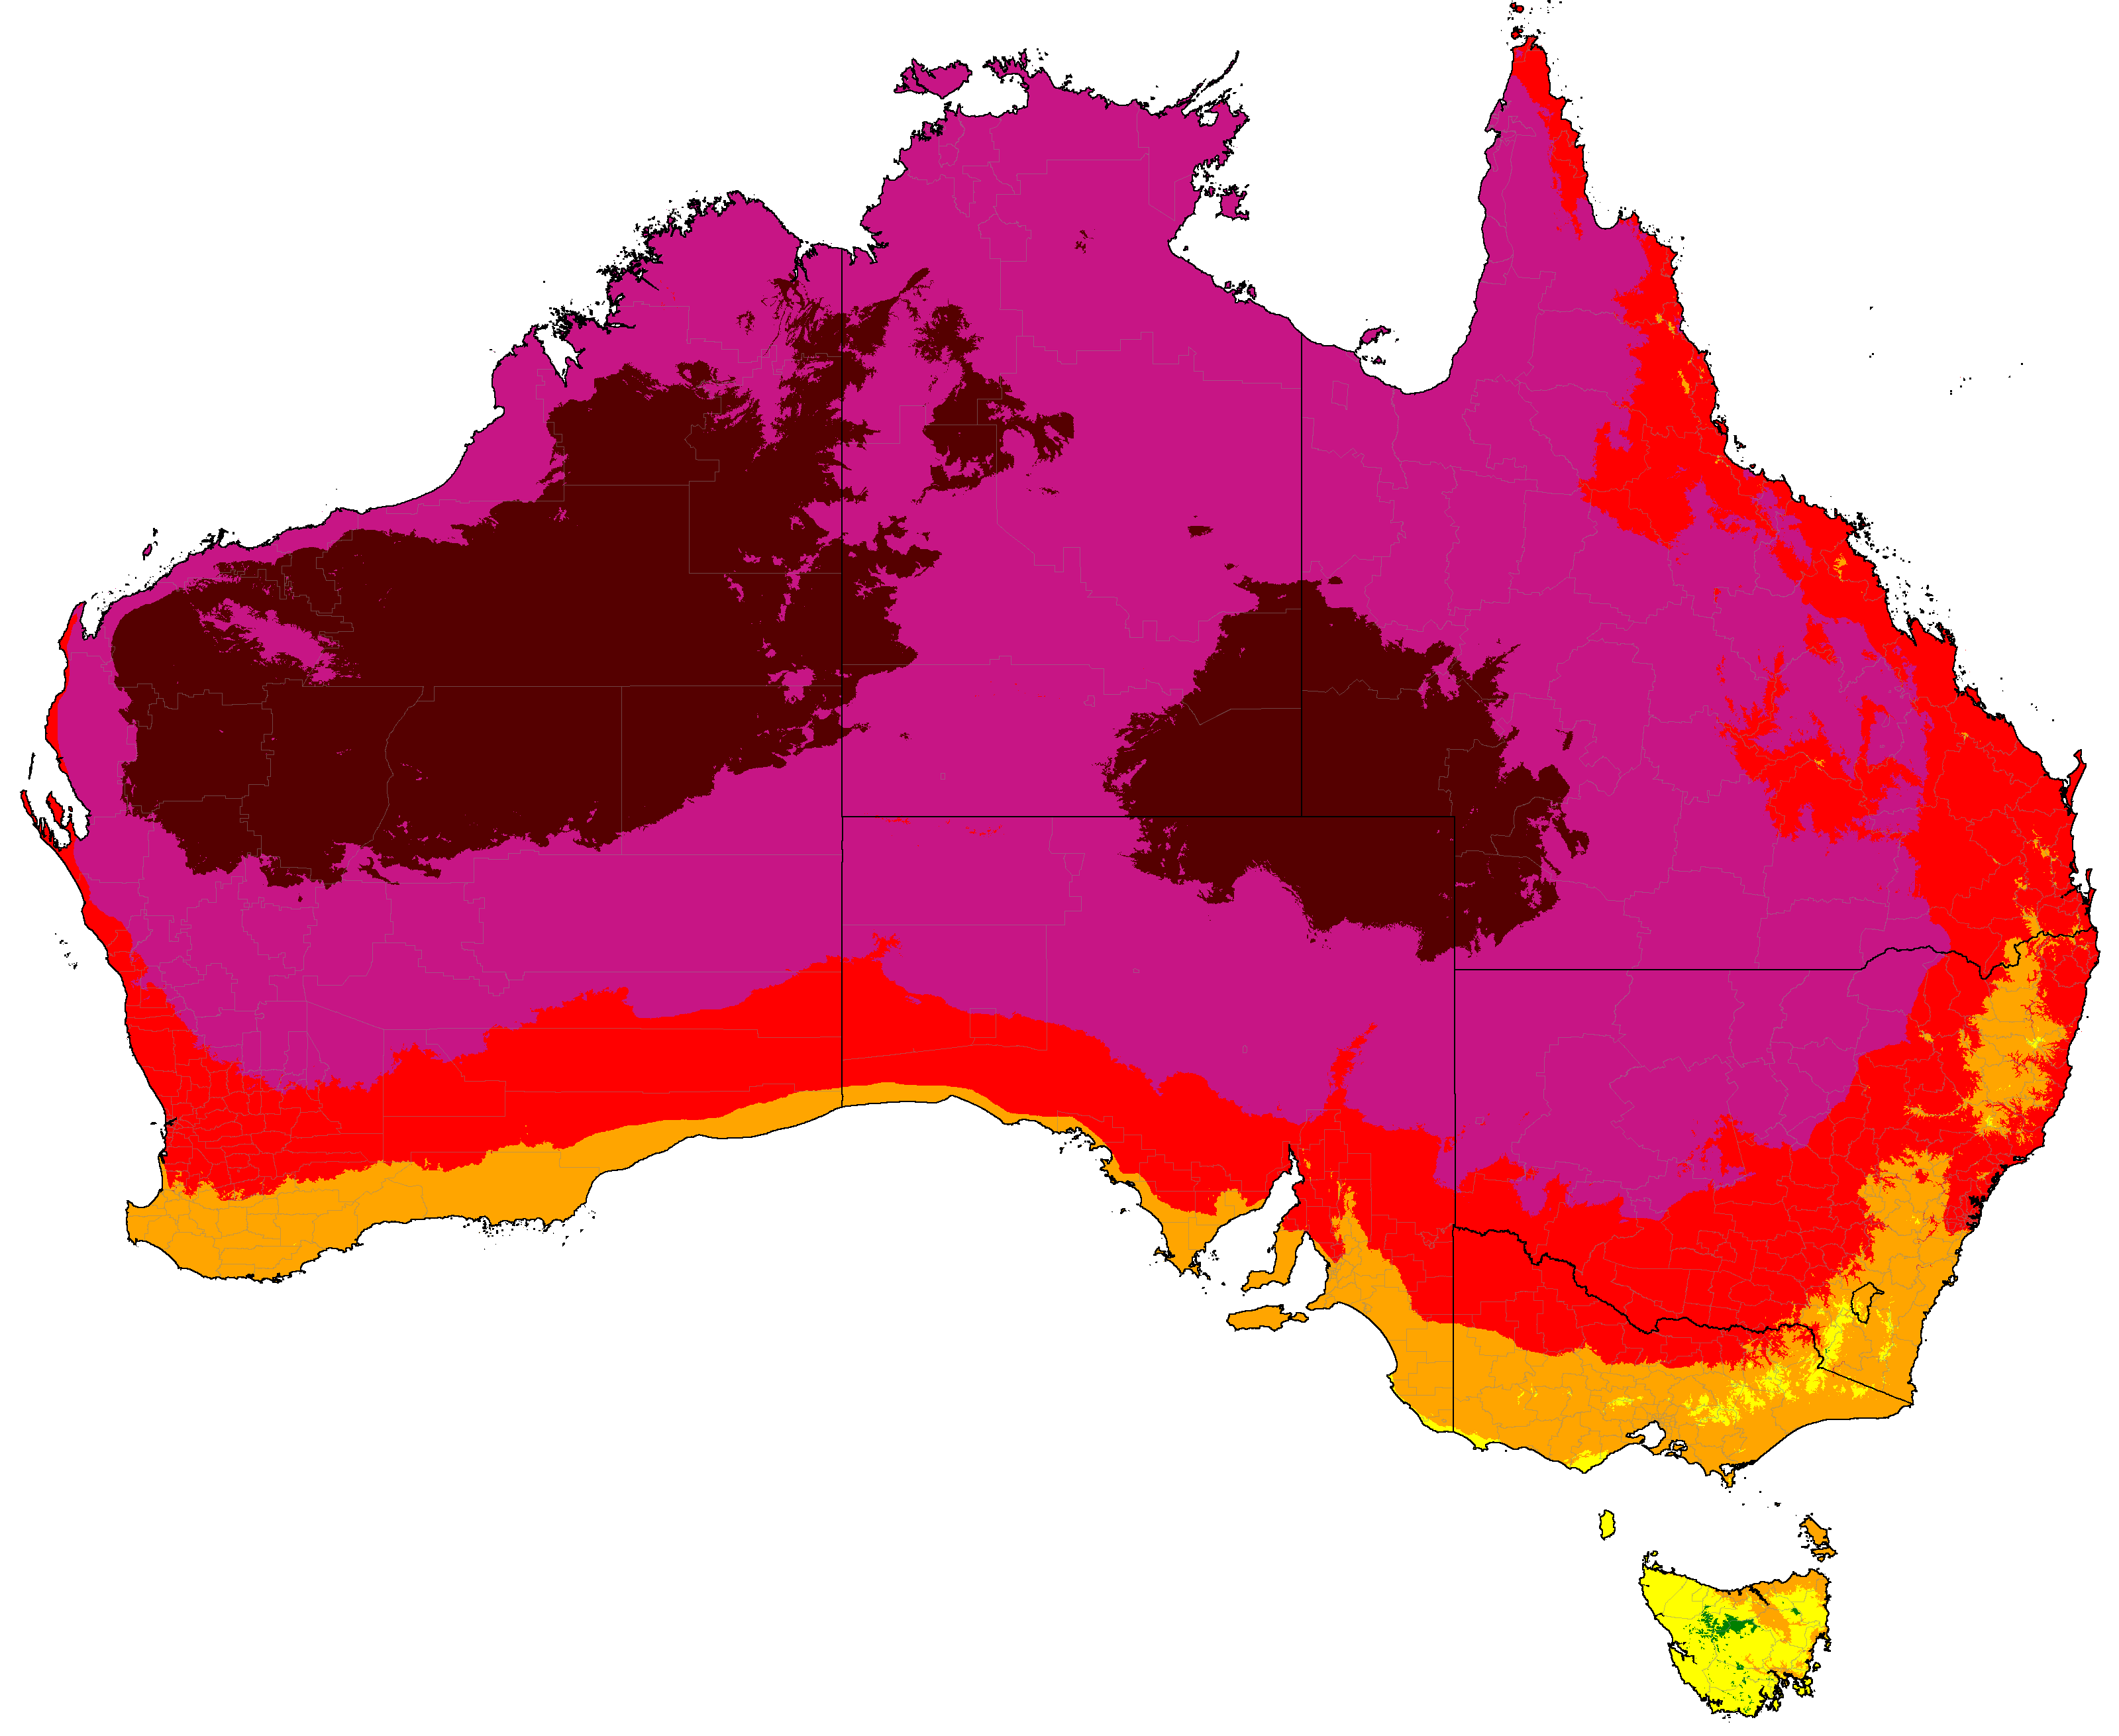
Australia distribution of winter categories (projections are SSP5-8.5 high emissions normals)
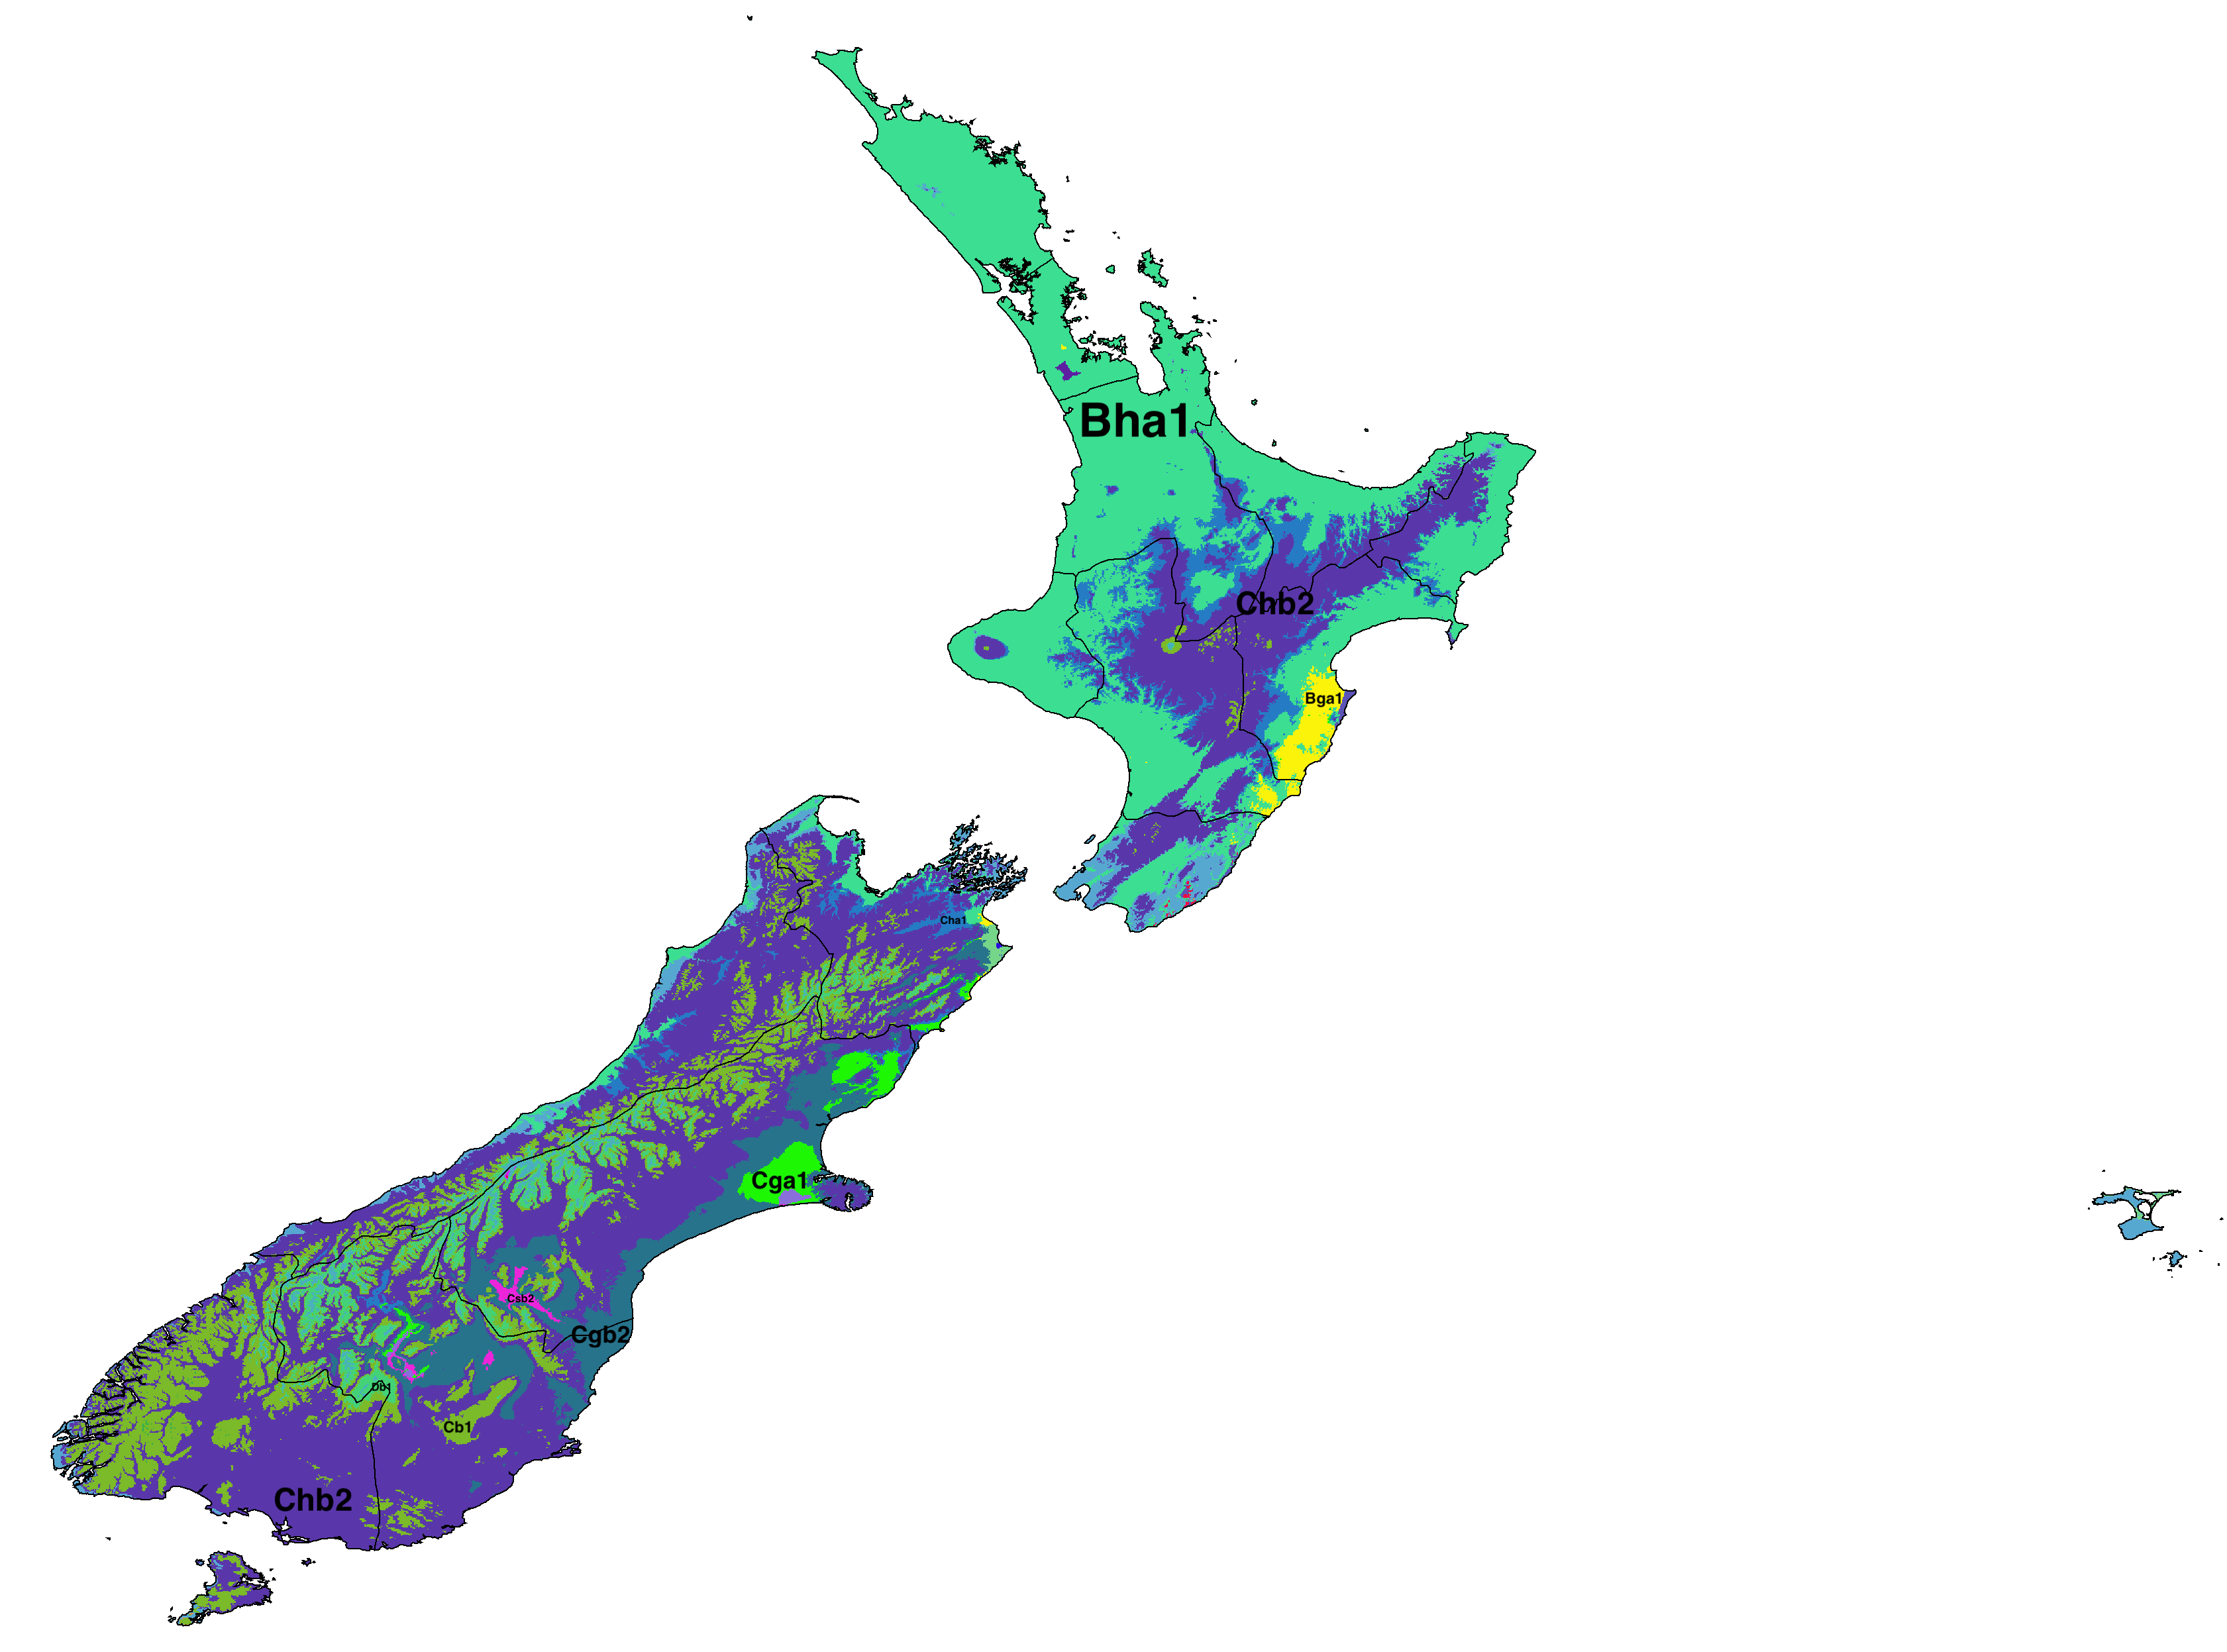
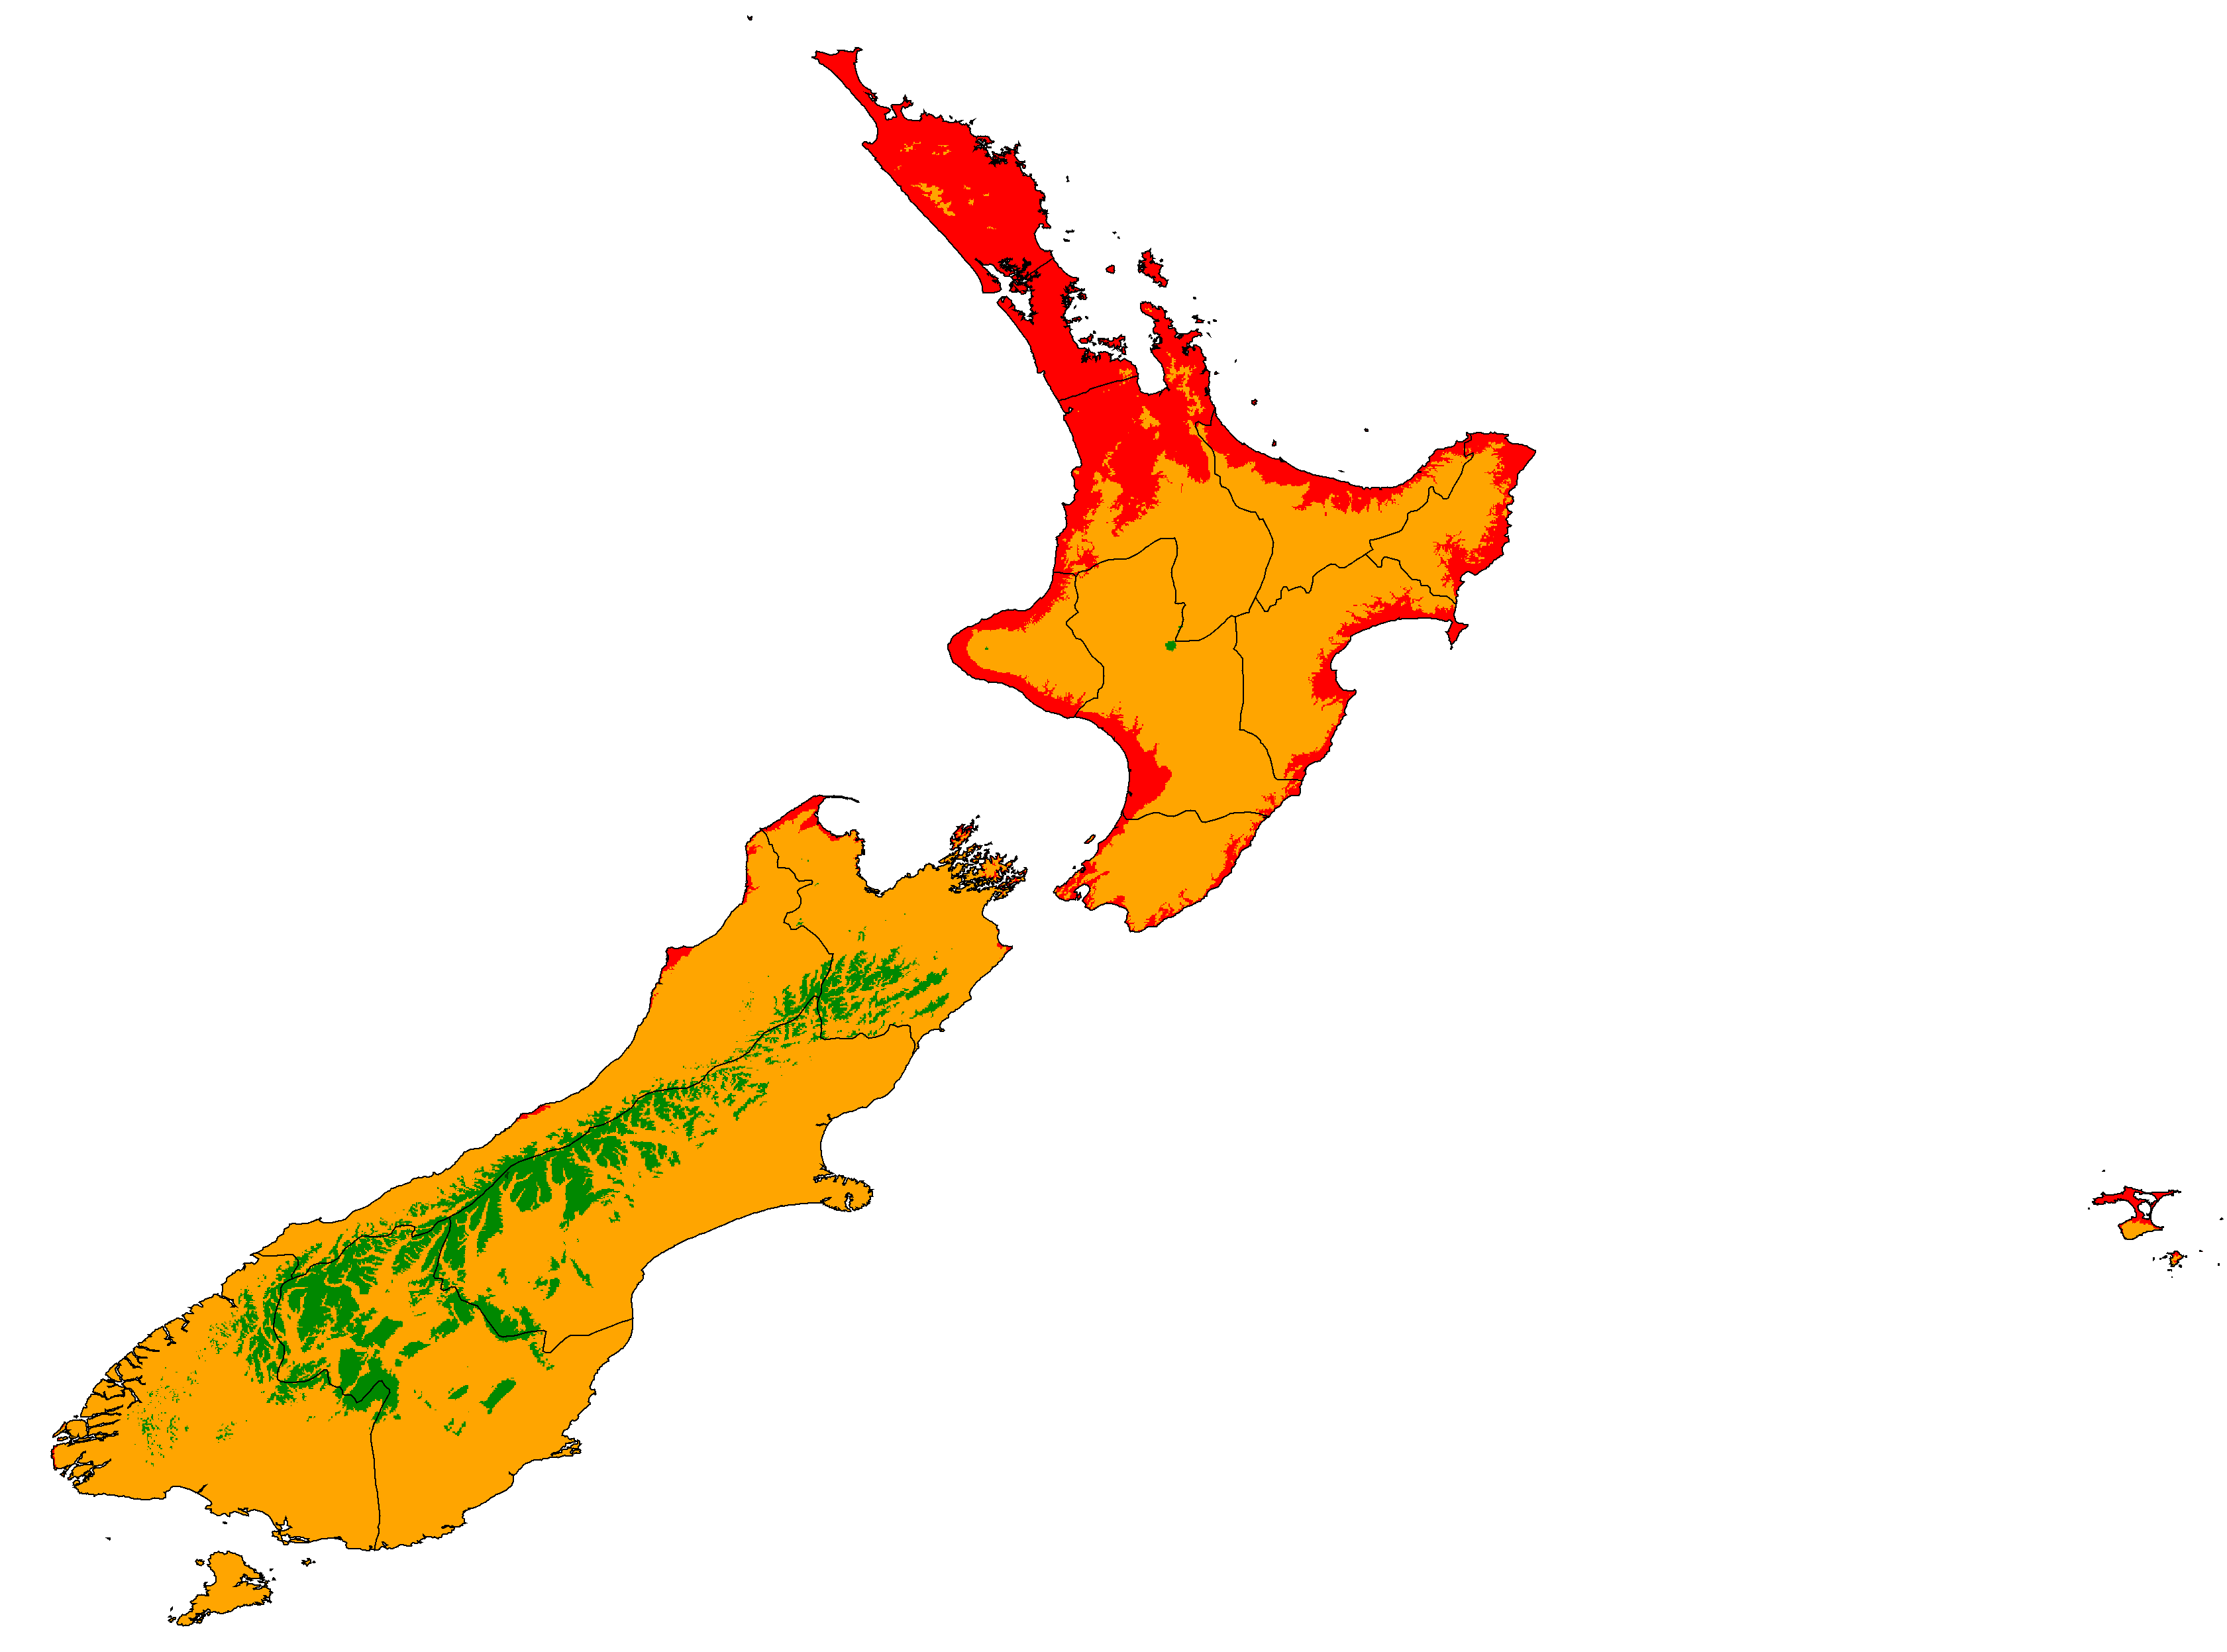
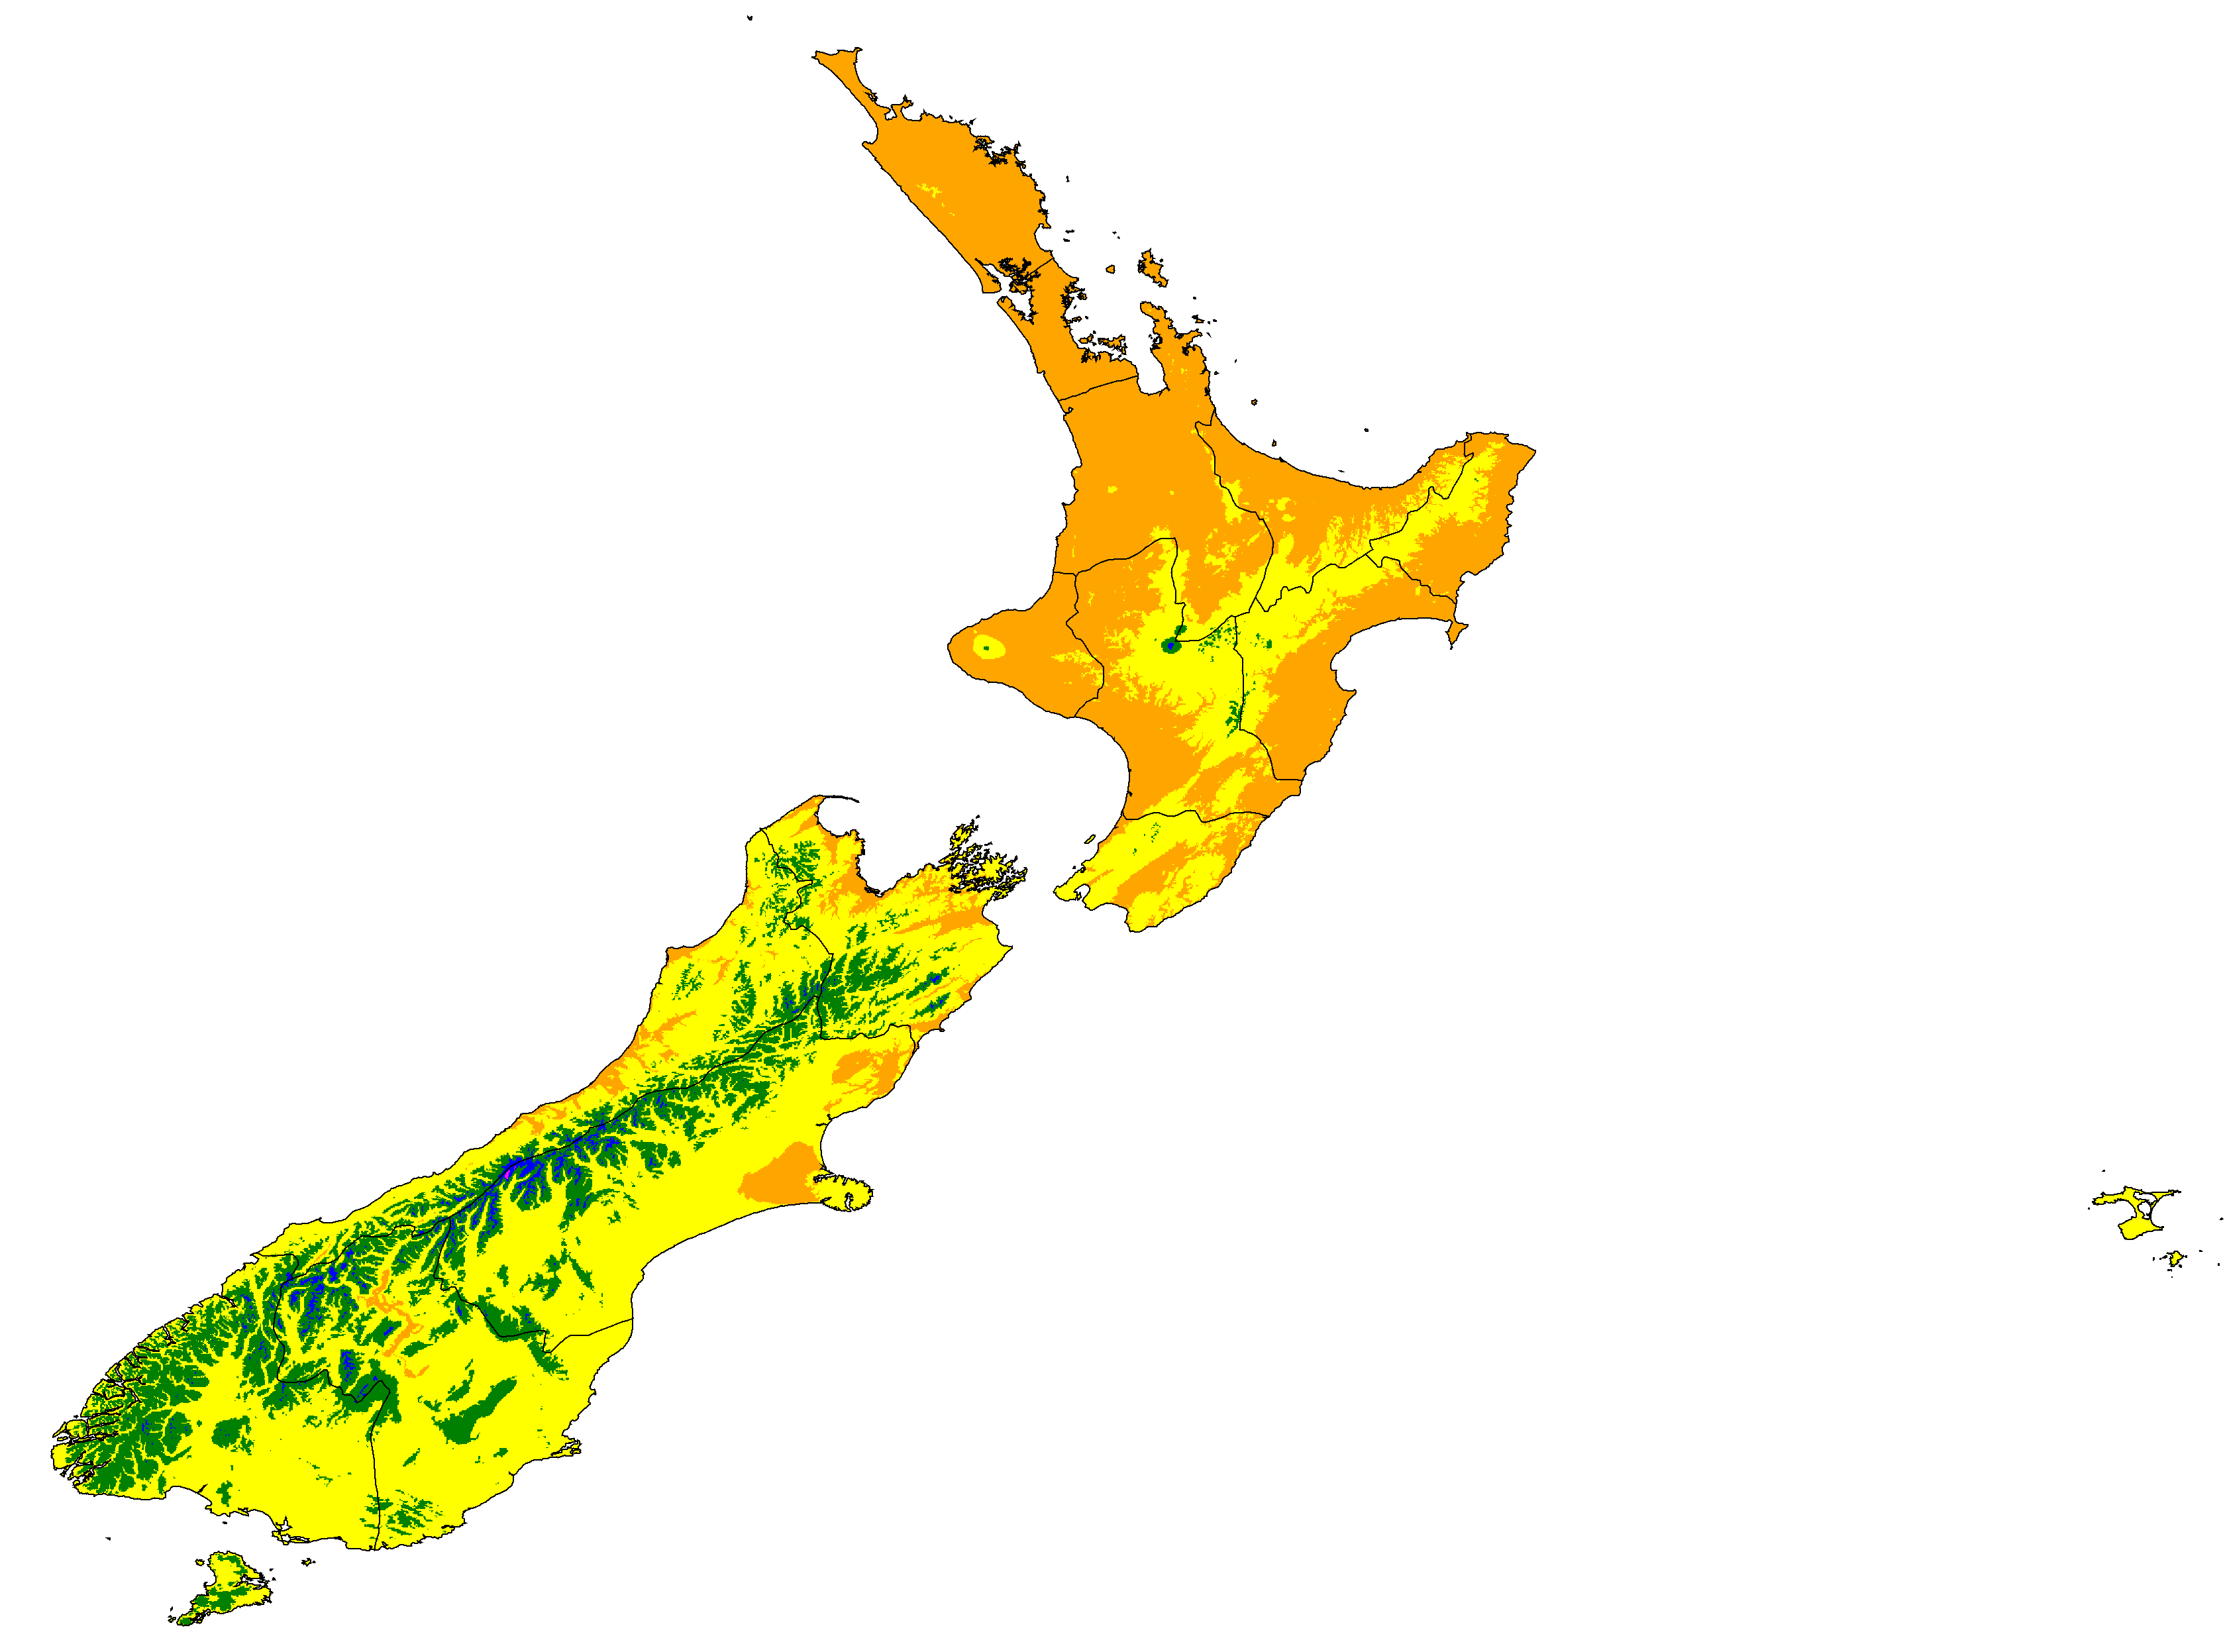
New Zealand distribution of winter categories (projections are SSP5-8.5 high emissions normals)
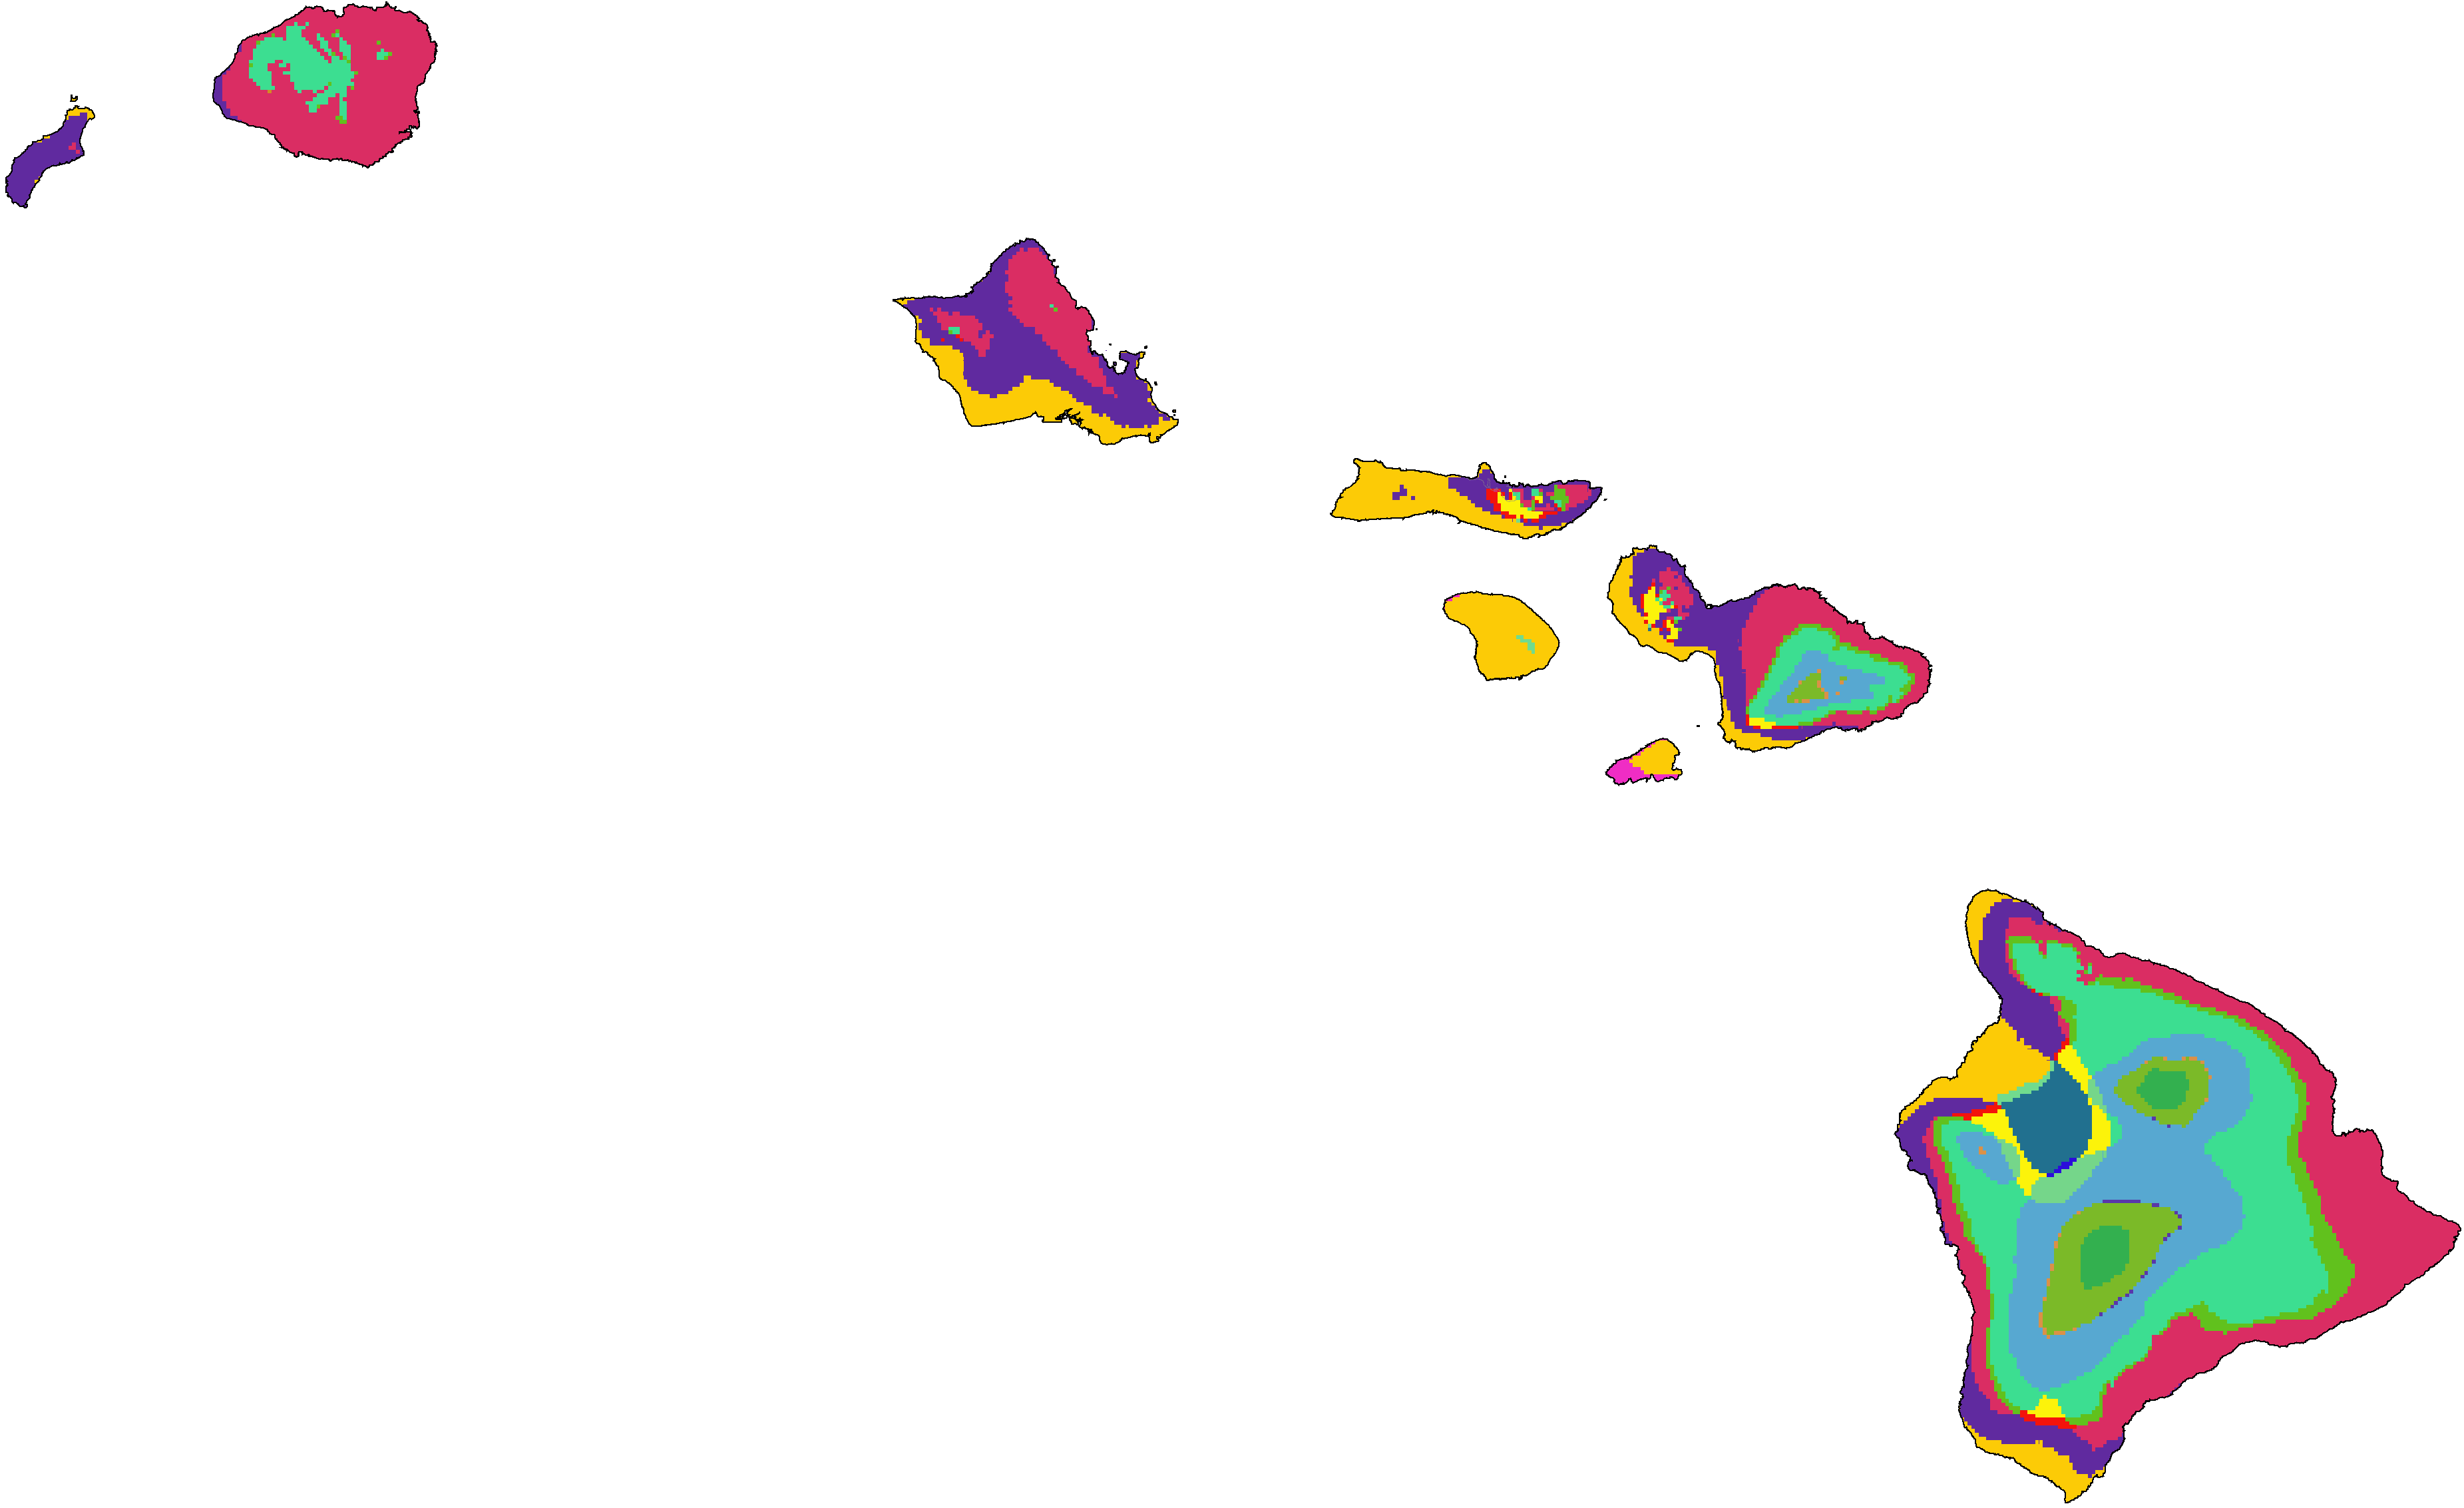
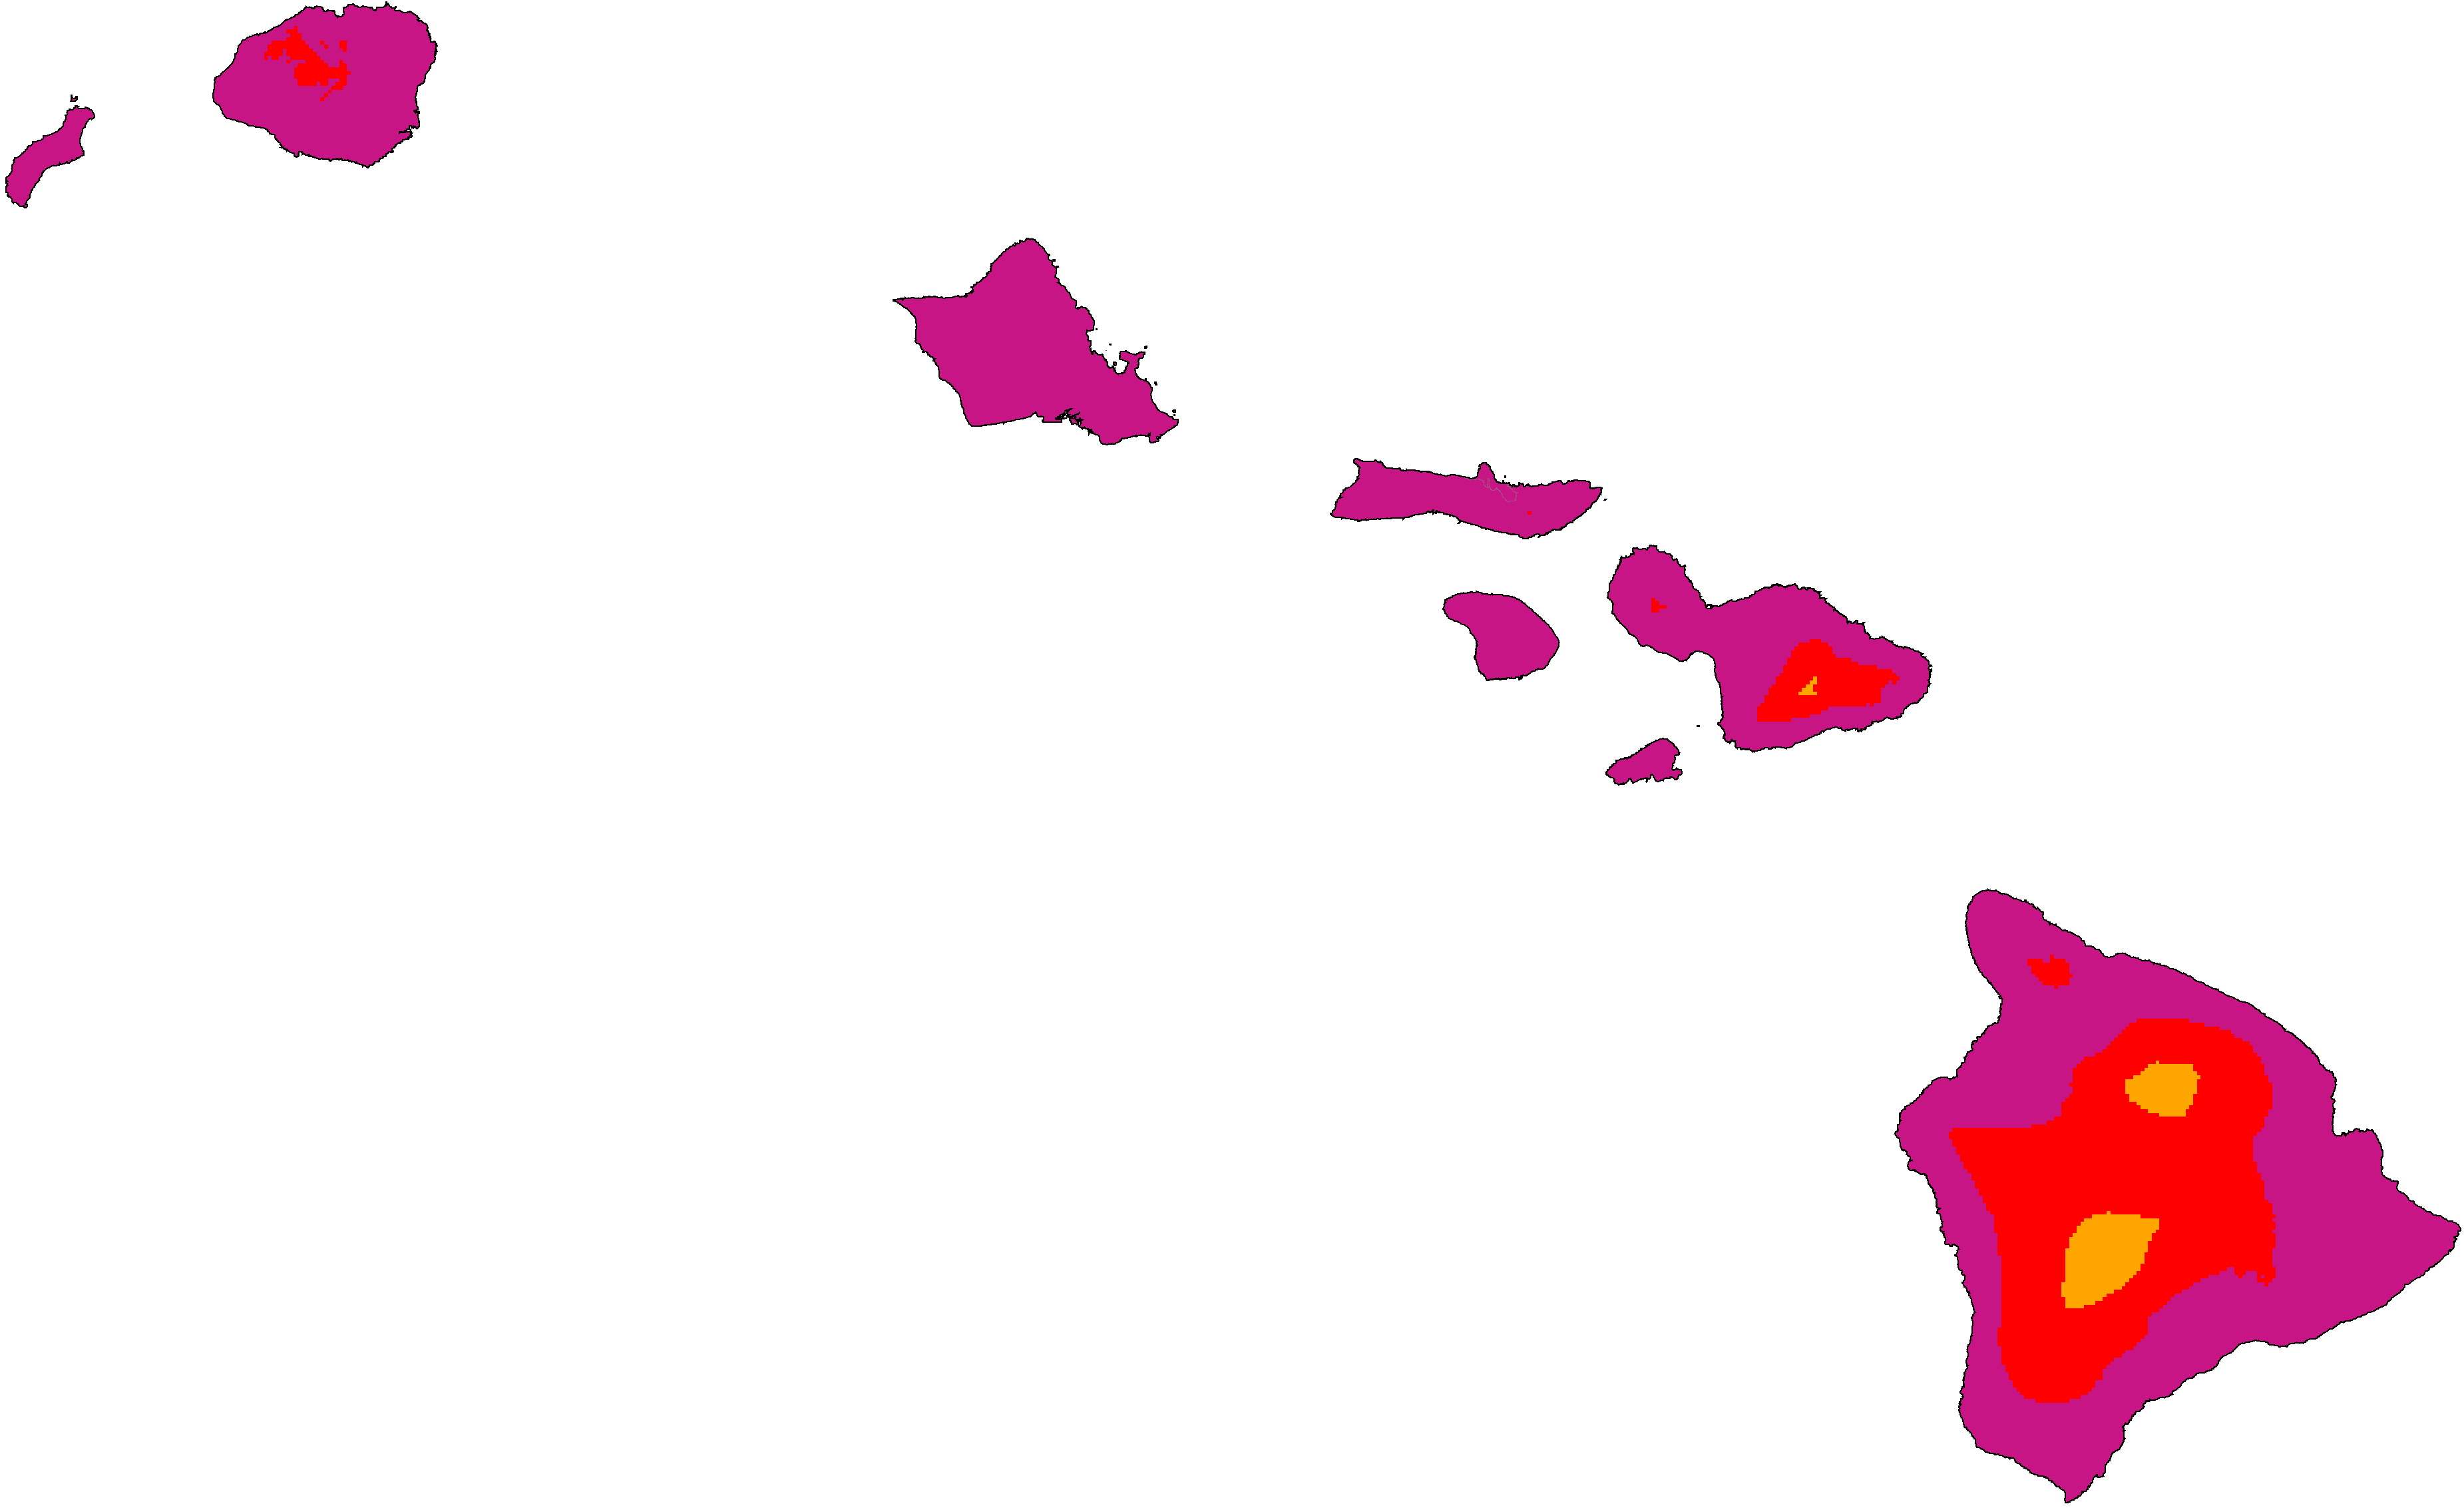
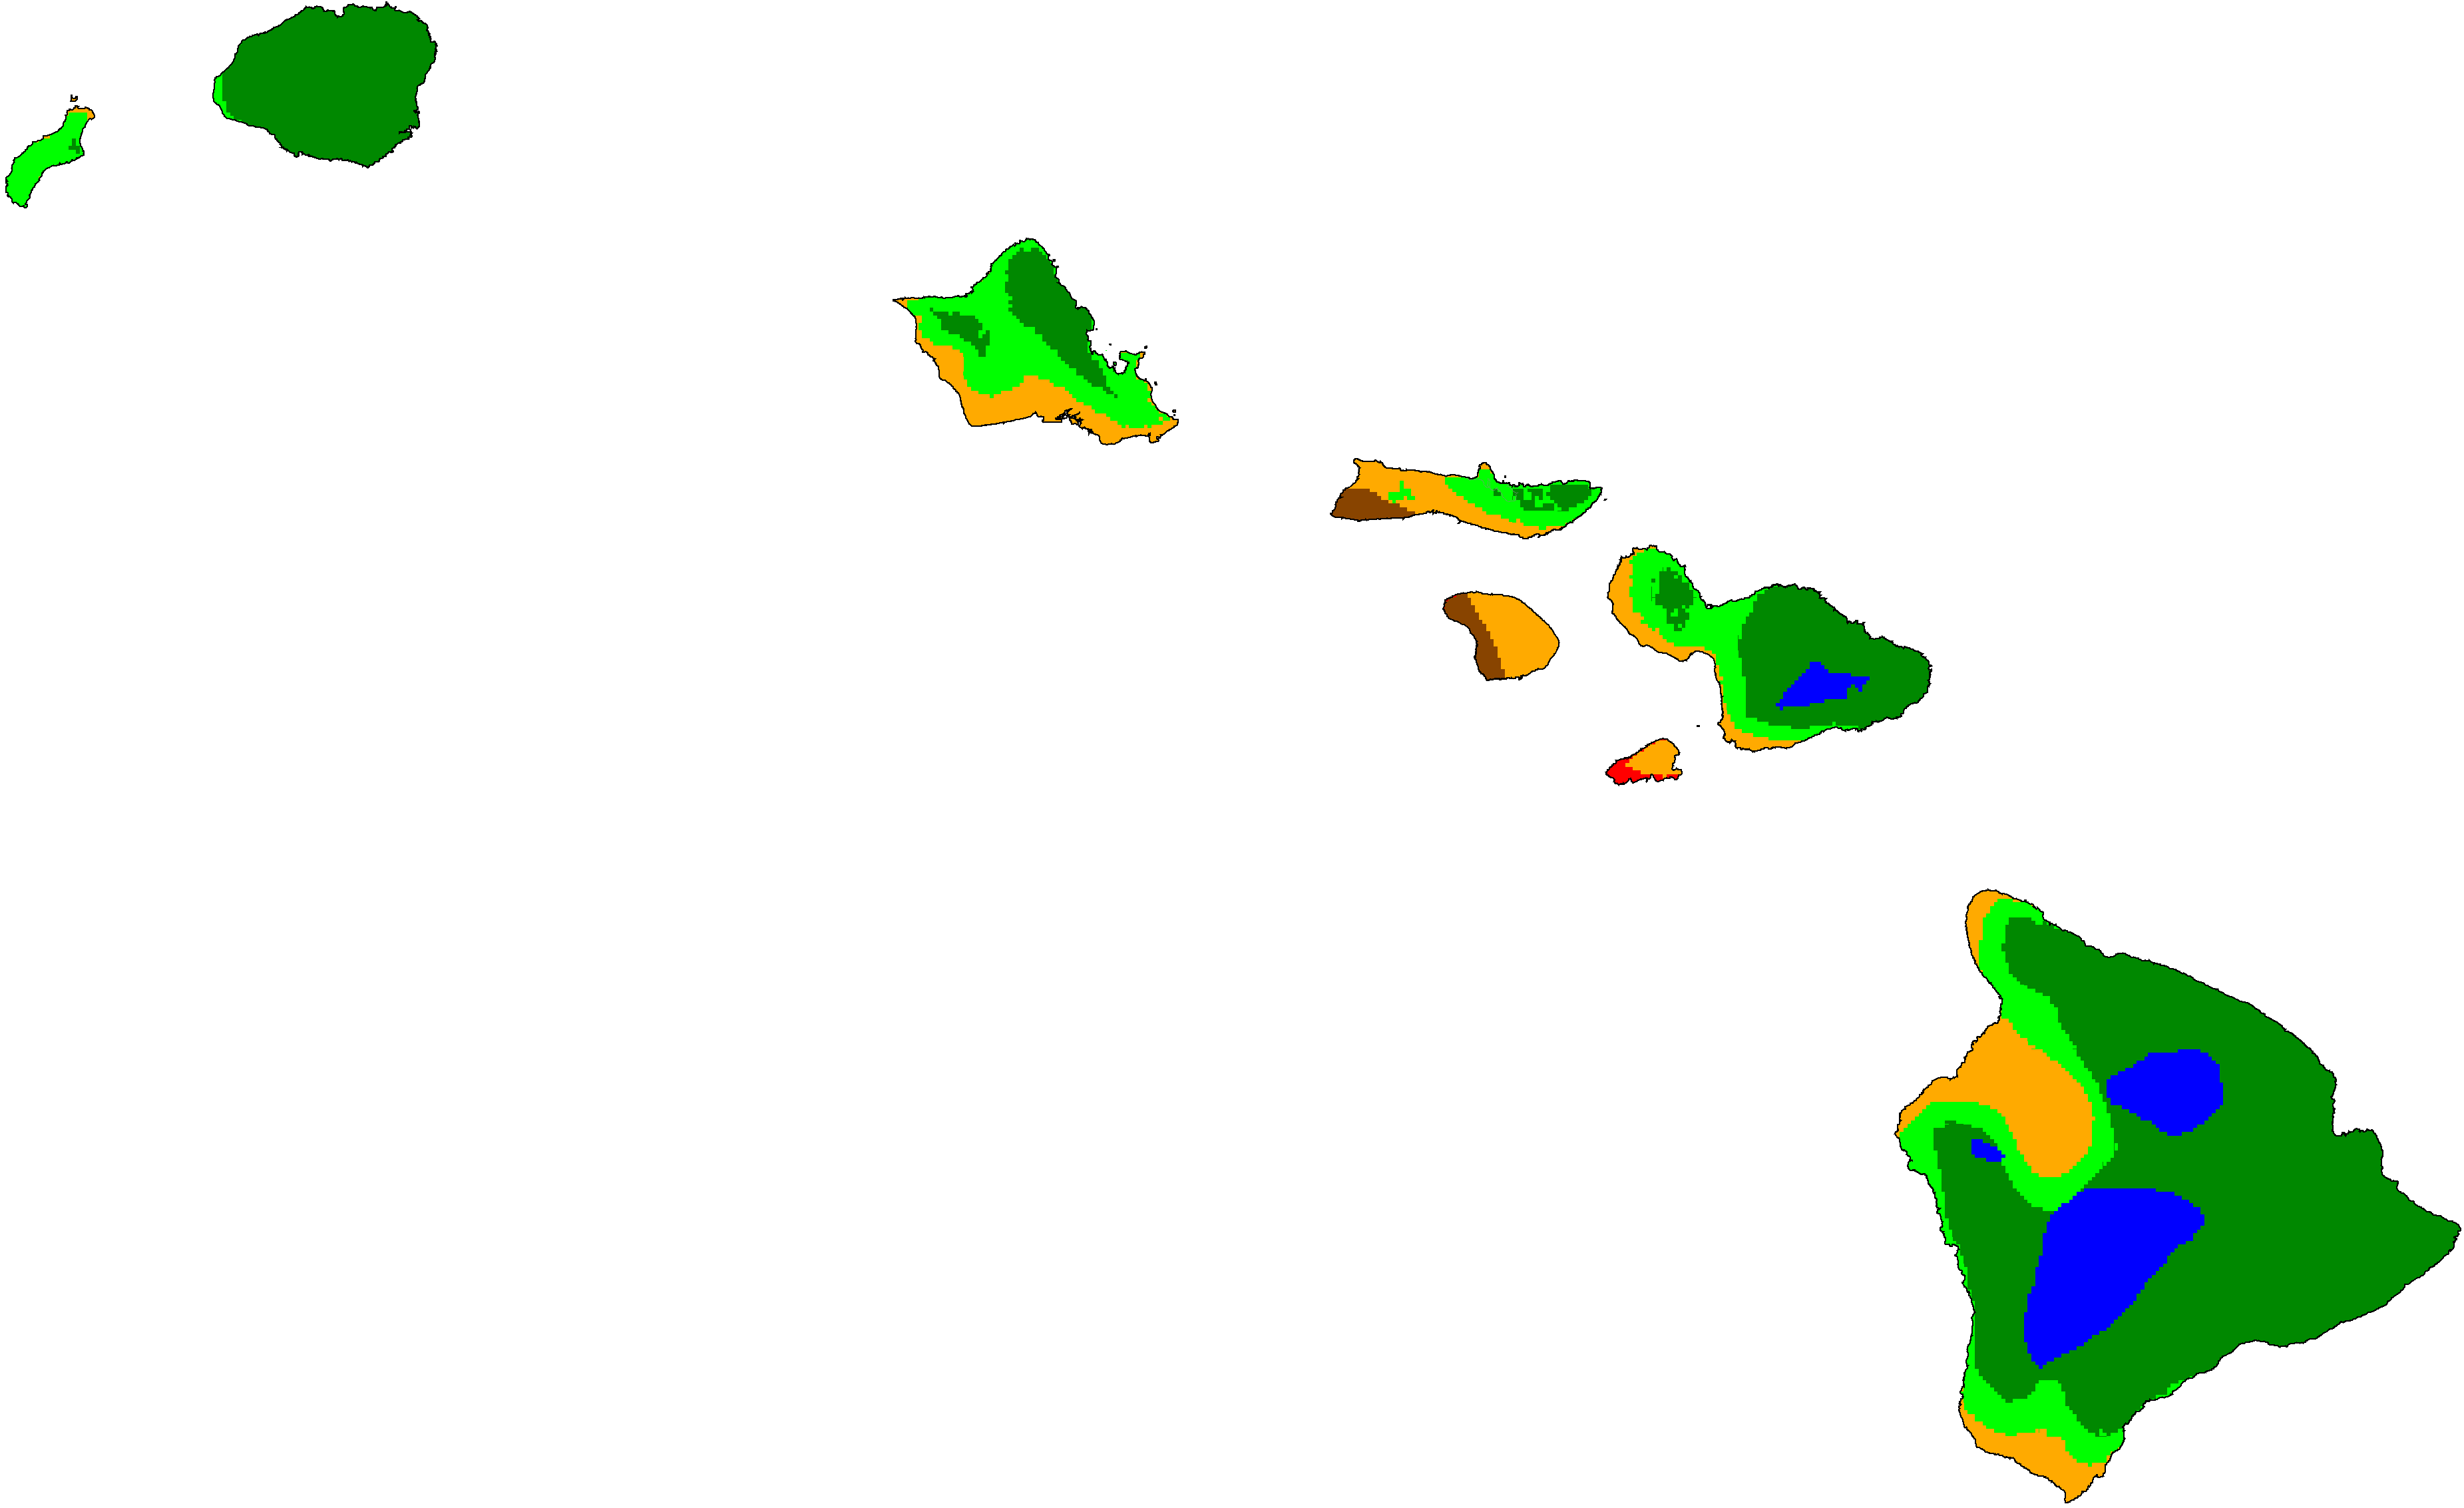
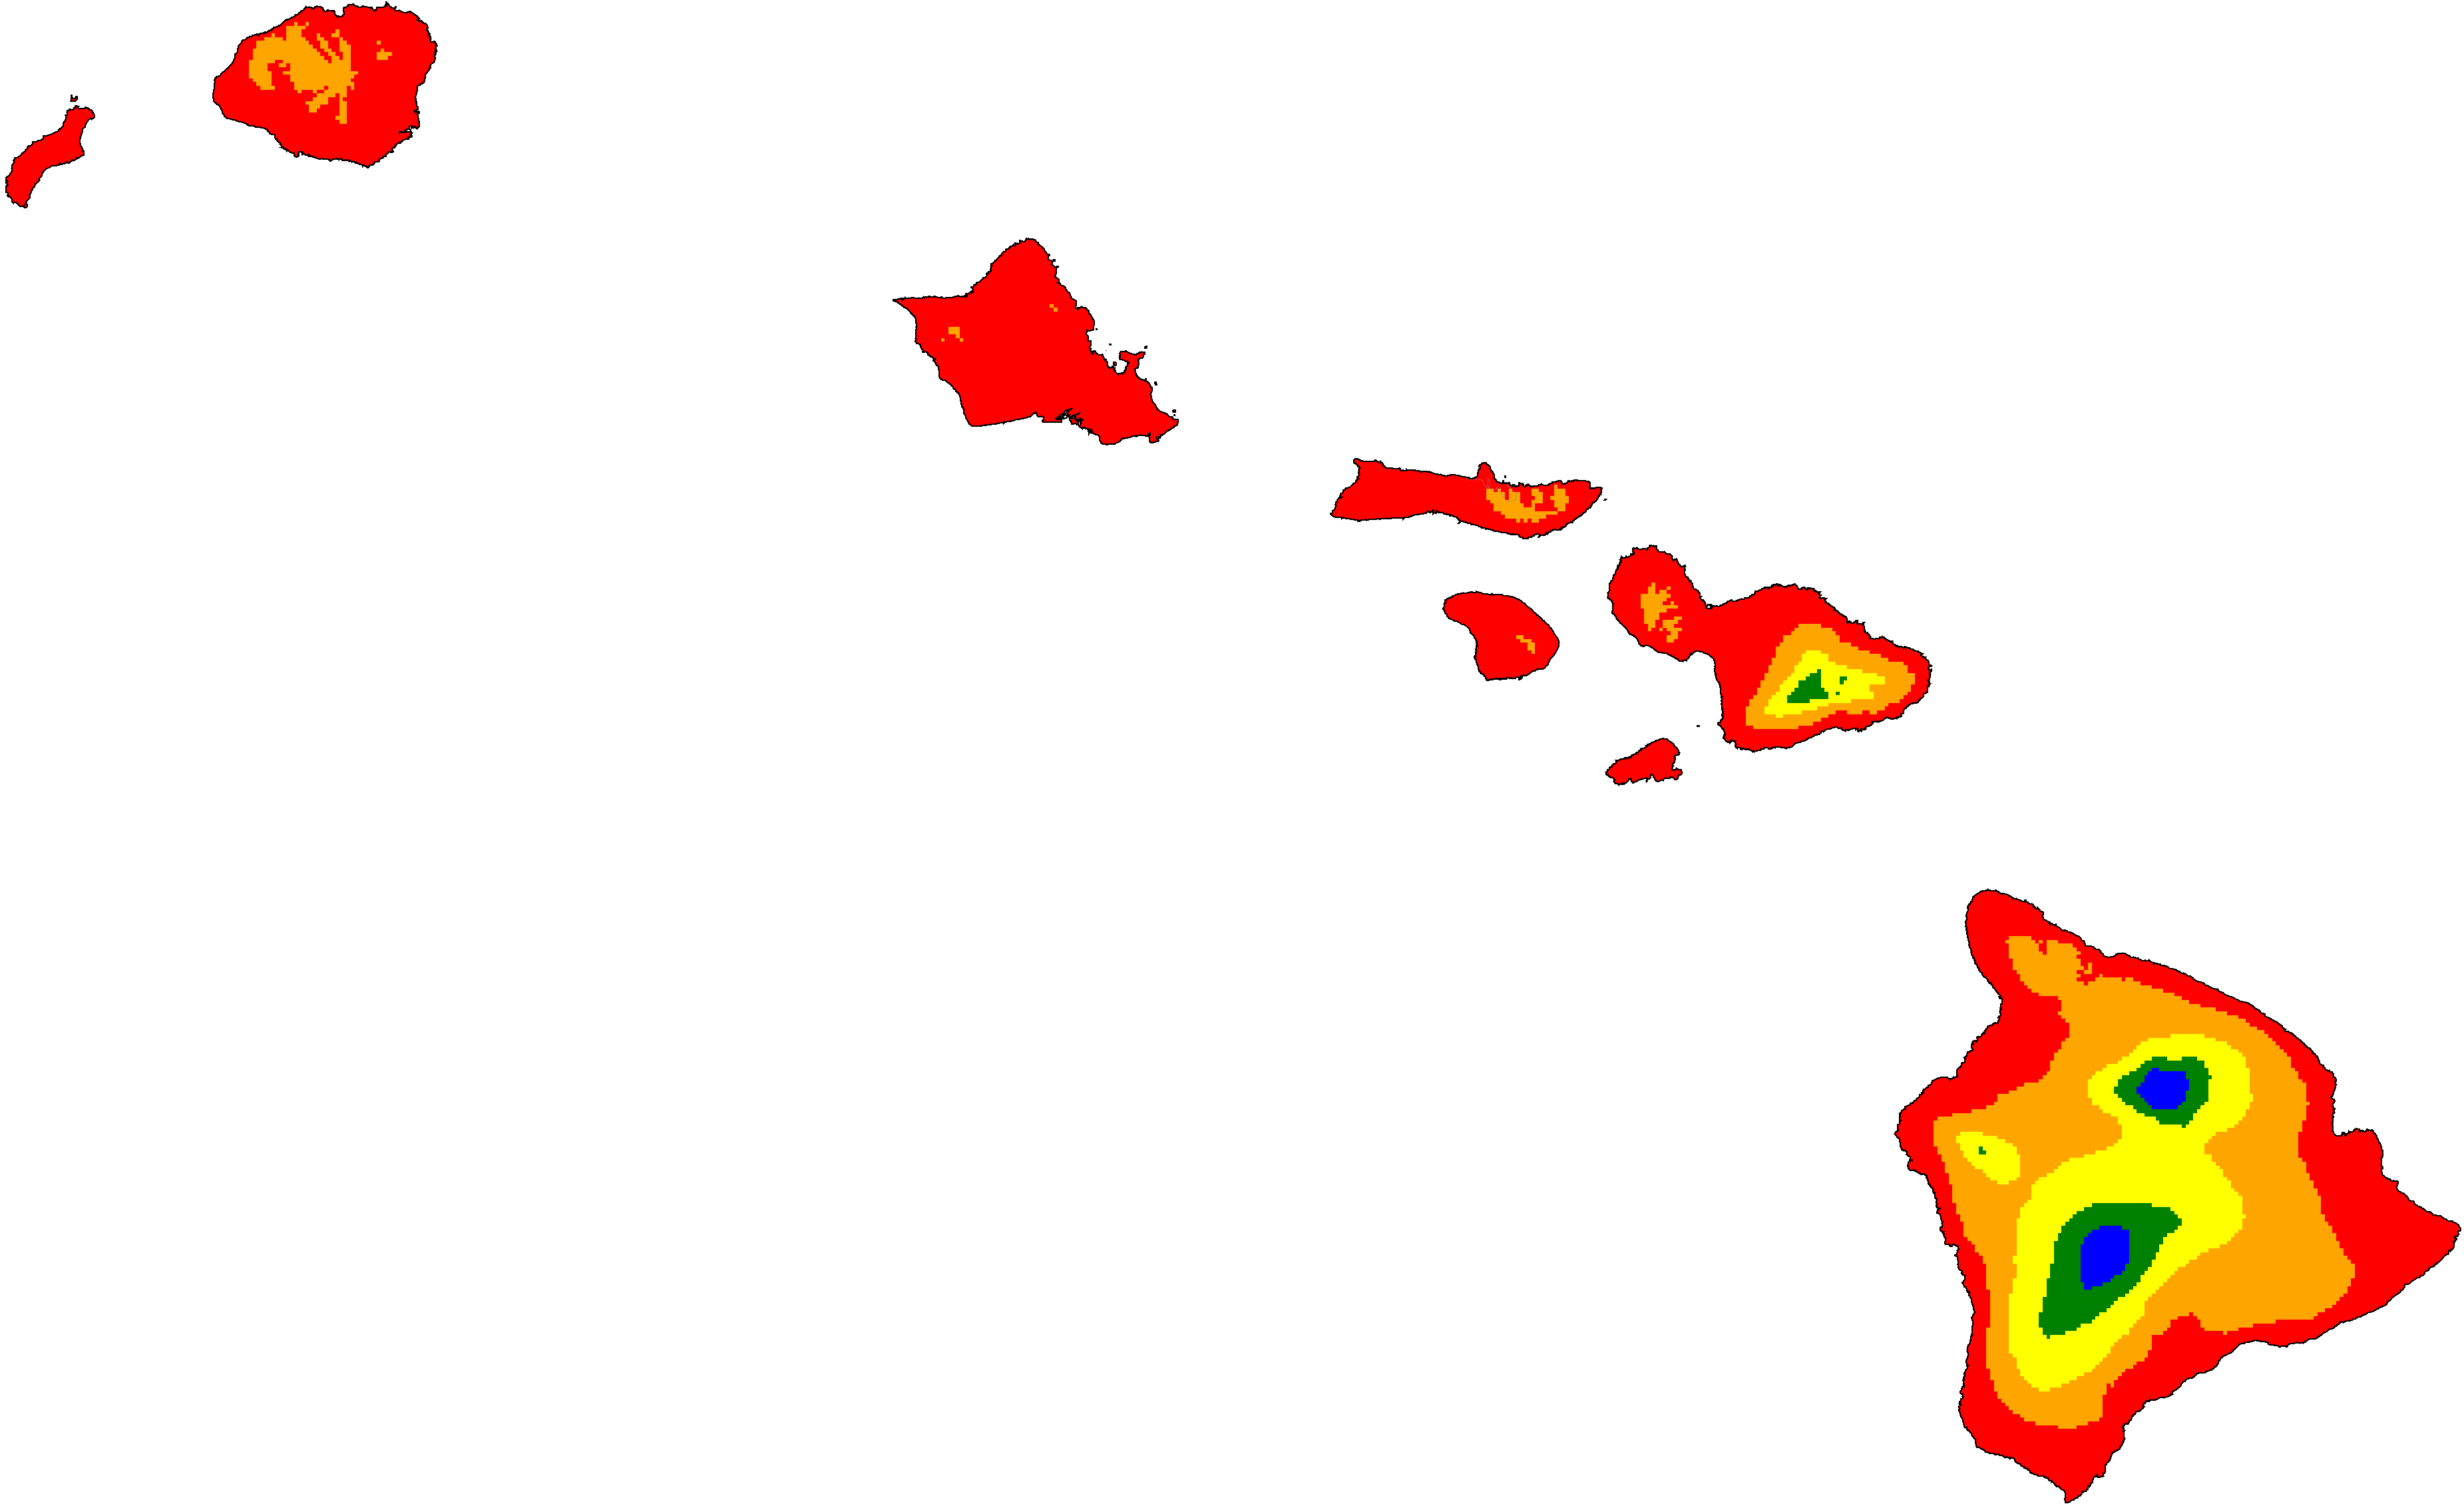
Hawaii distribution of winter categories (projections are SSP5-8.5 high emissions normals)


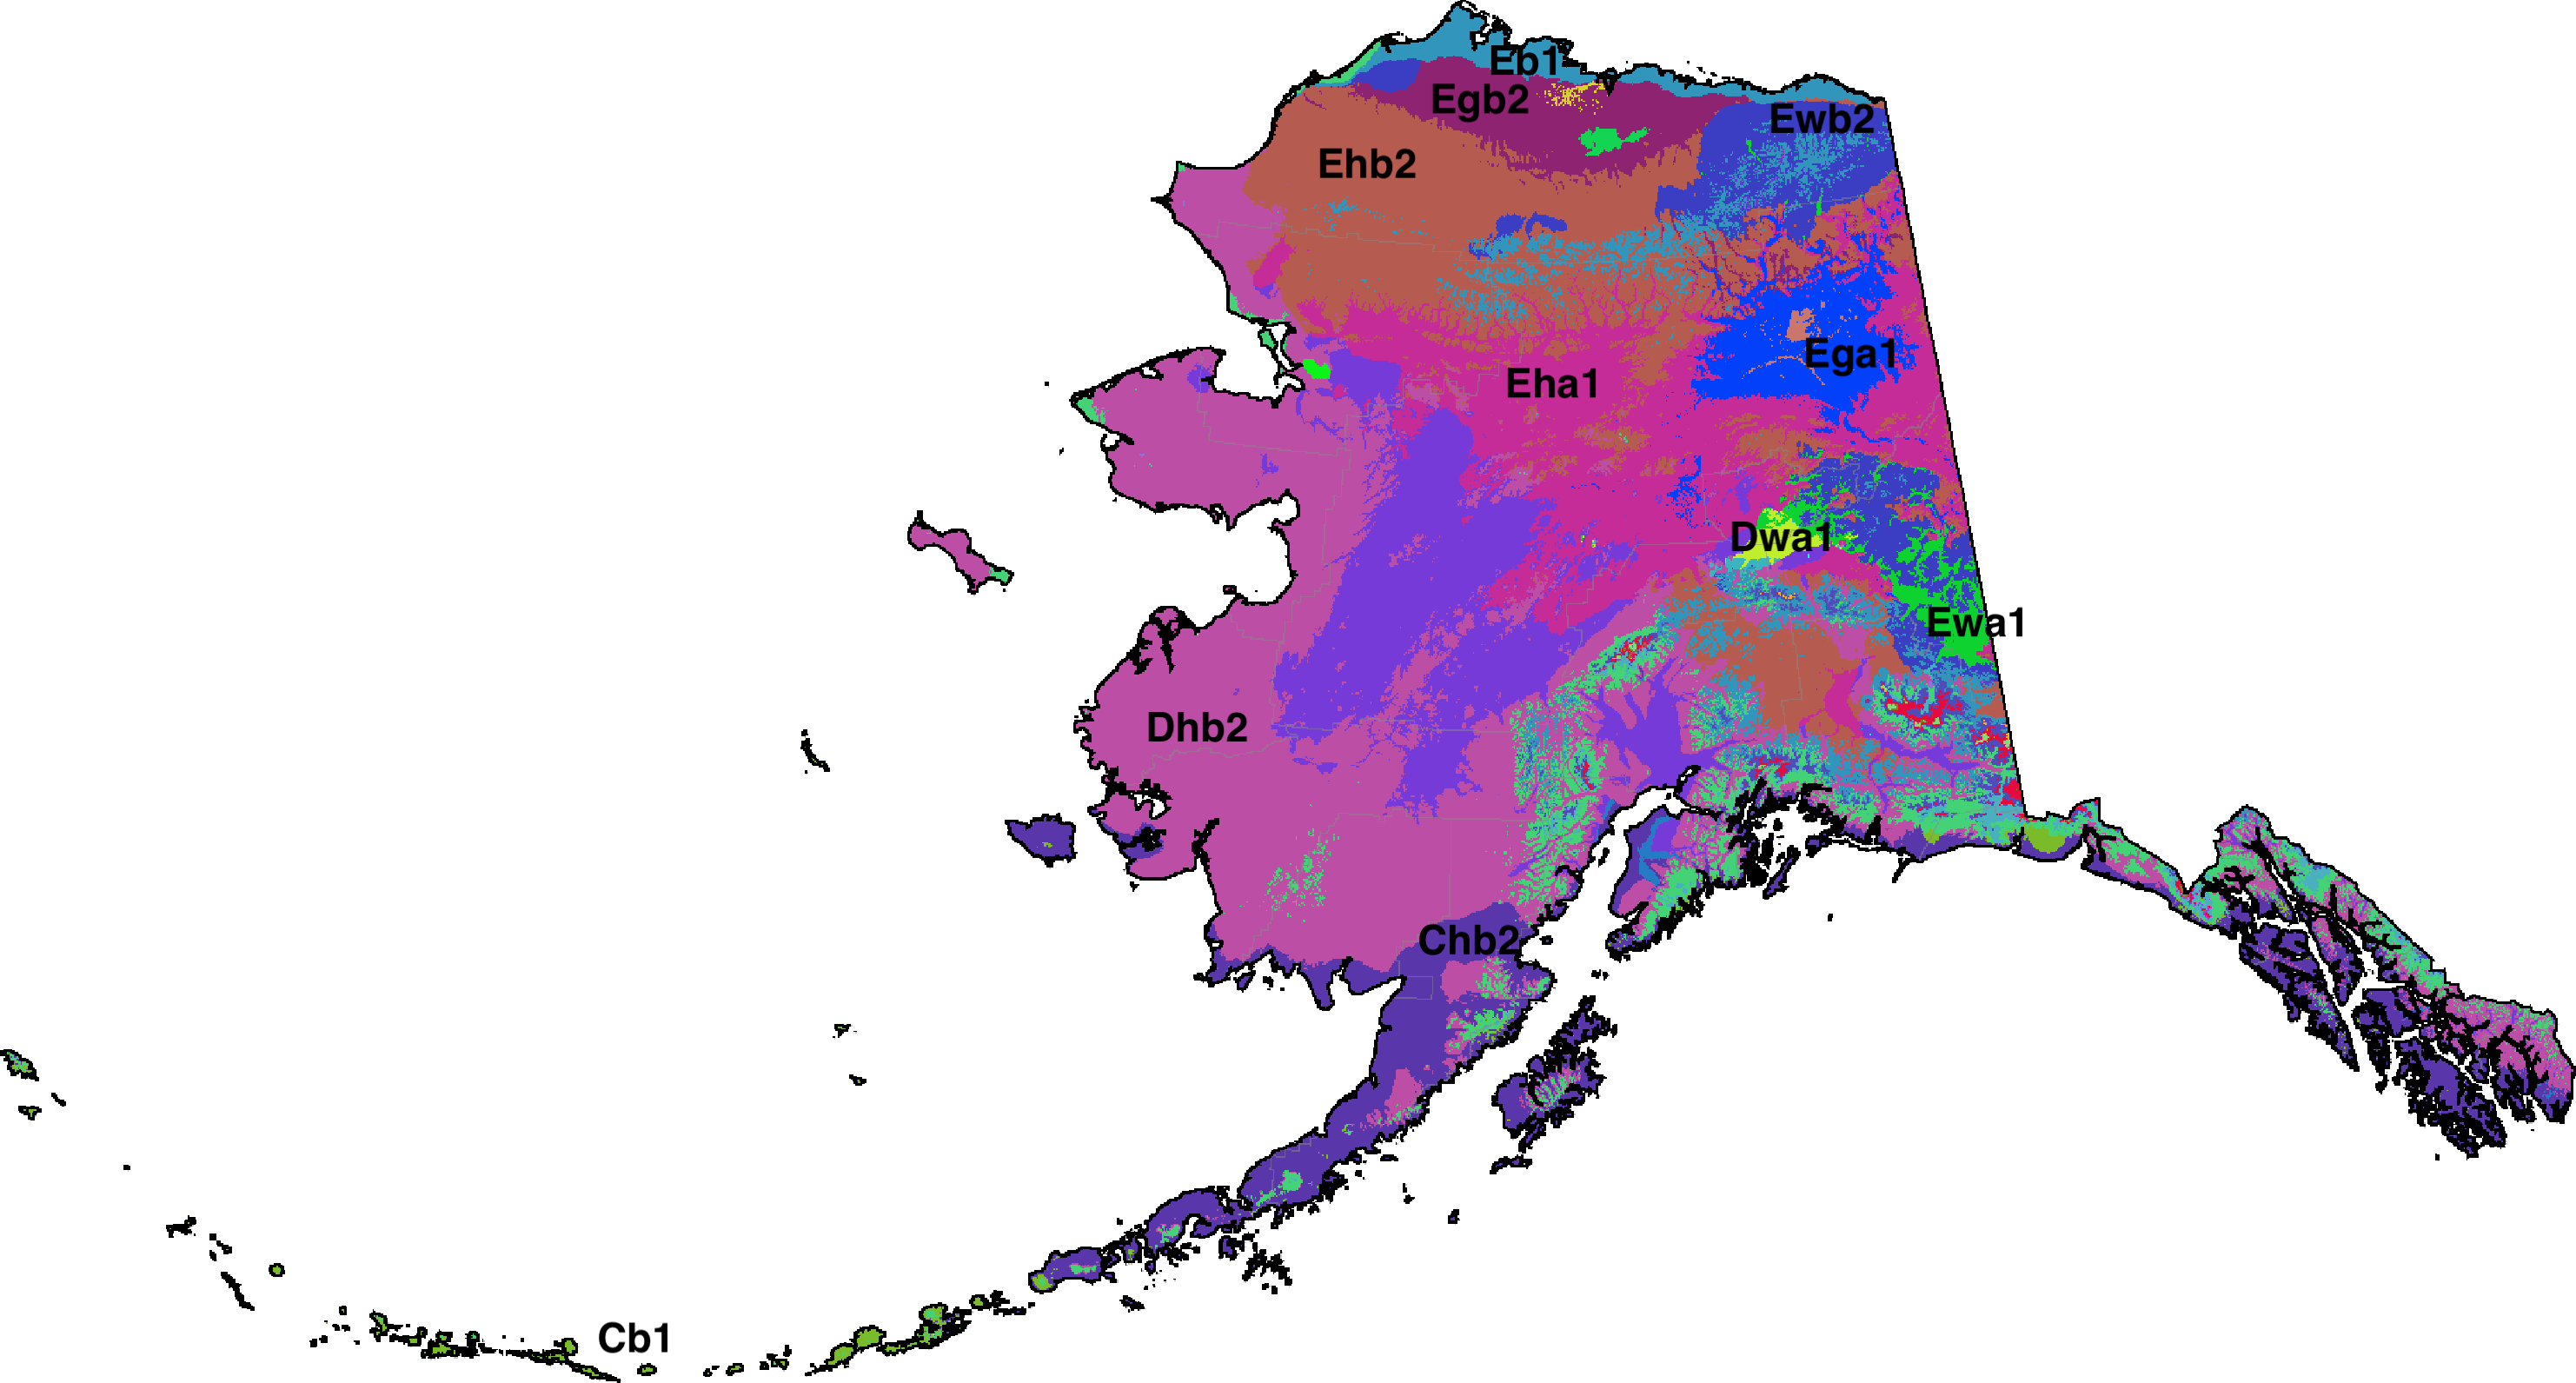
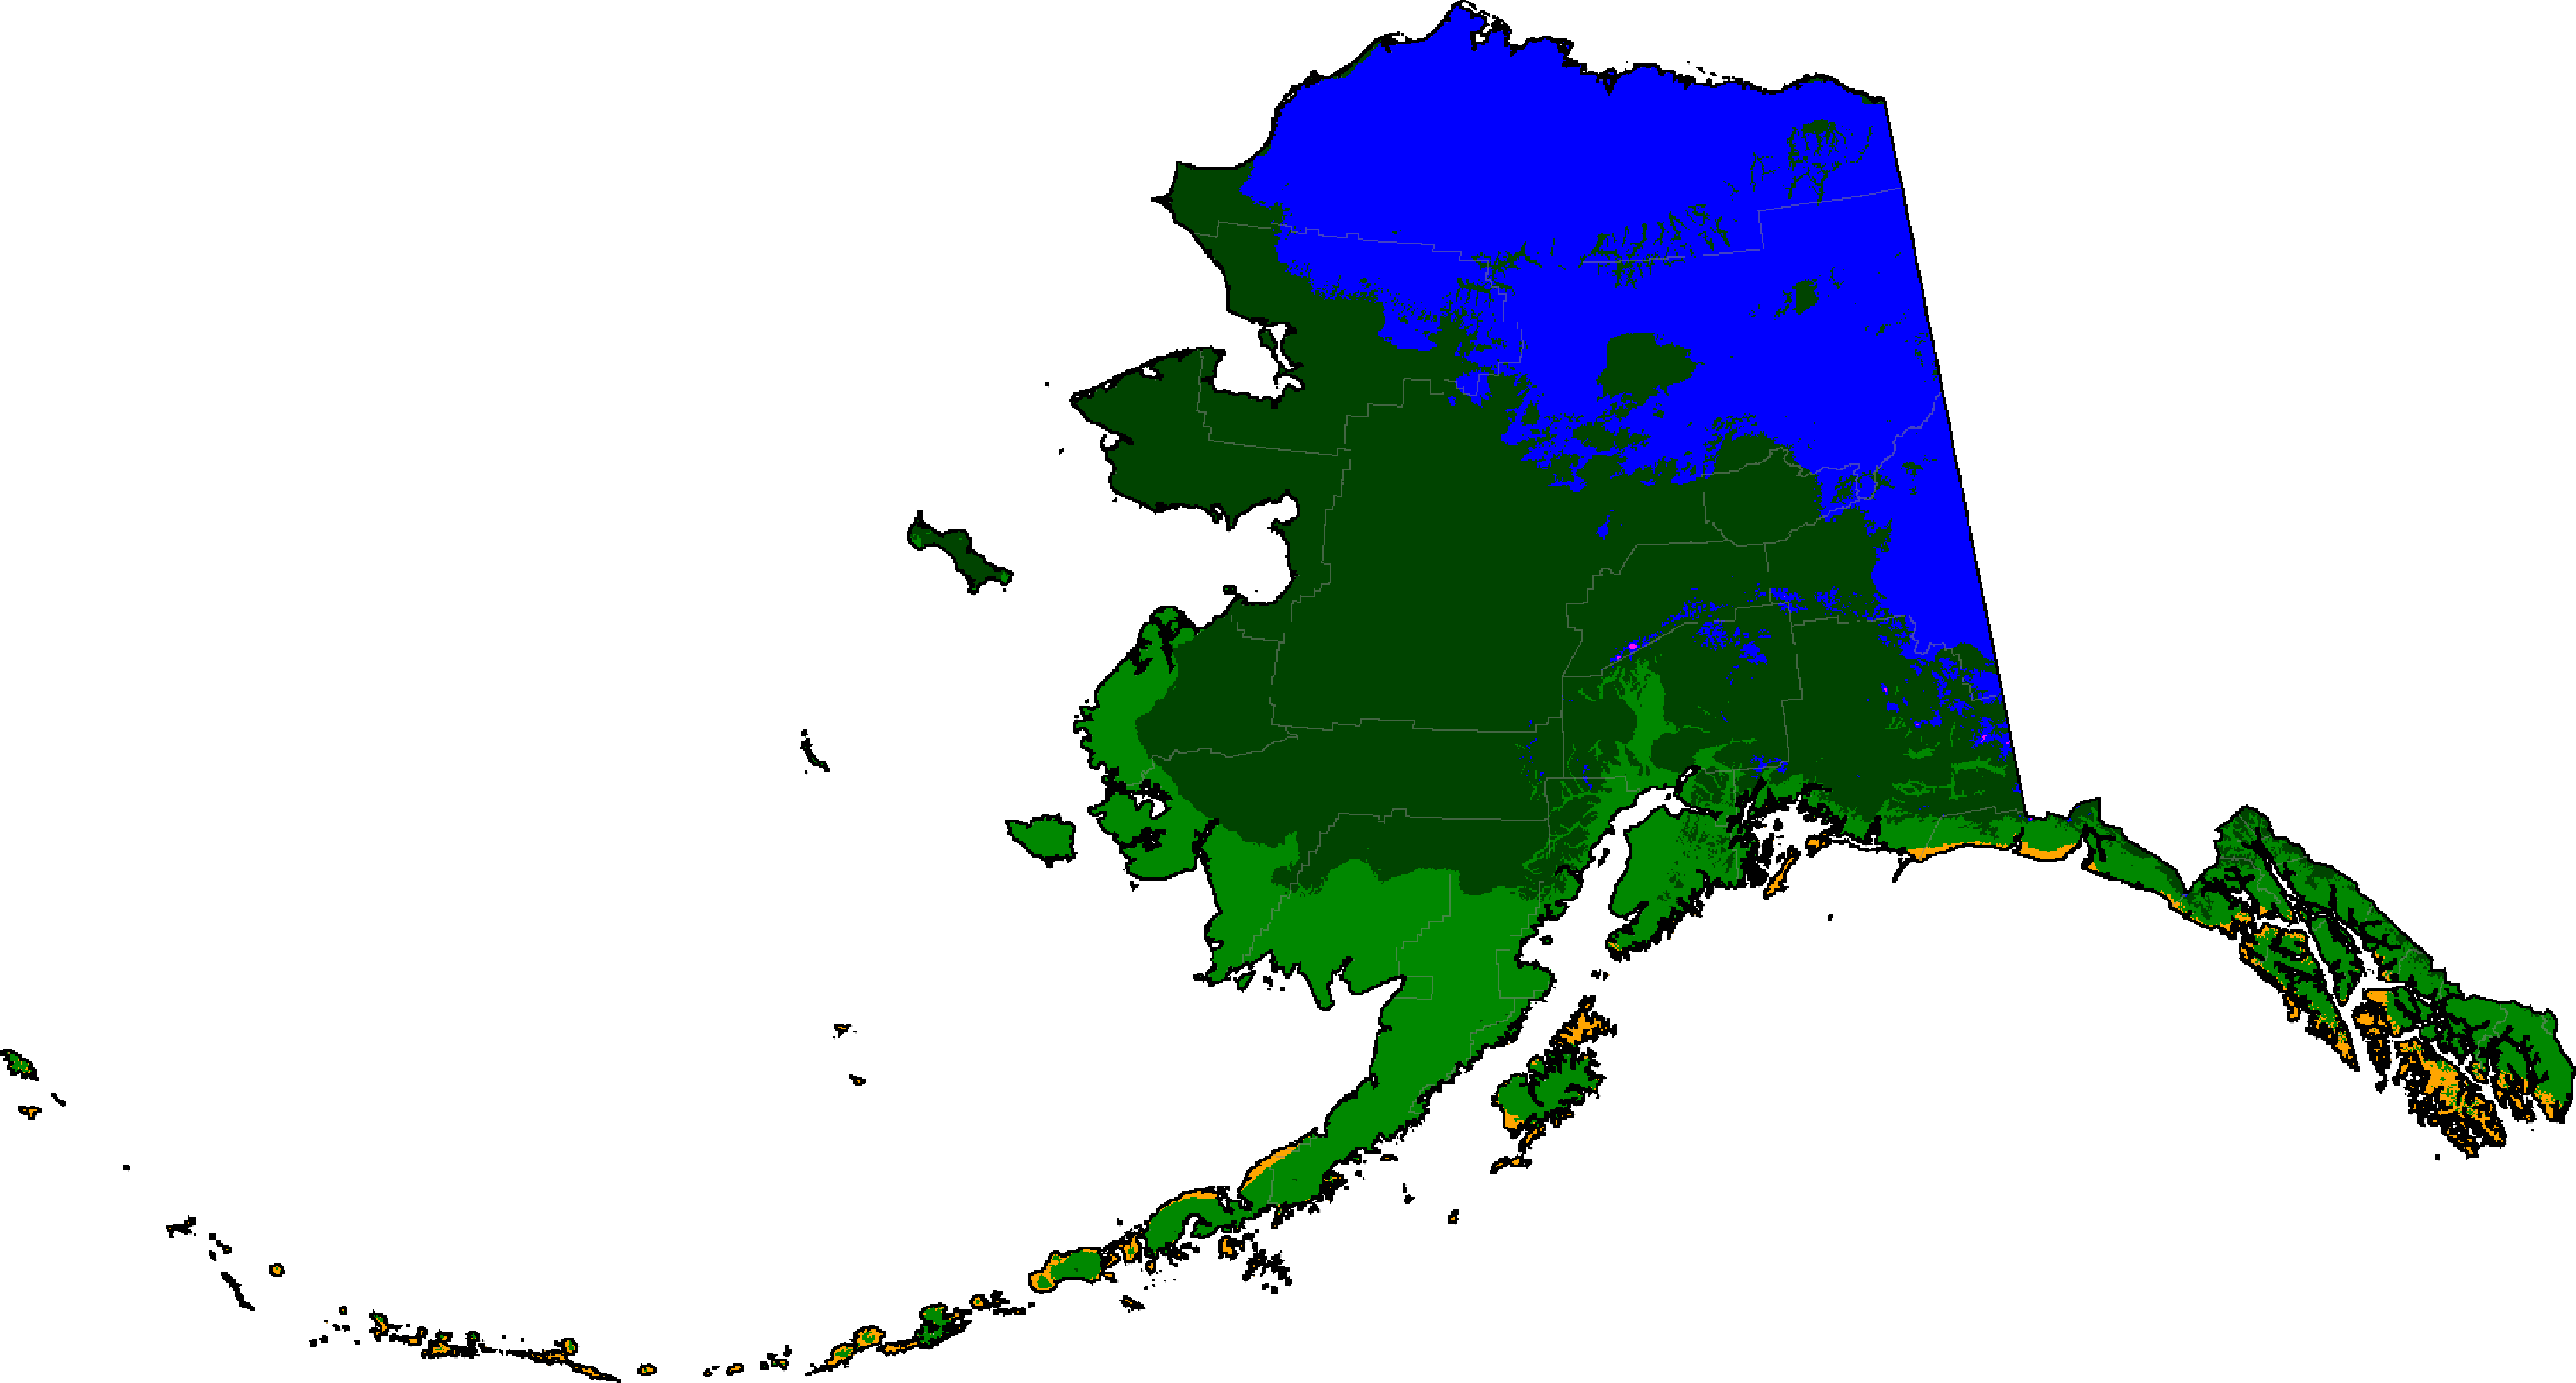
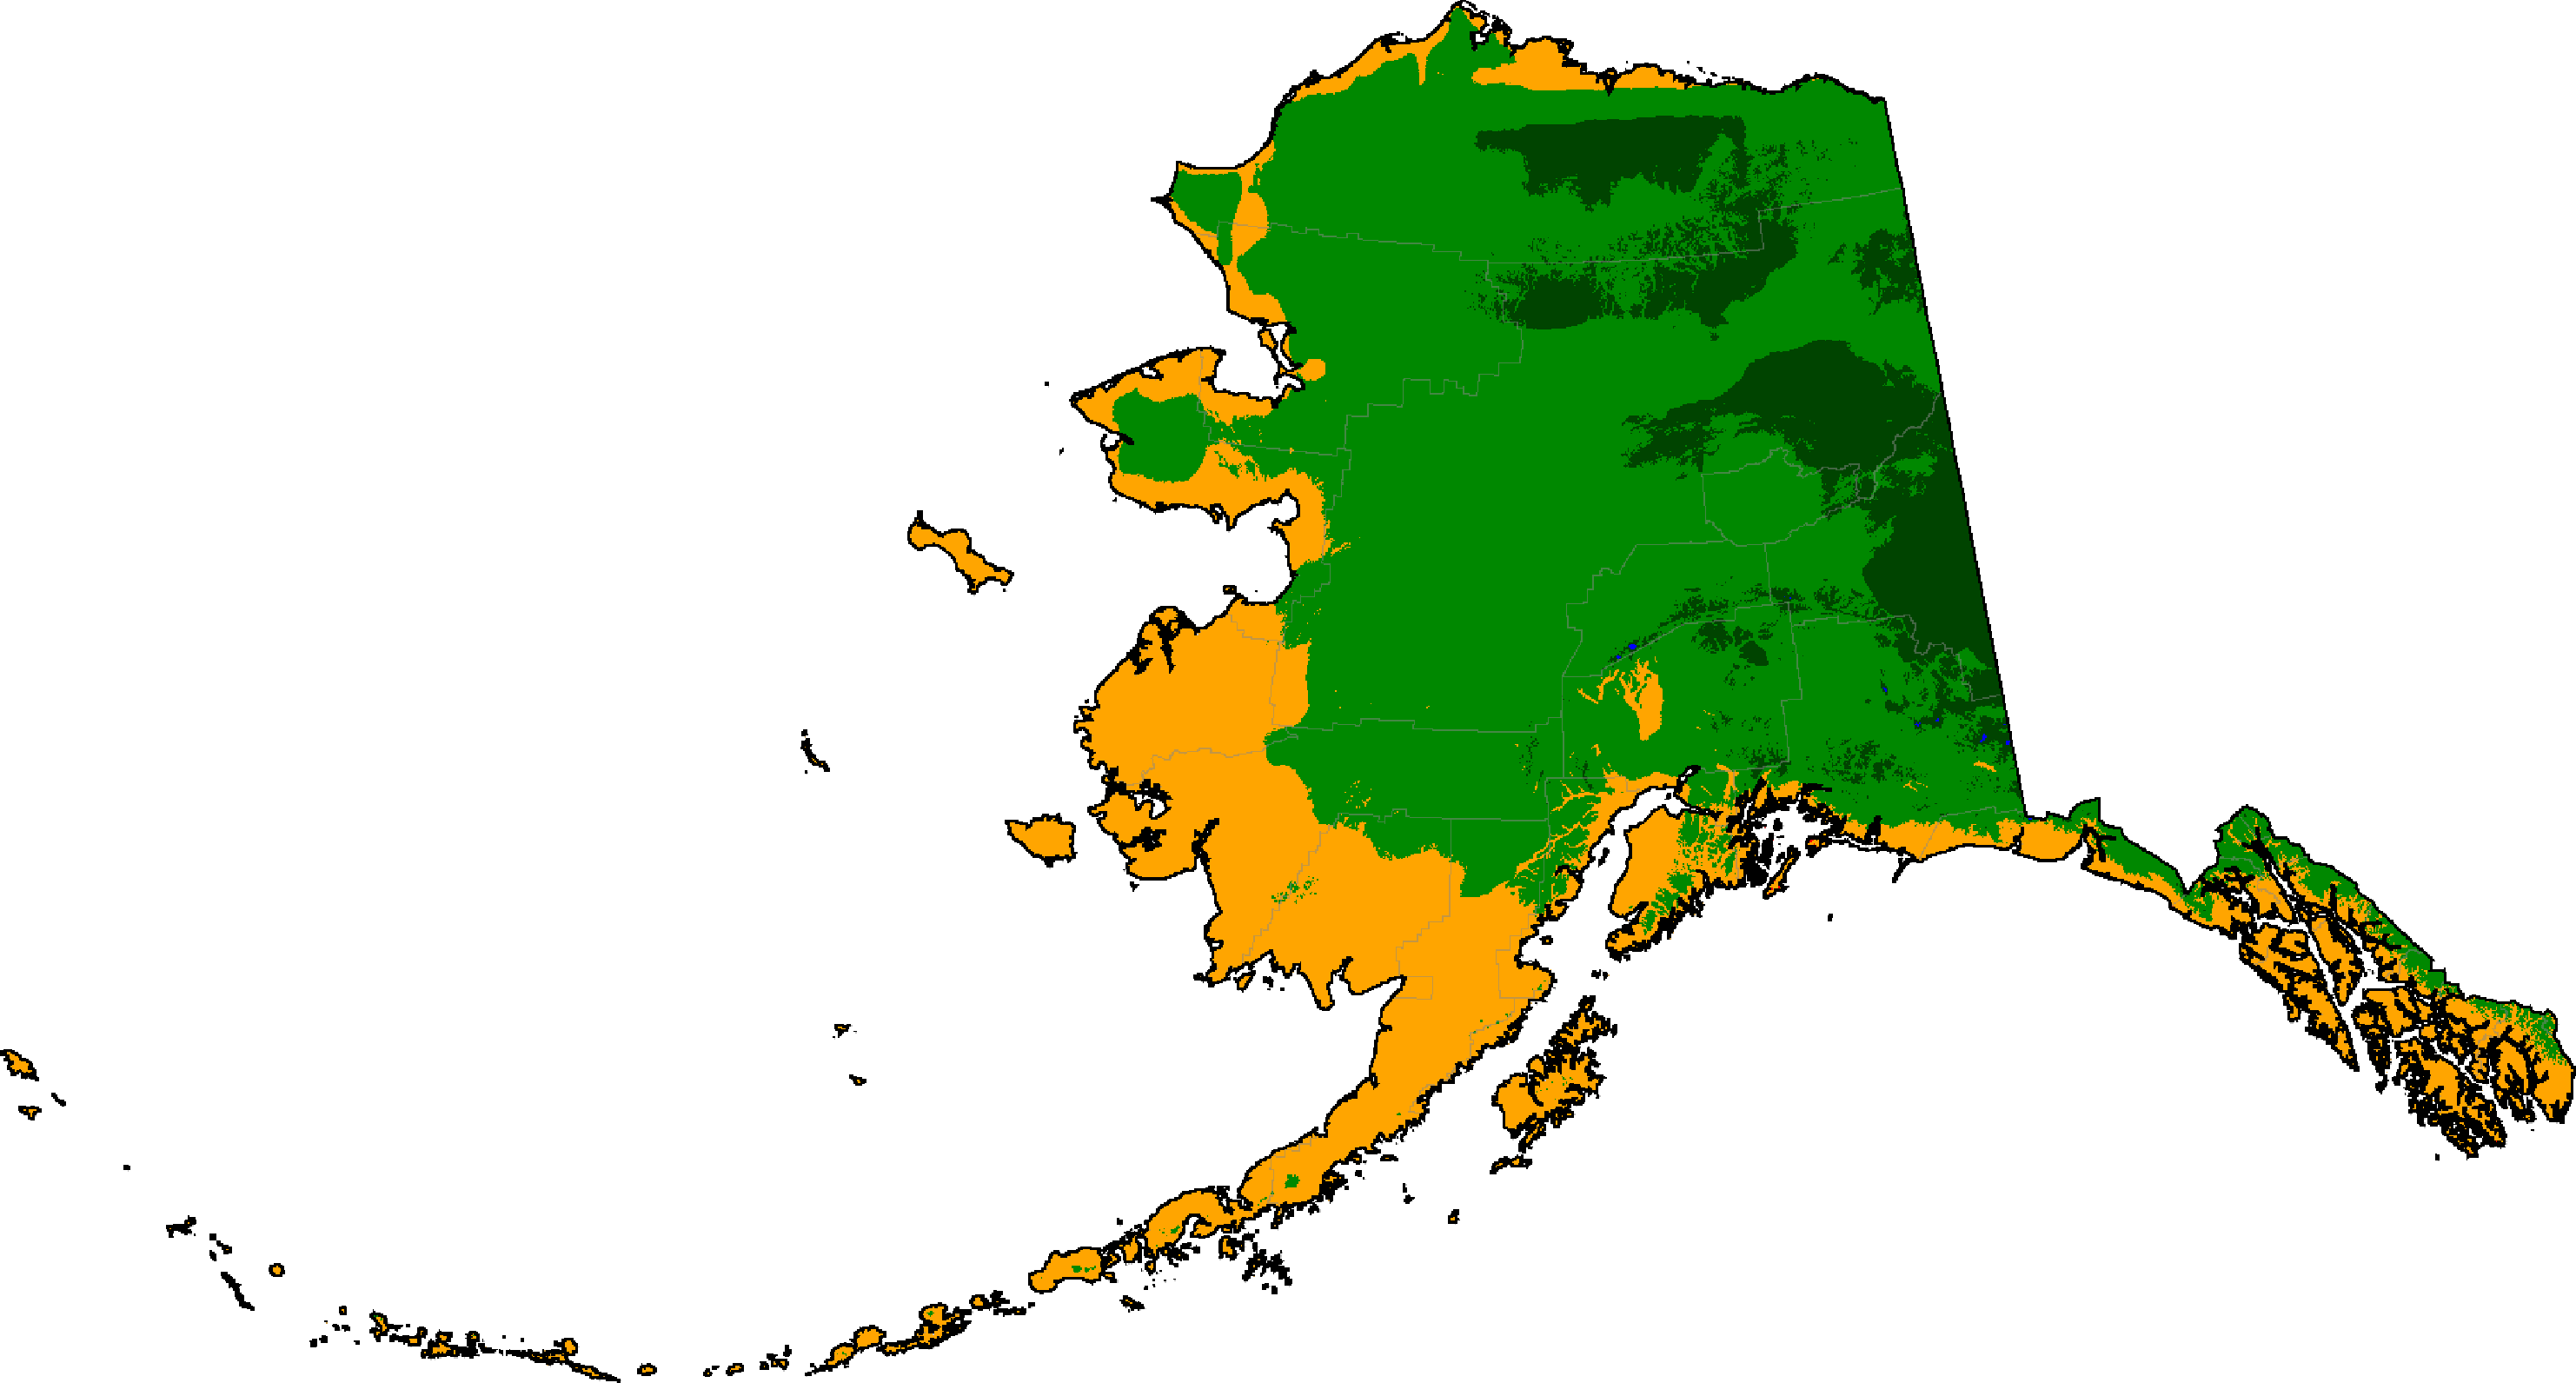
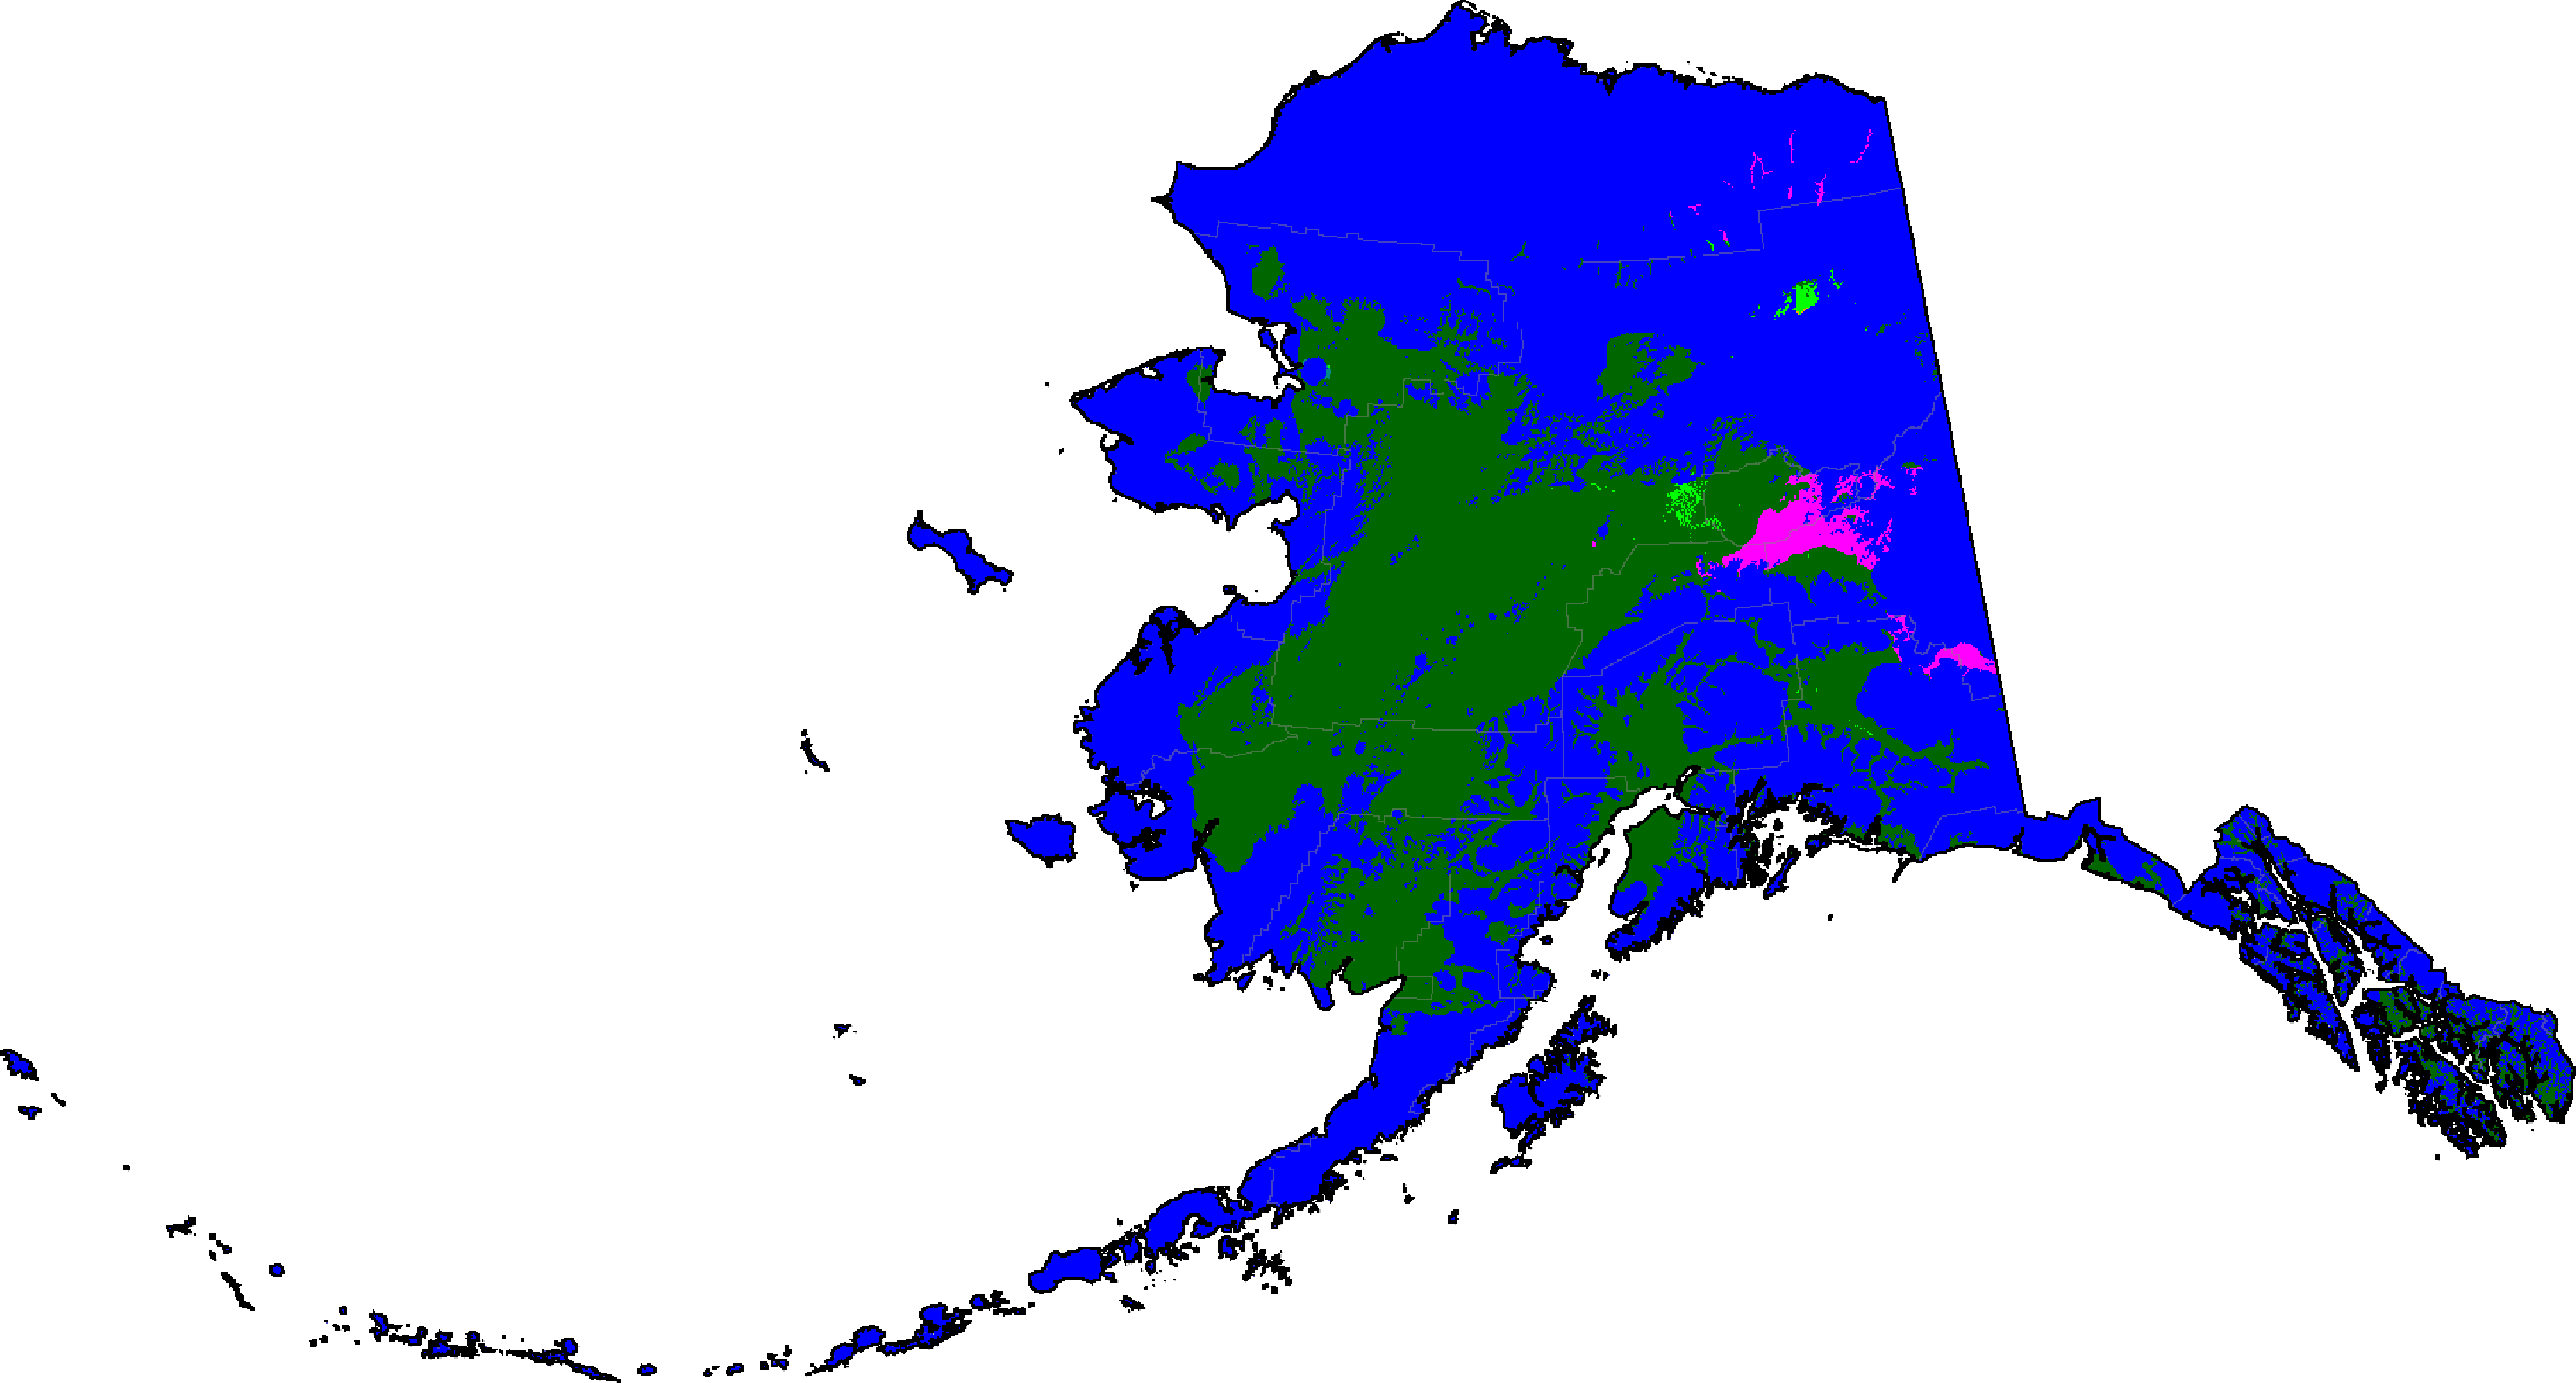
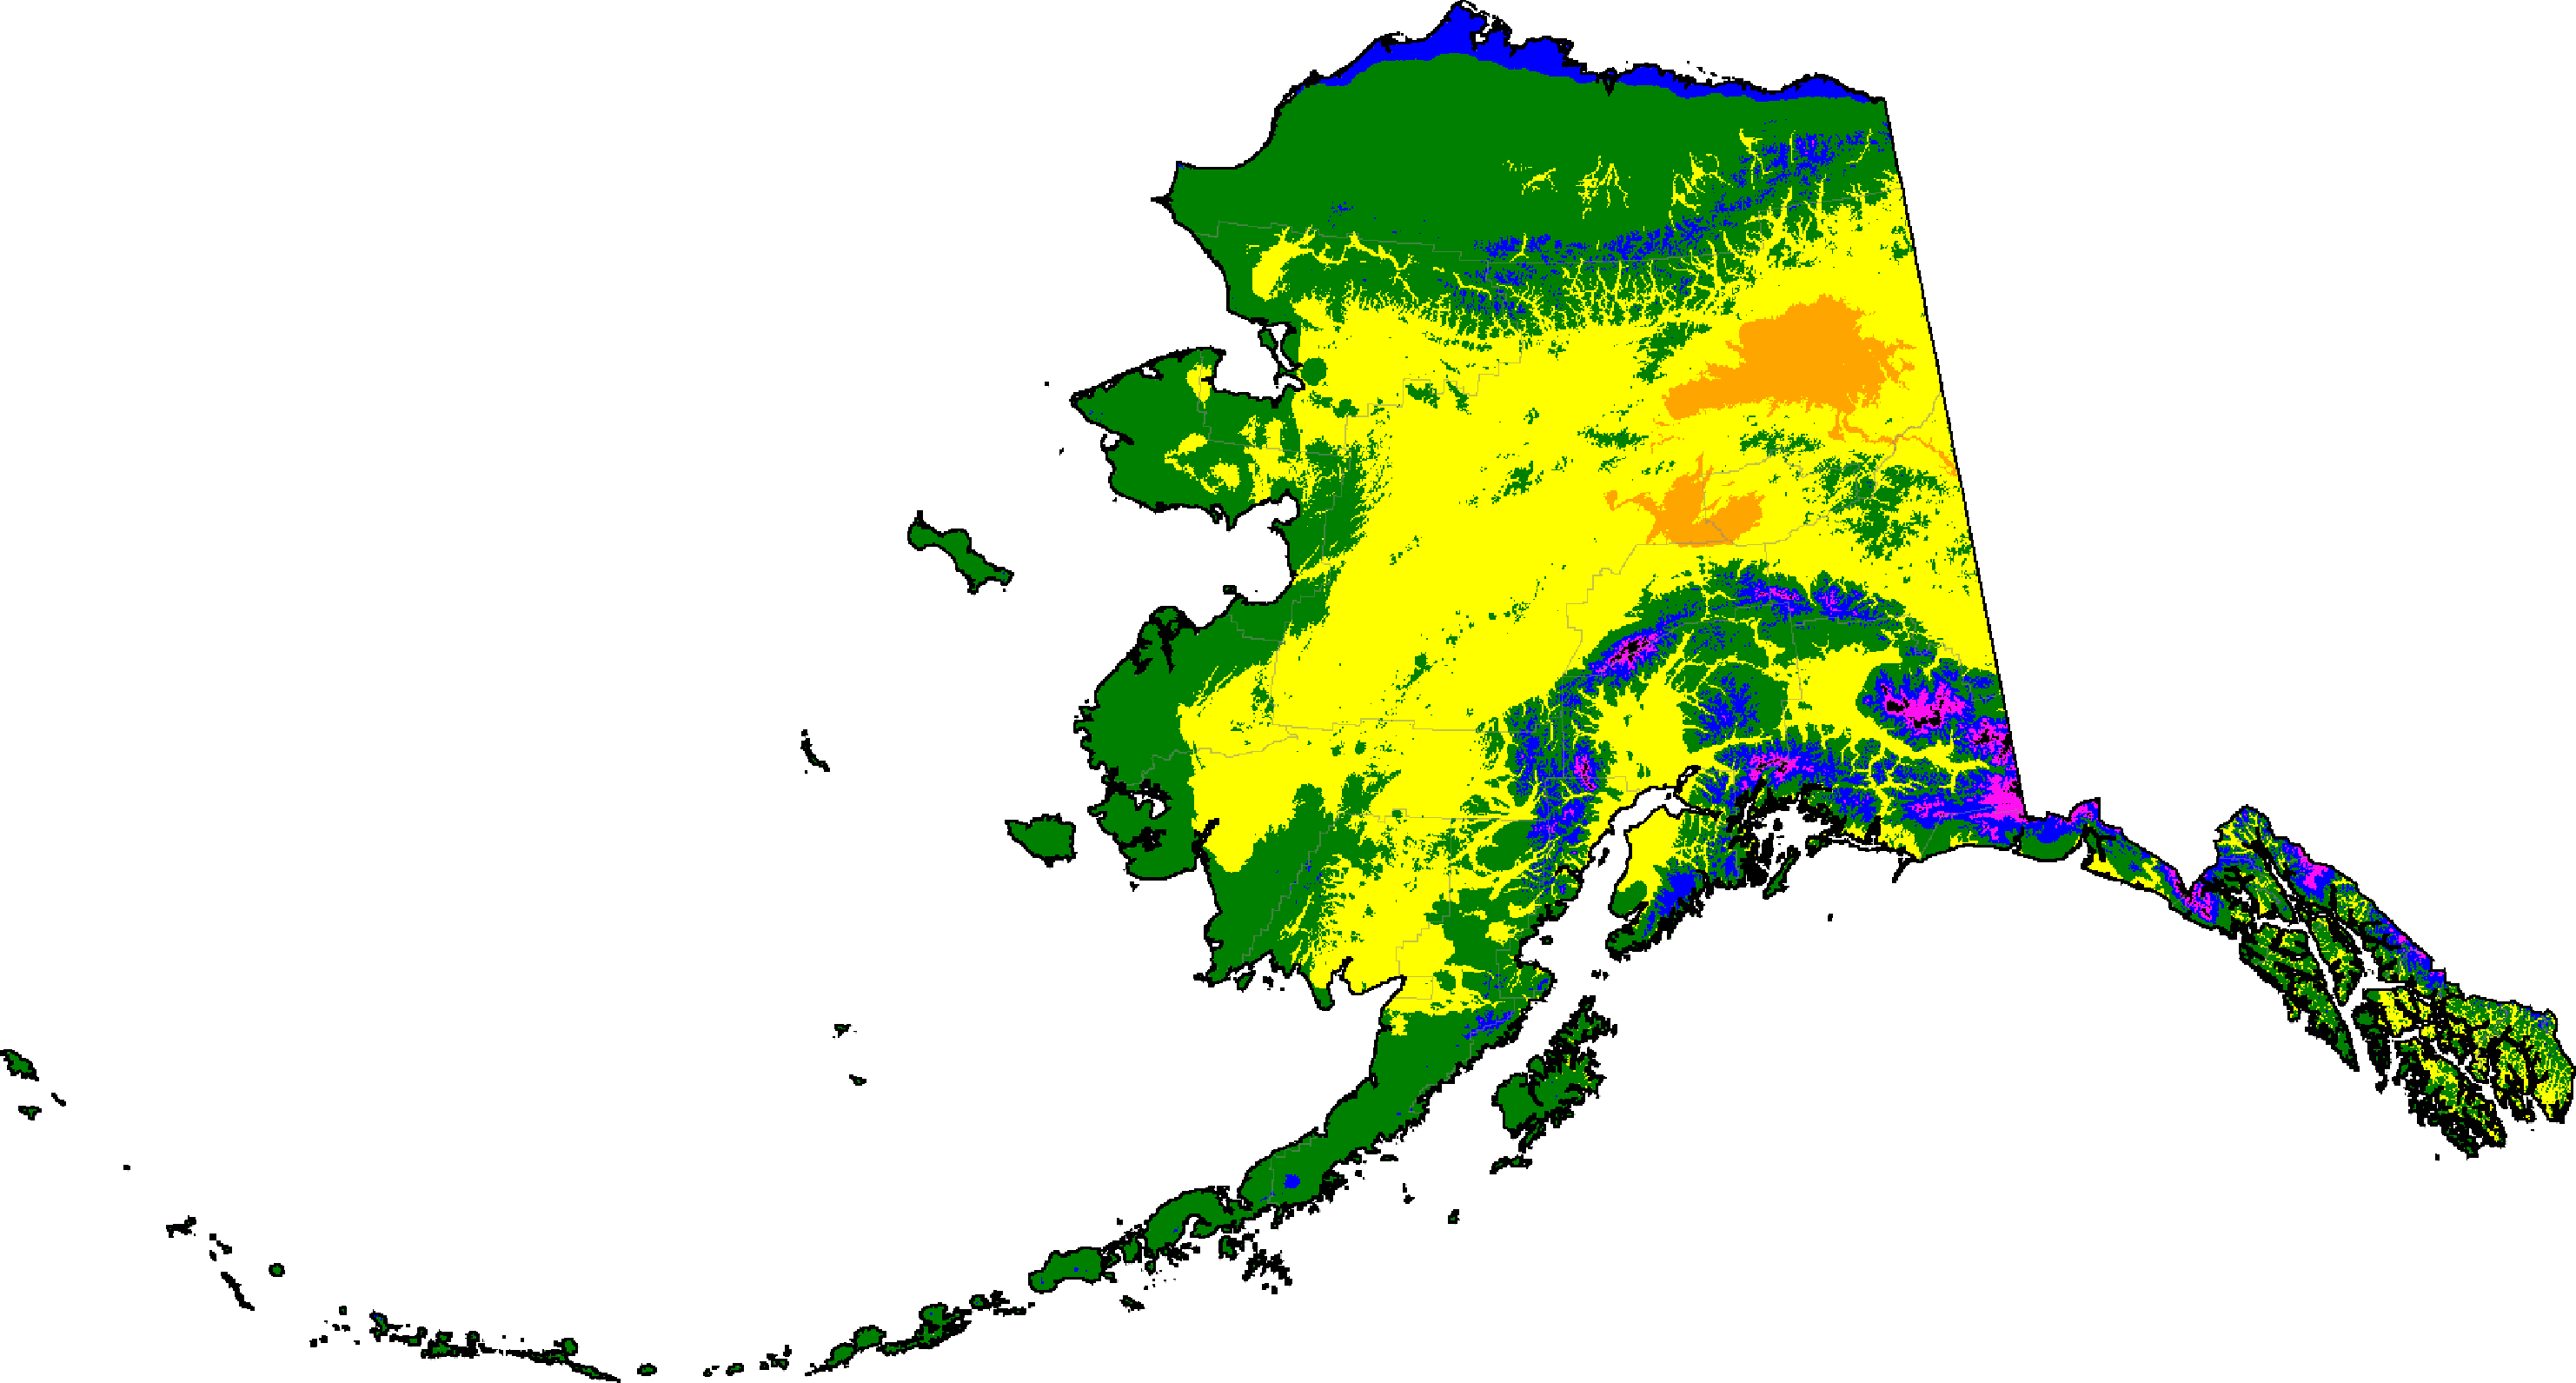
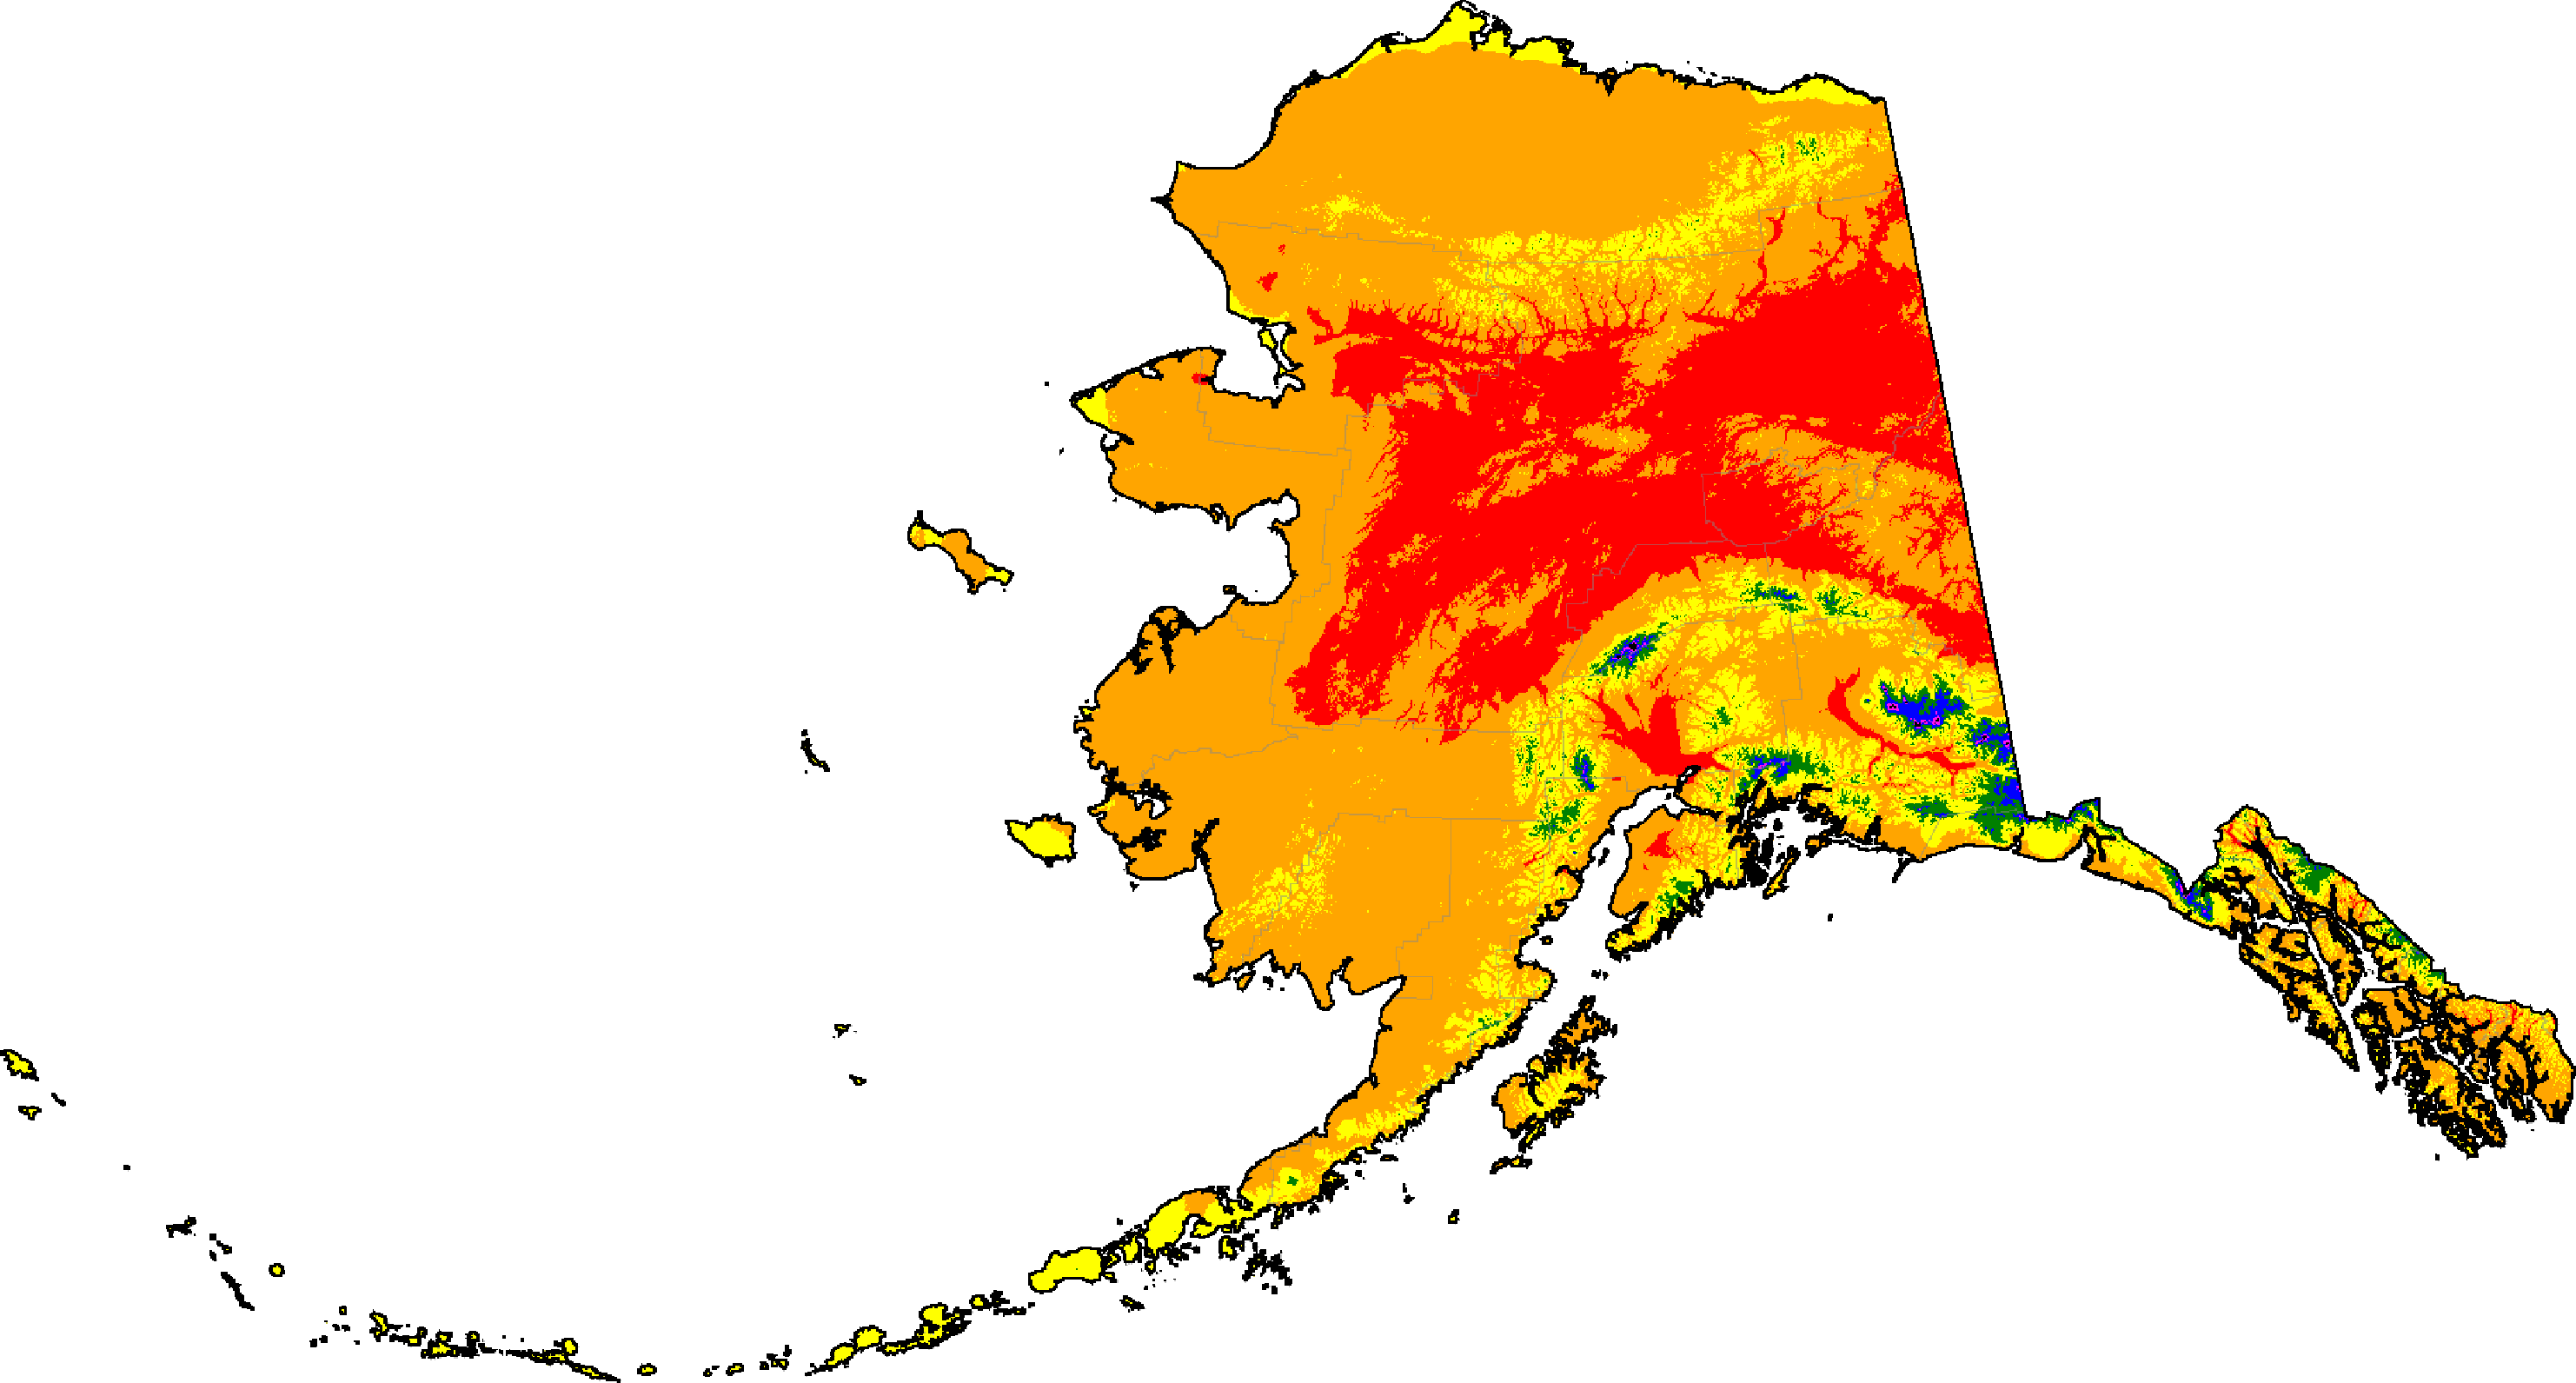
Alaska distribution of winter categories (projections are SSP5-8.5 high emissions normals)
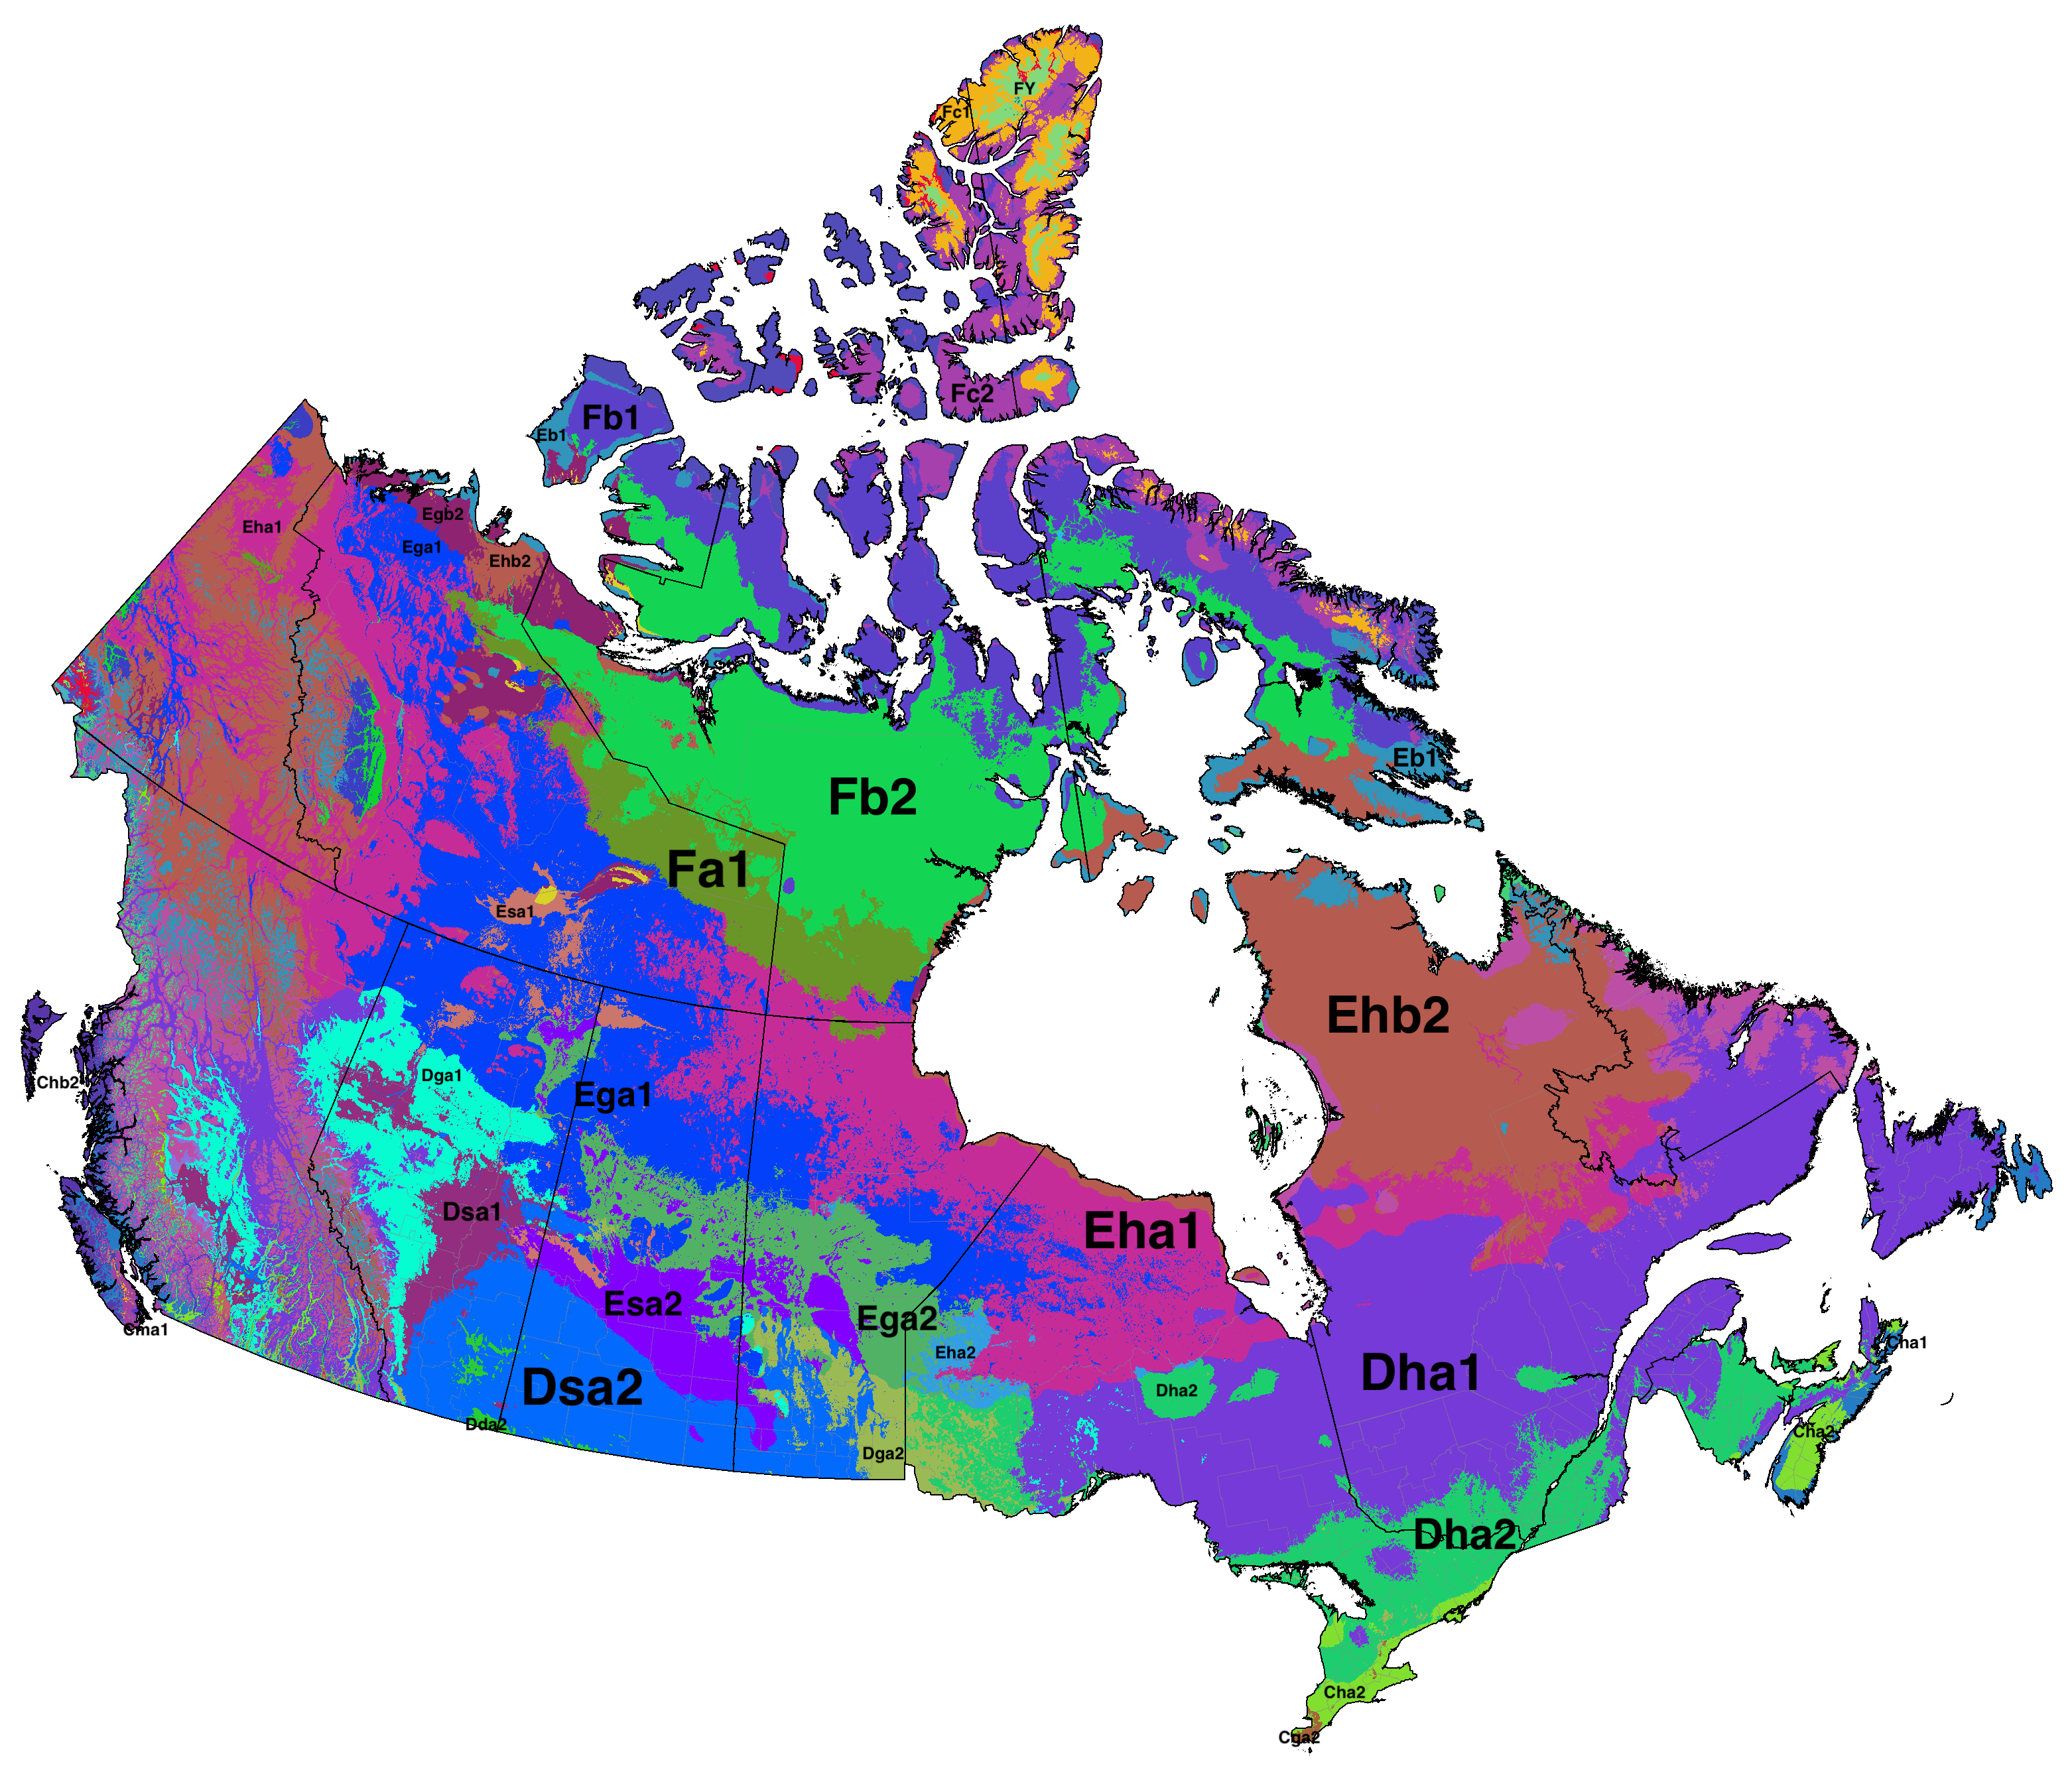
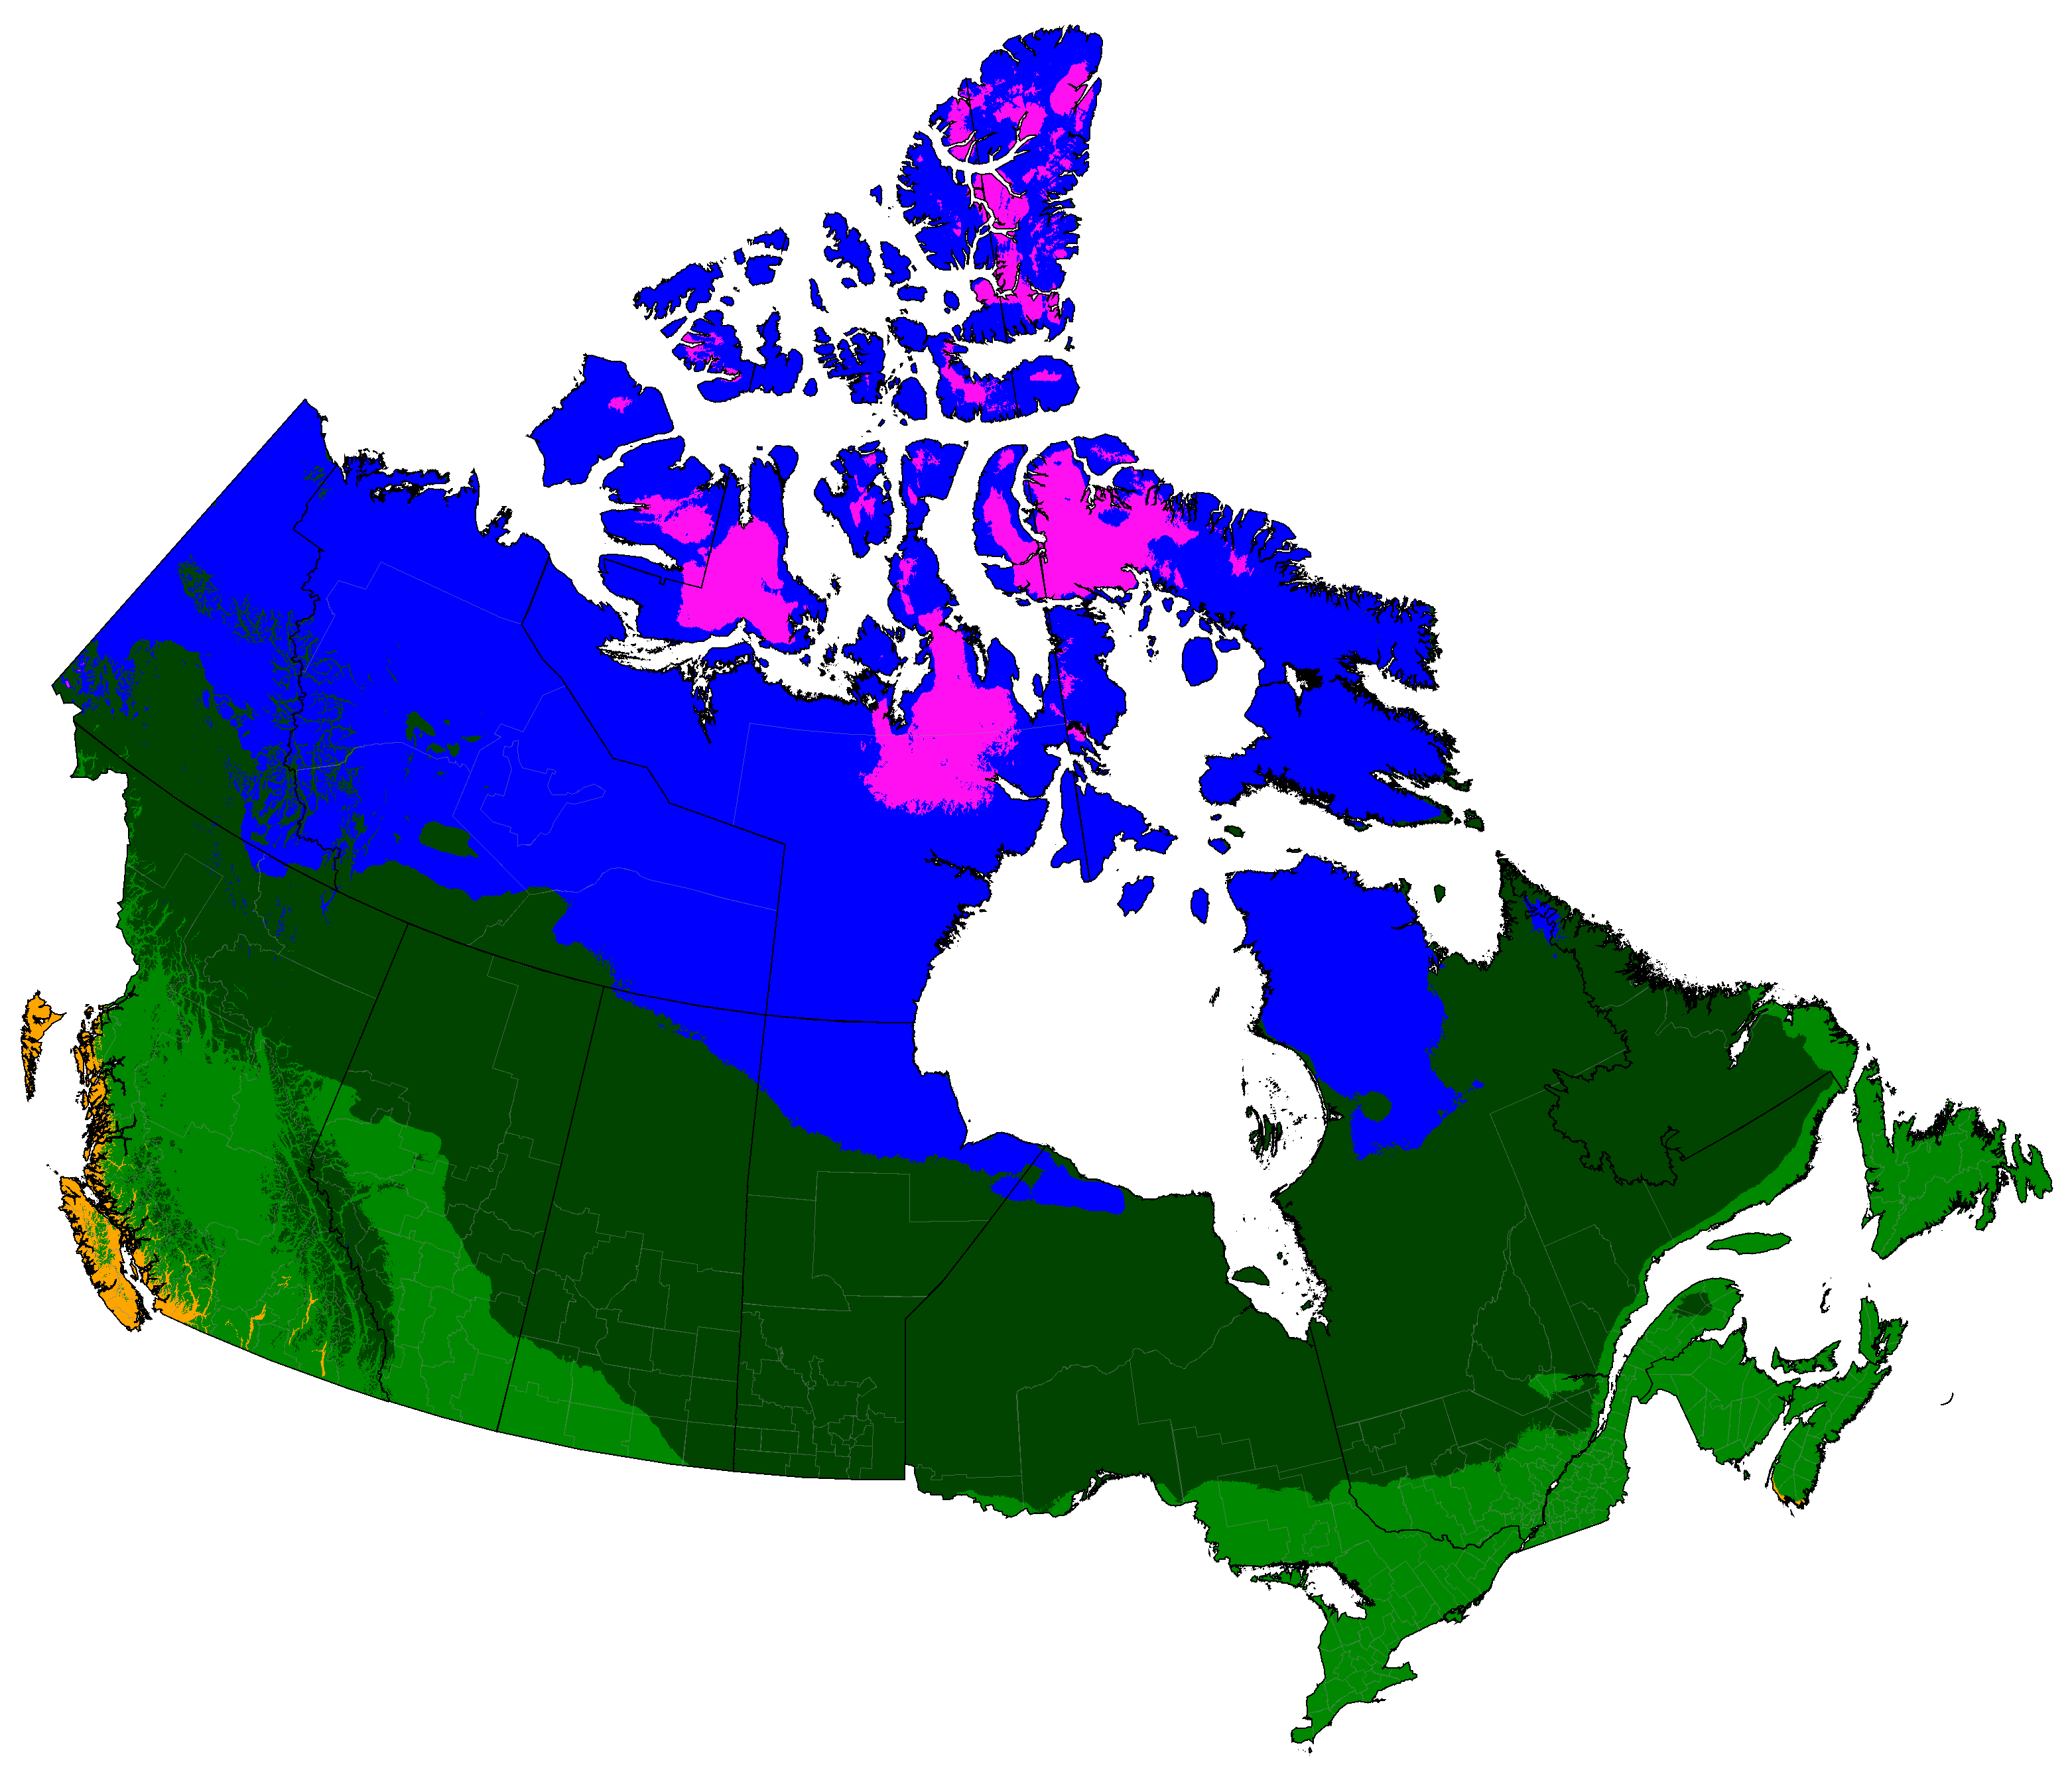
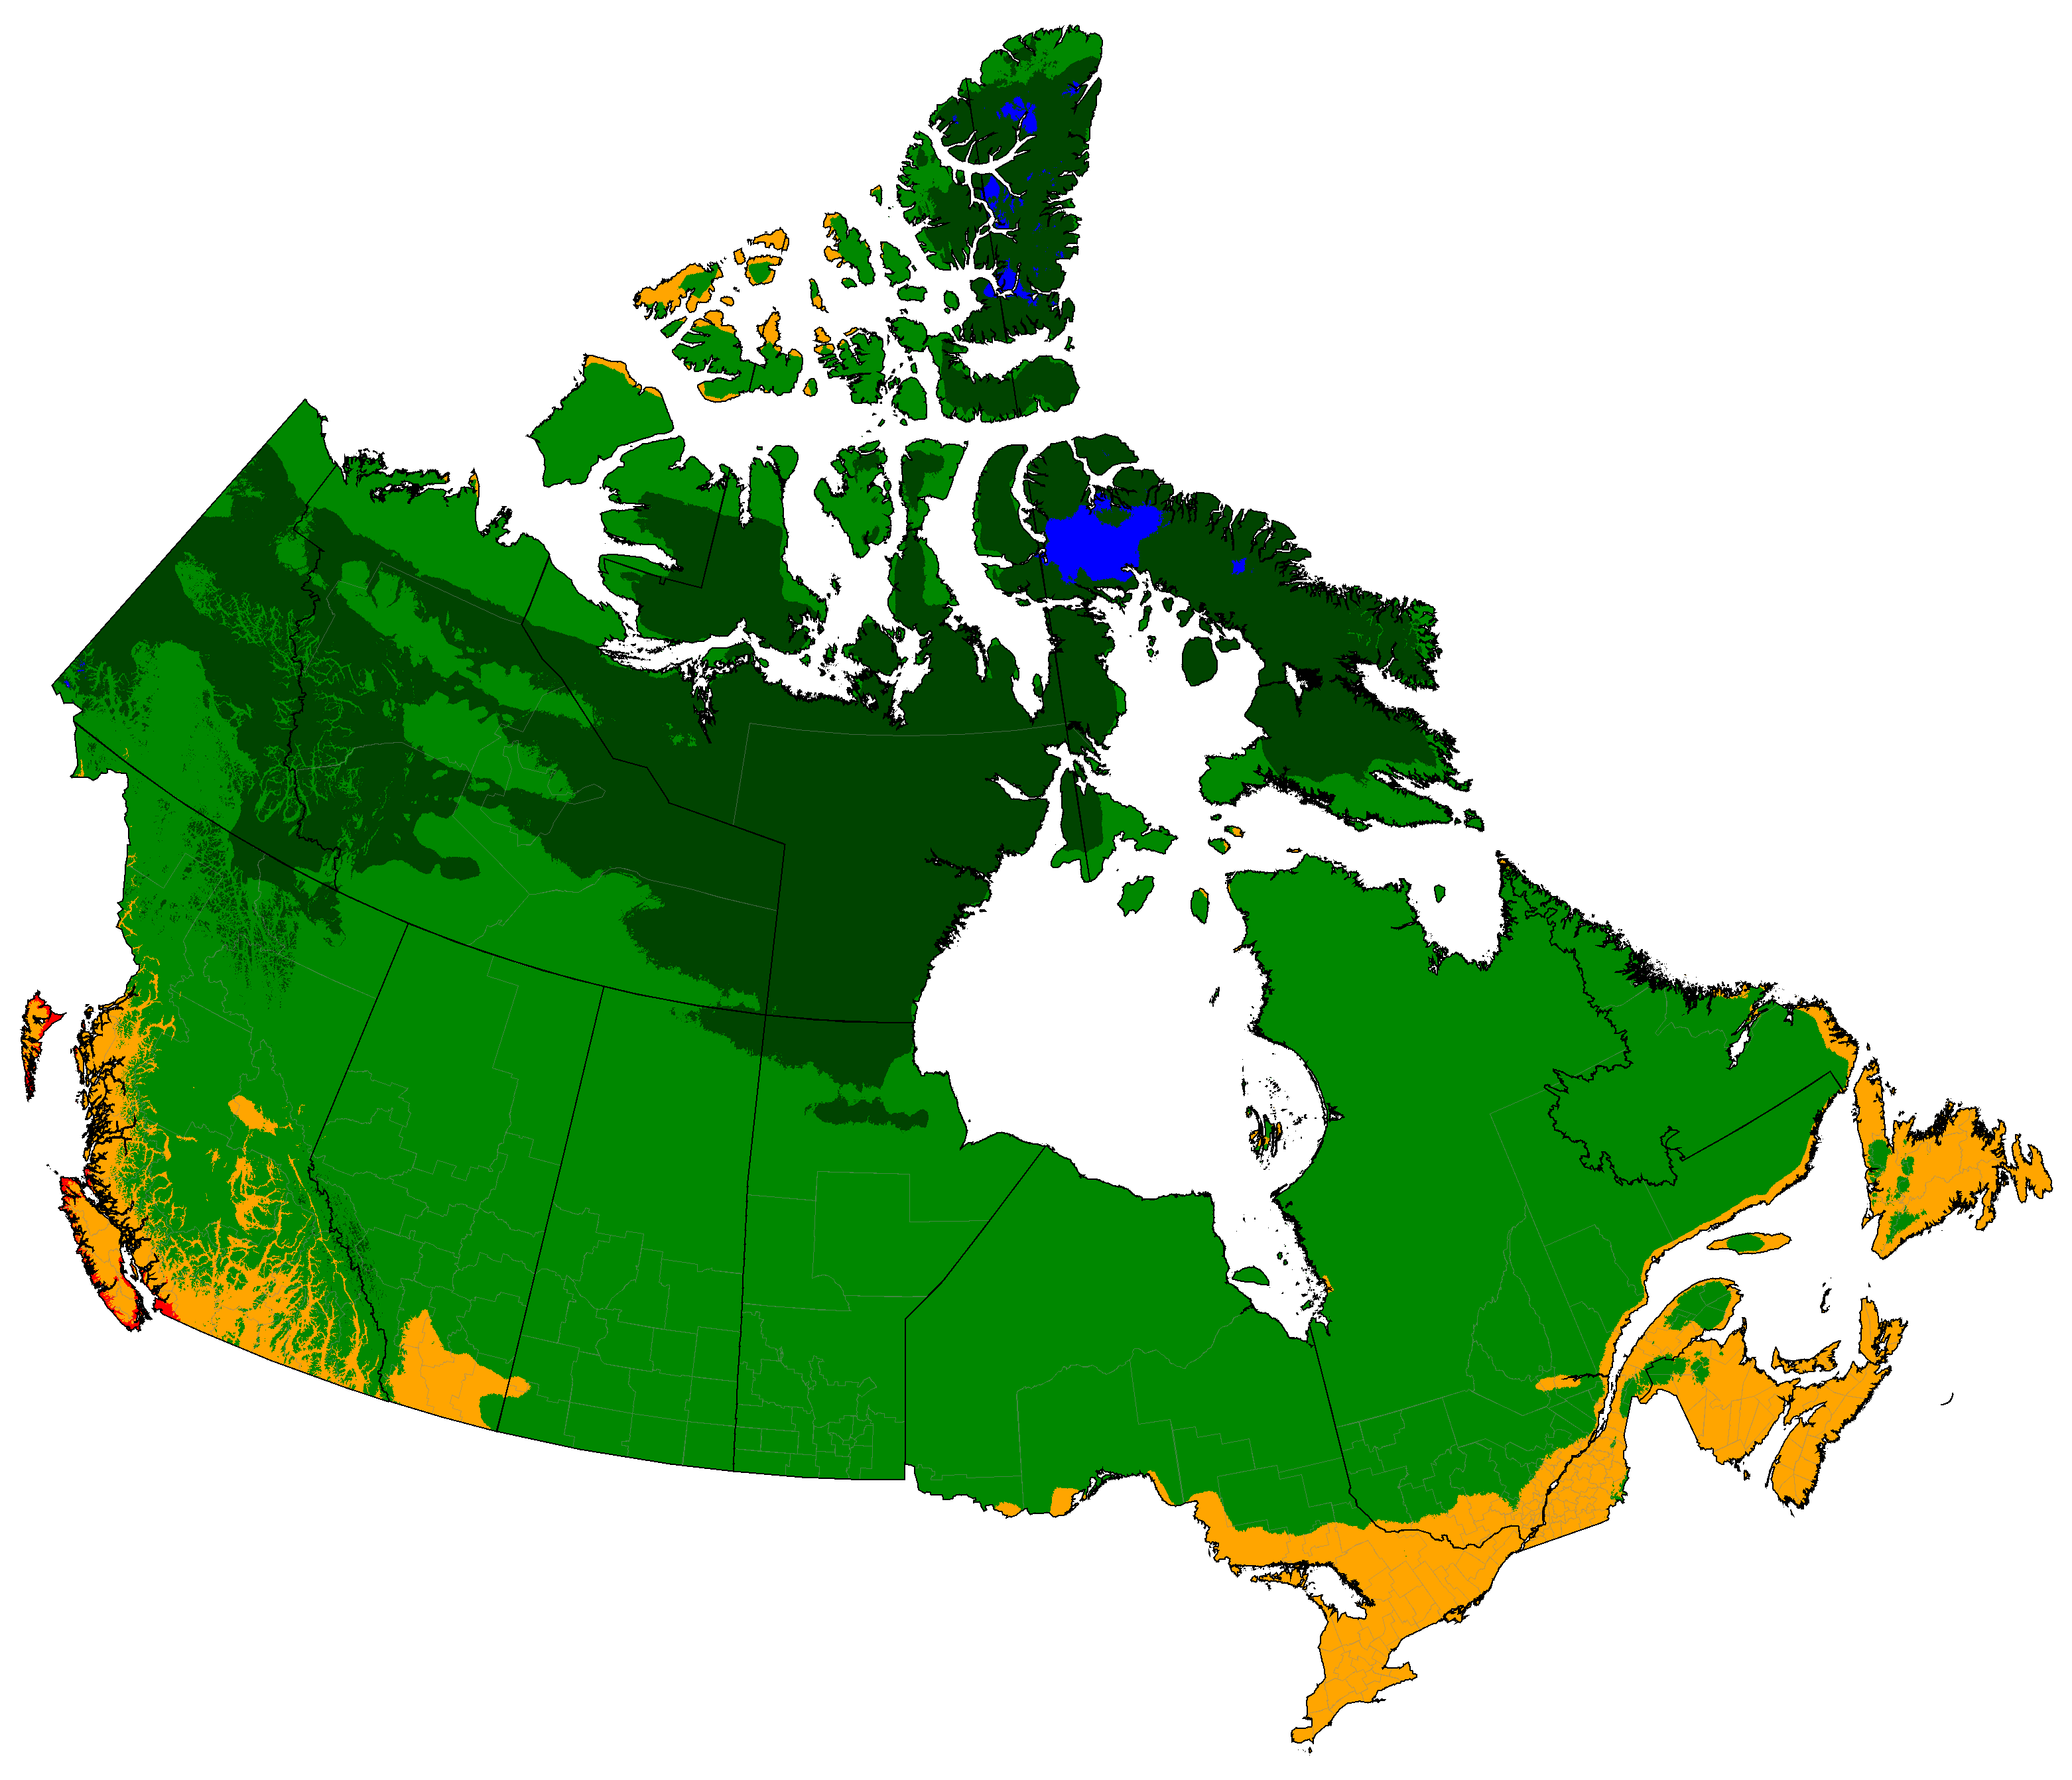
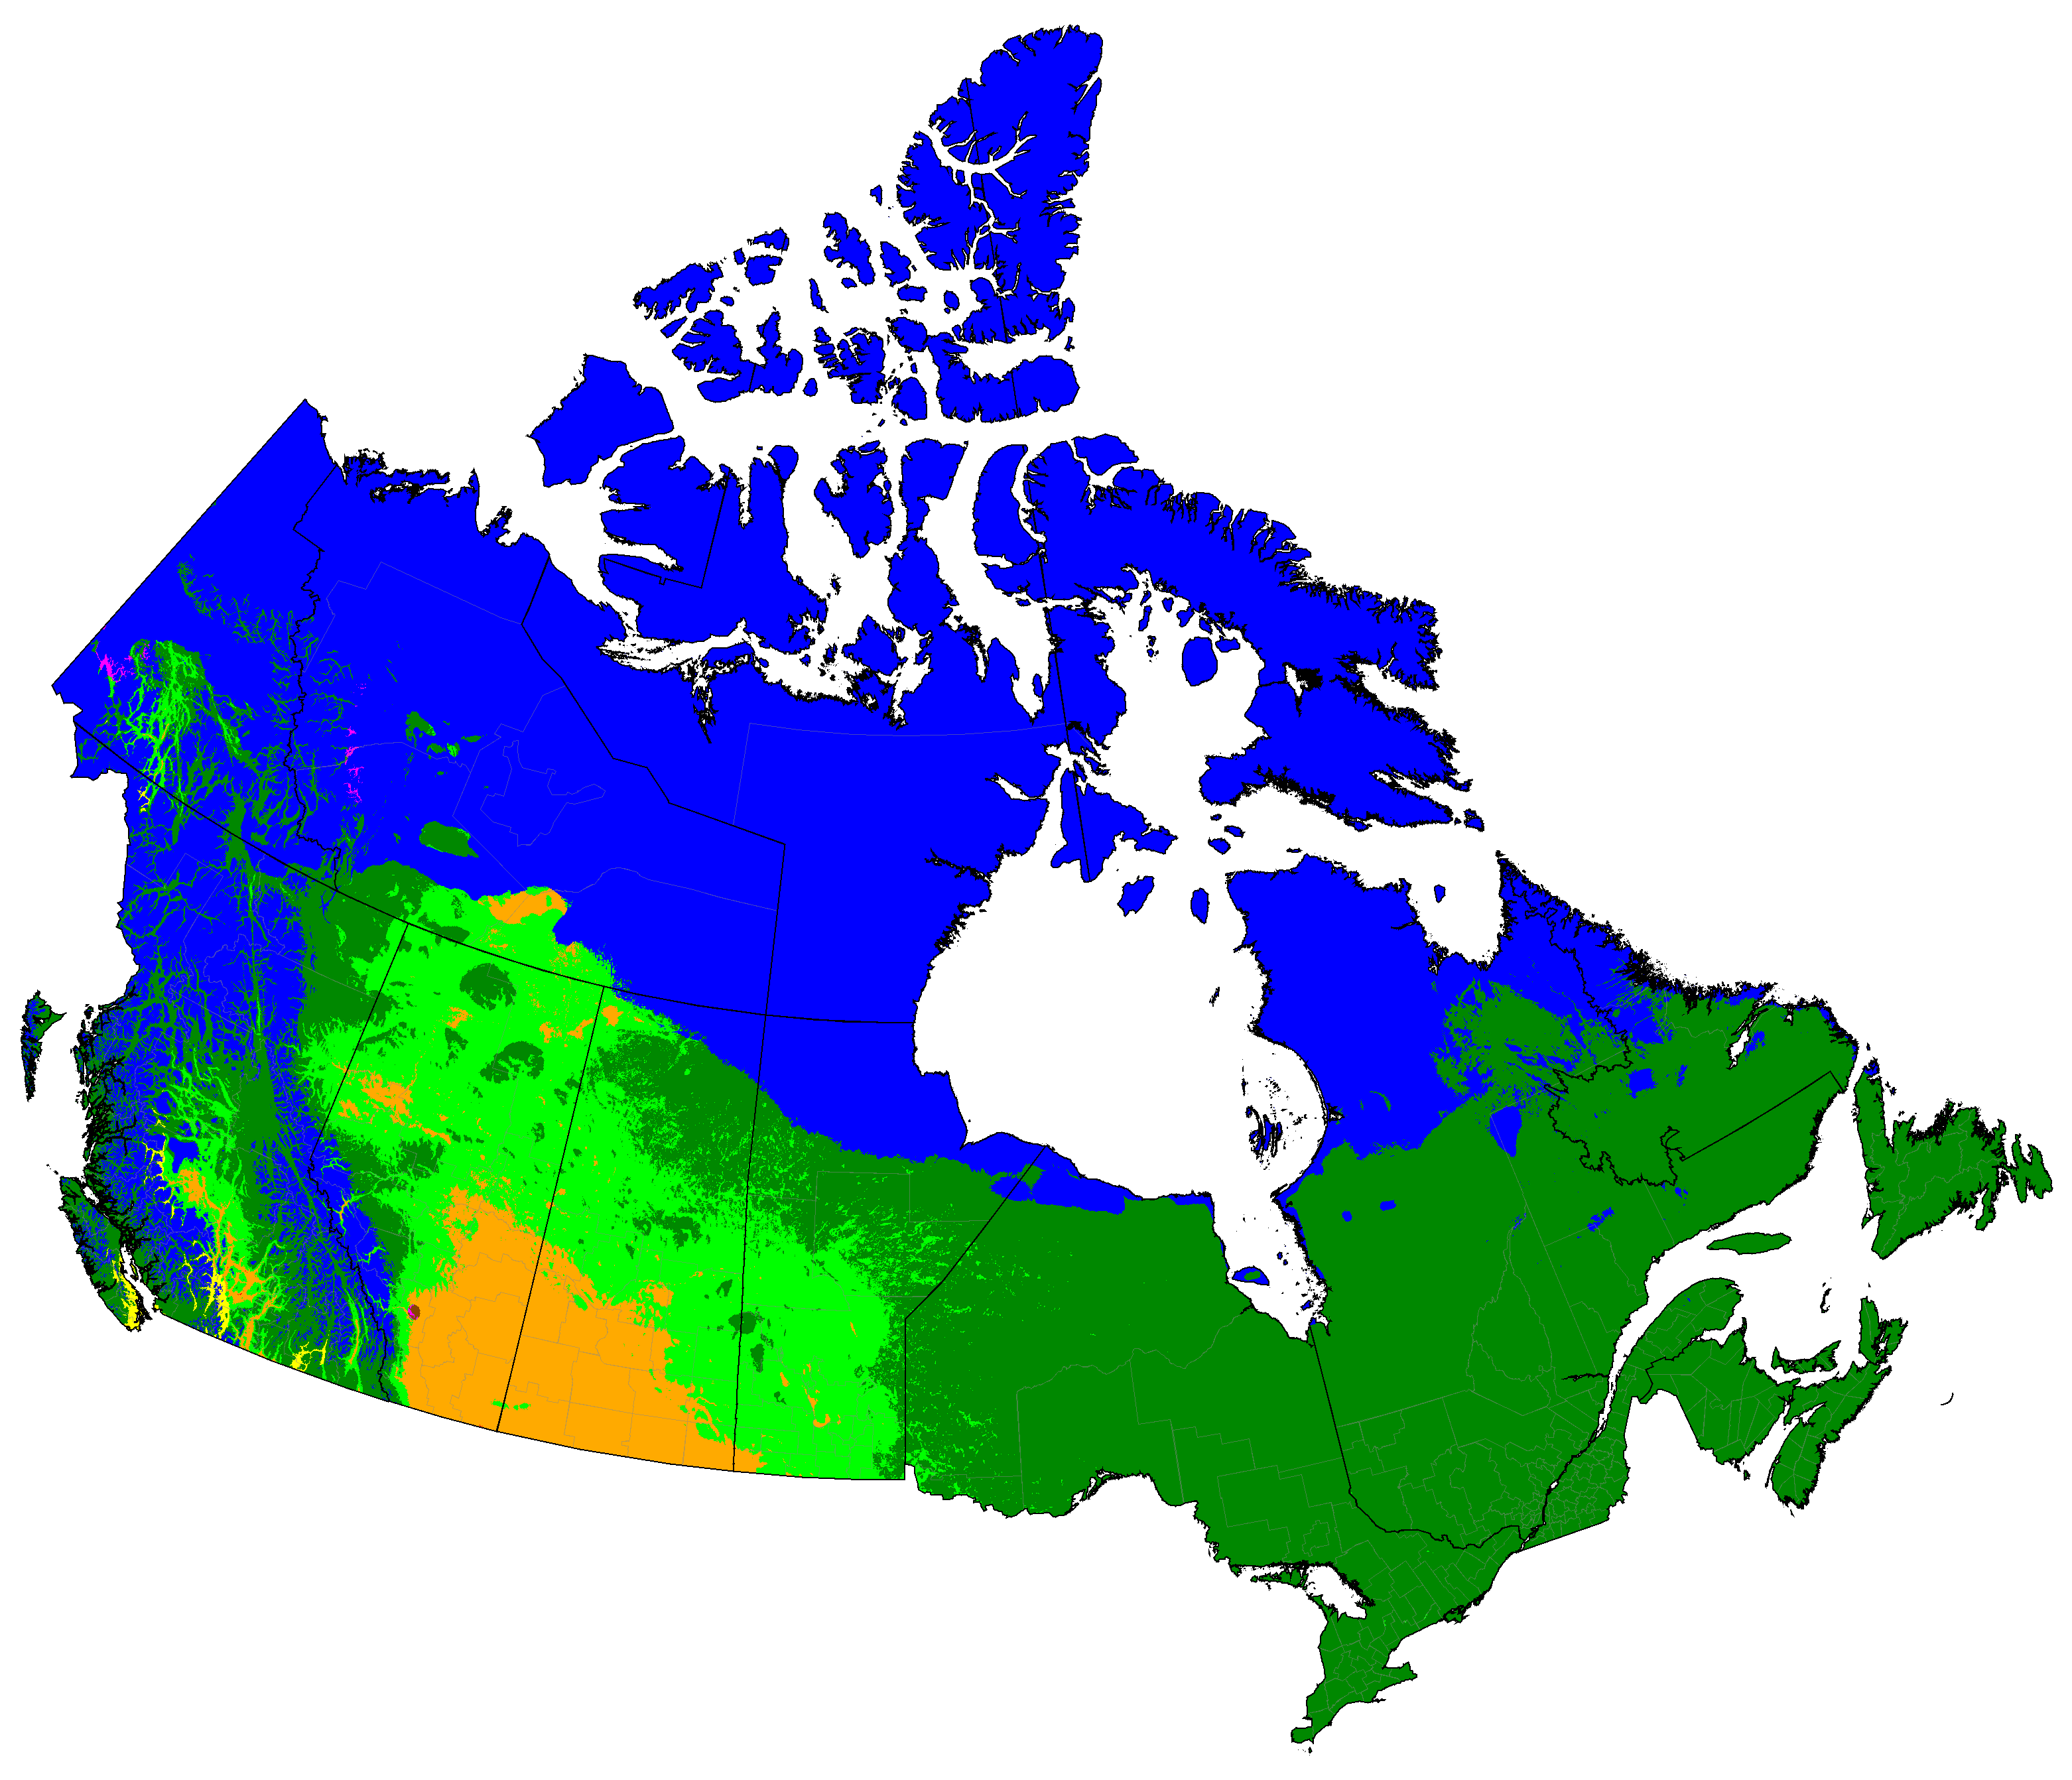
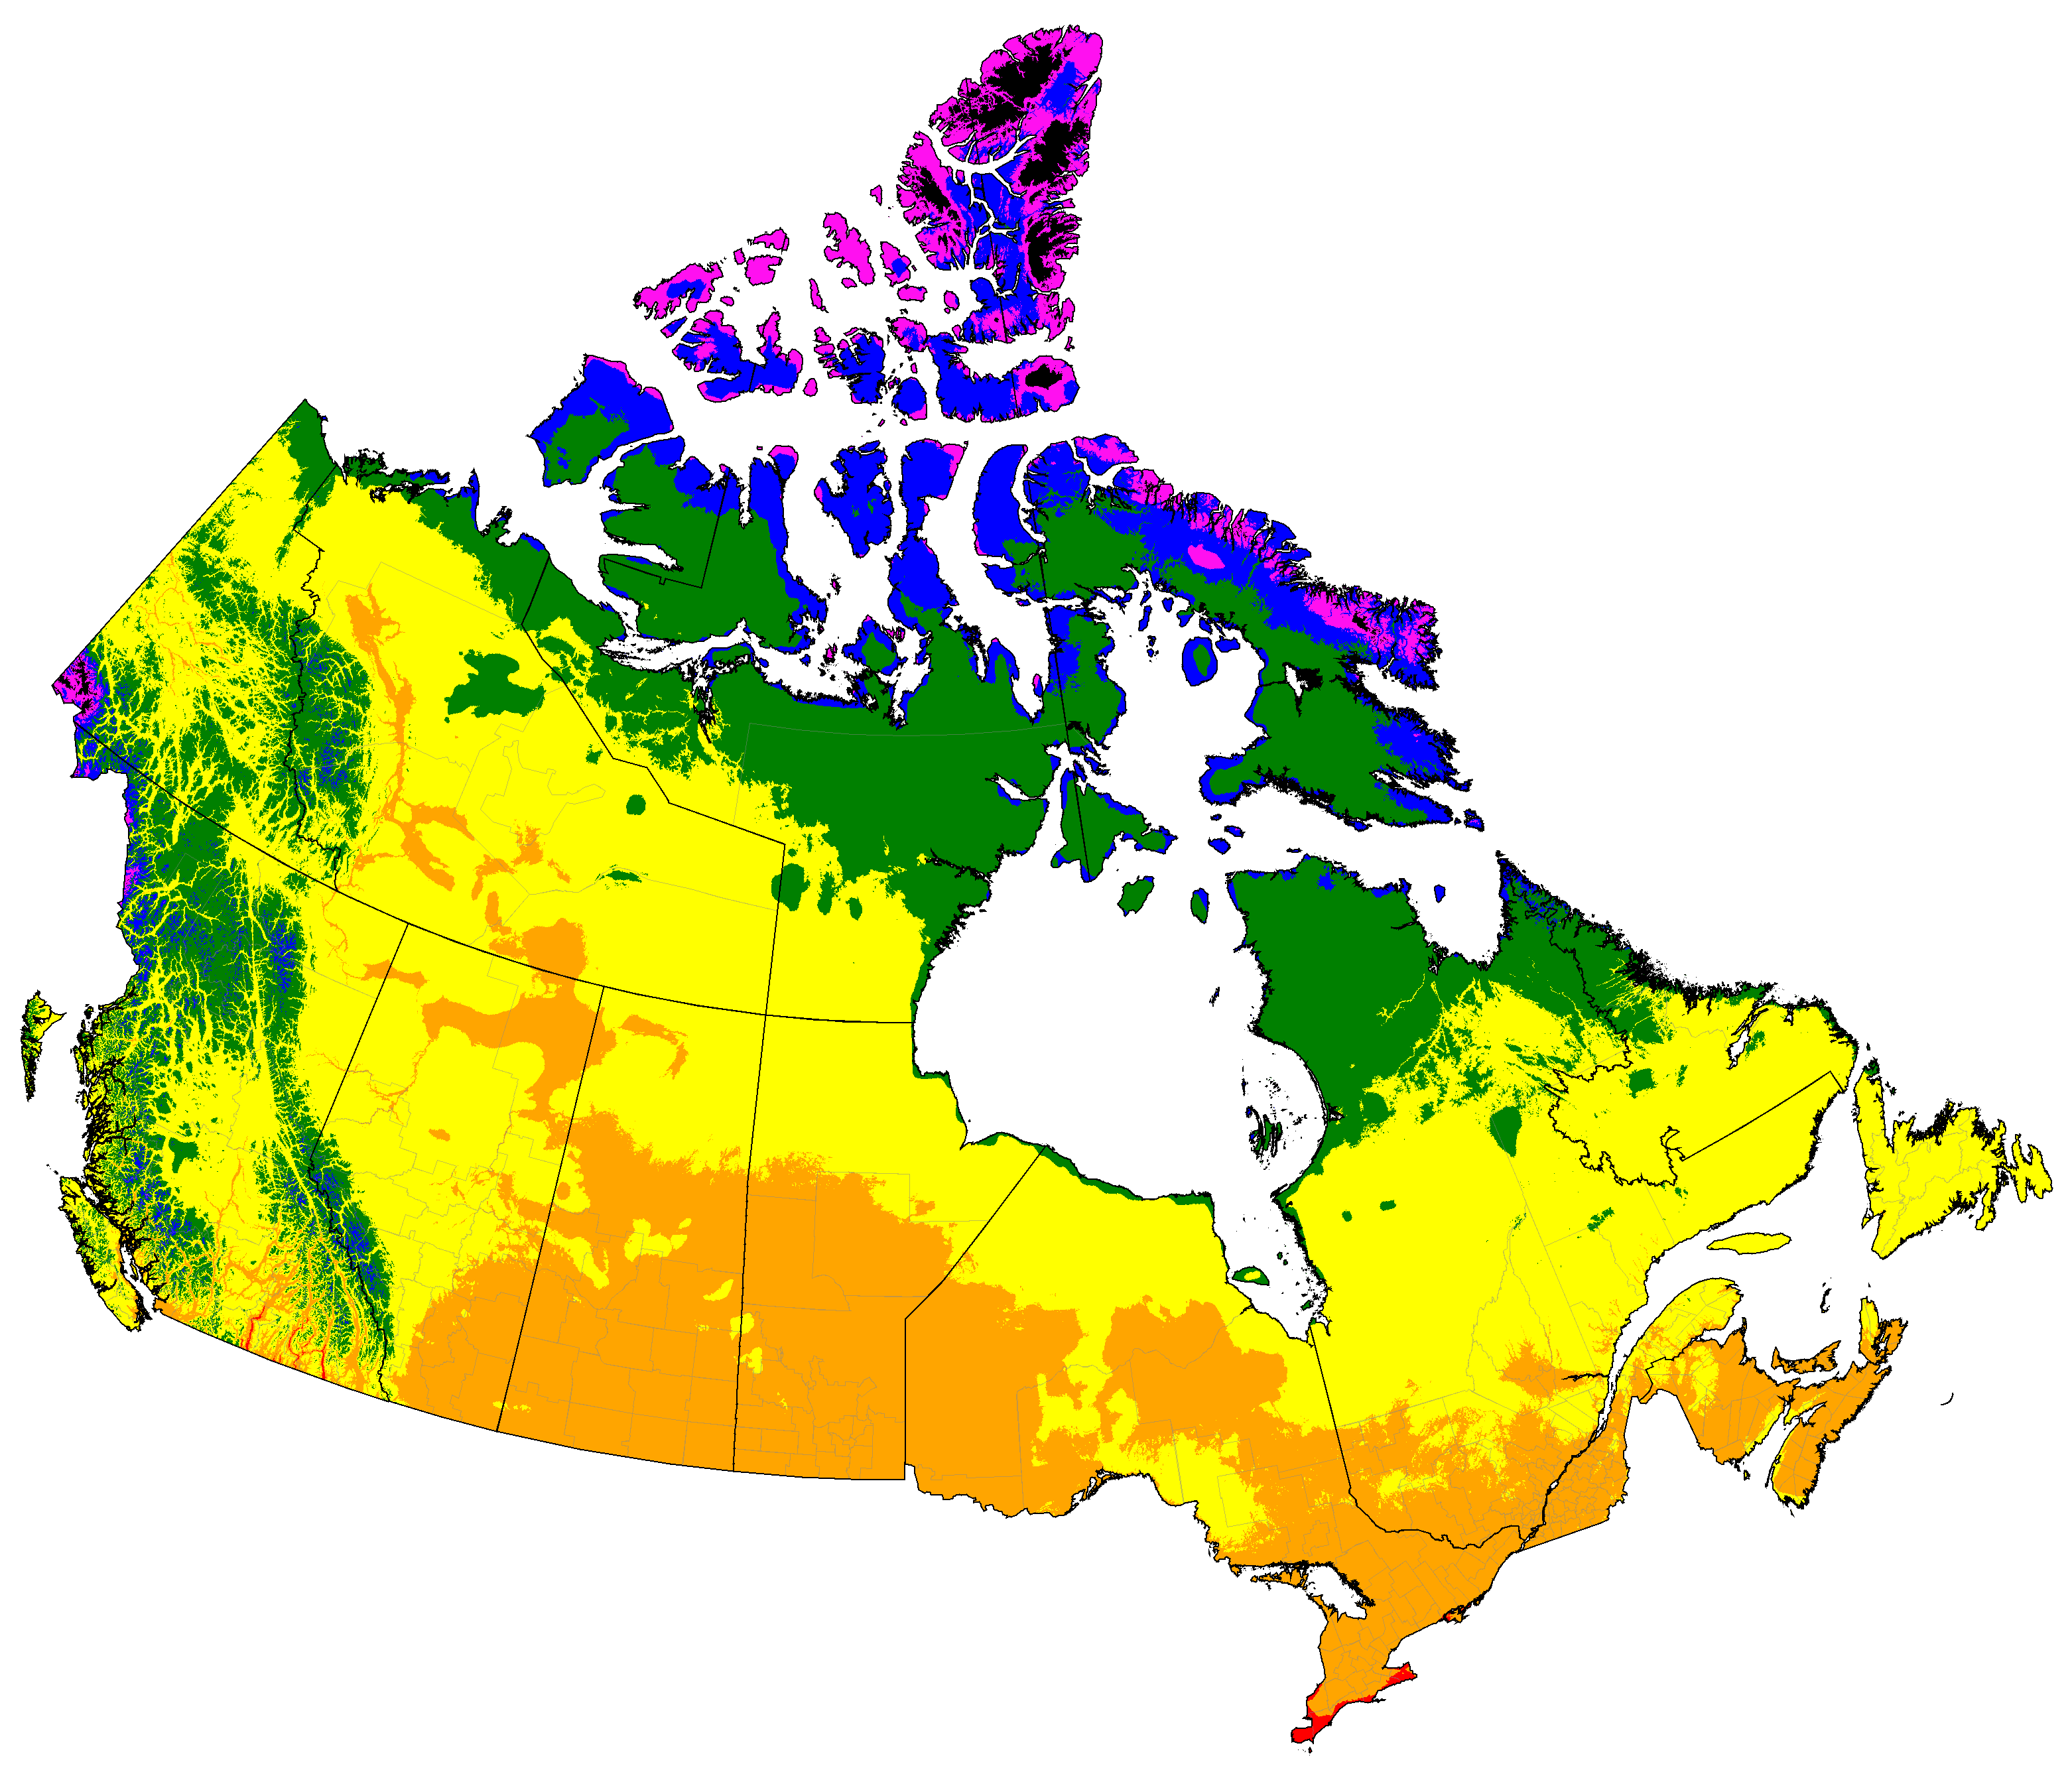
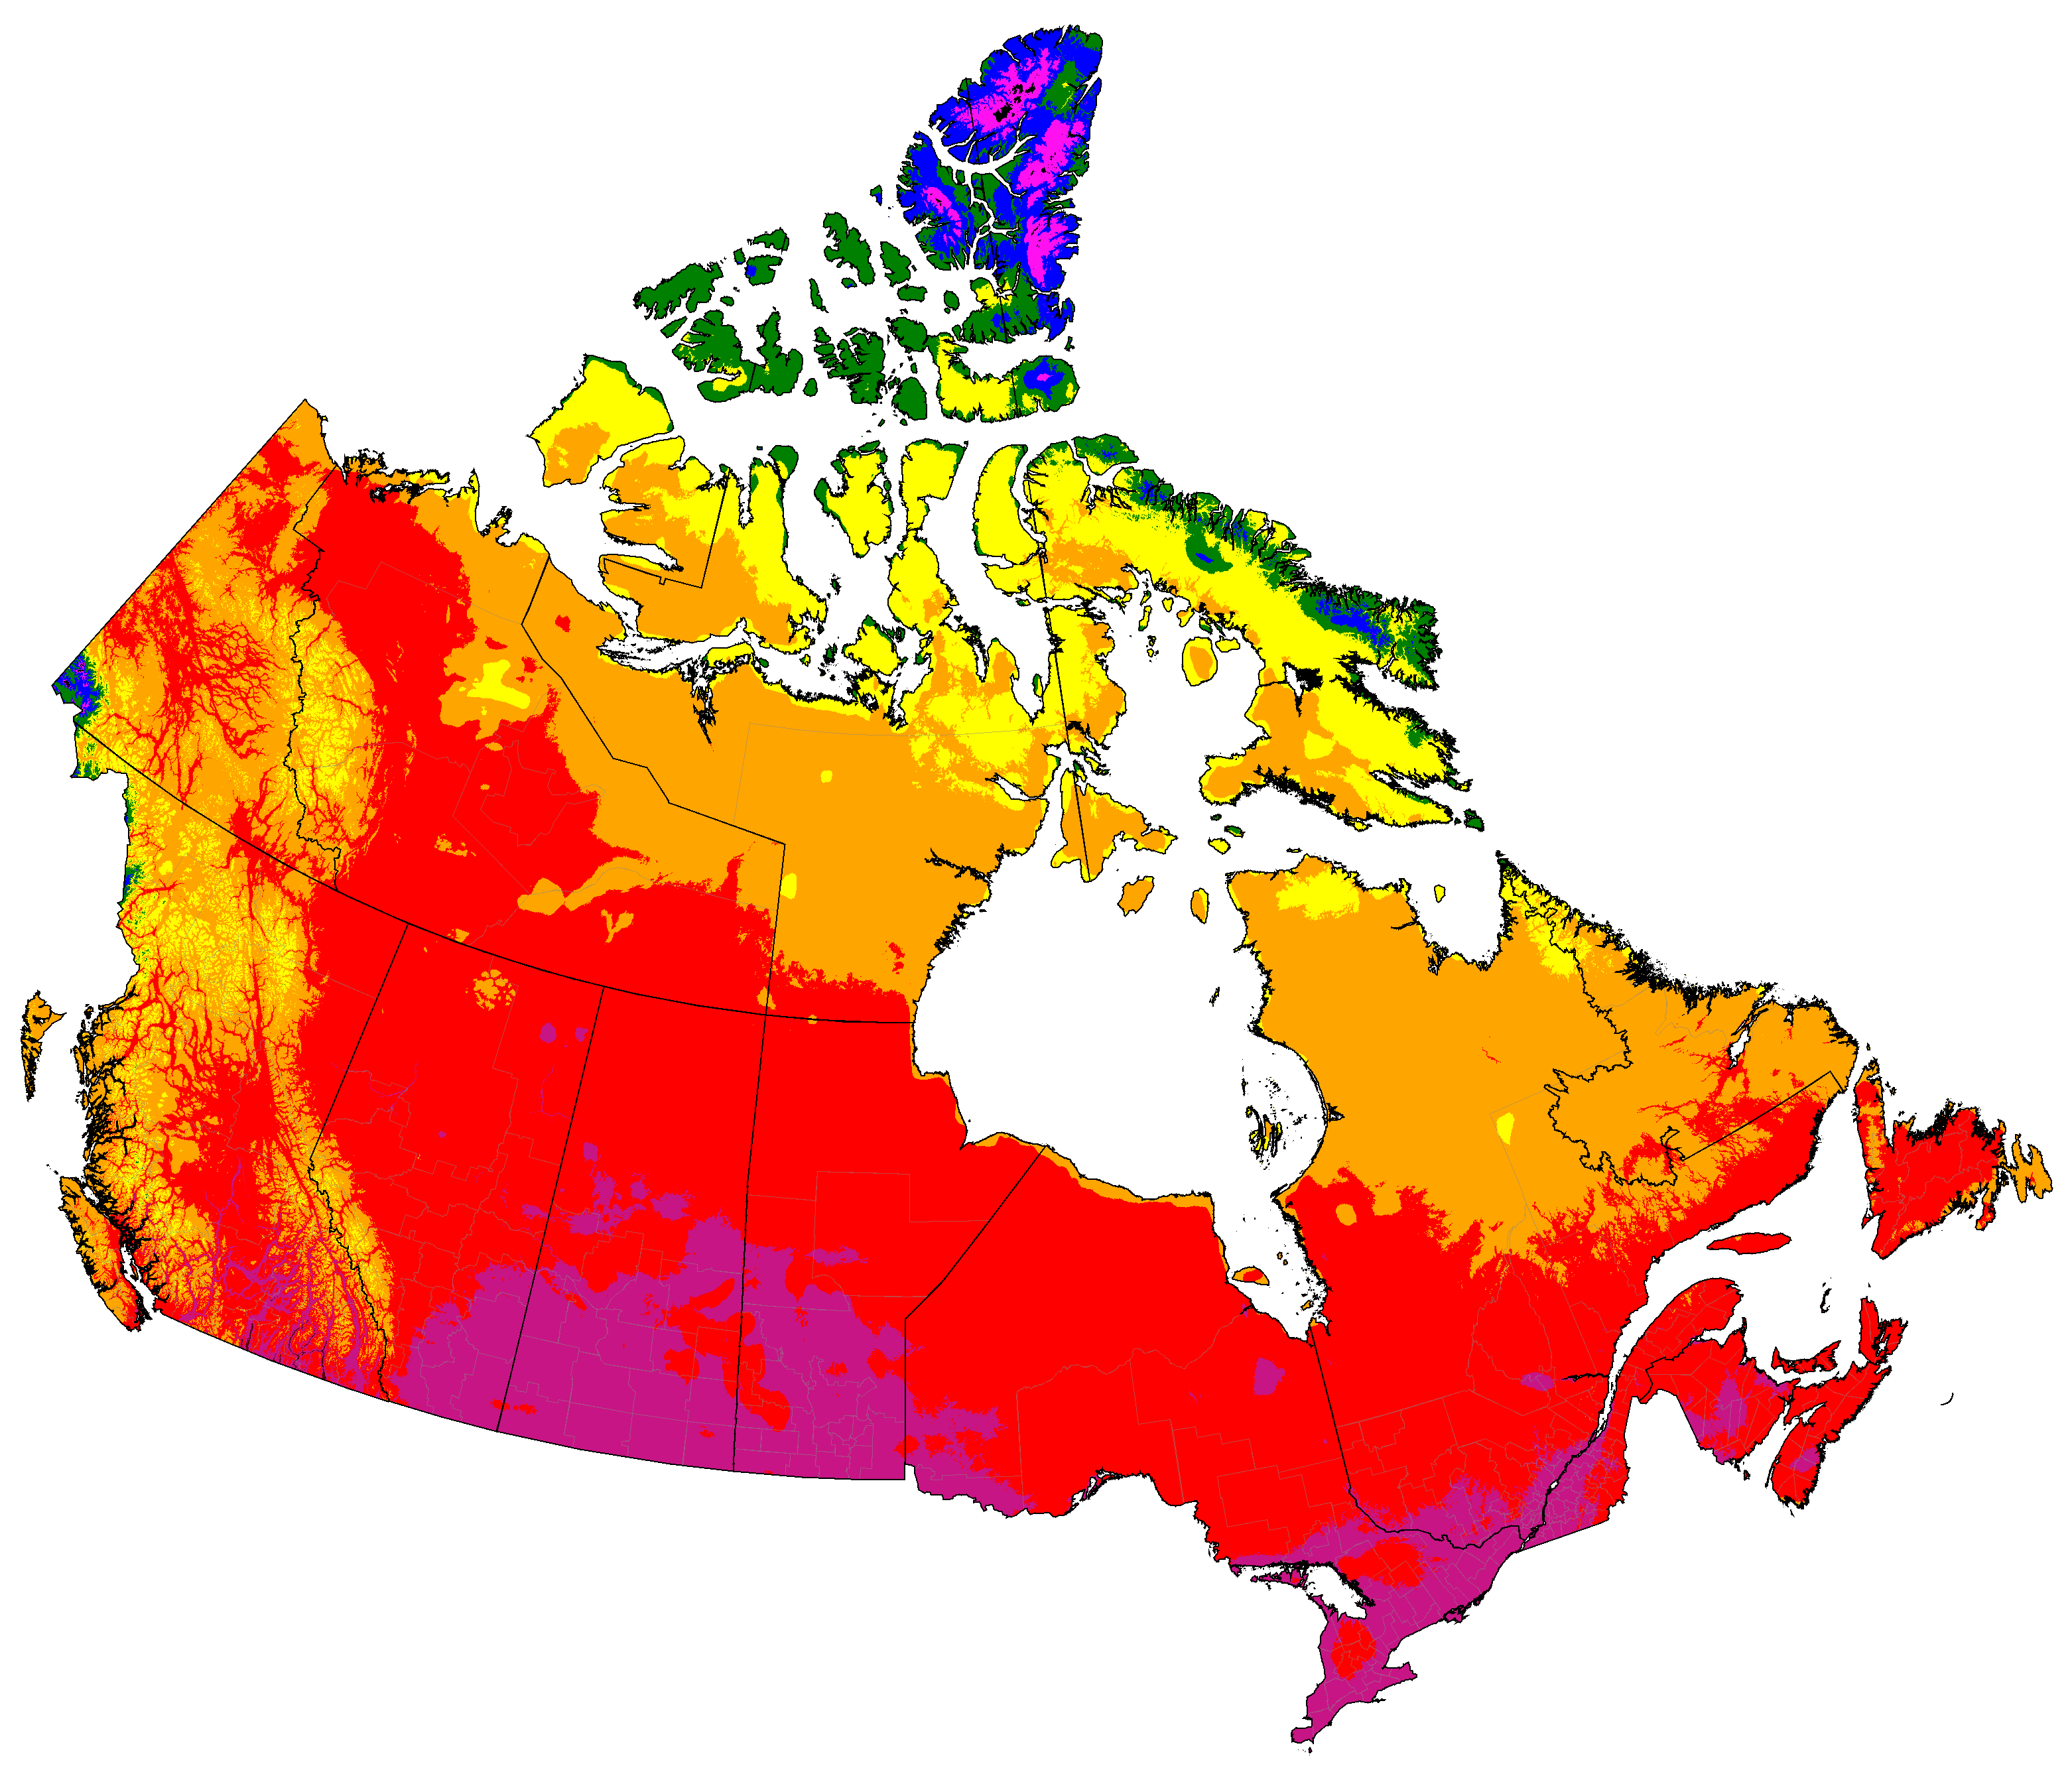
Canada distribution of winter categories (projections are SSP5-8.5 high emissions normals)
Note: The vertical line in the middle of Nunavut is a cartographic artifact, not a political boundary.
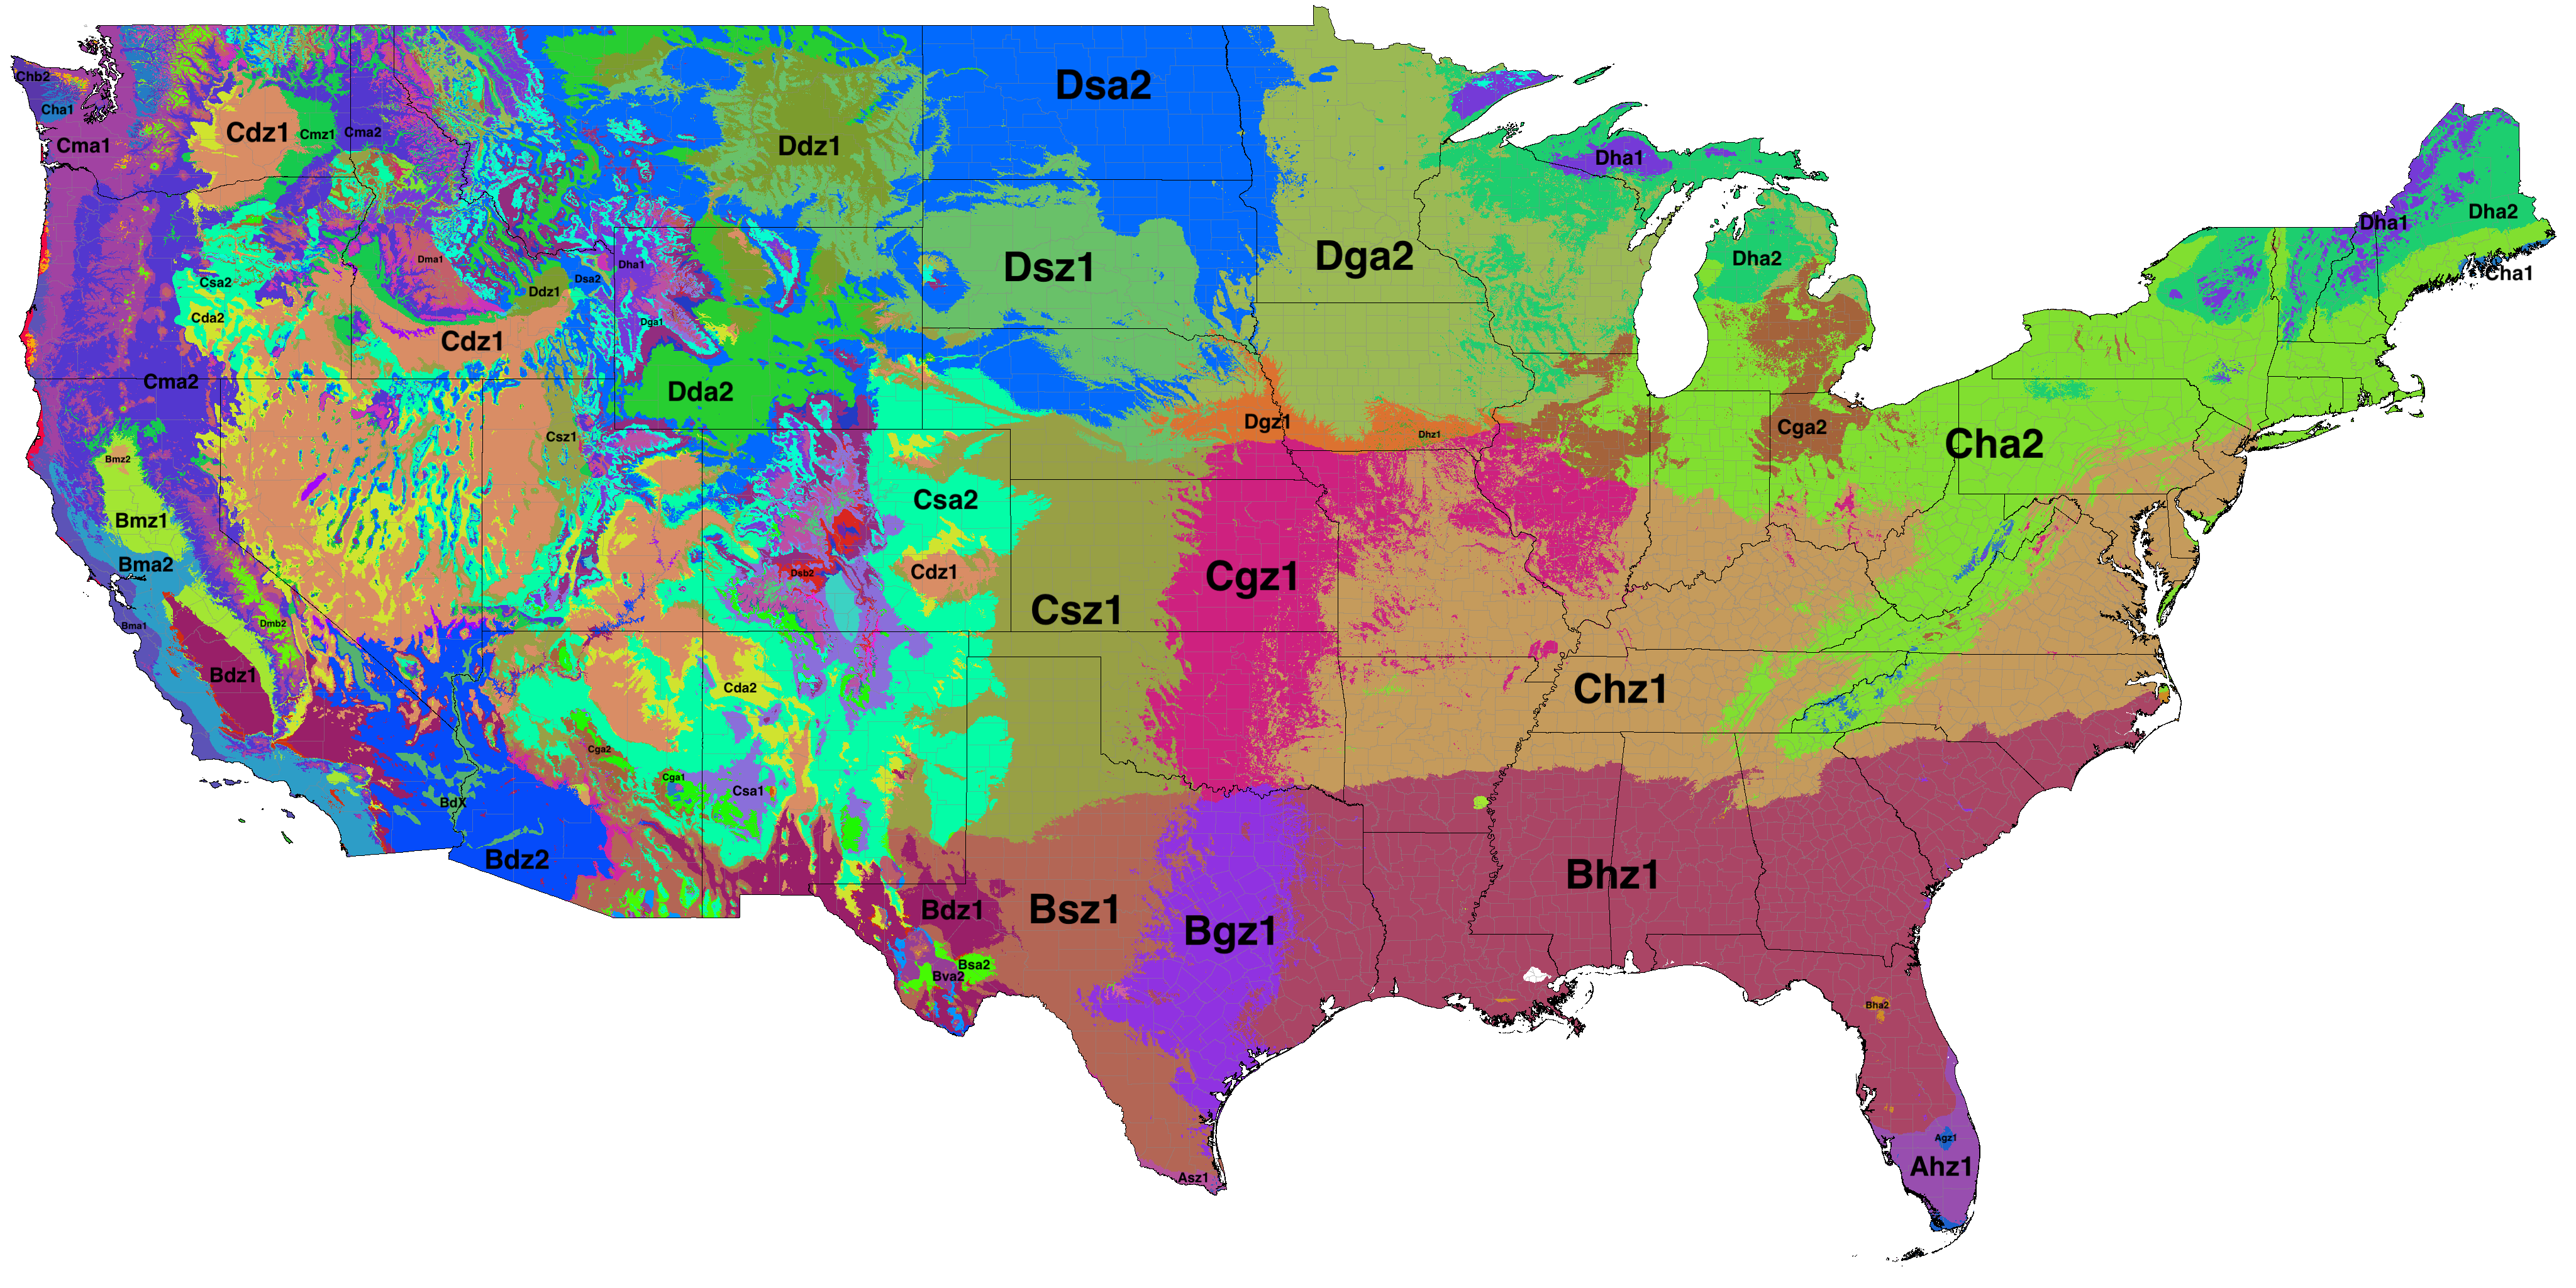
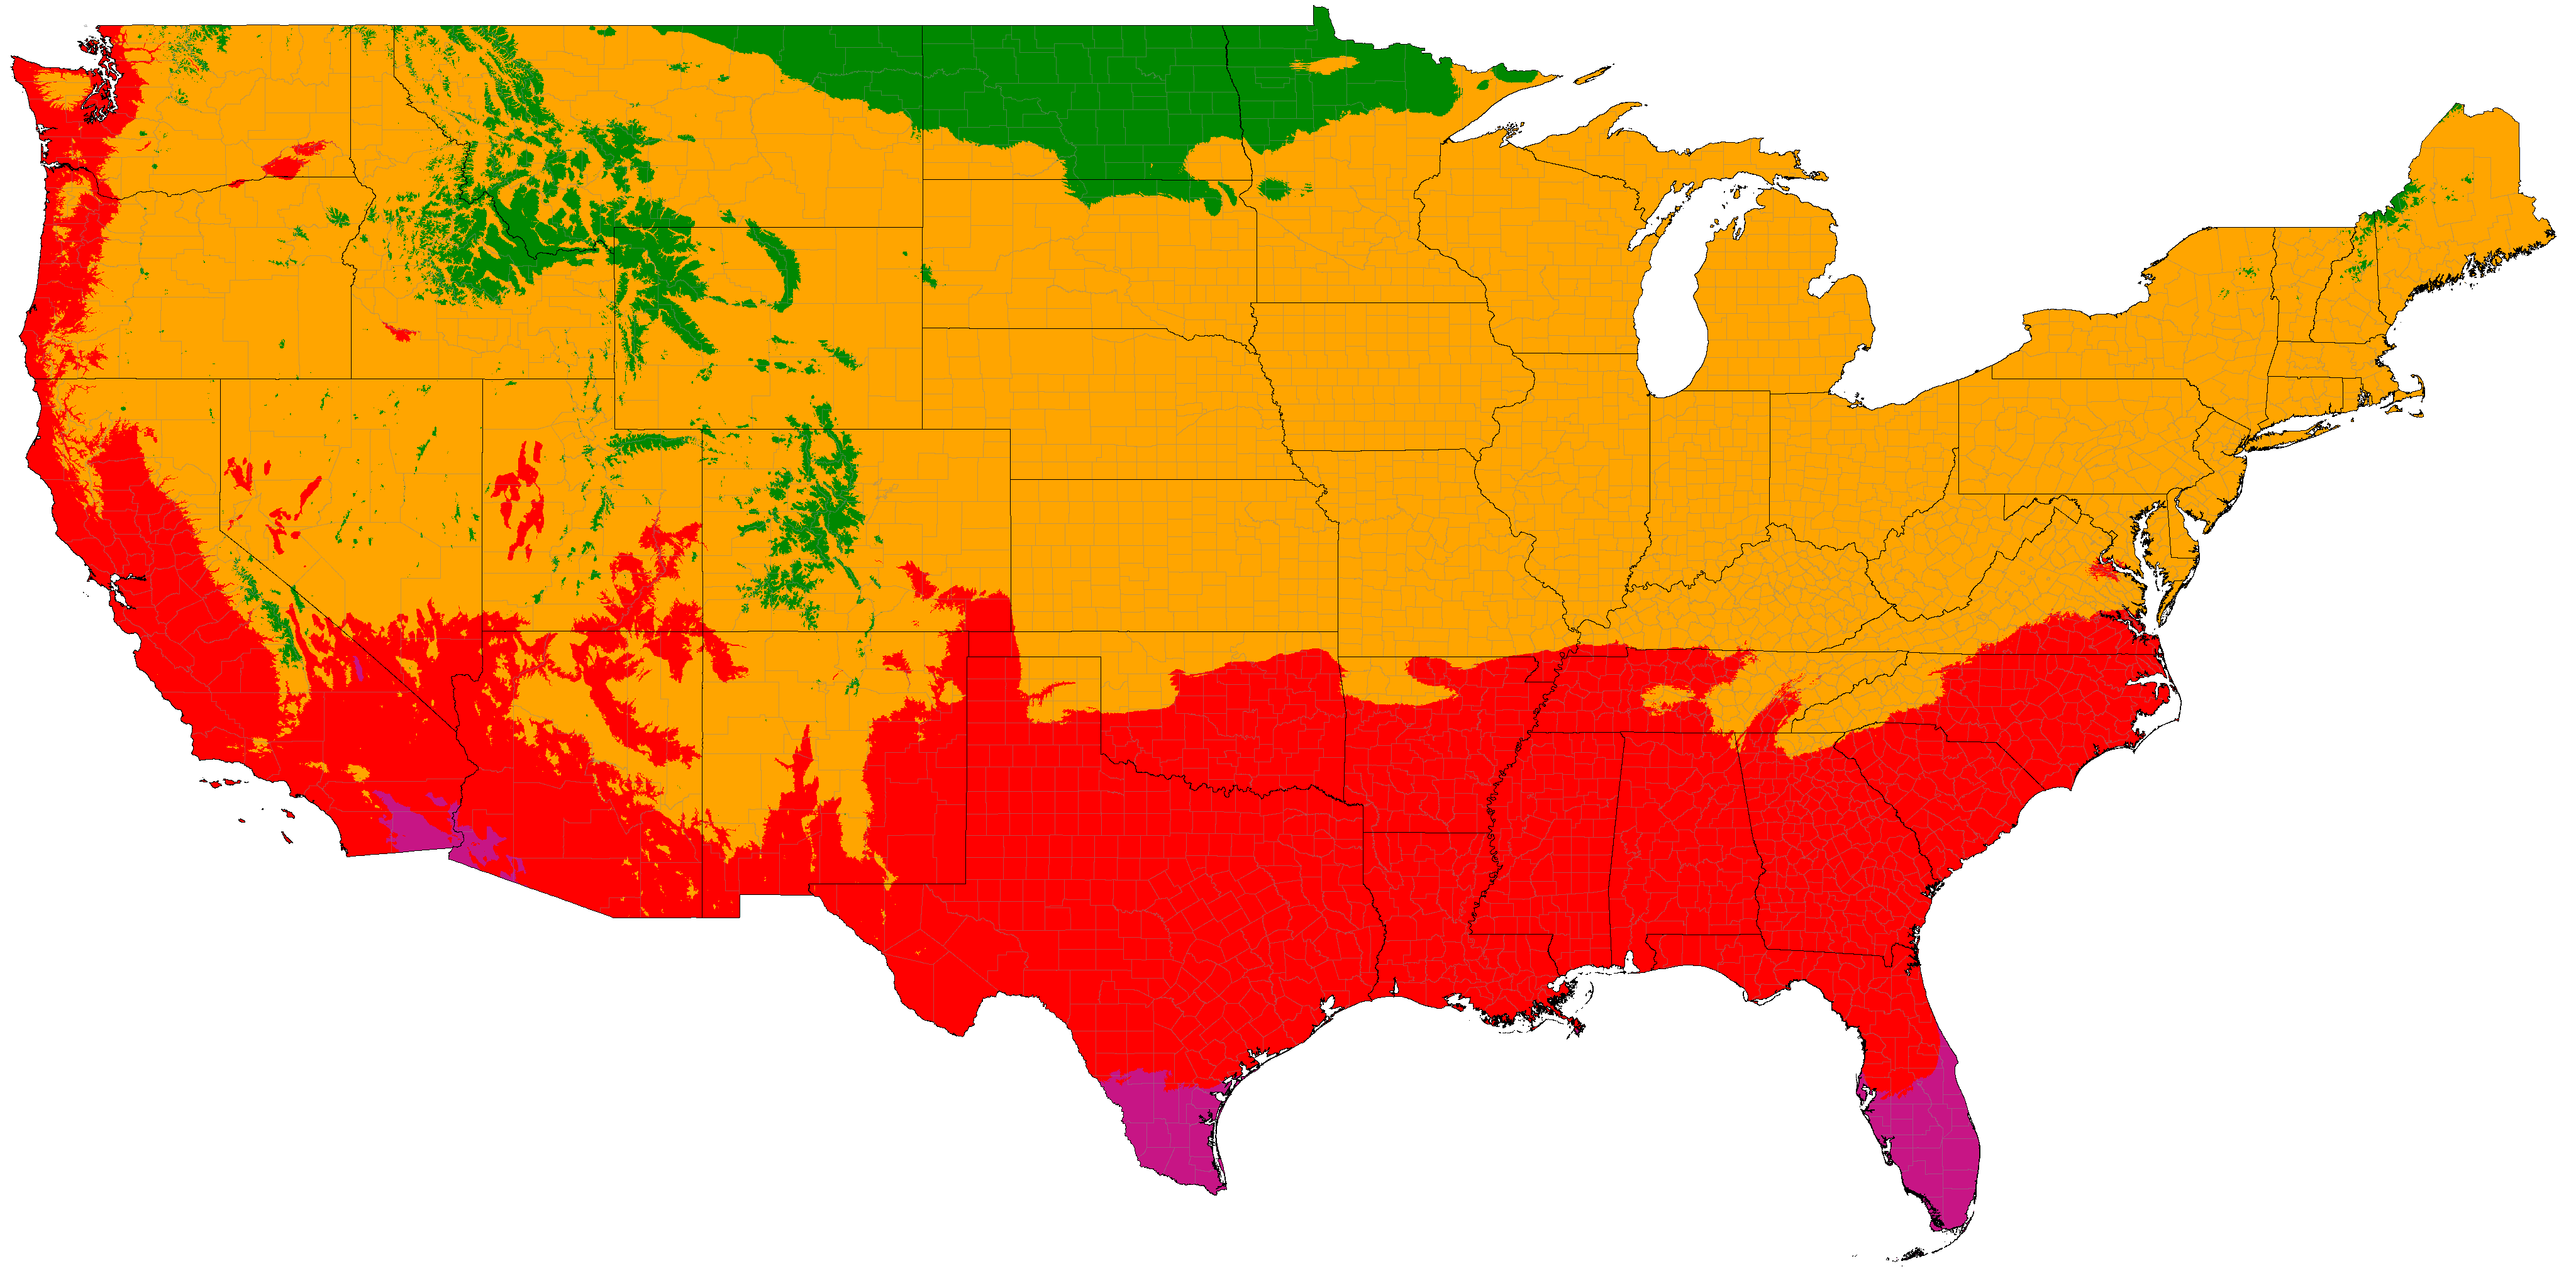
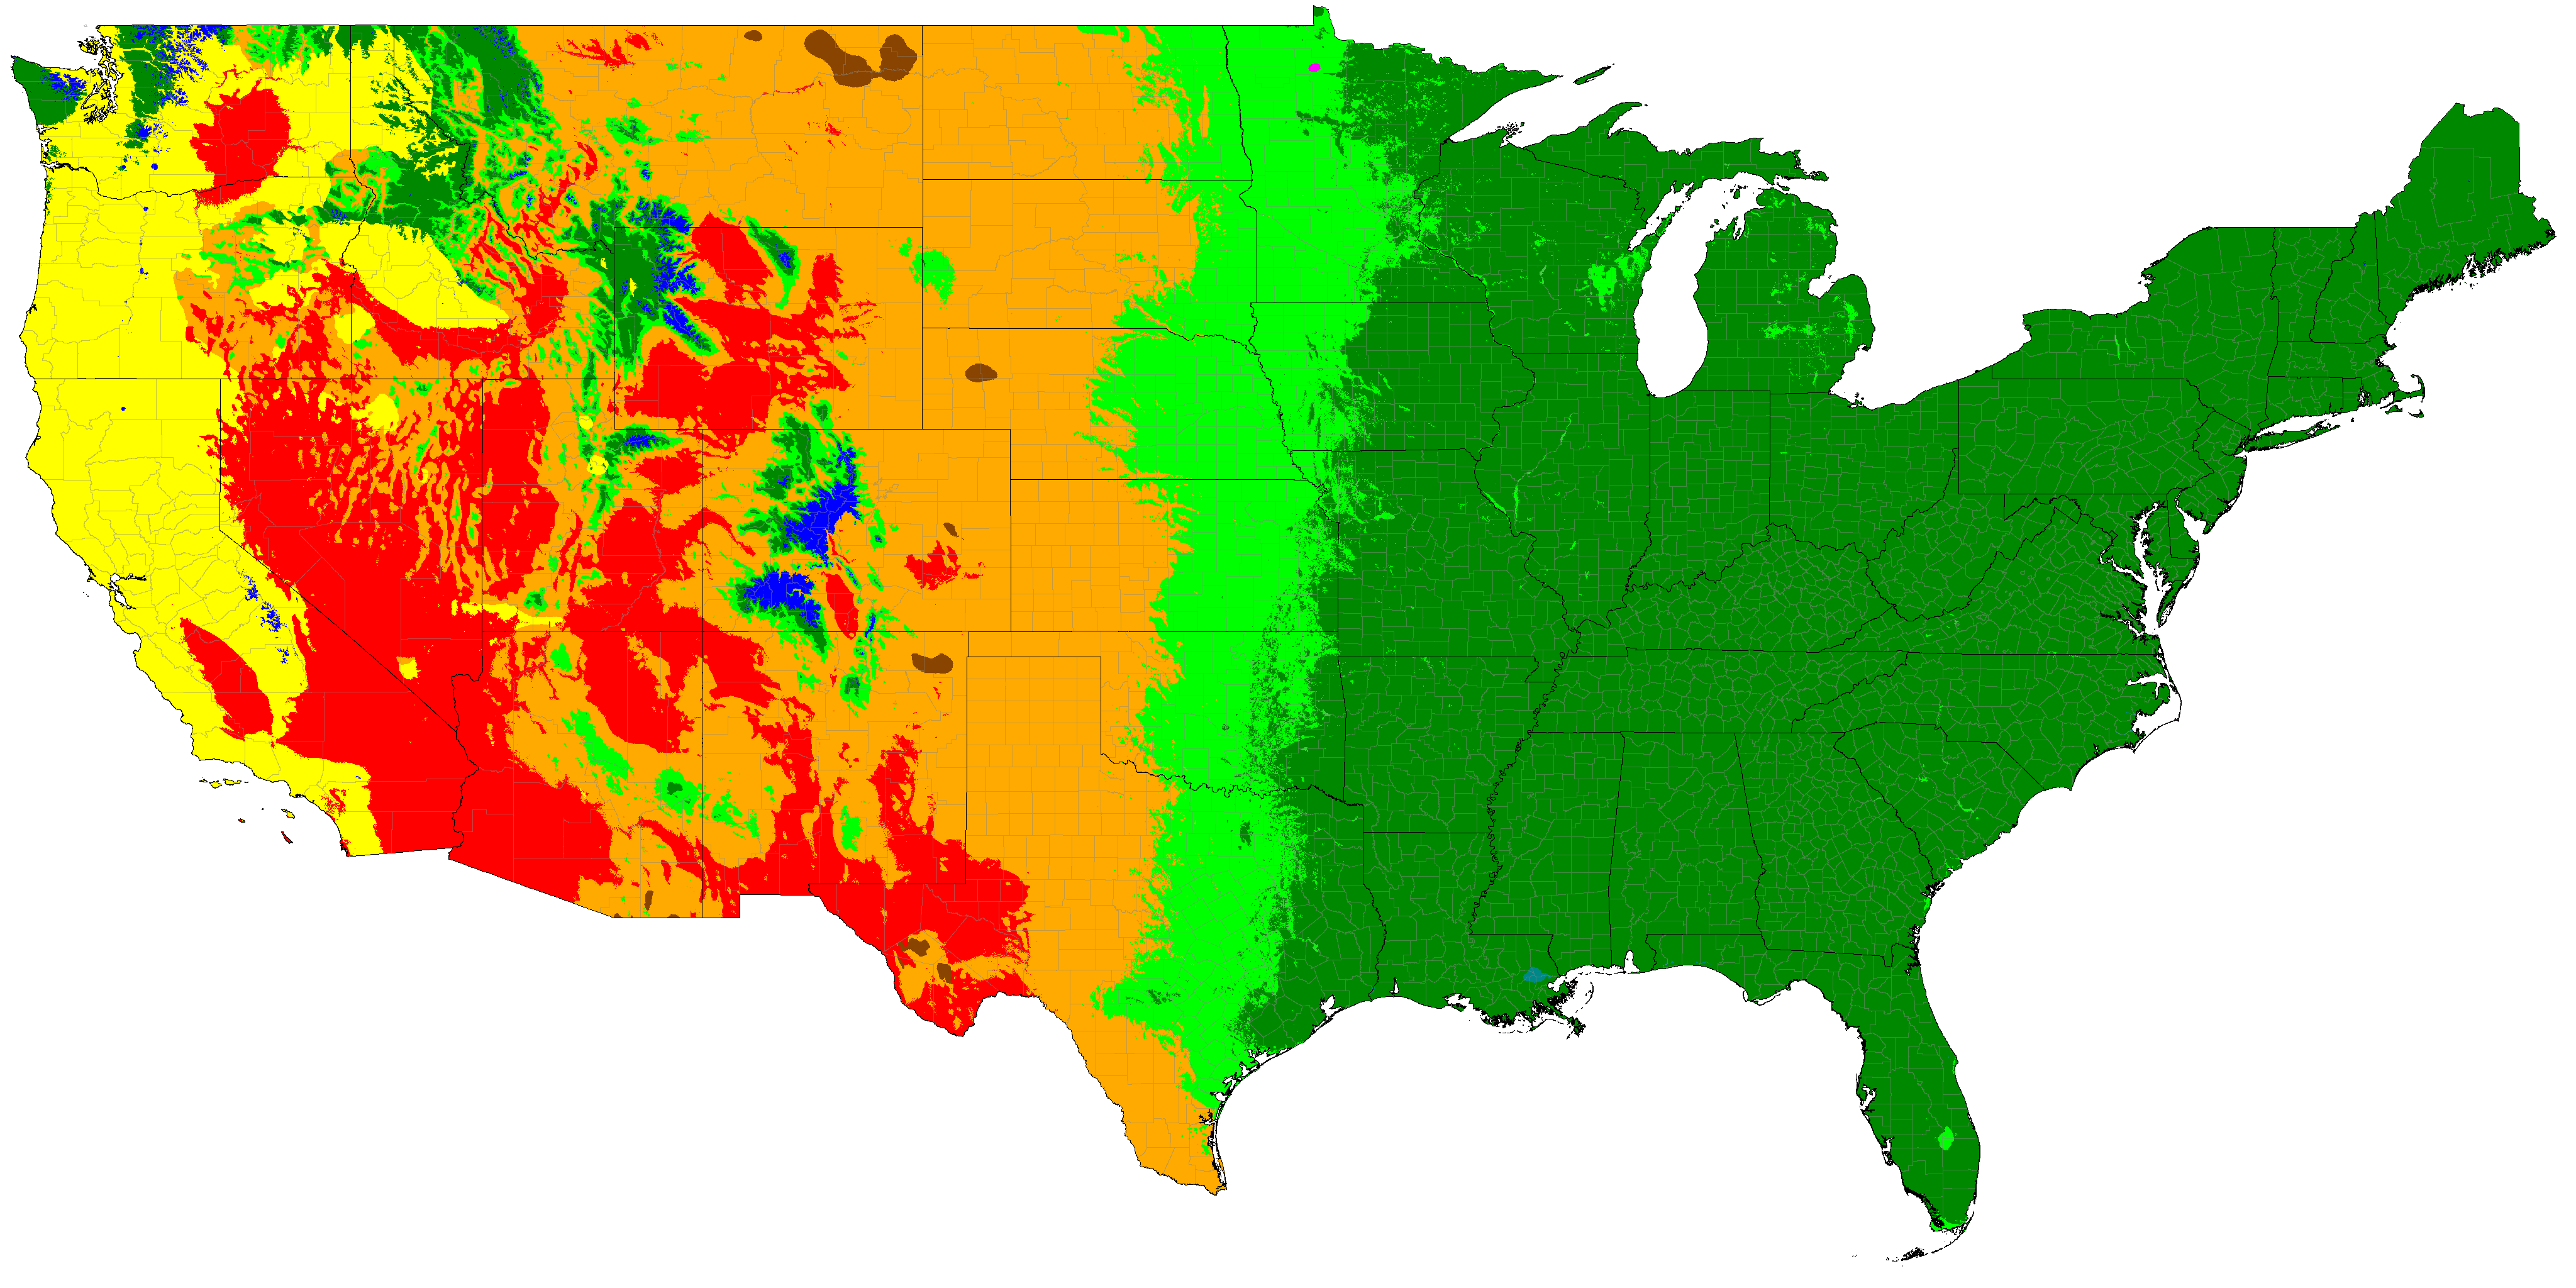
Contiguous United States distribution of winter categories (projections are SSP5-8.5 high emissions normals)
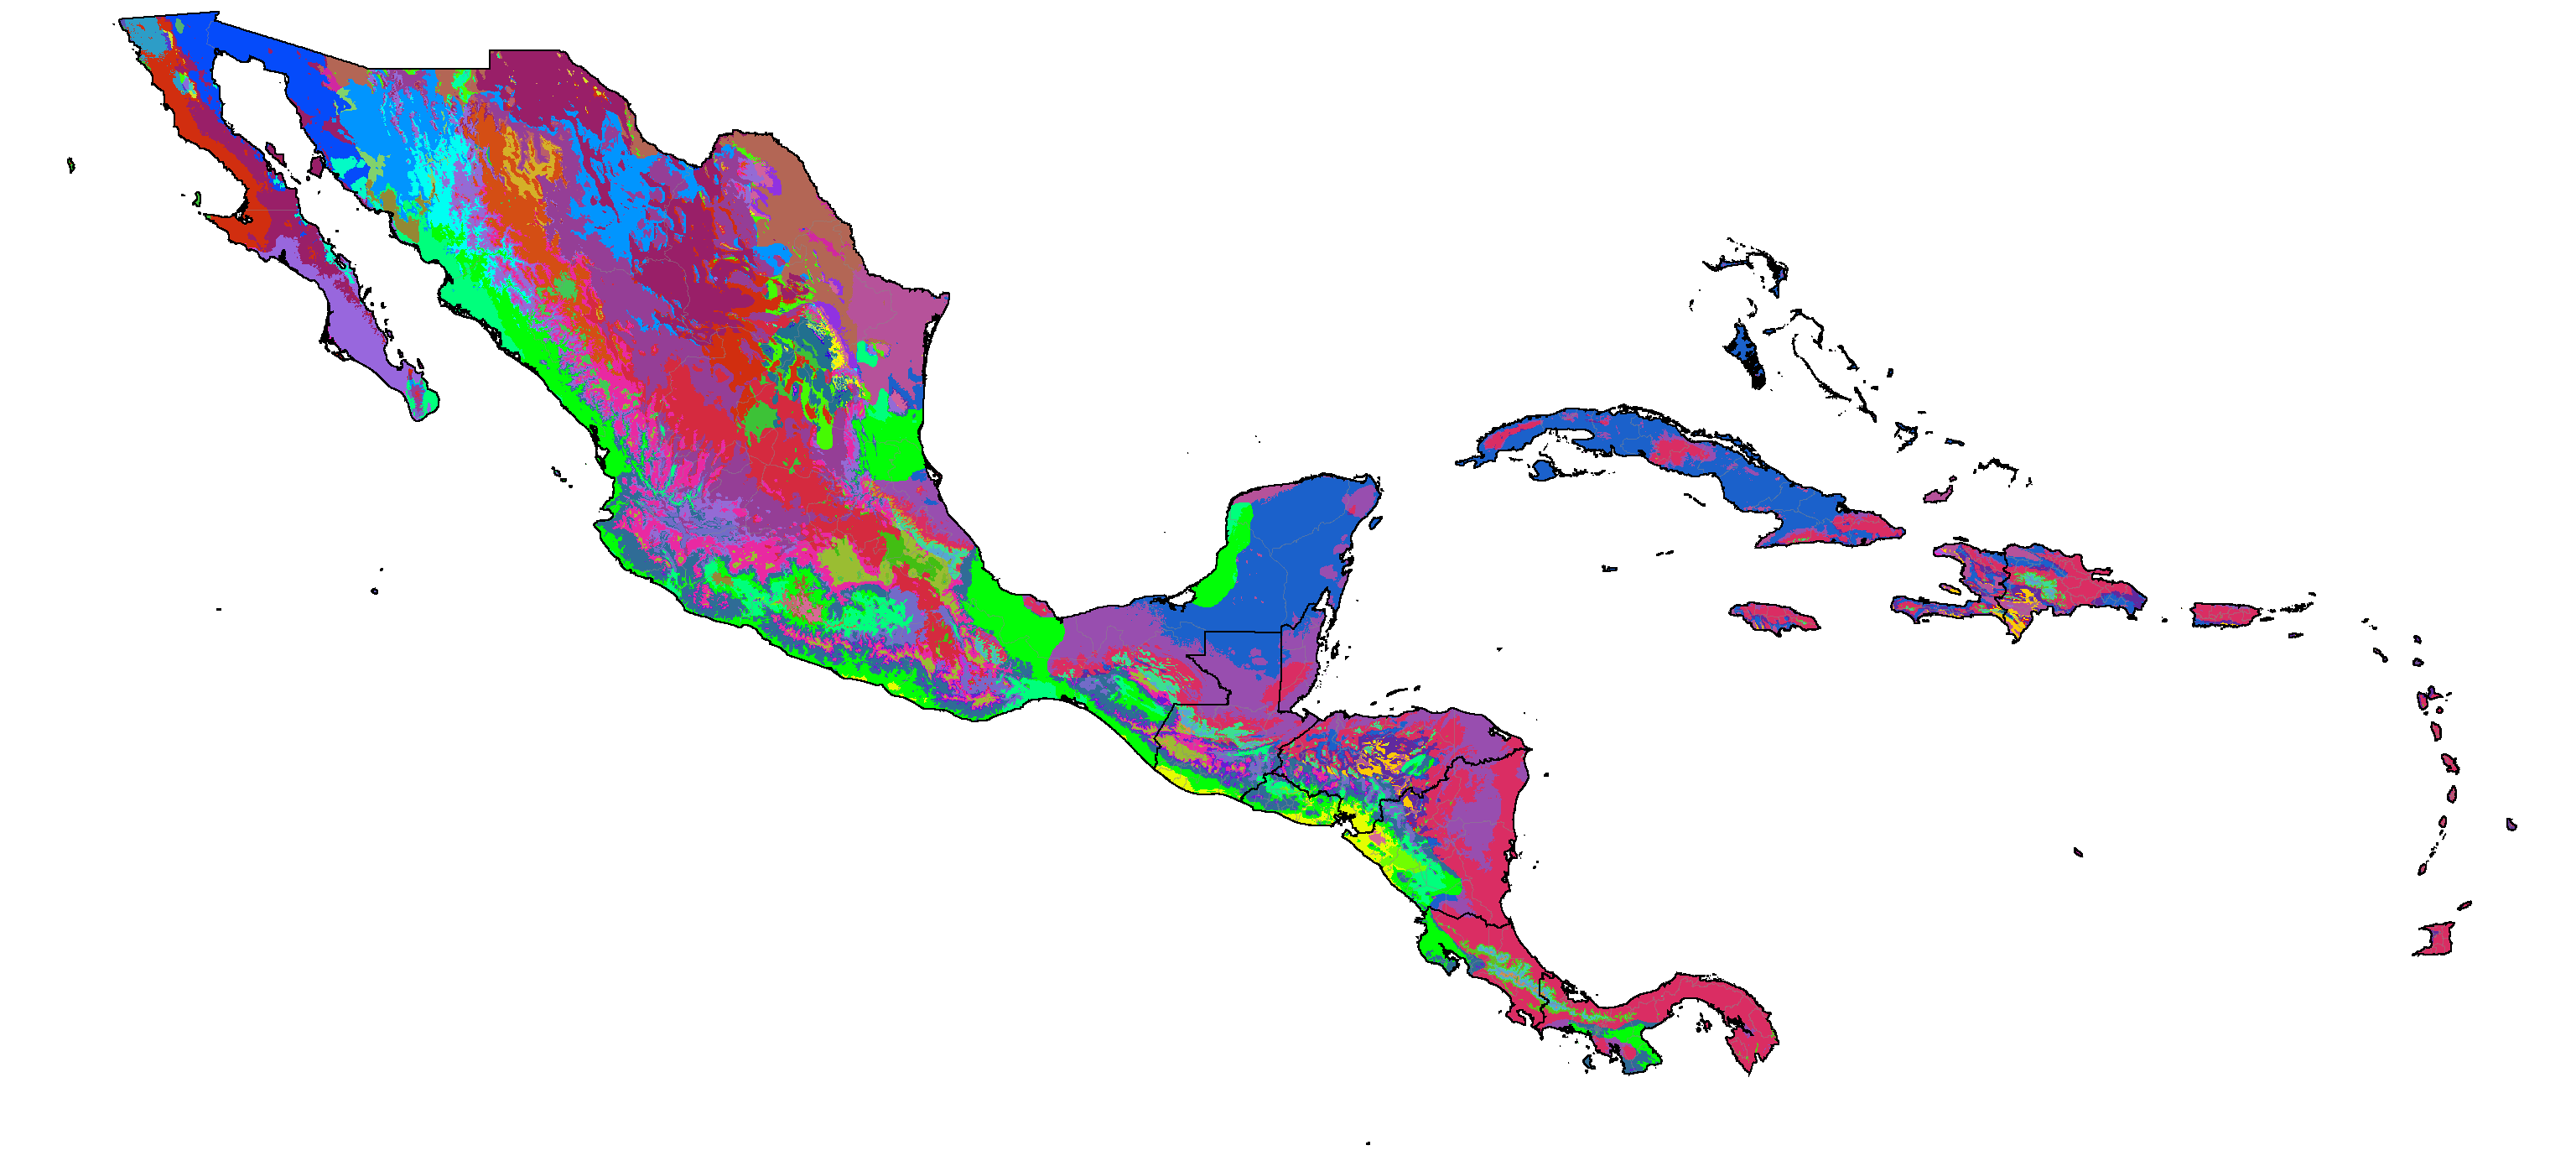
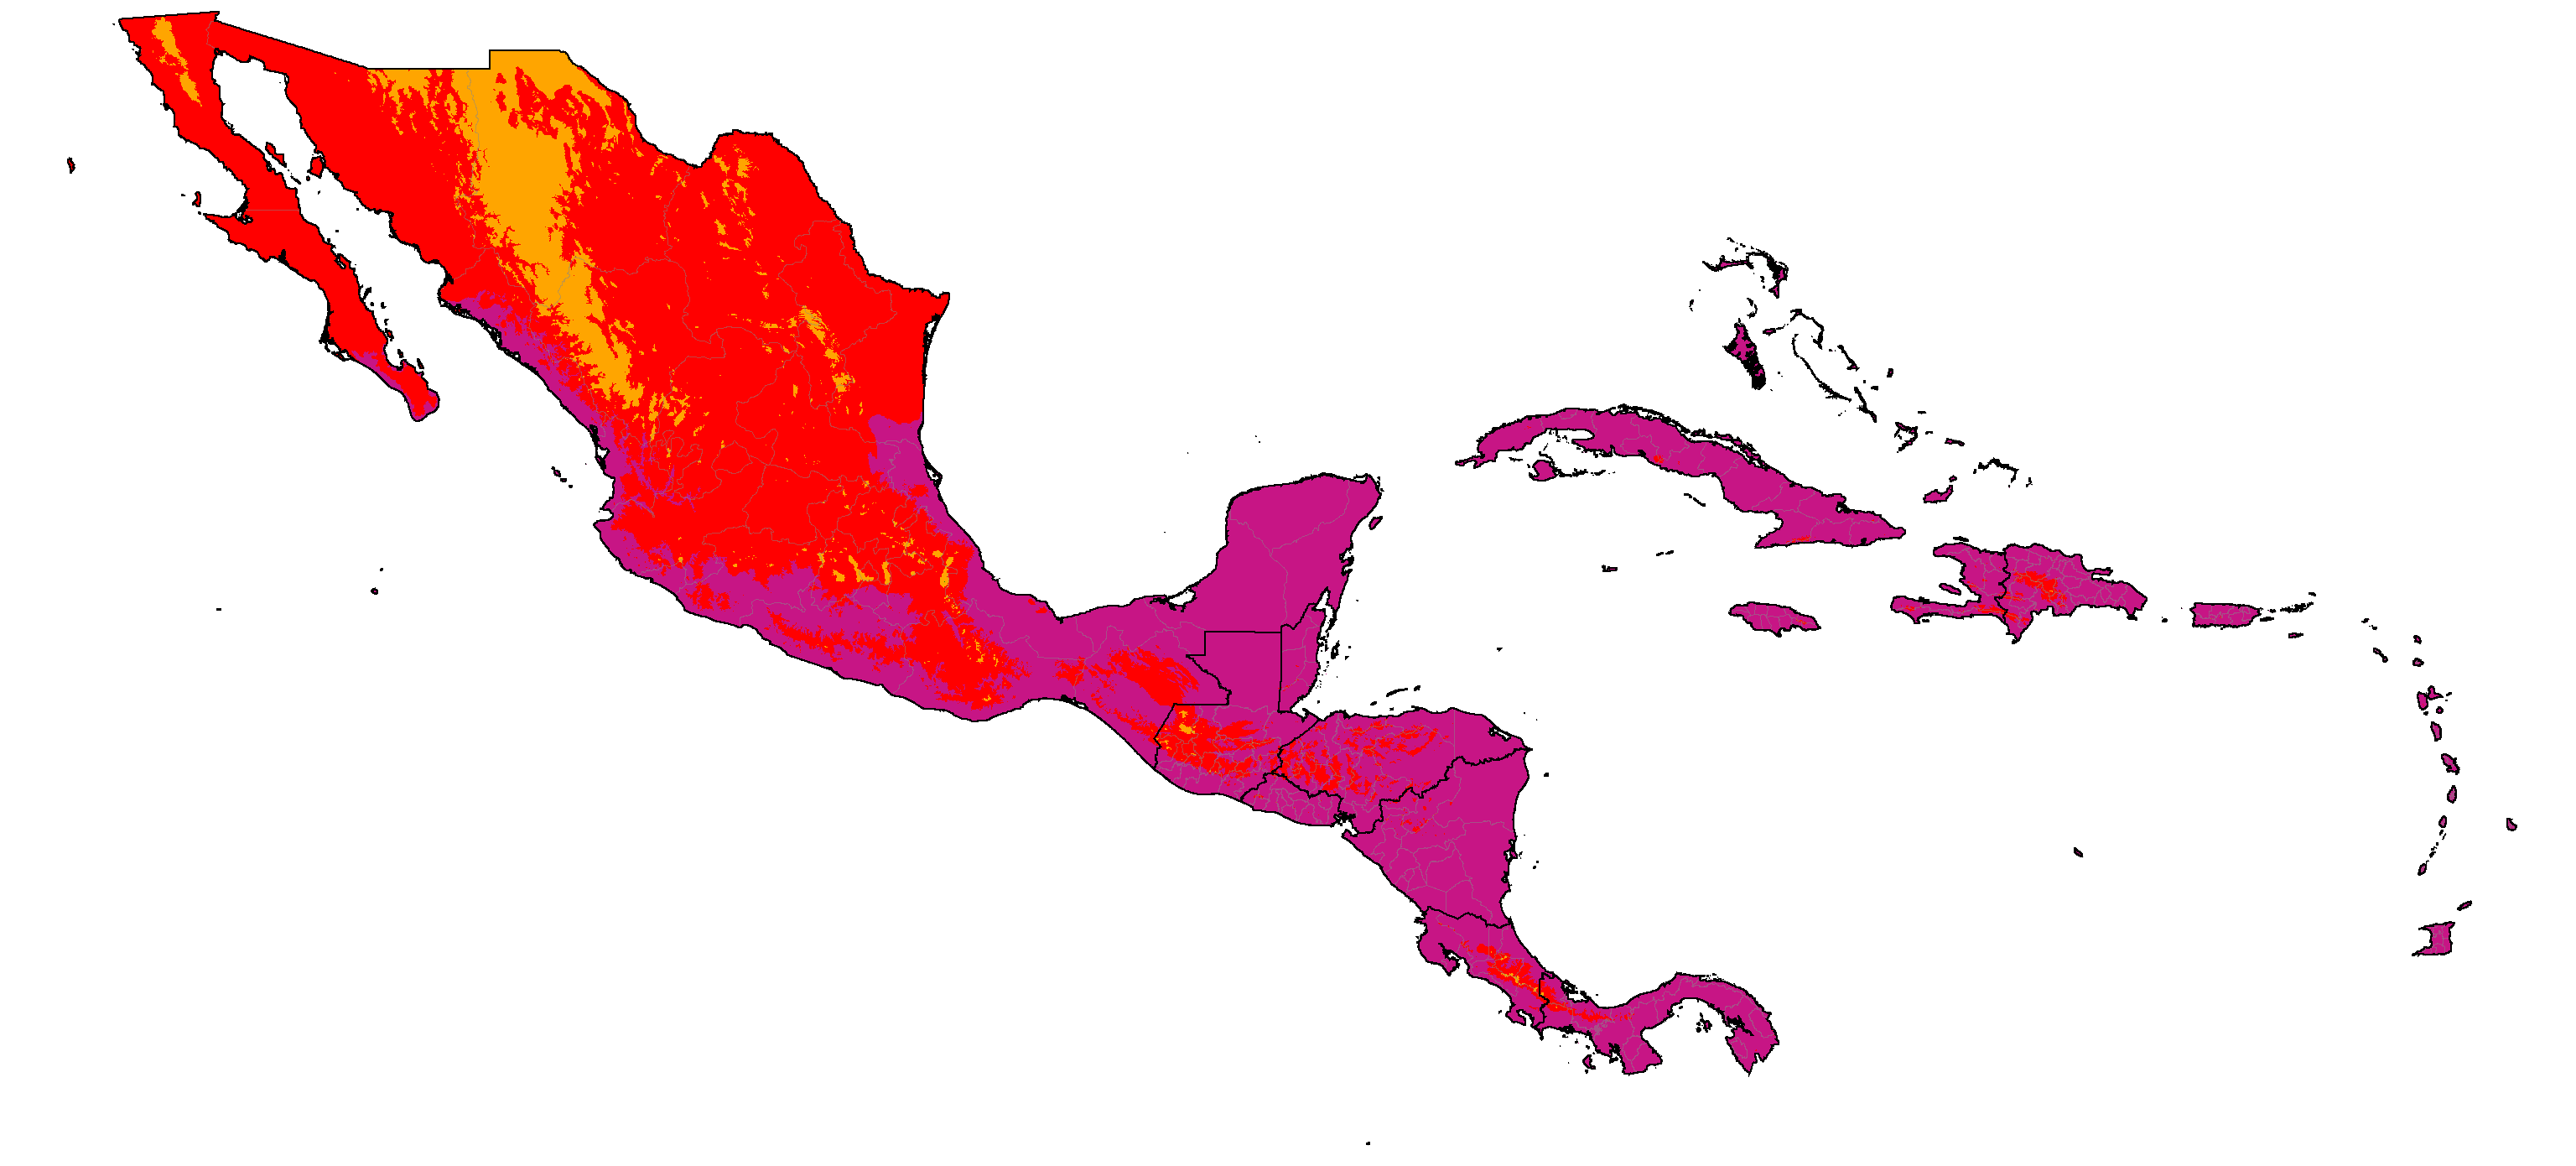
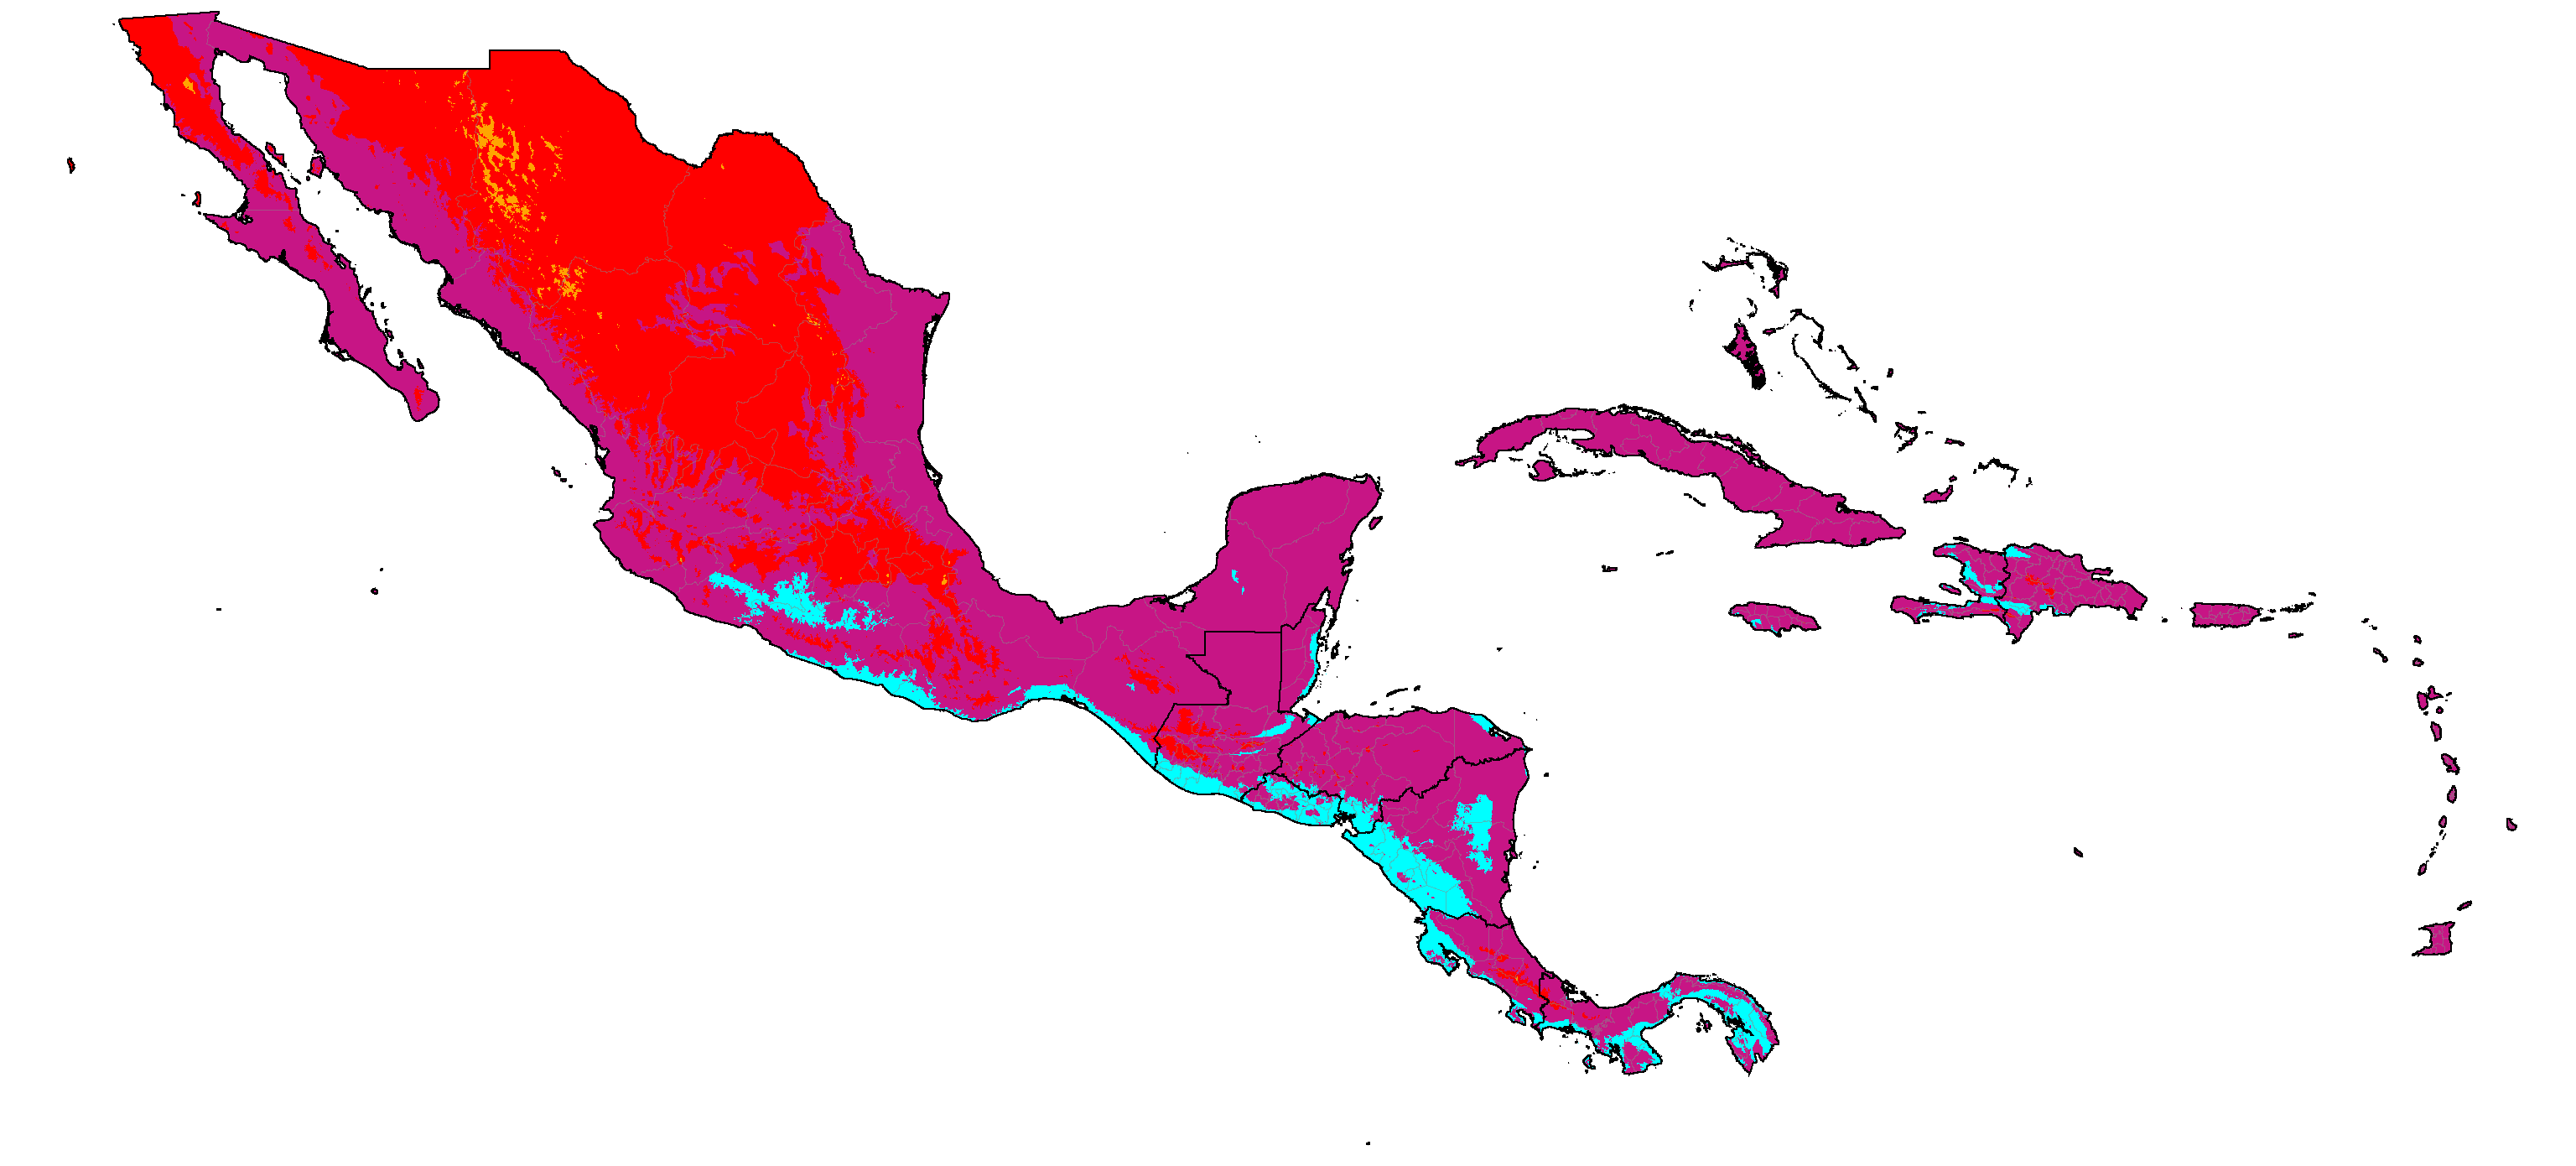
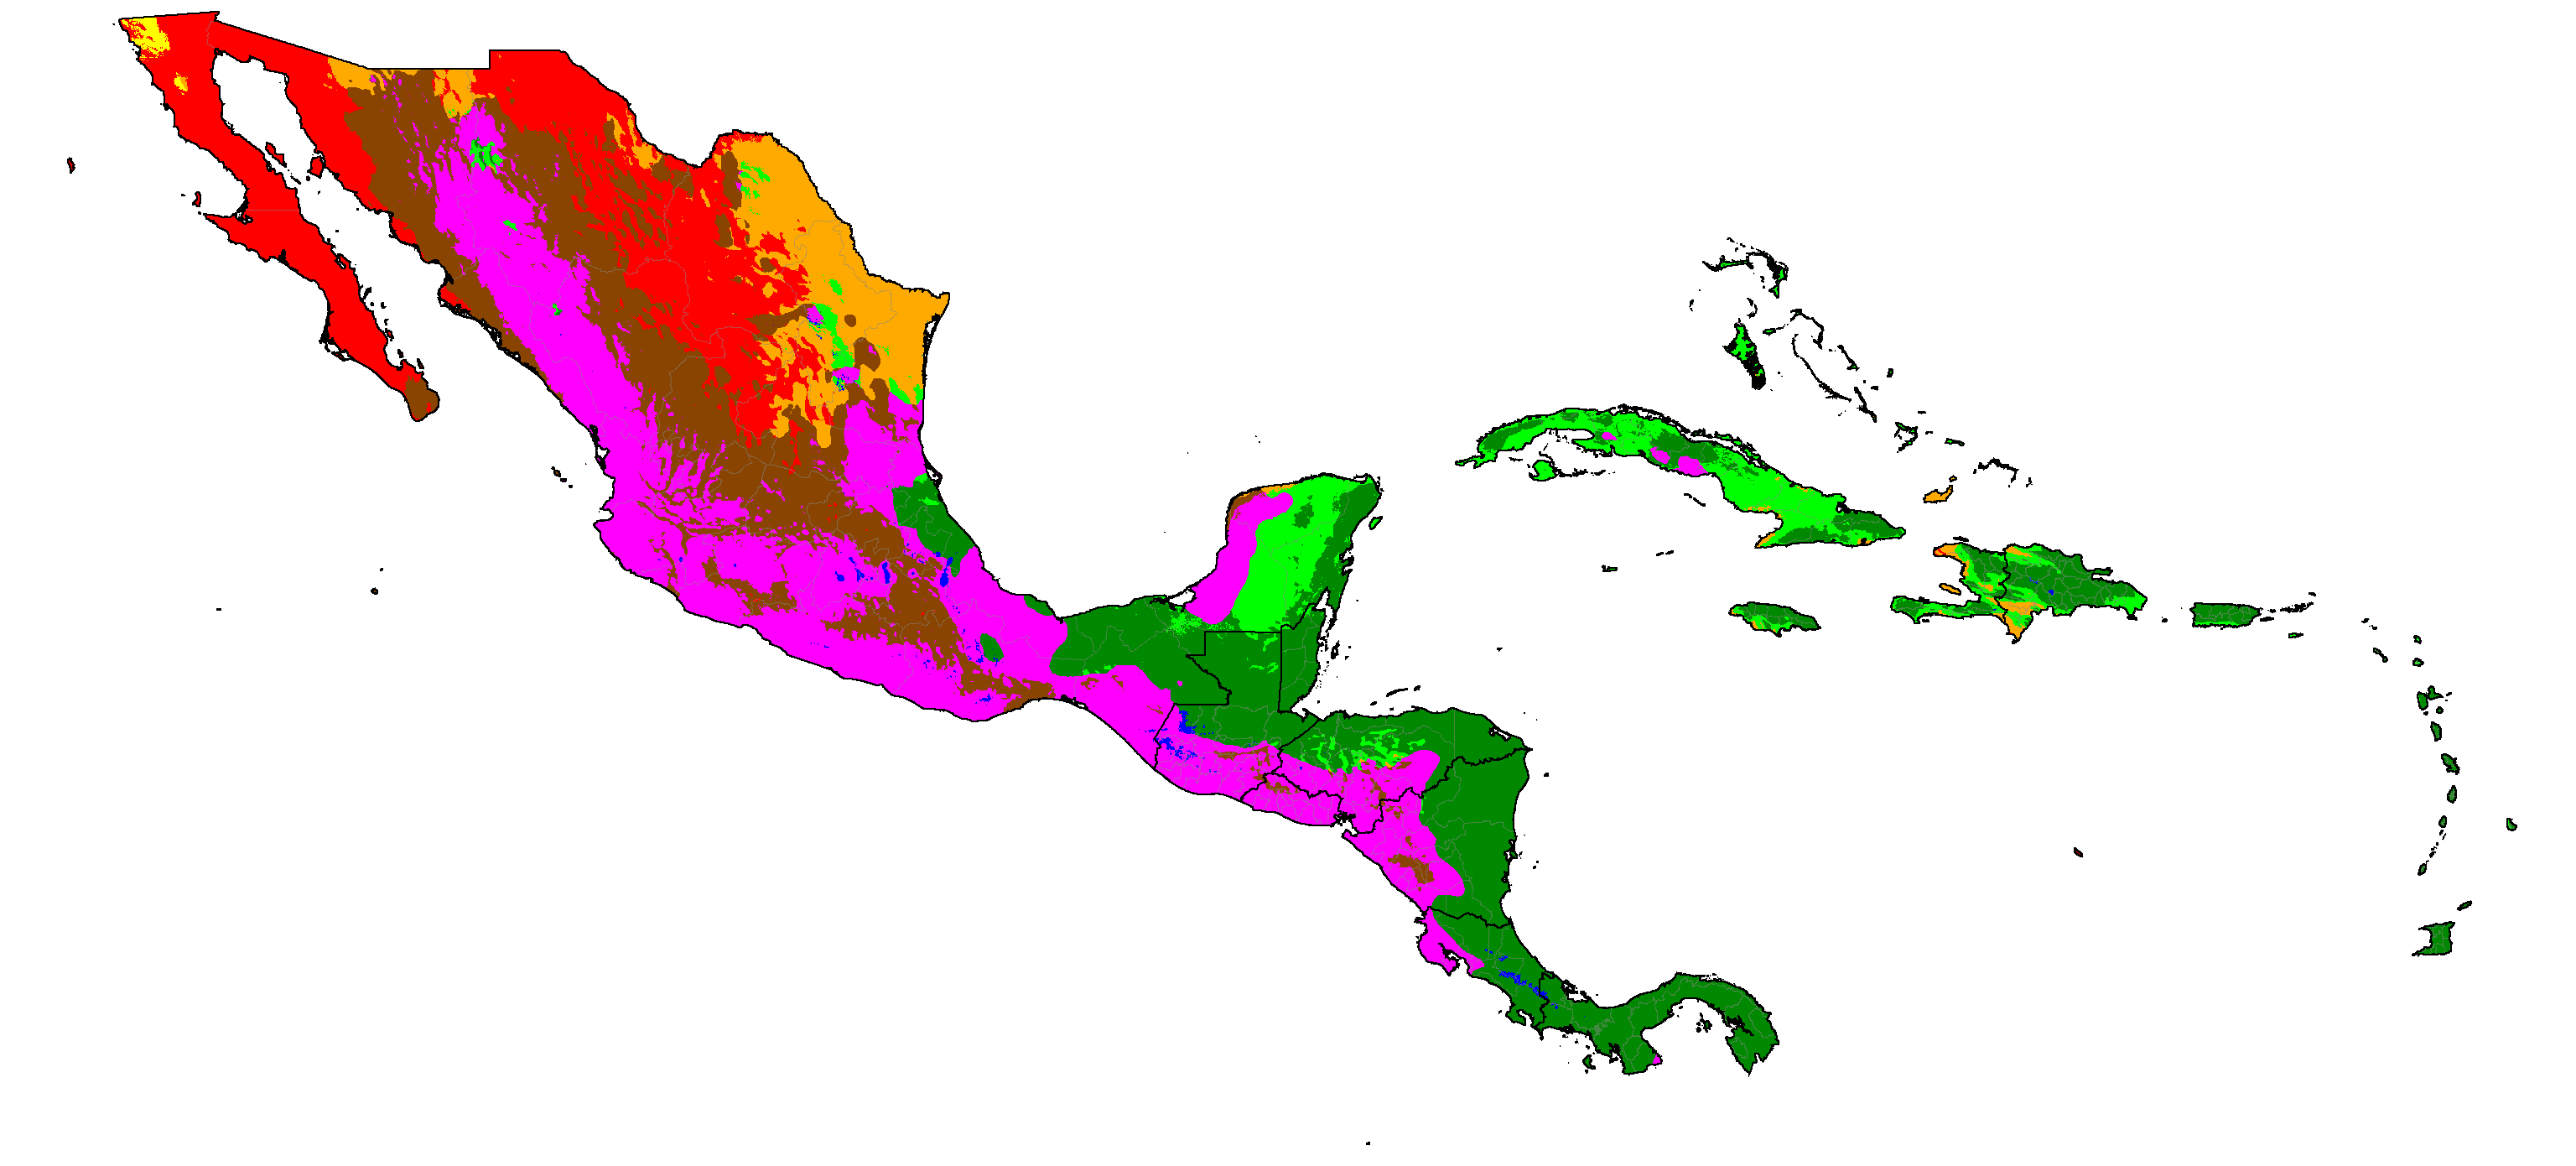
Mexico, Central America & the Carribean distribution of winter categories (projections are SSP5-8.5 high emissions normals)
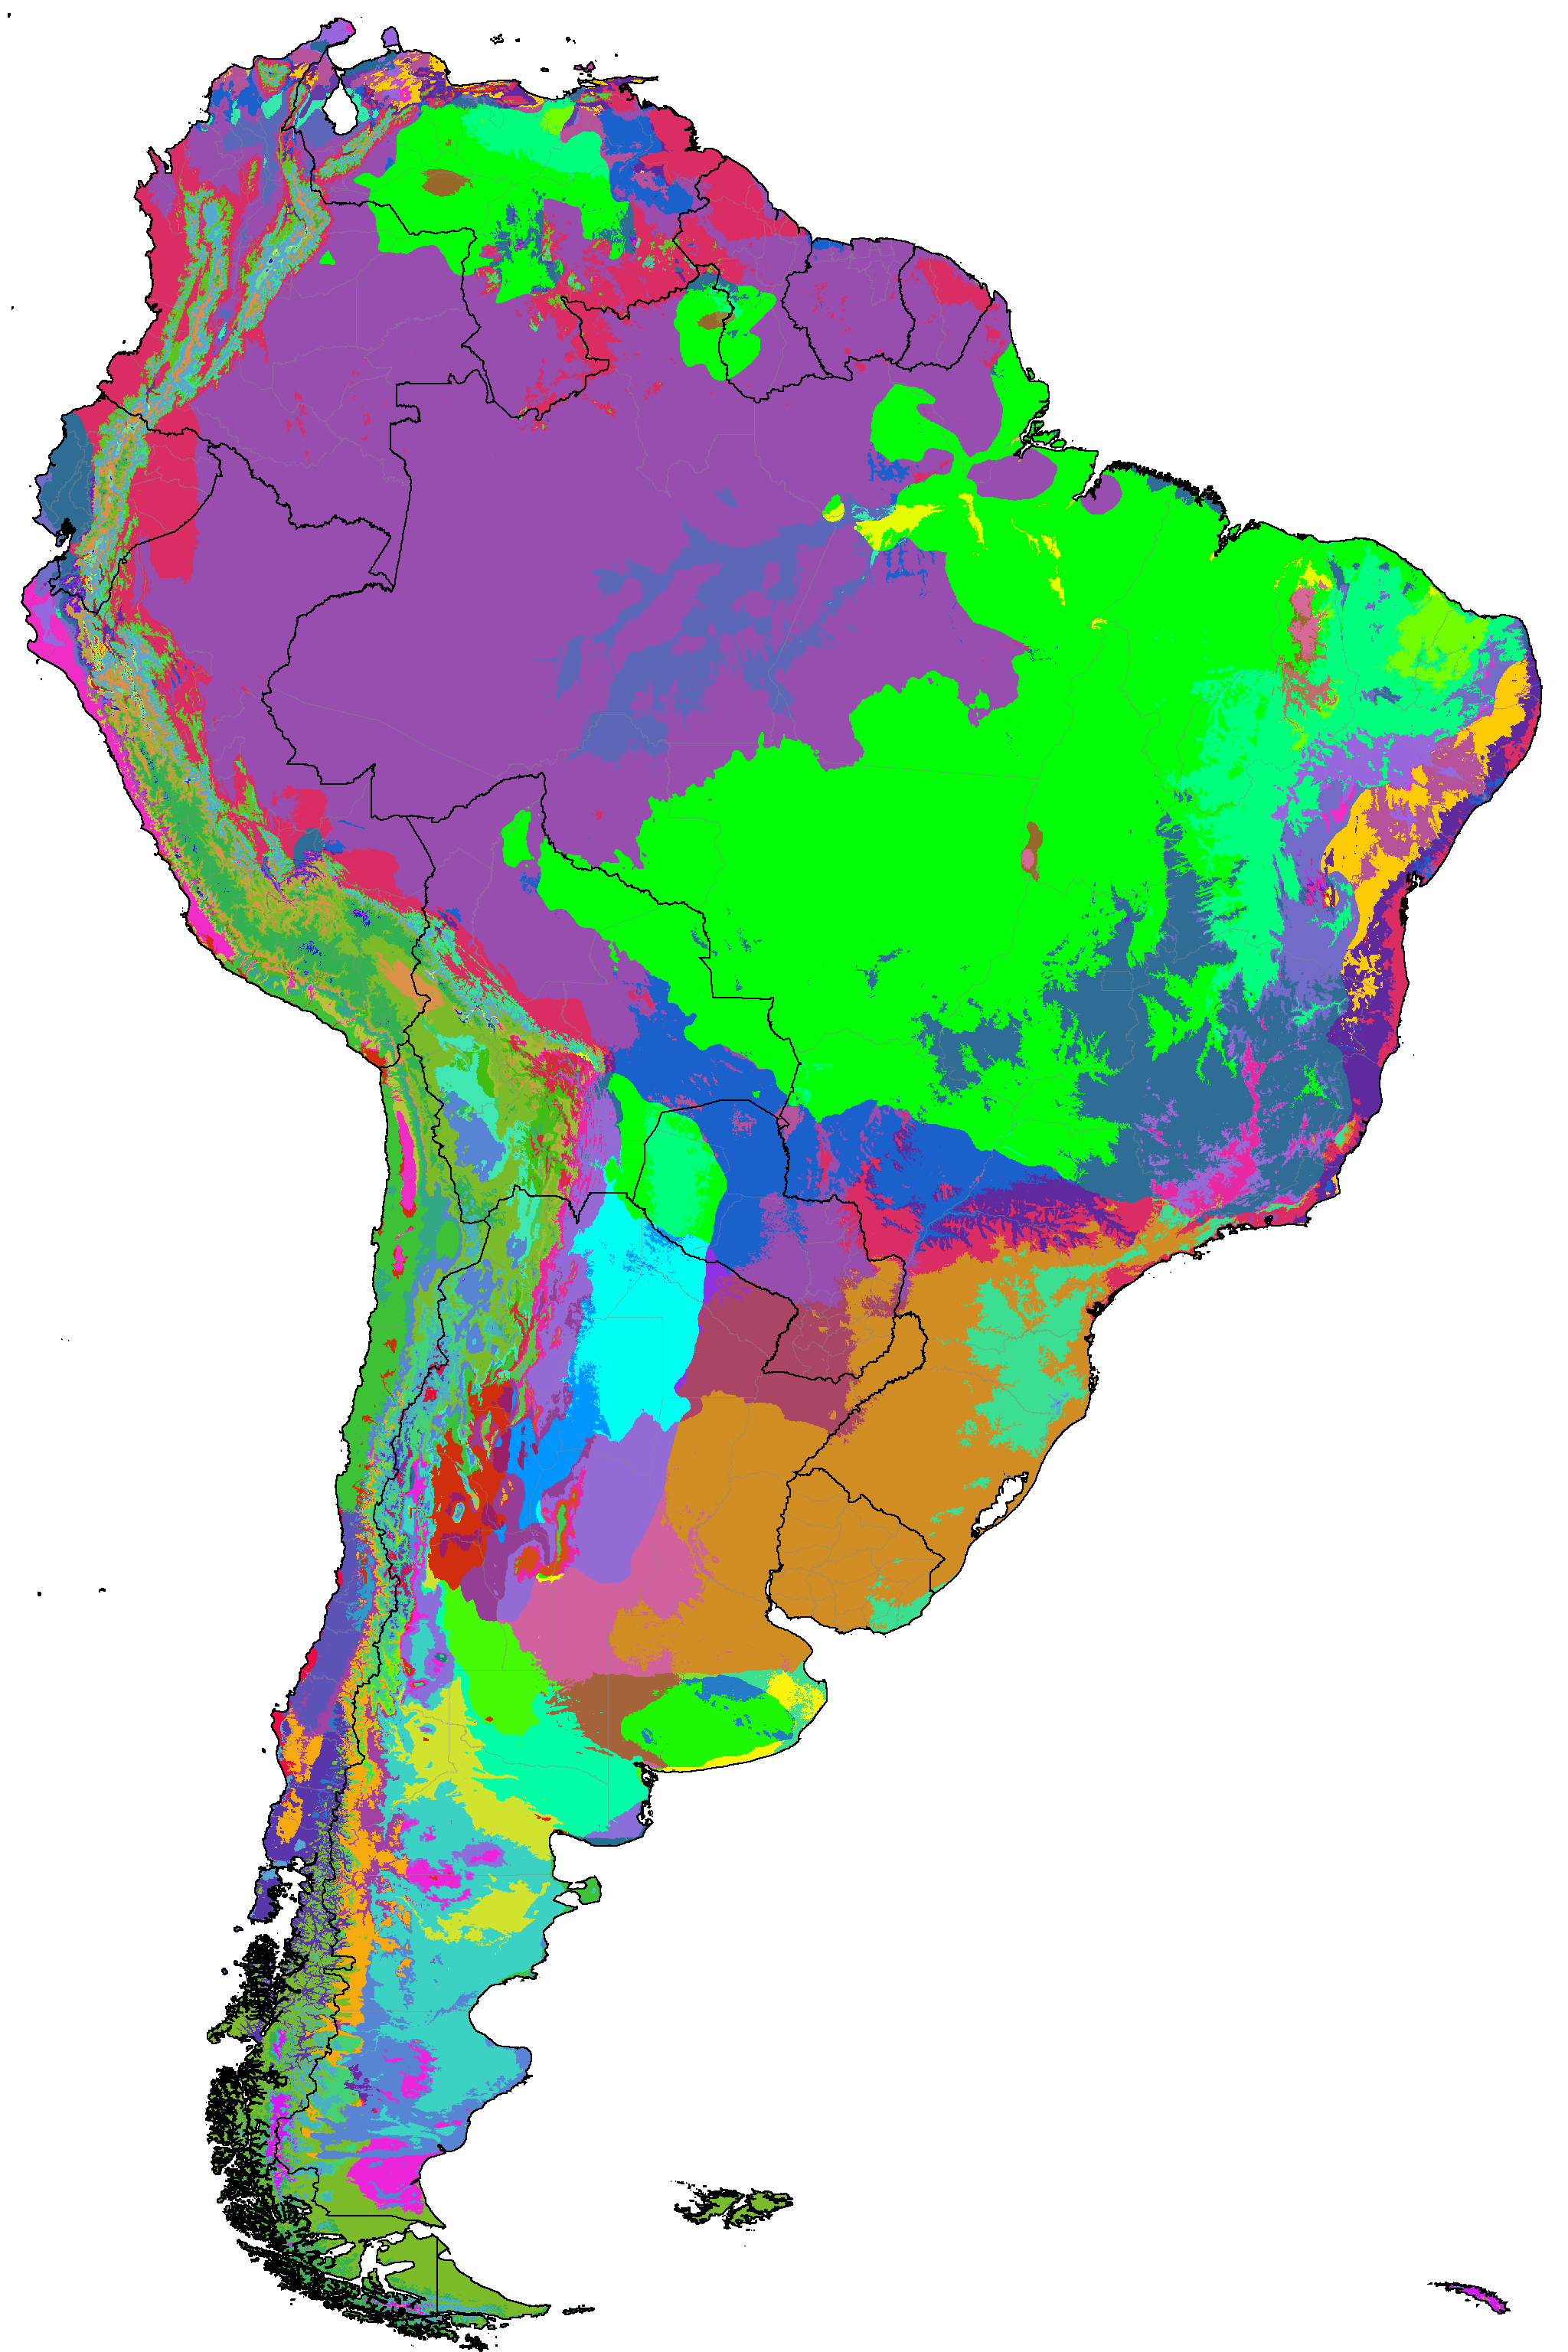
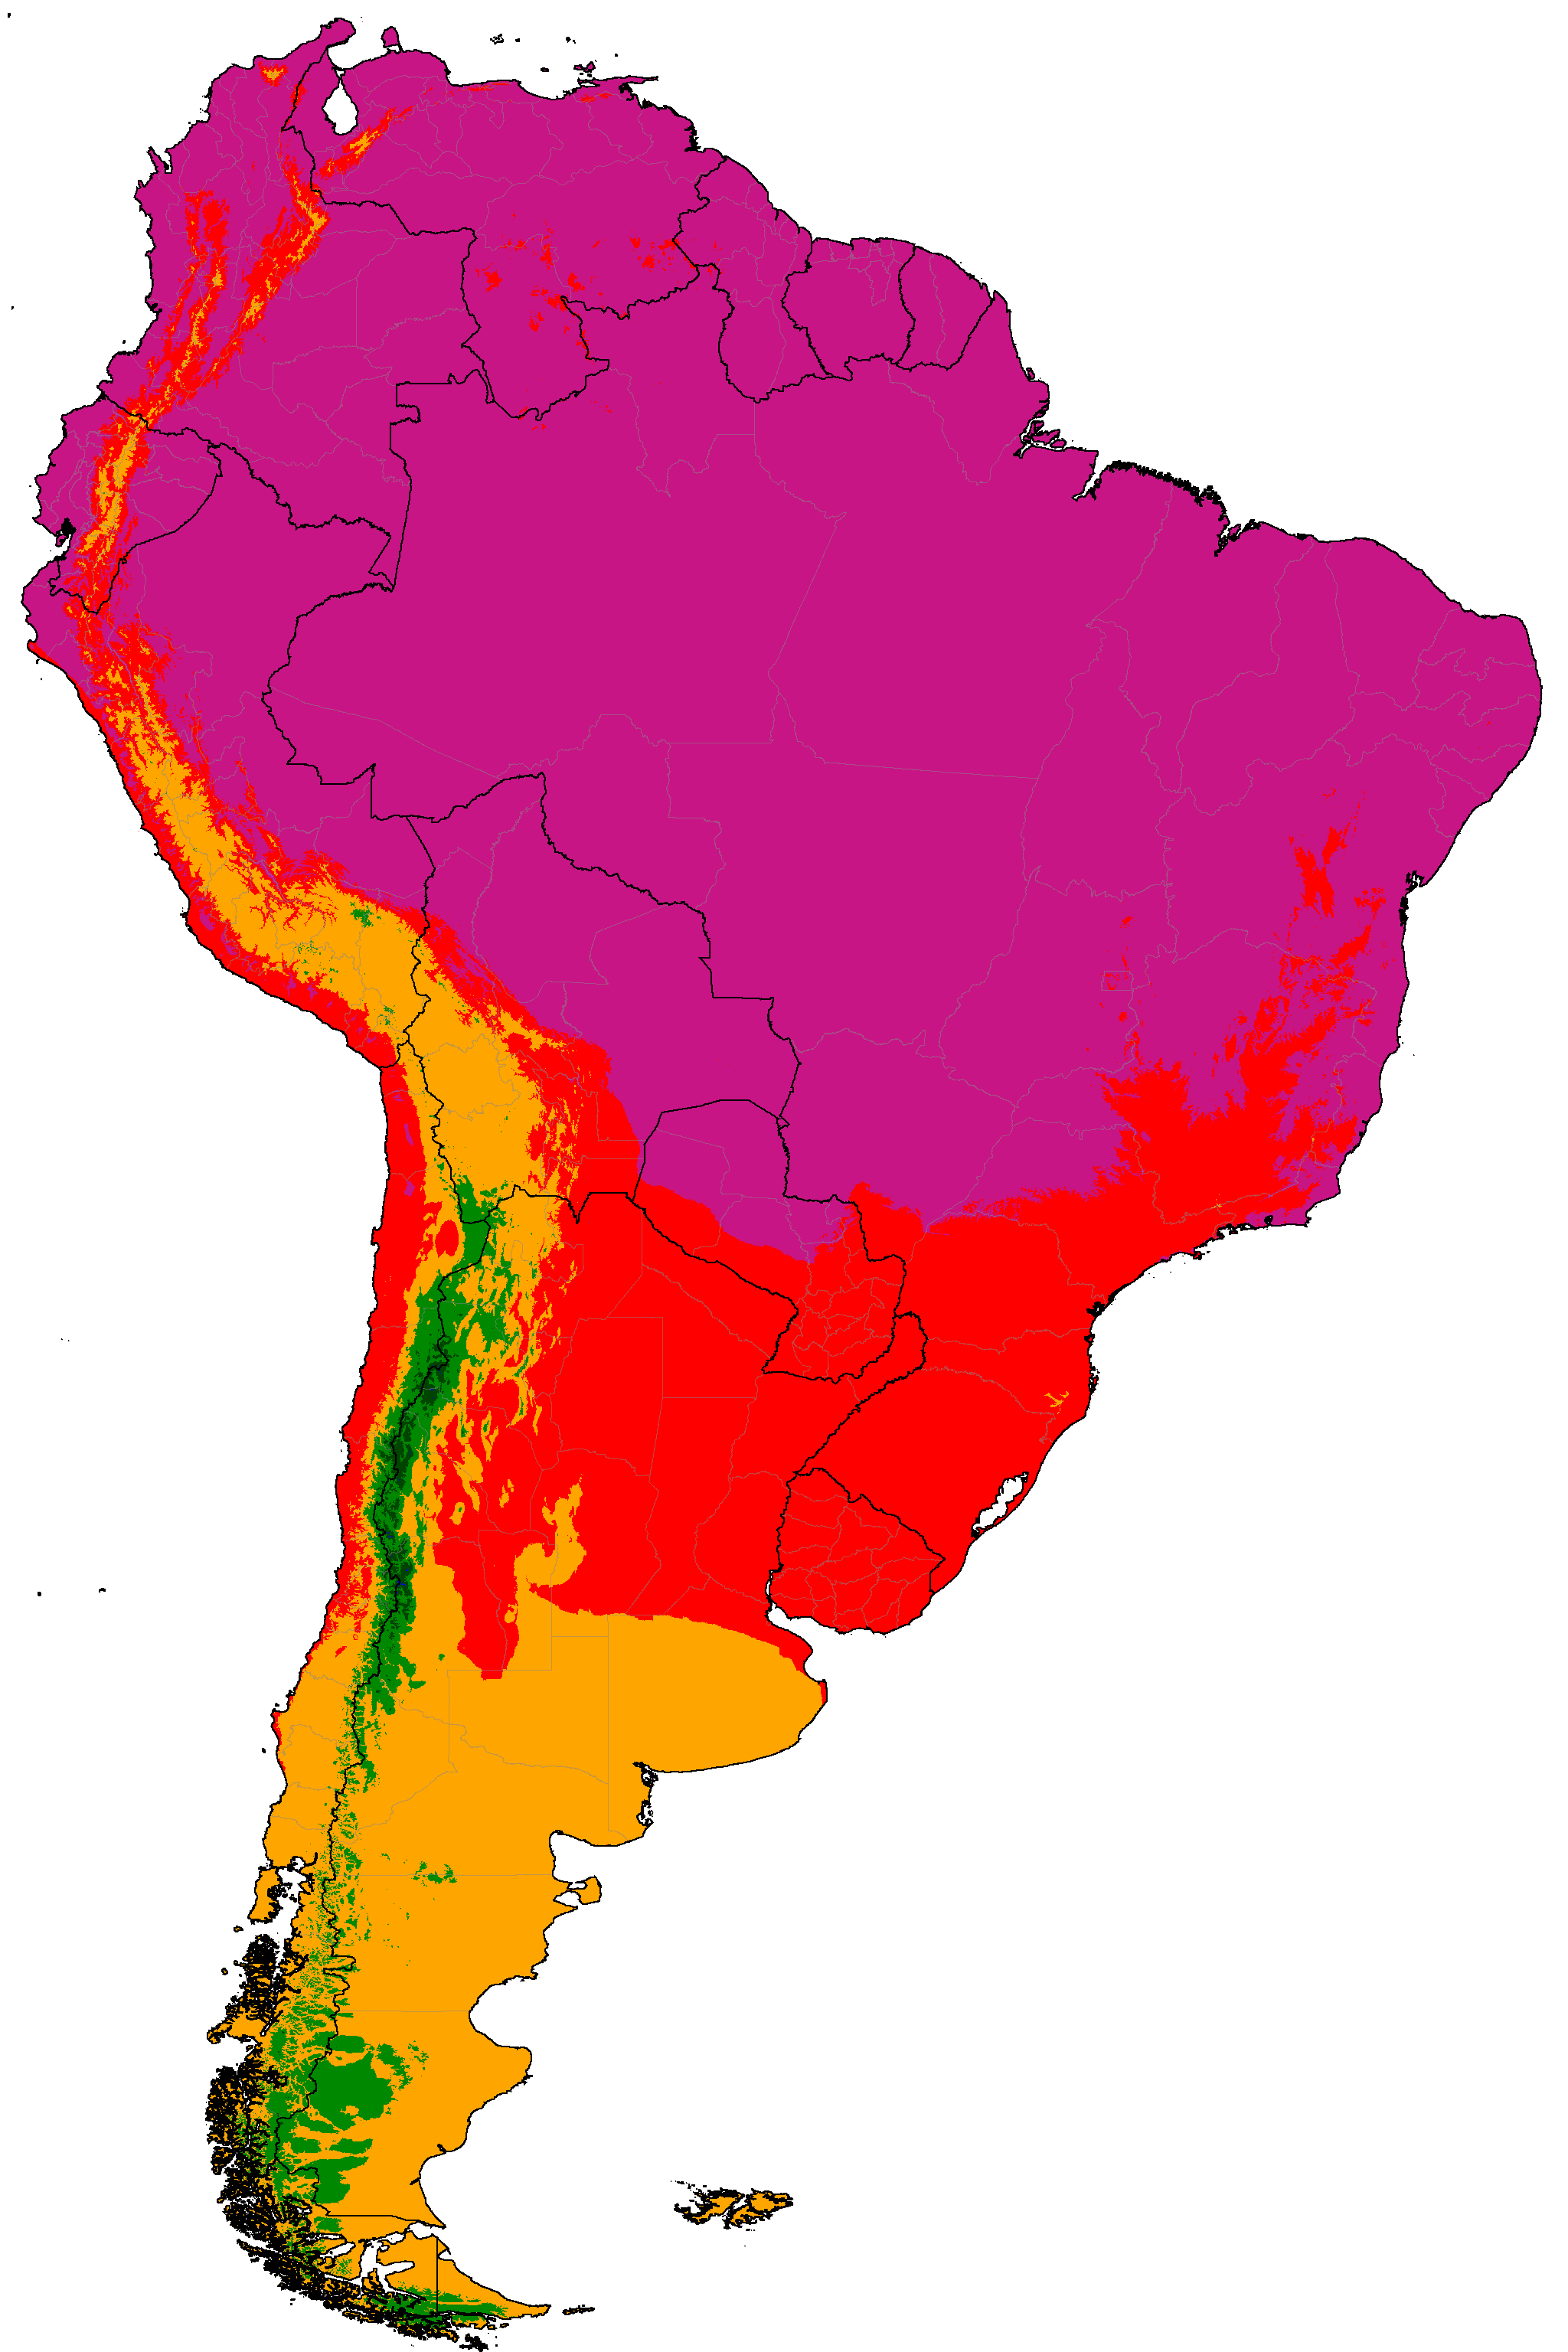
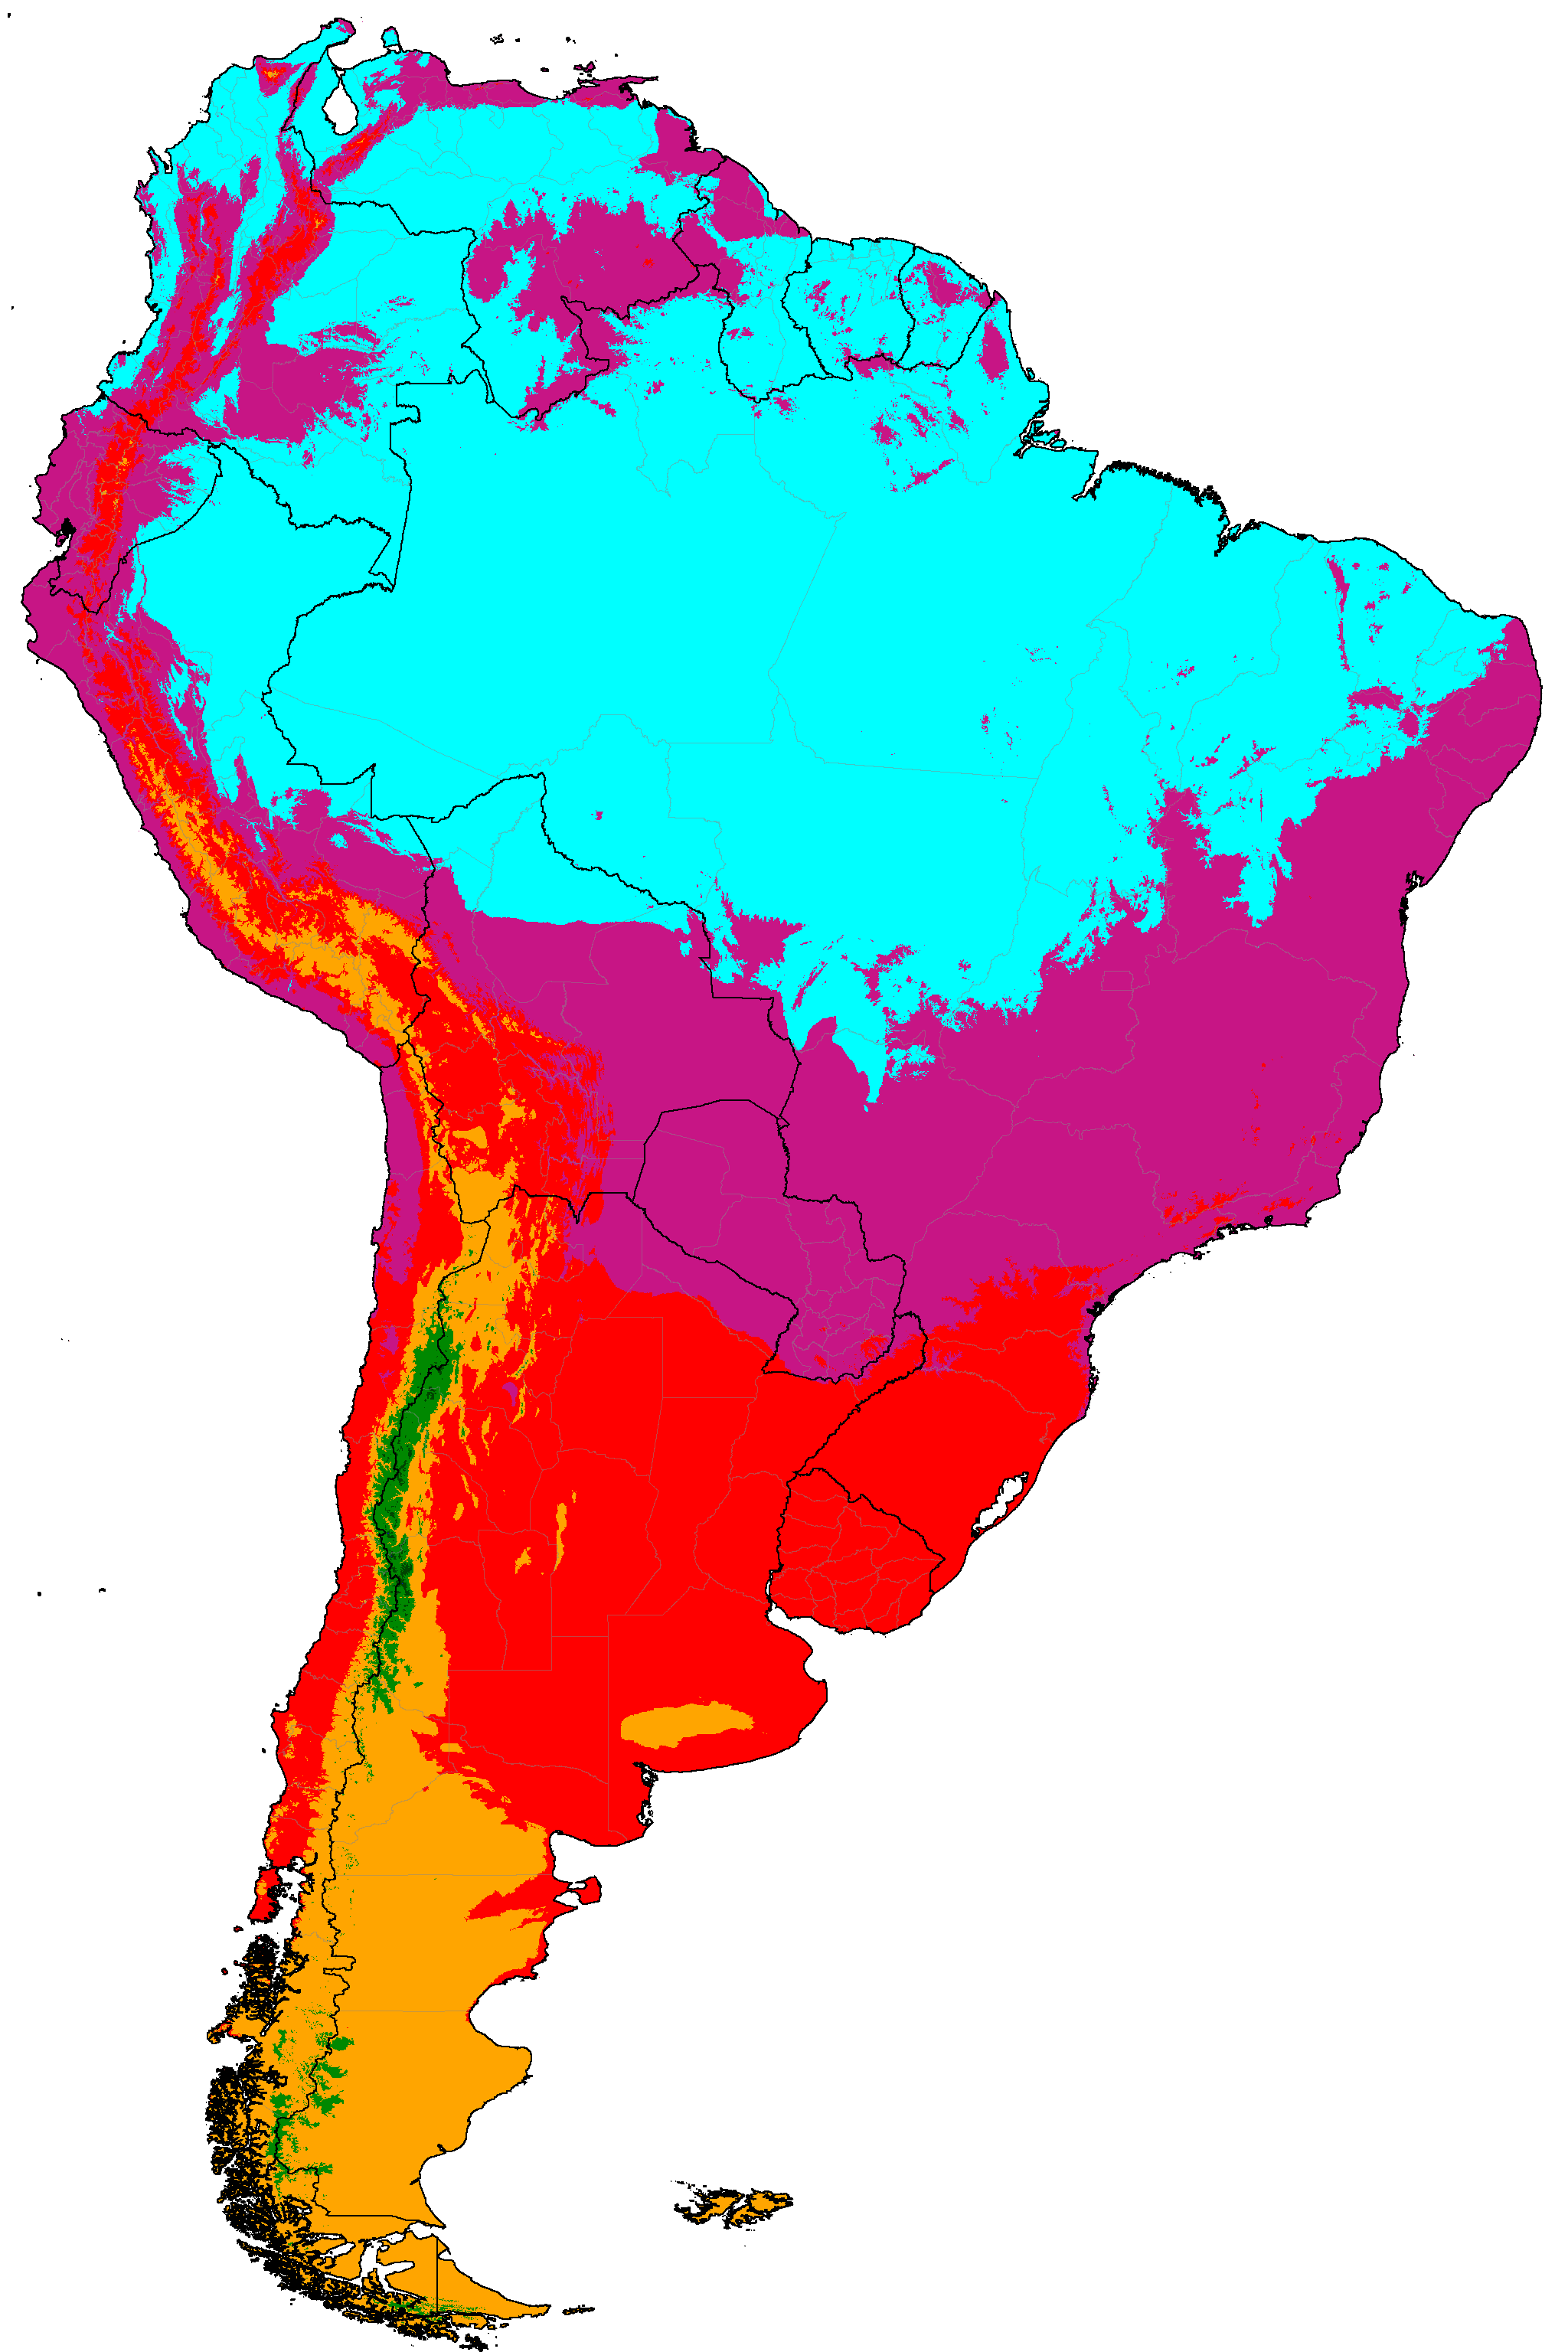
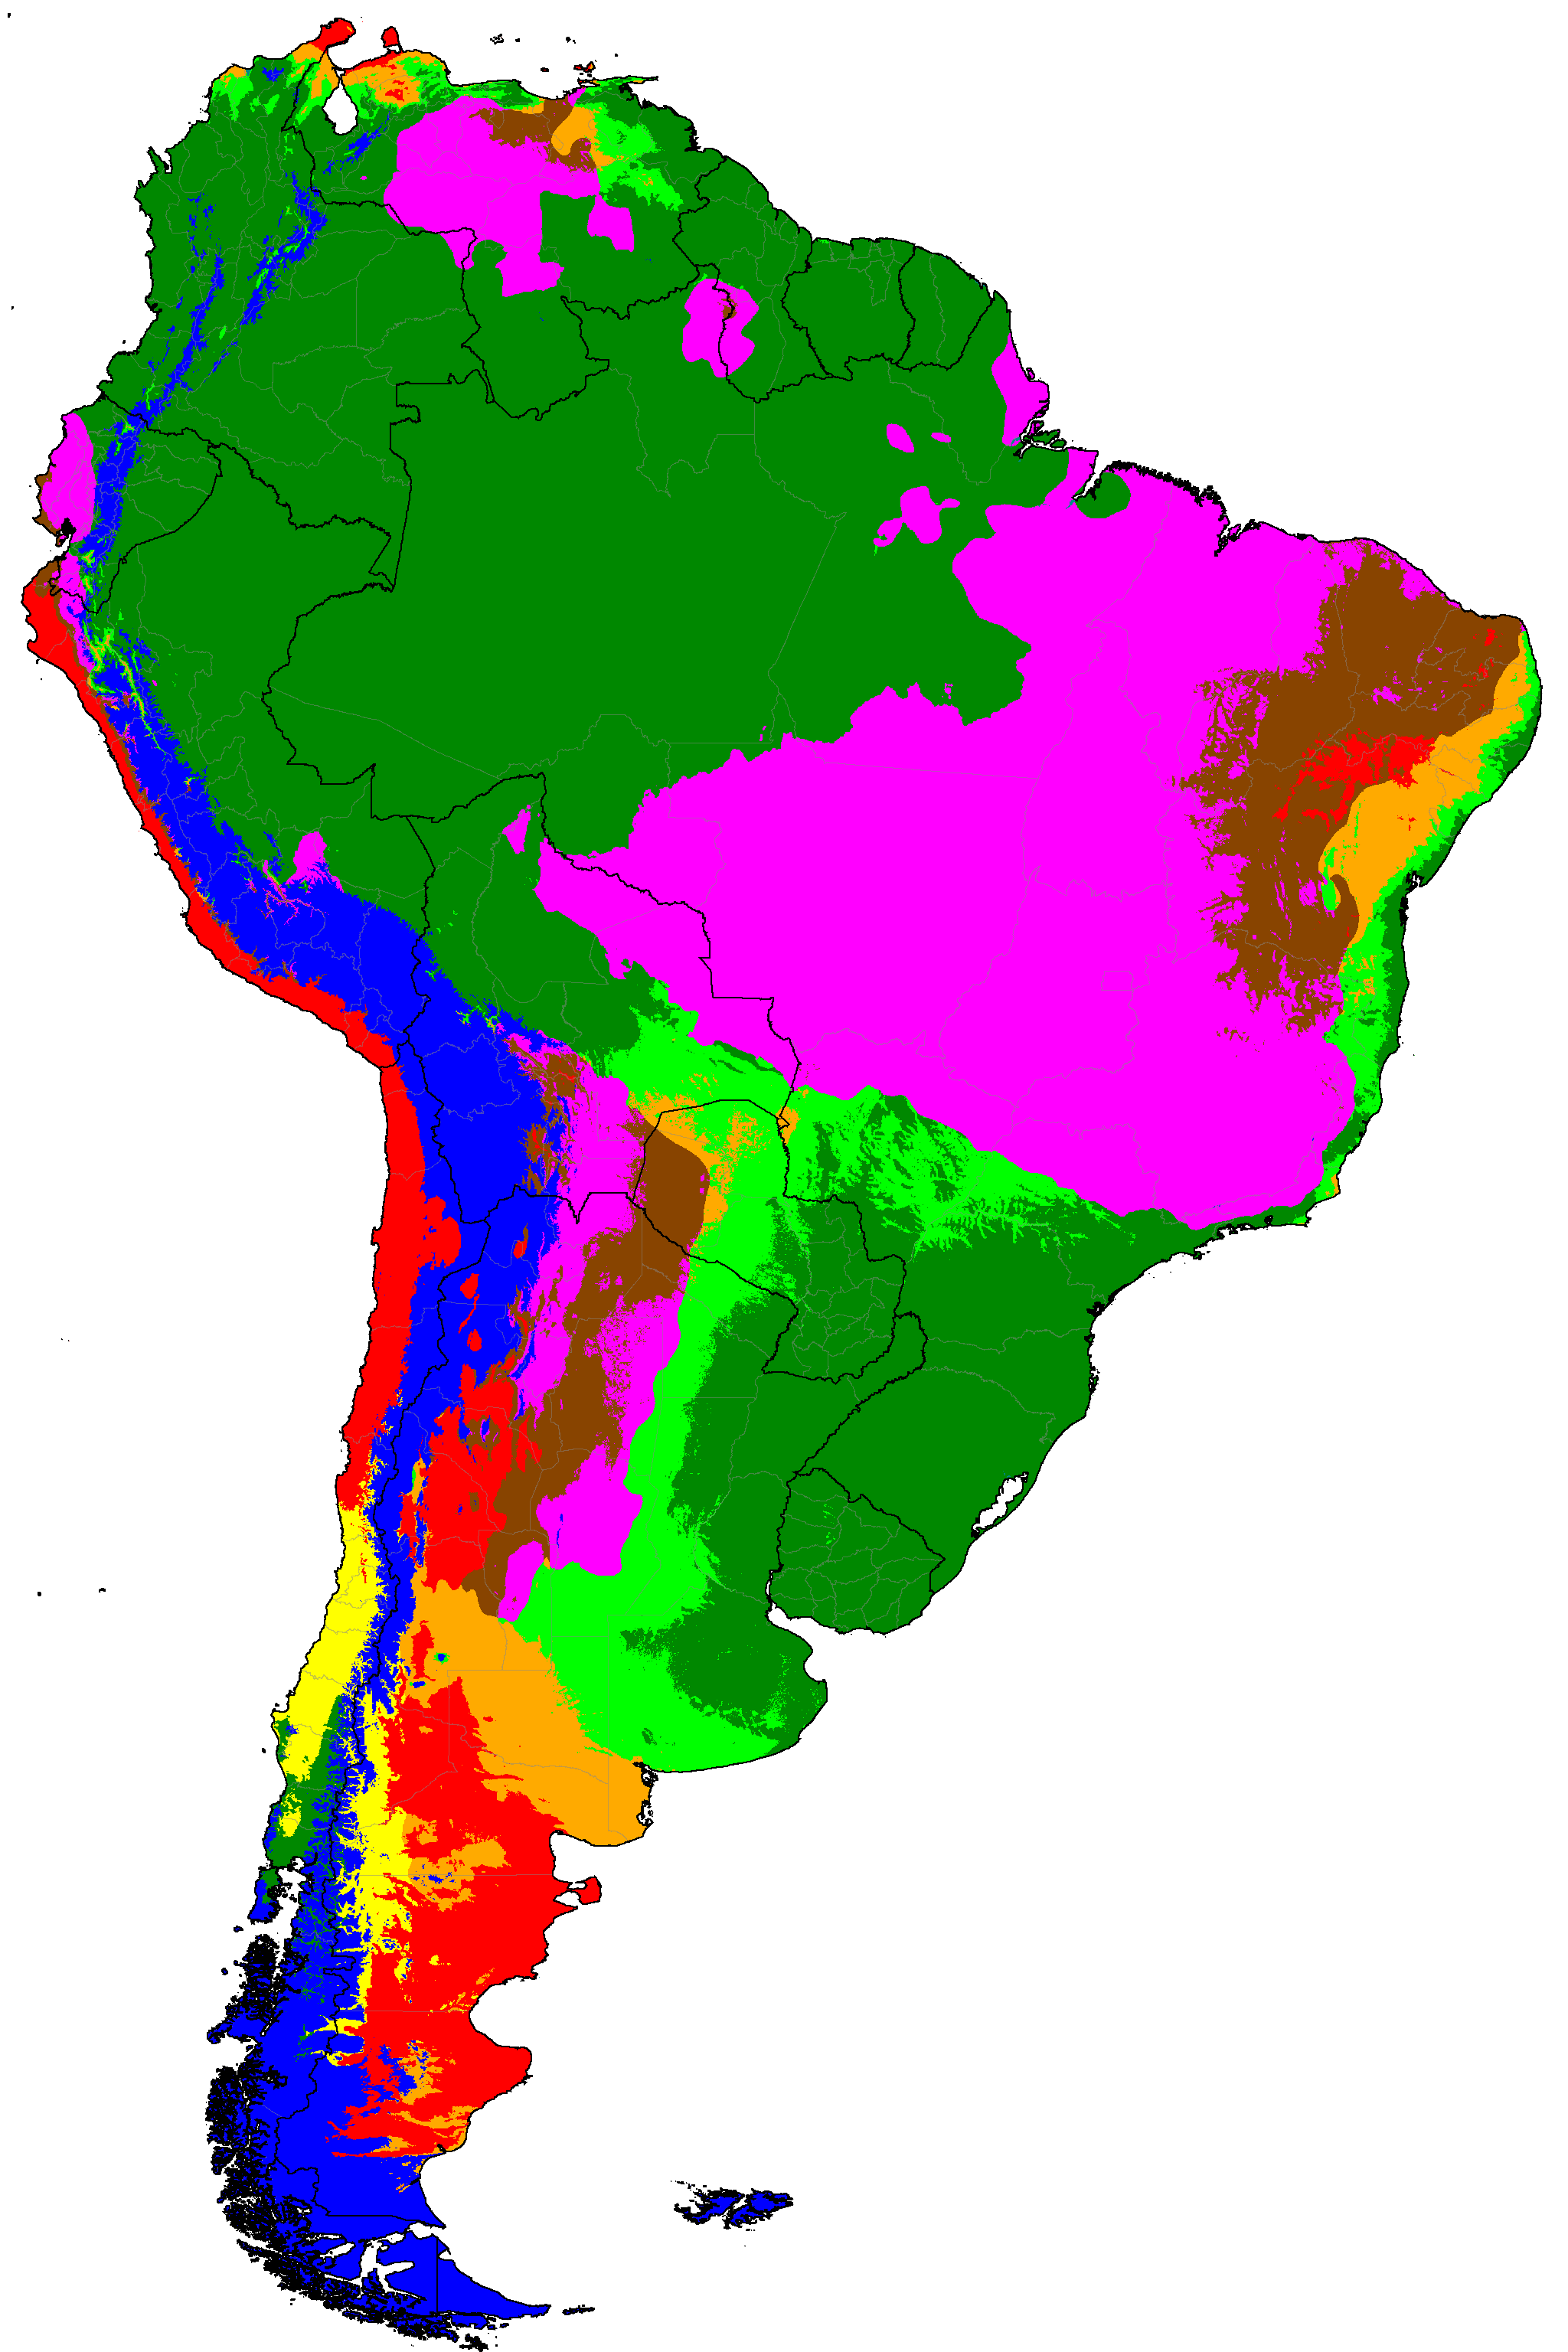
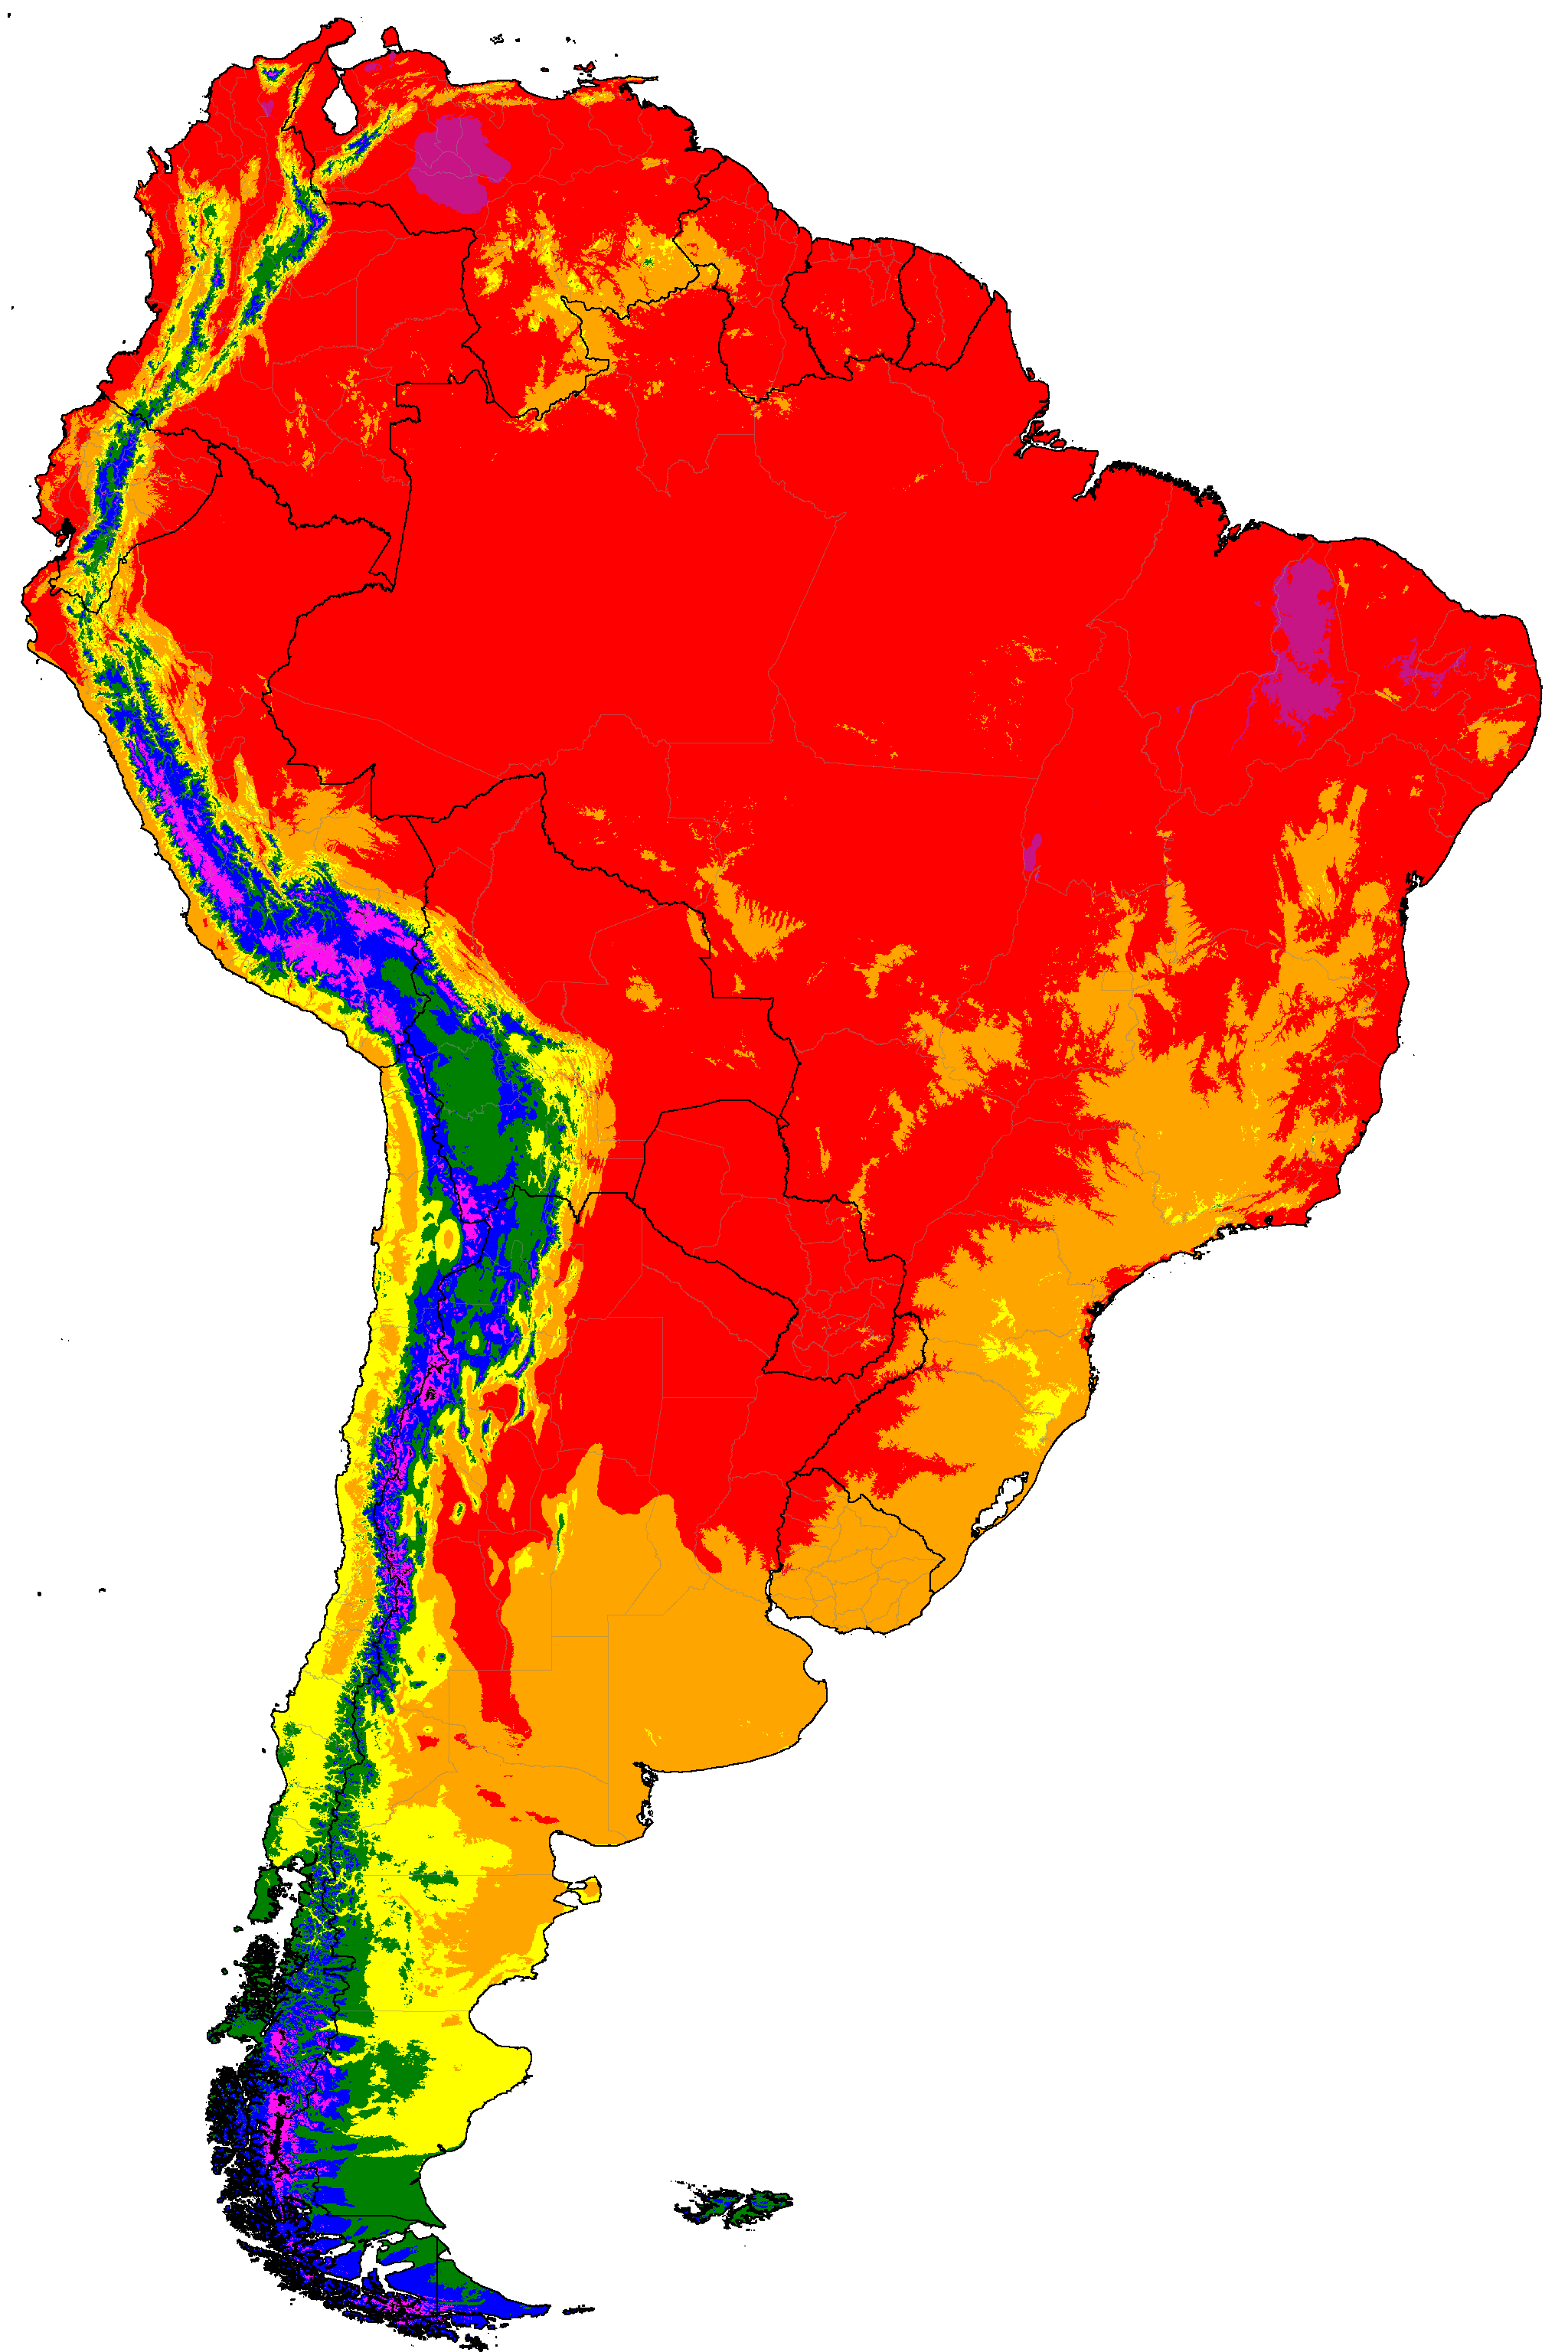
South America distribution of winter categories (projections are SSP5-8.5 high emissions normals)
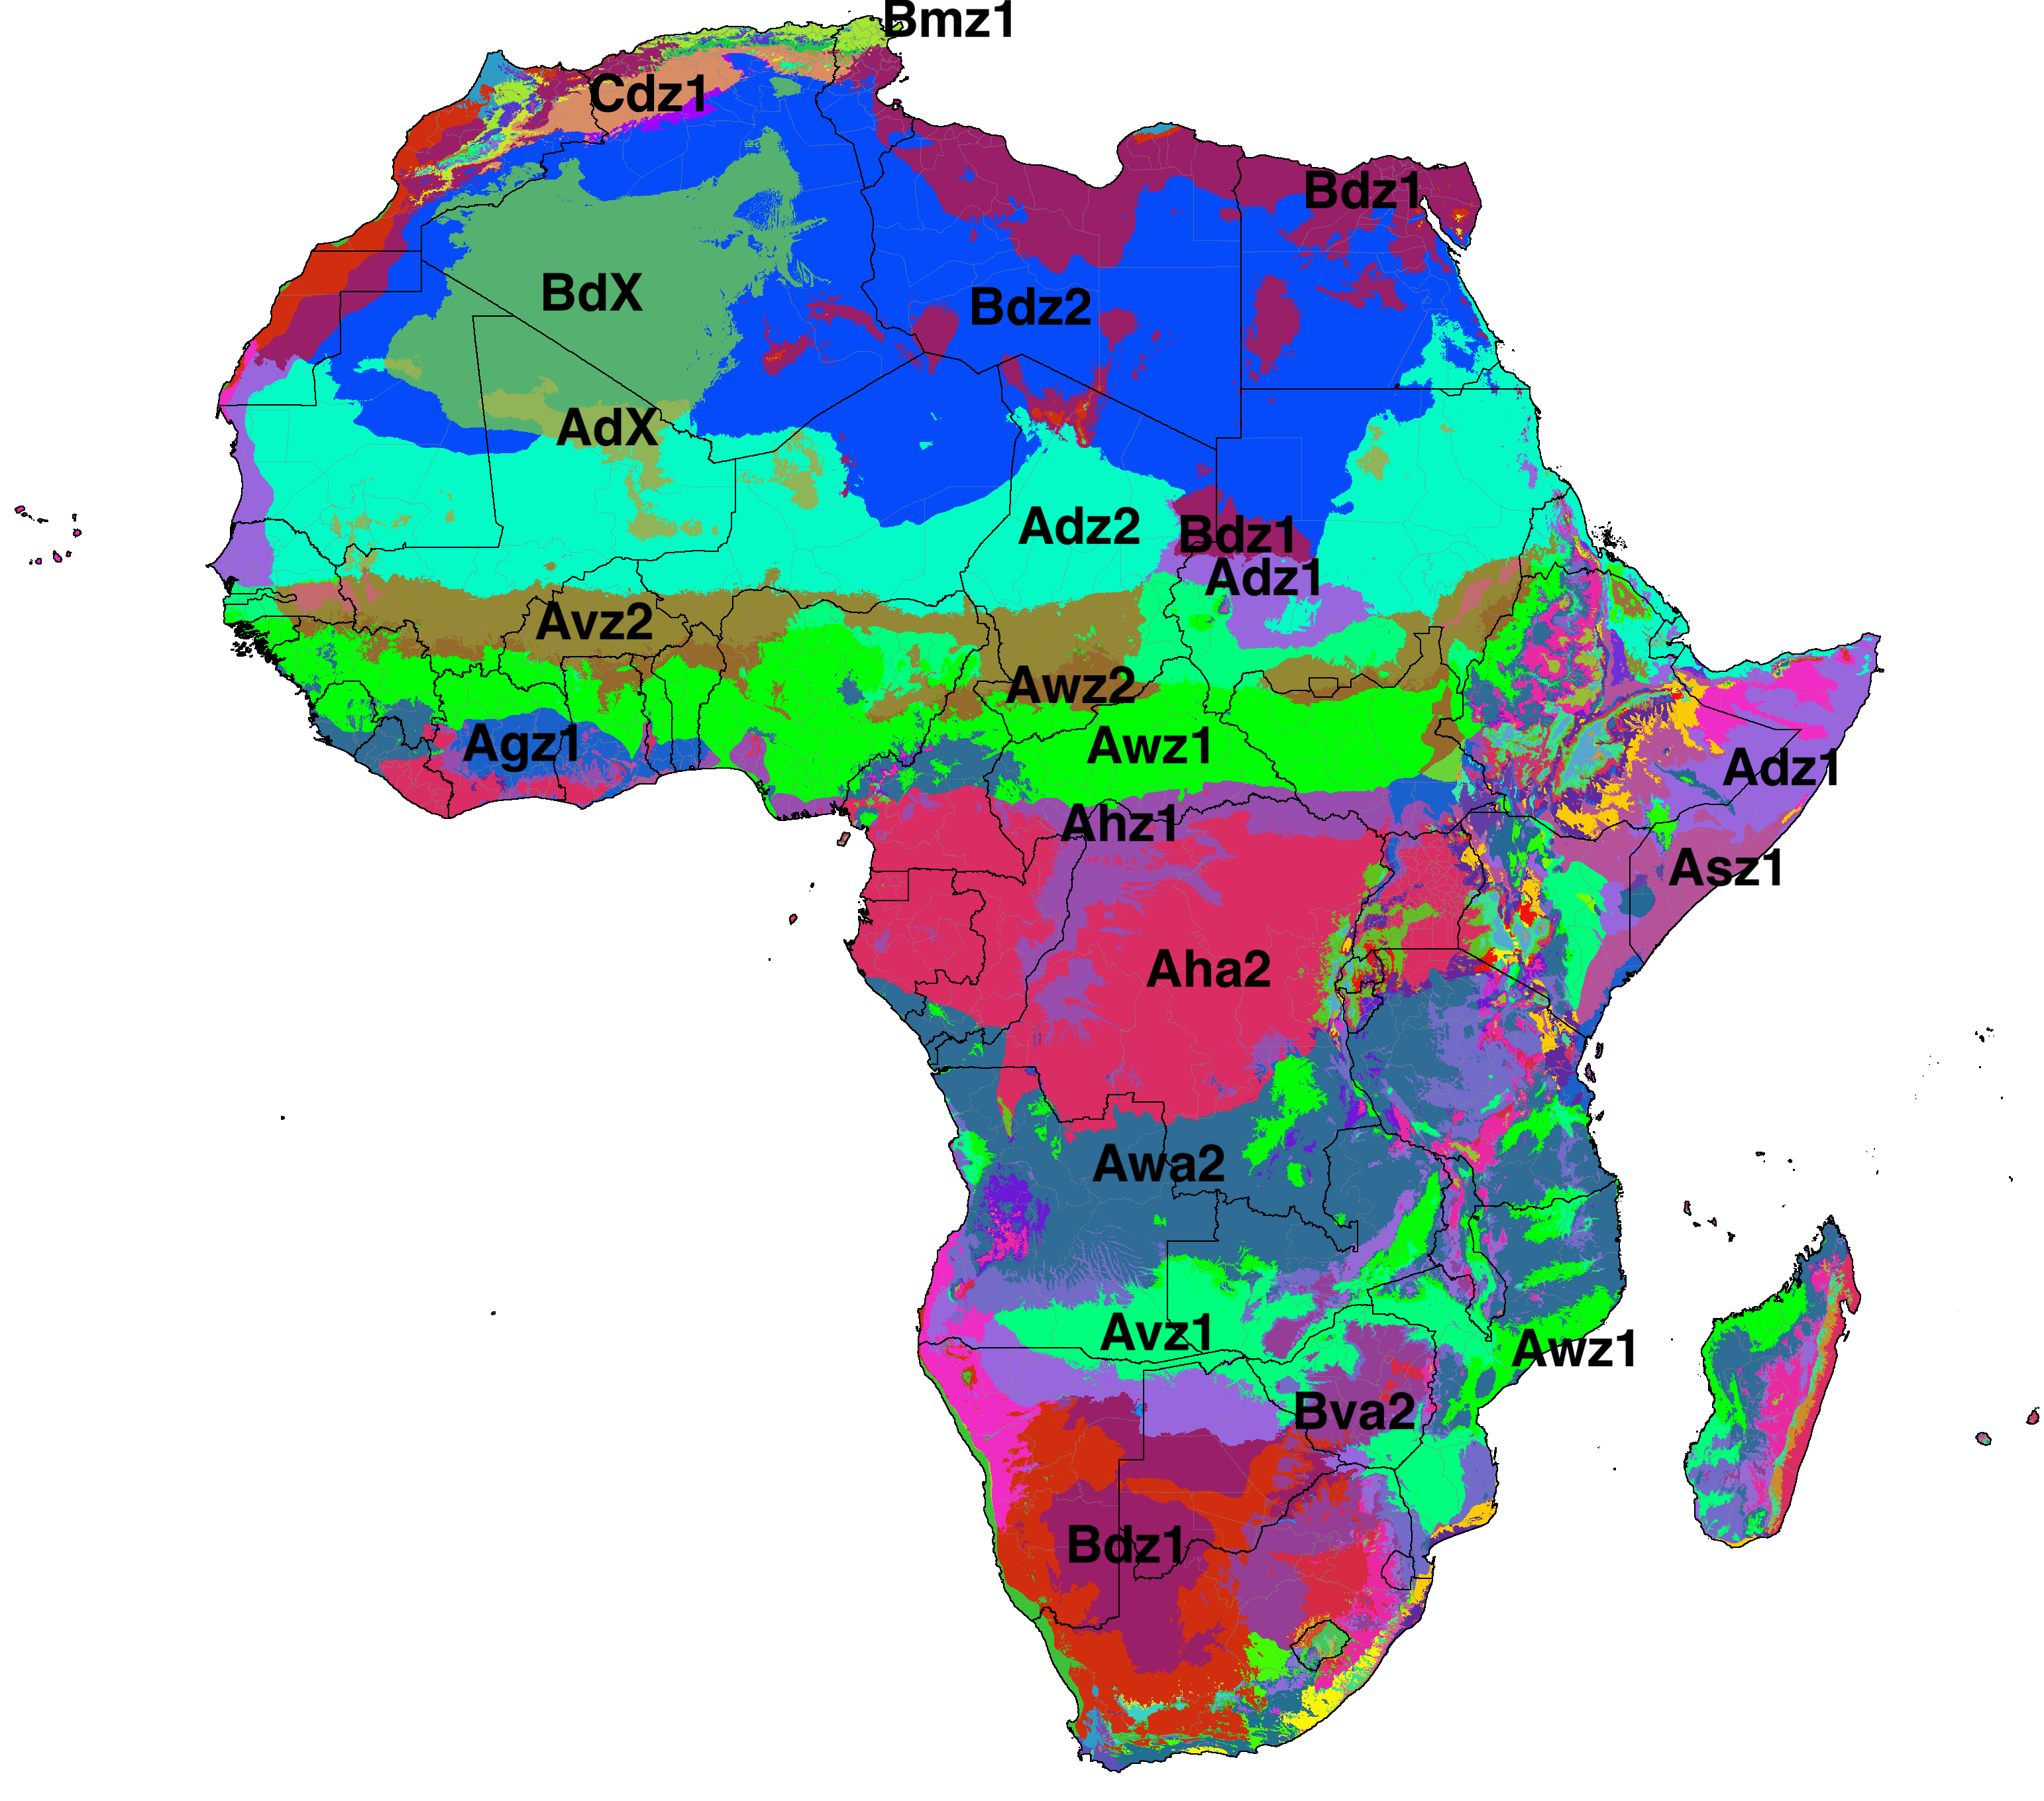
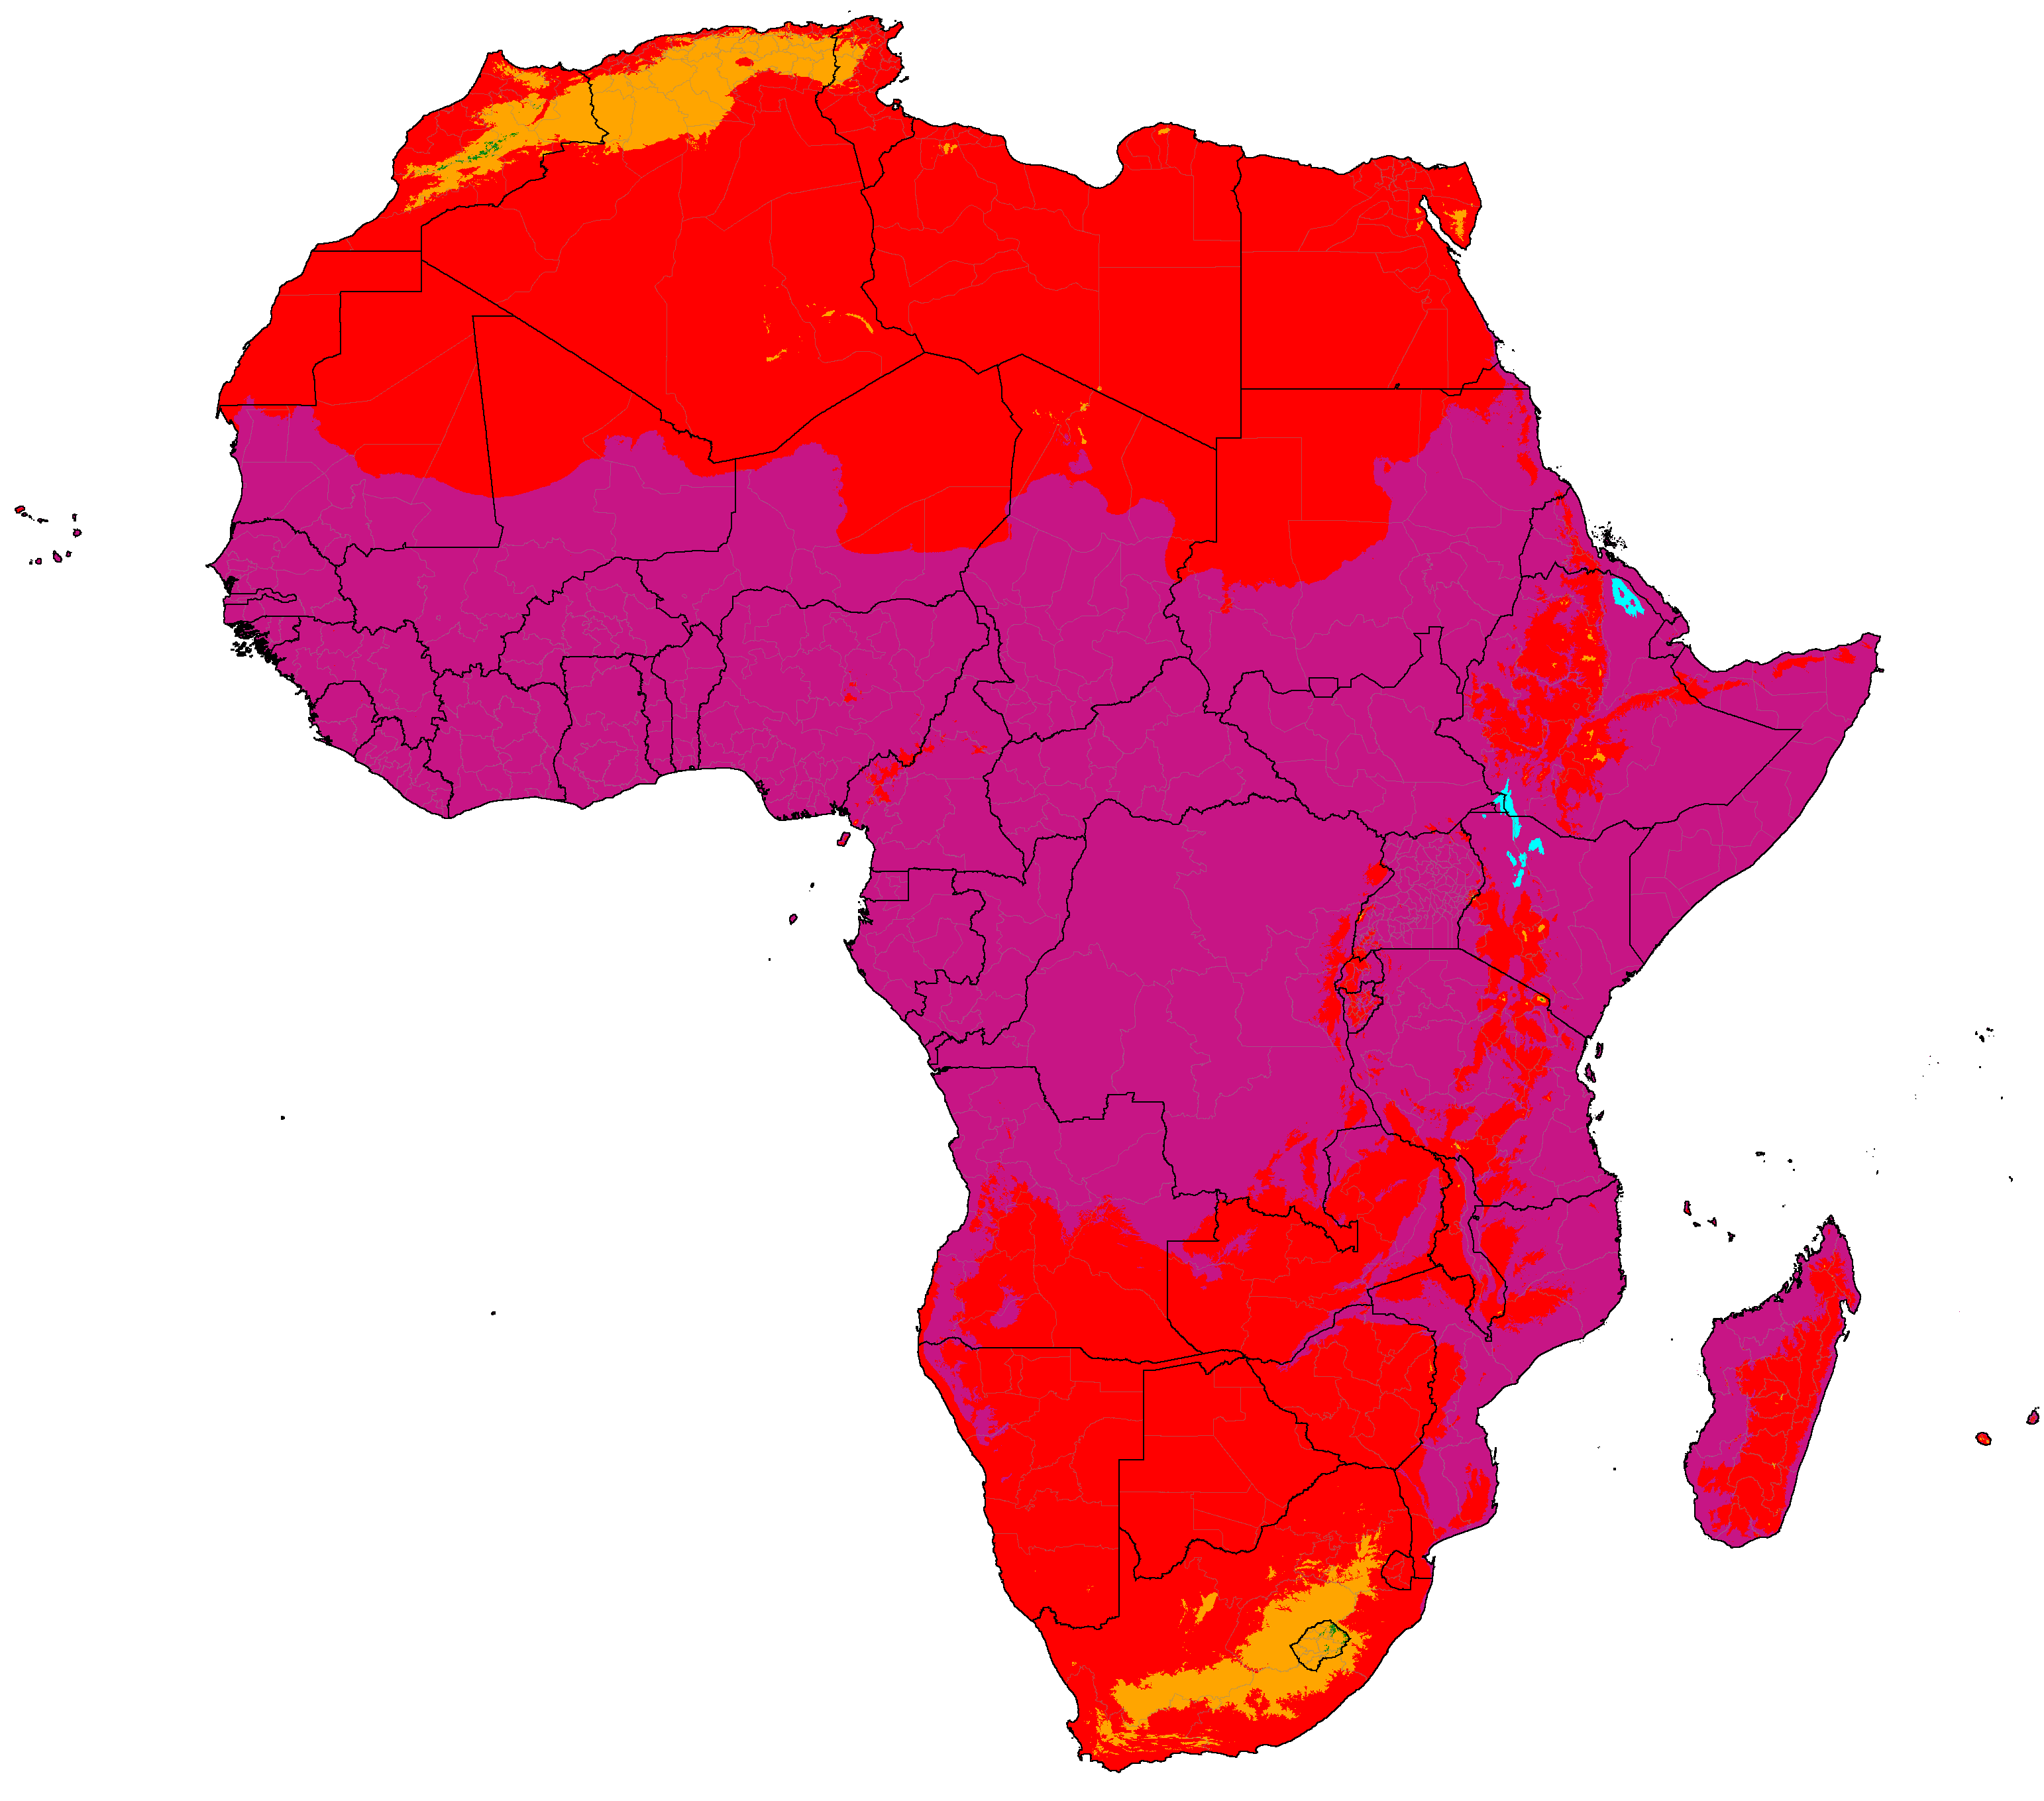
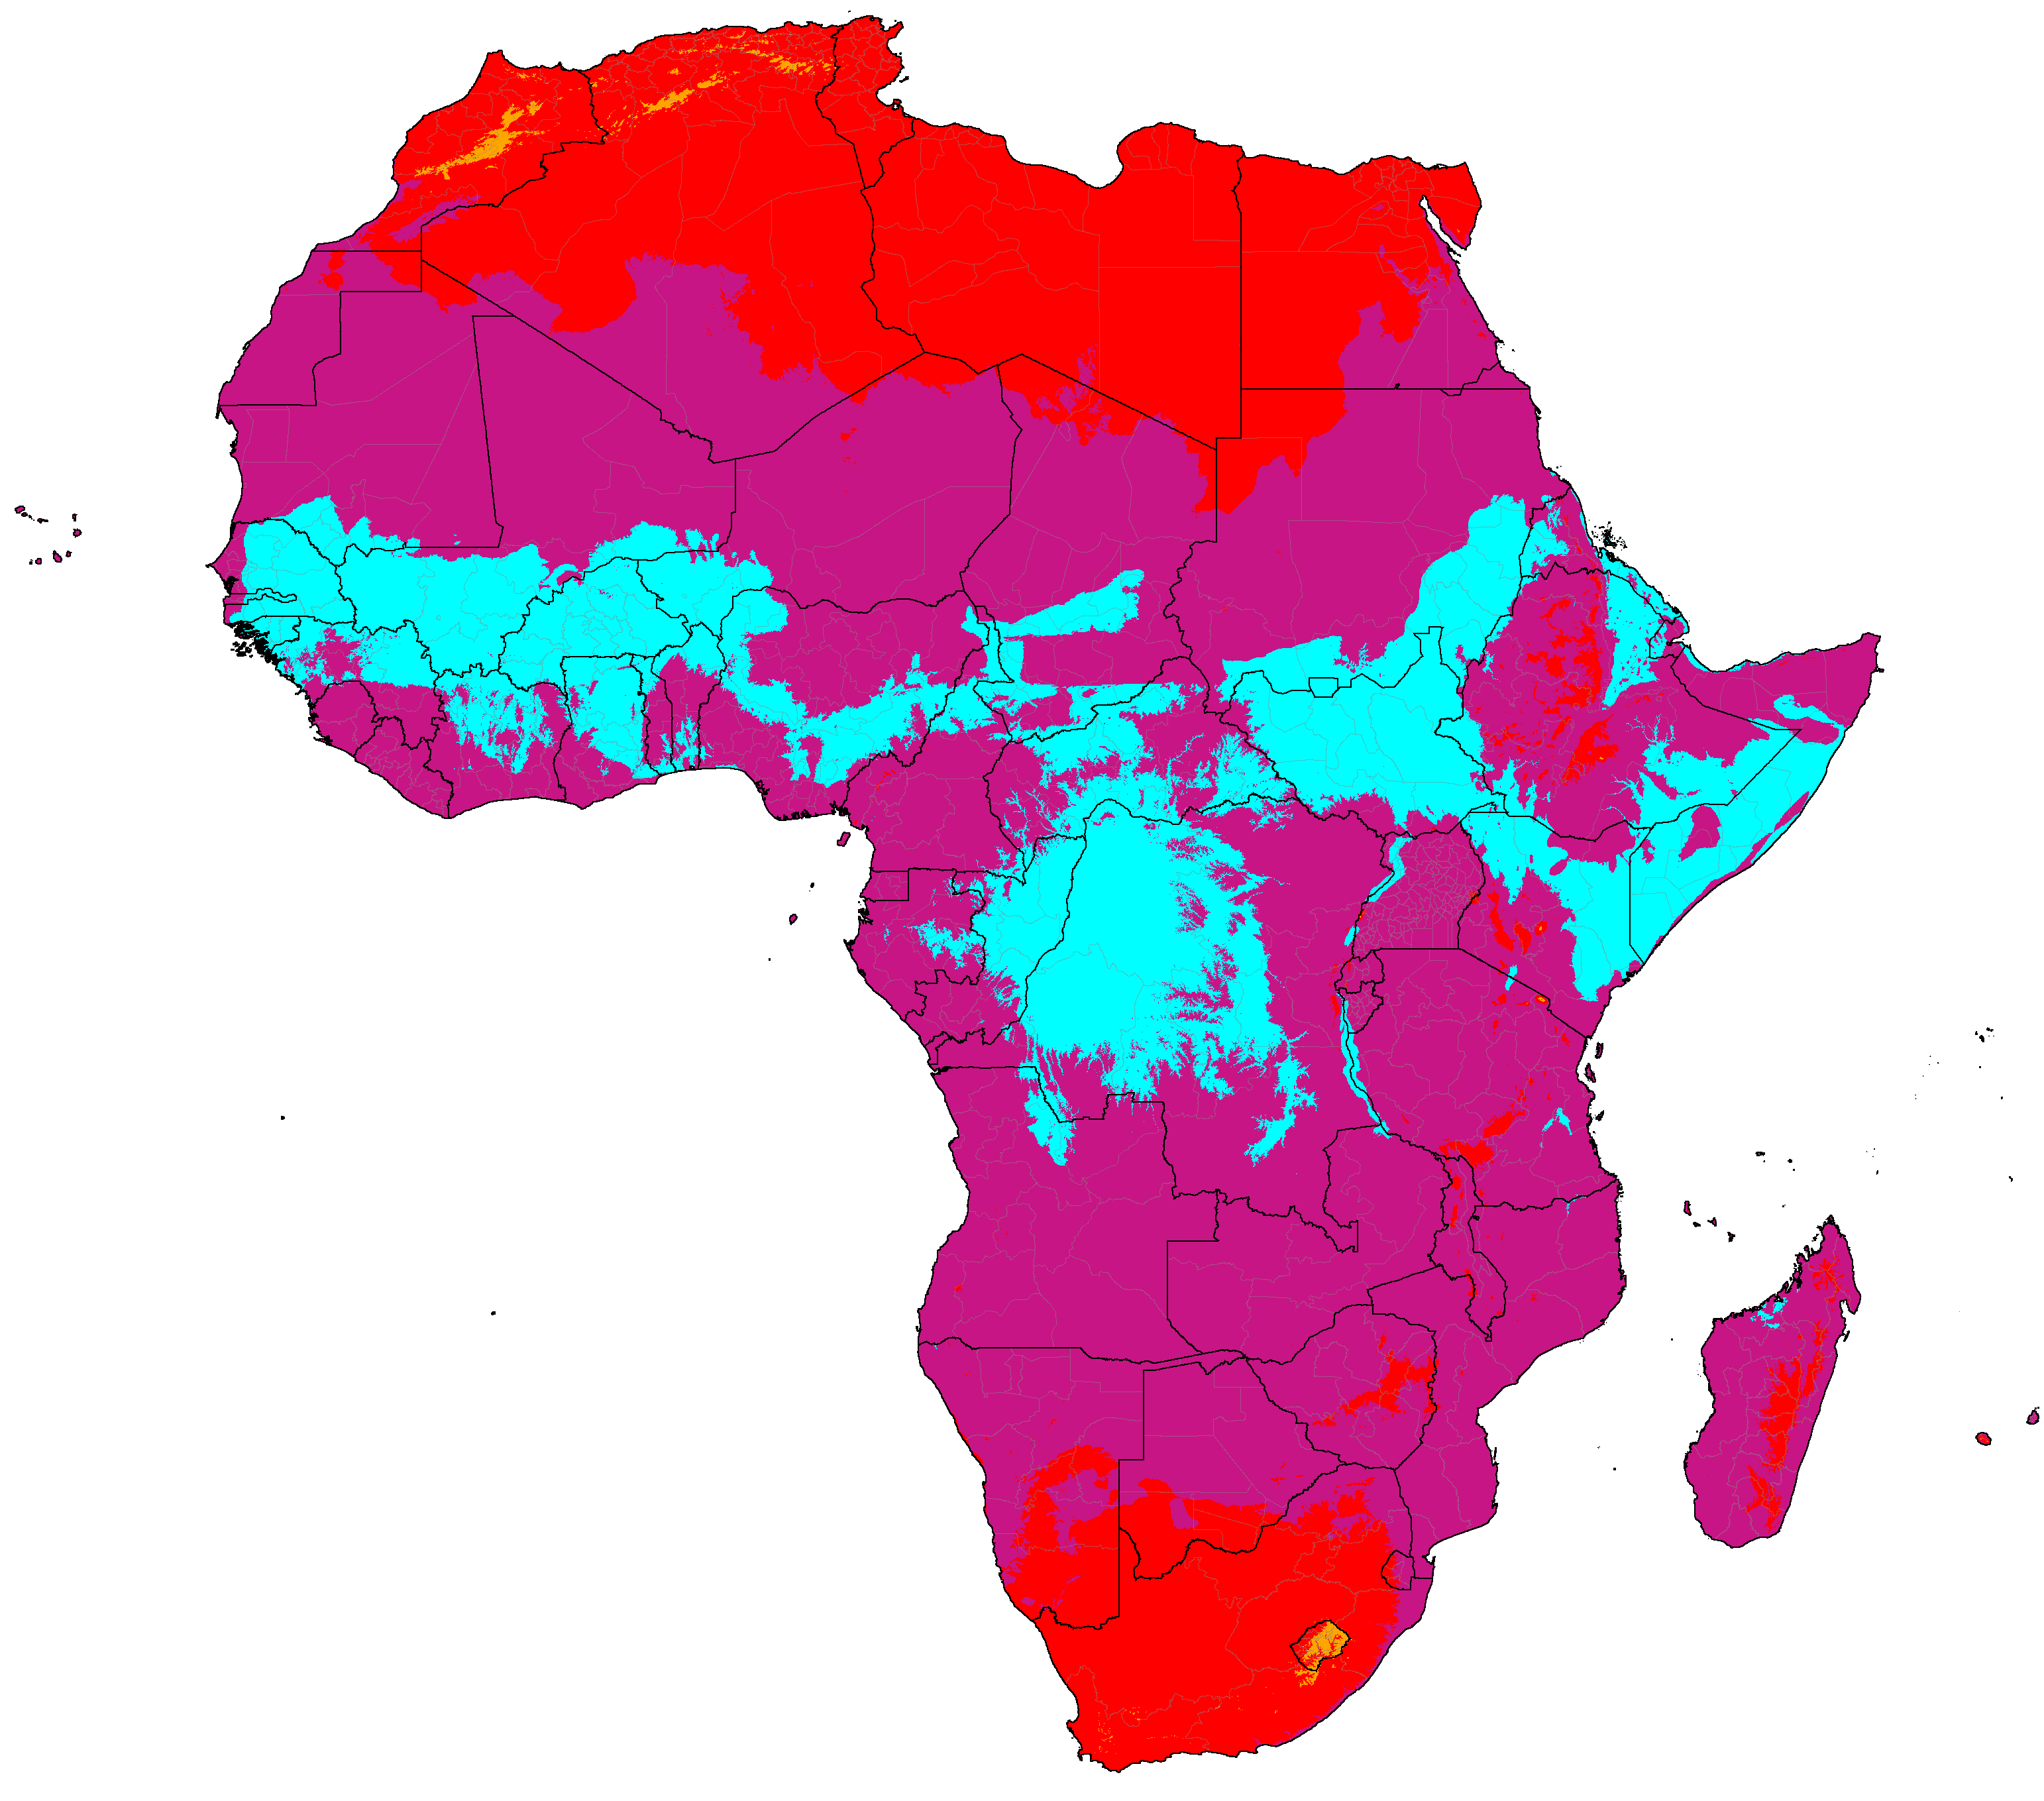
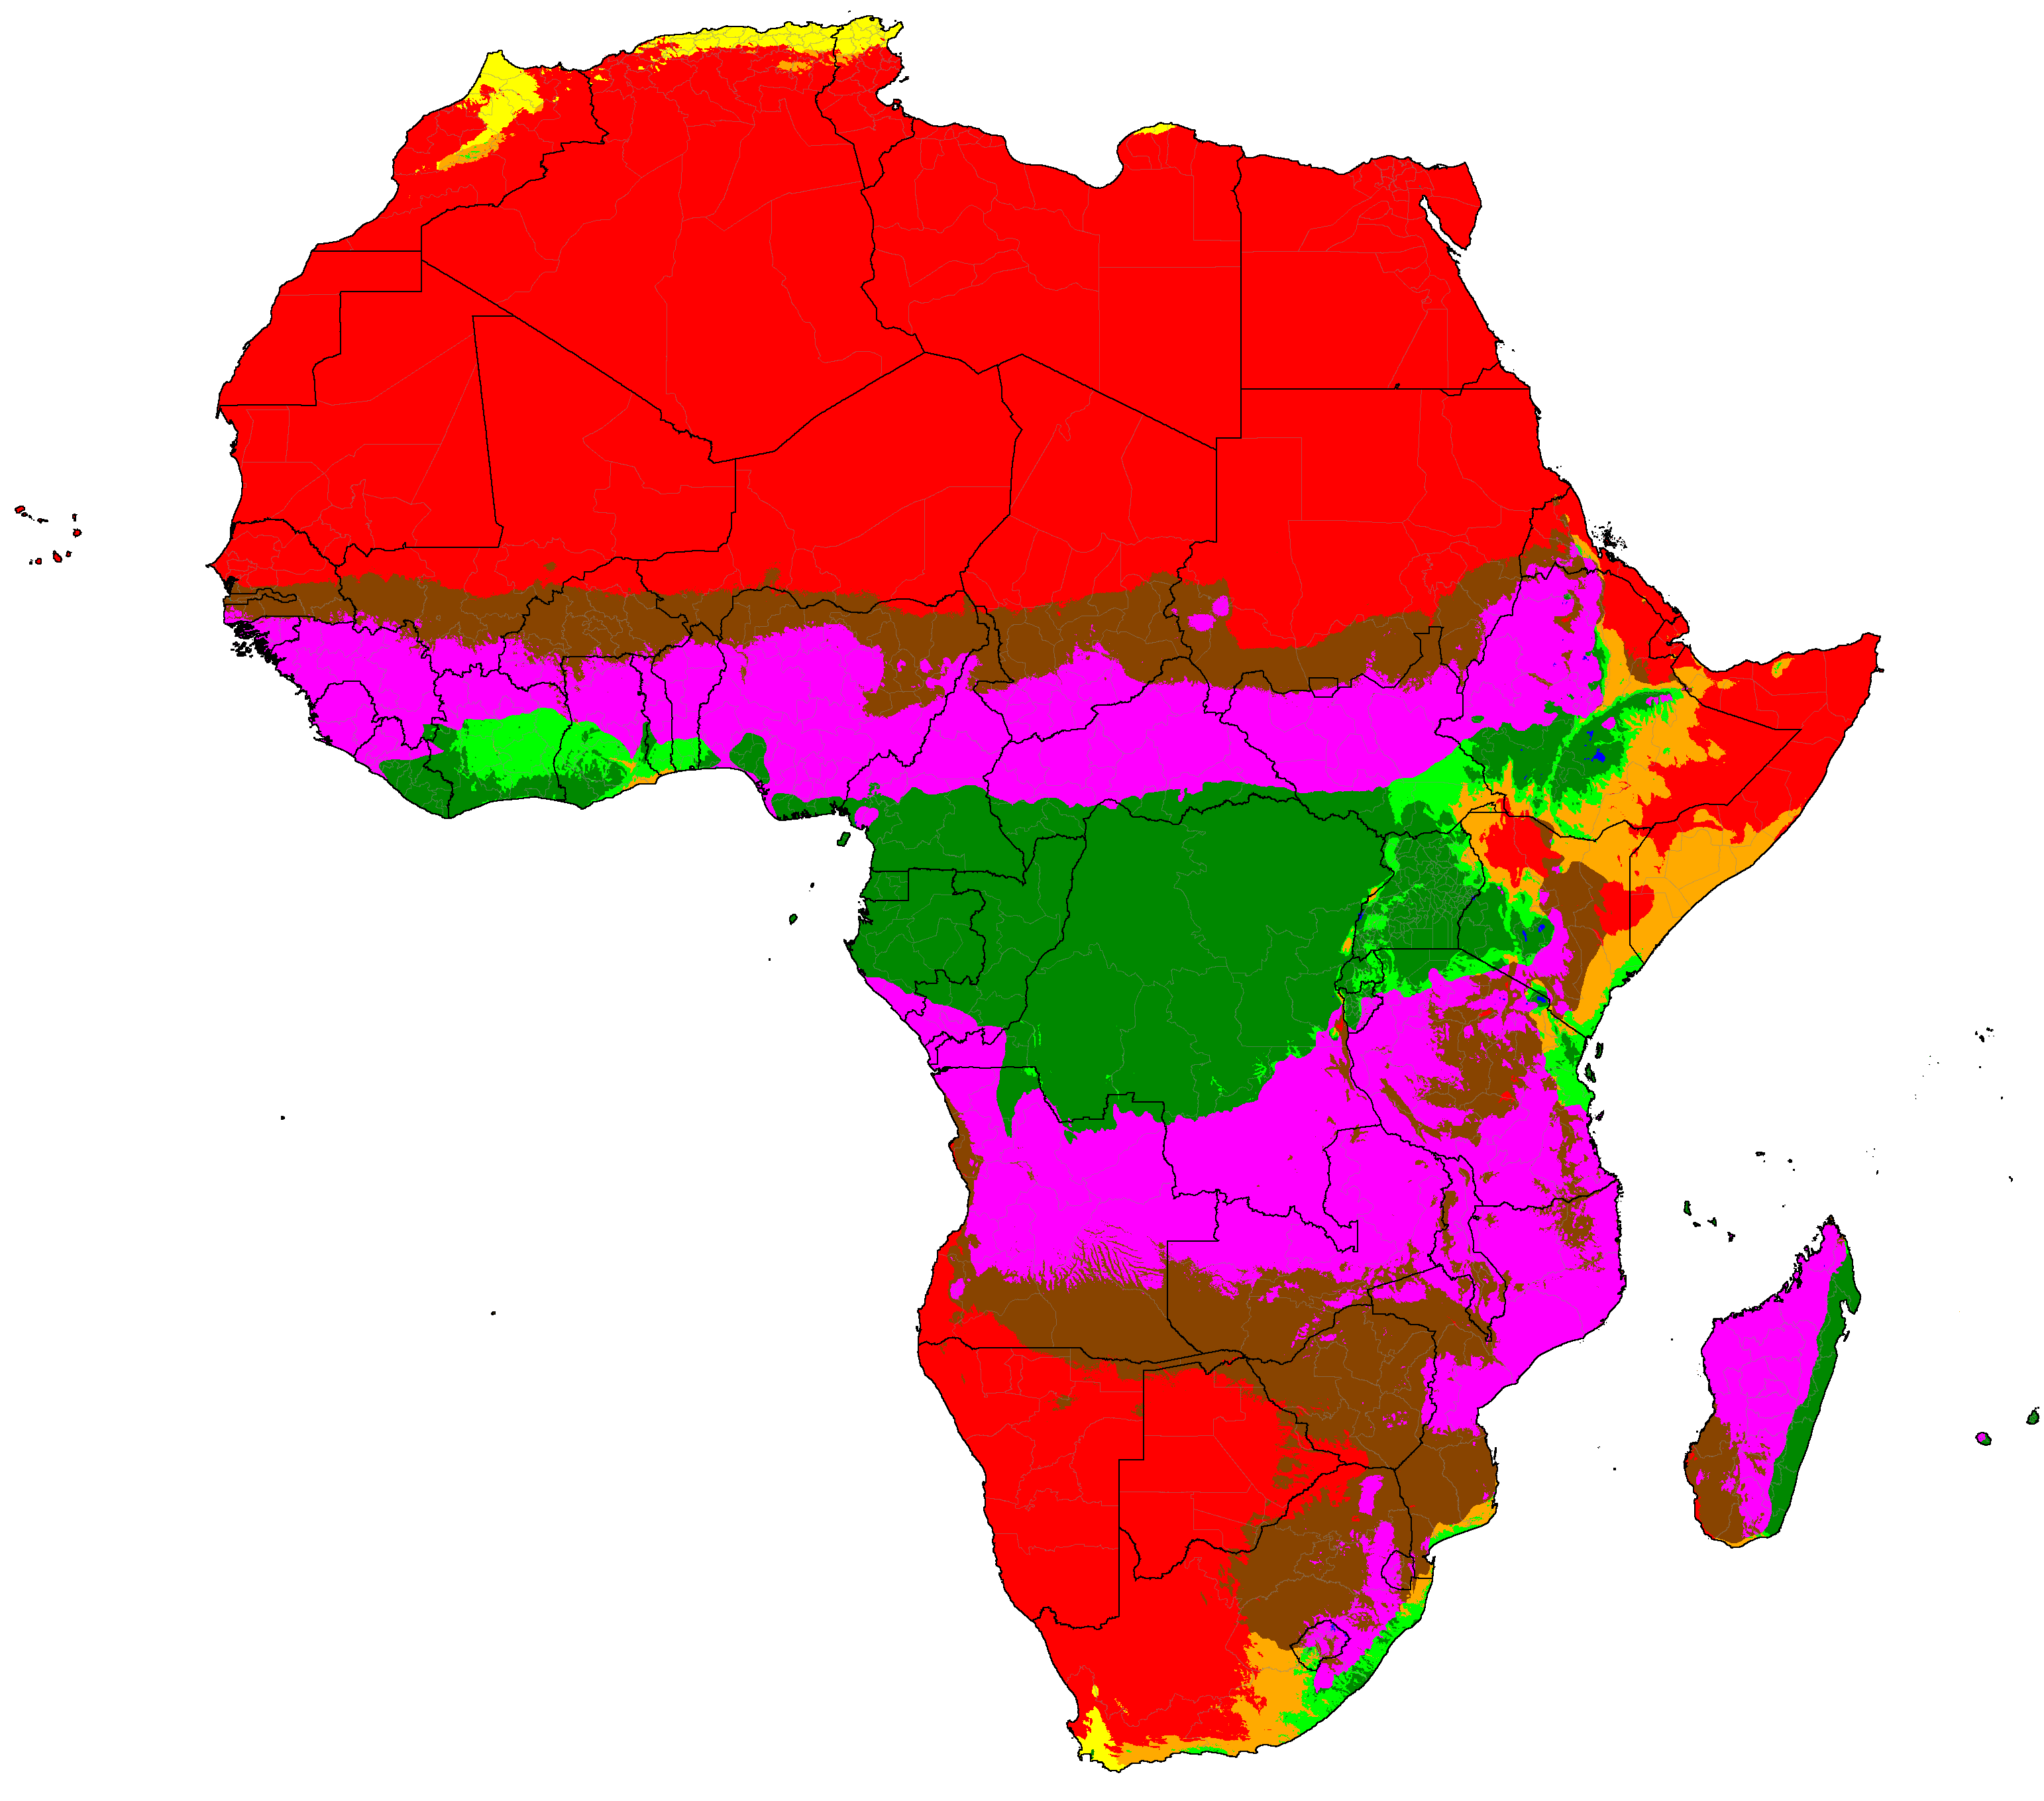
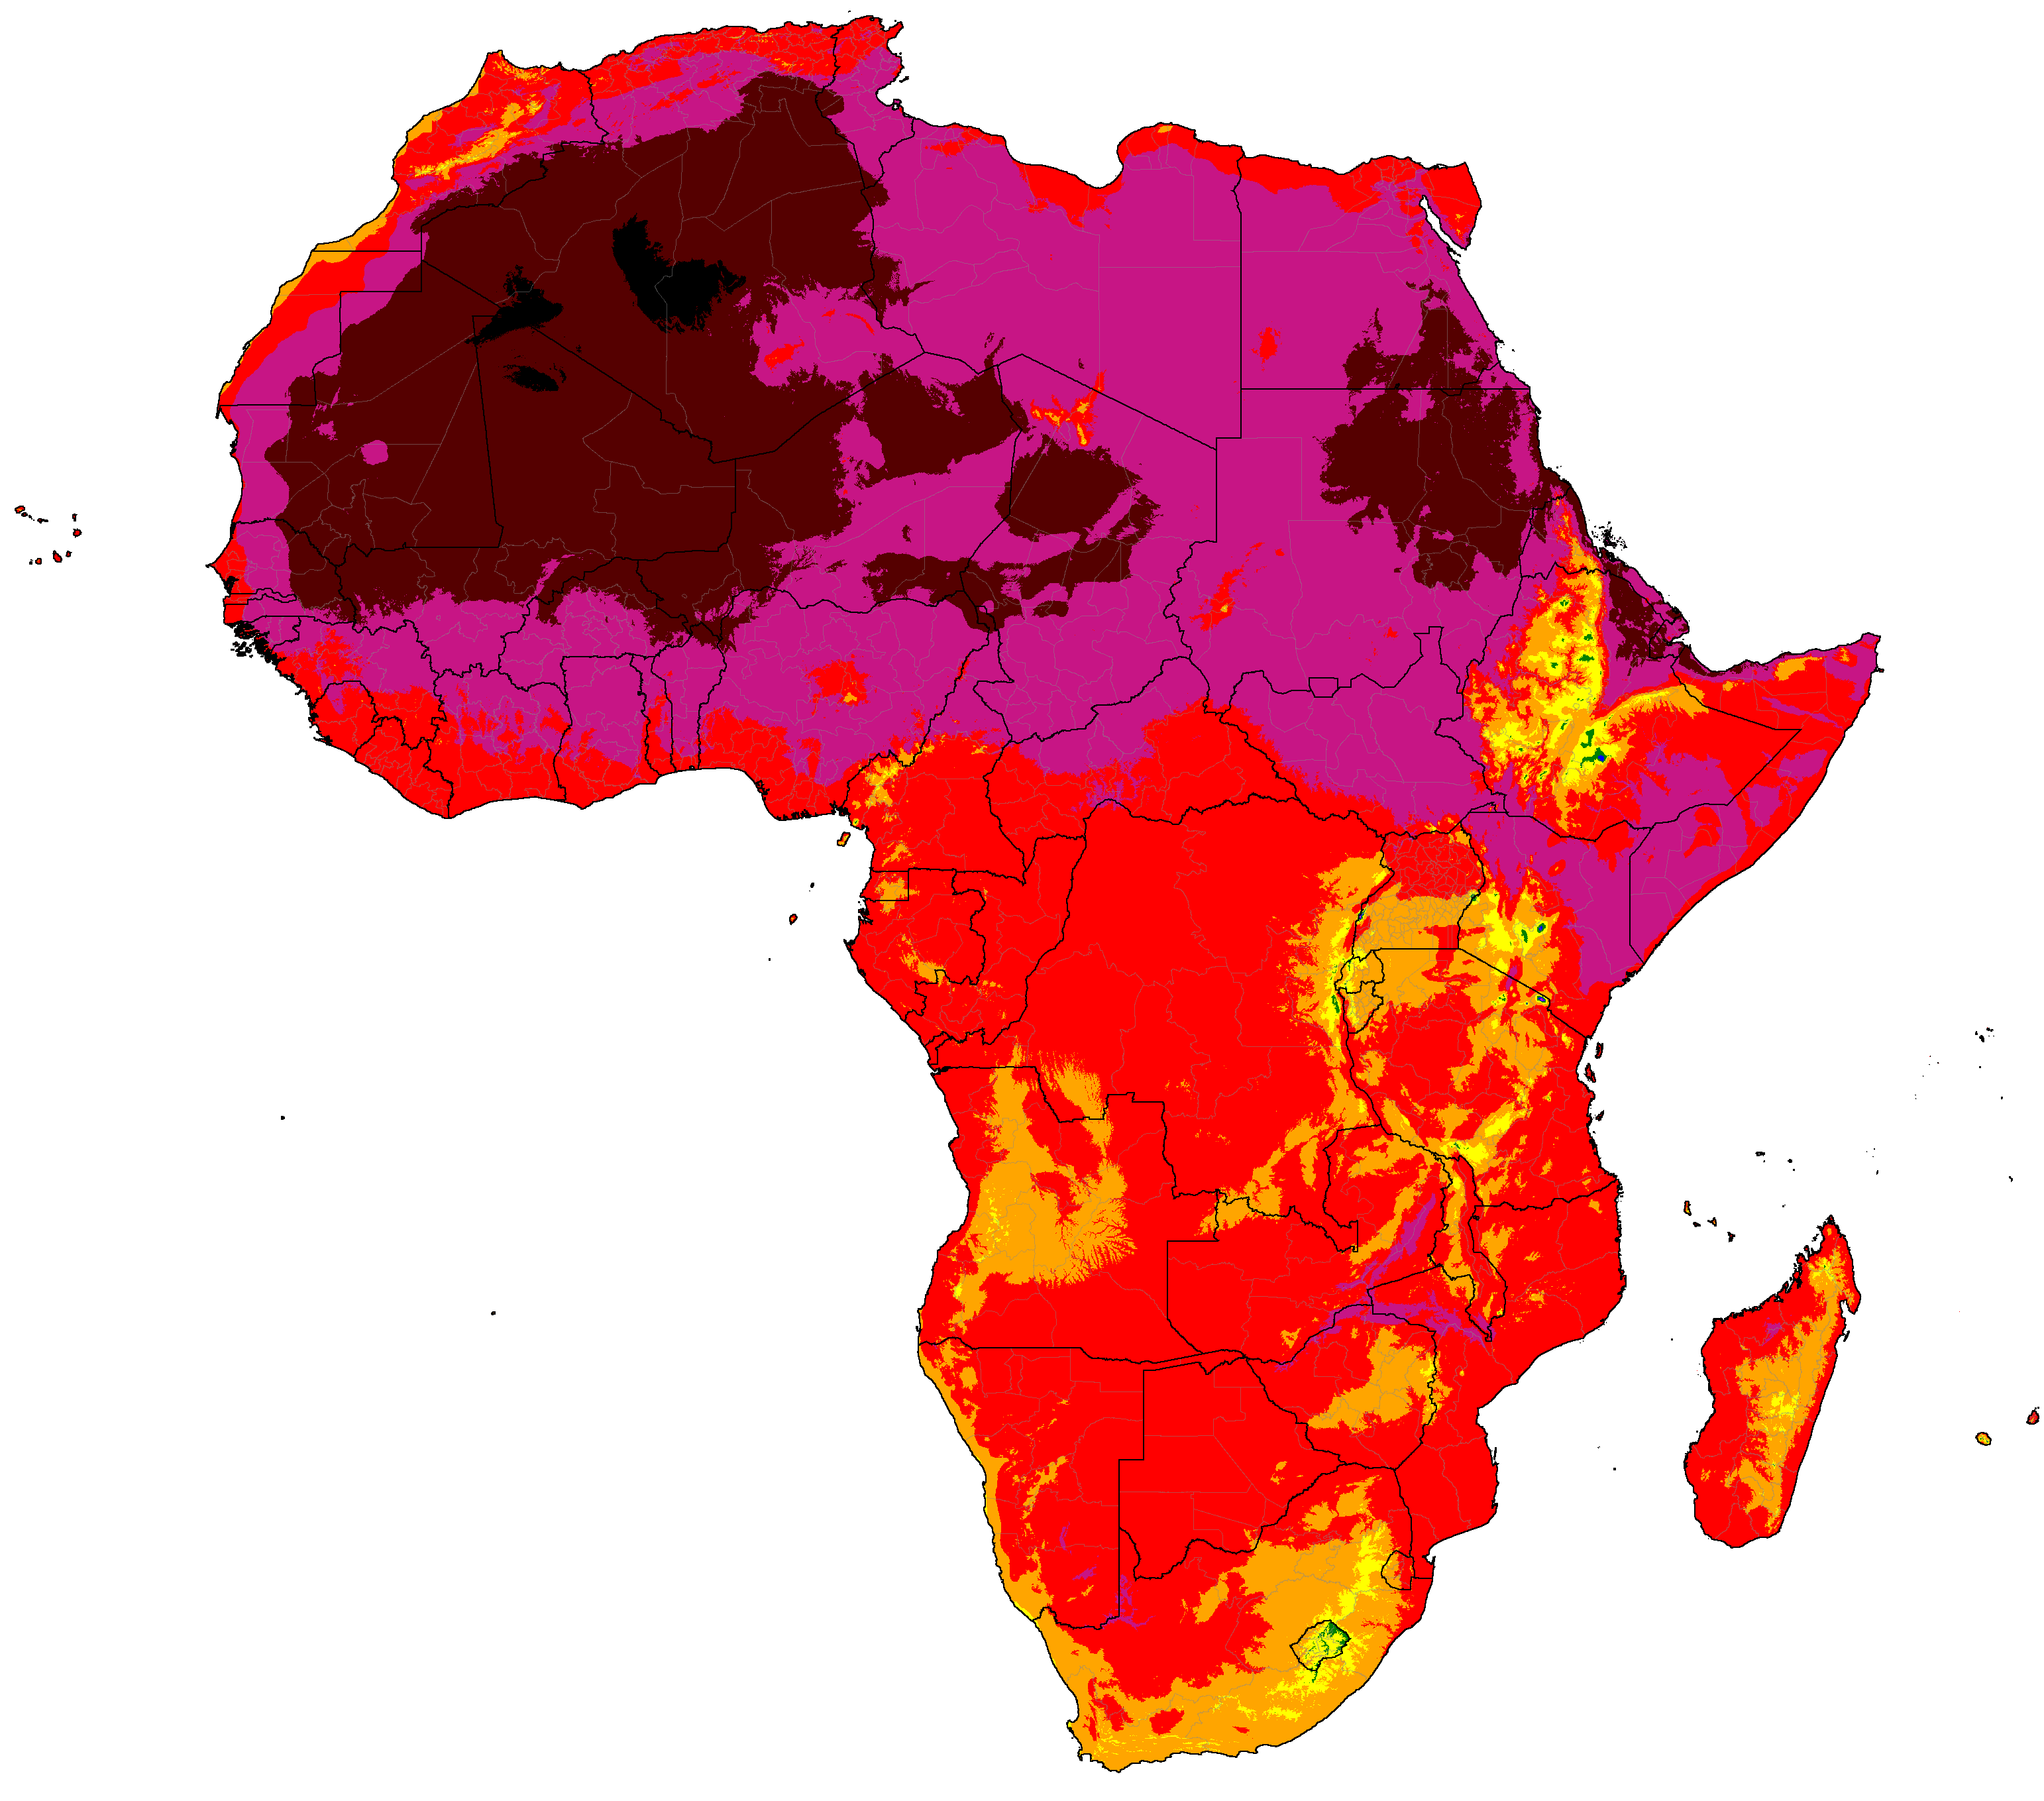
Africa distribution of winter categories (projections are SSP5-8.5 high emissions normals)
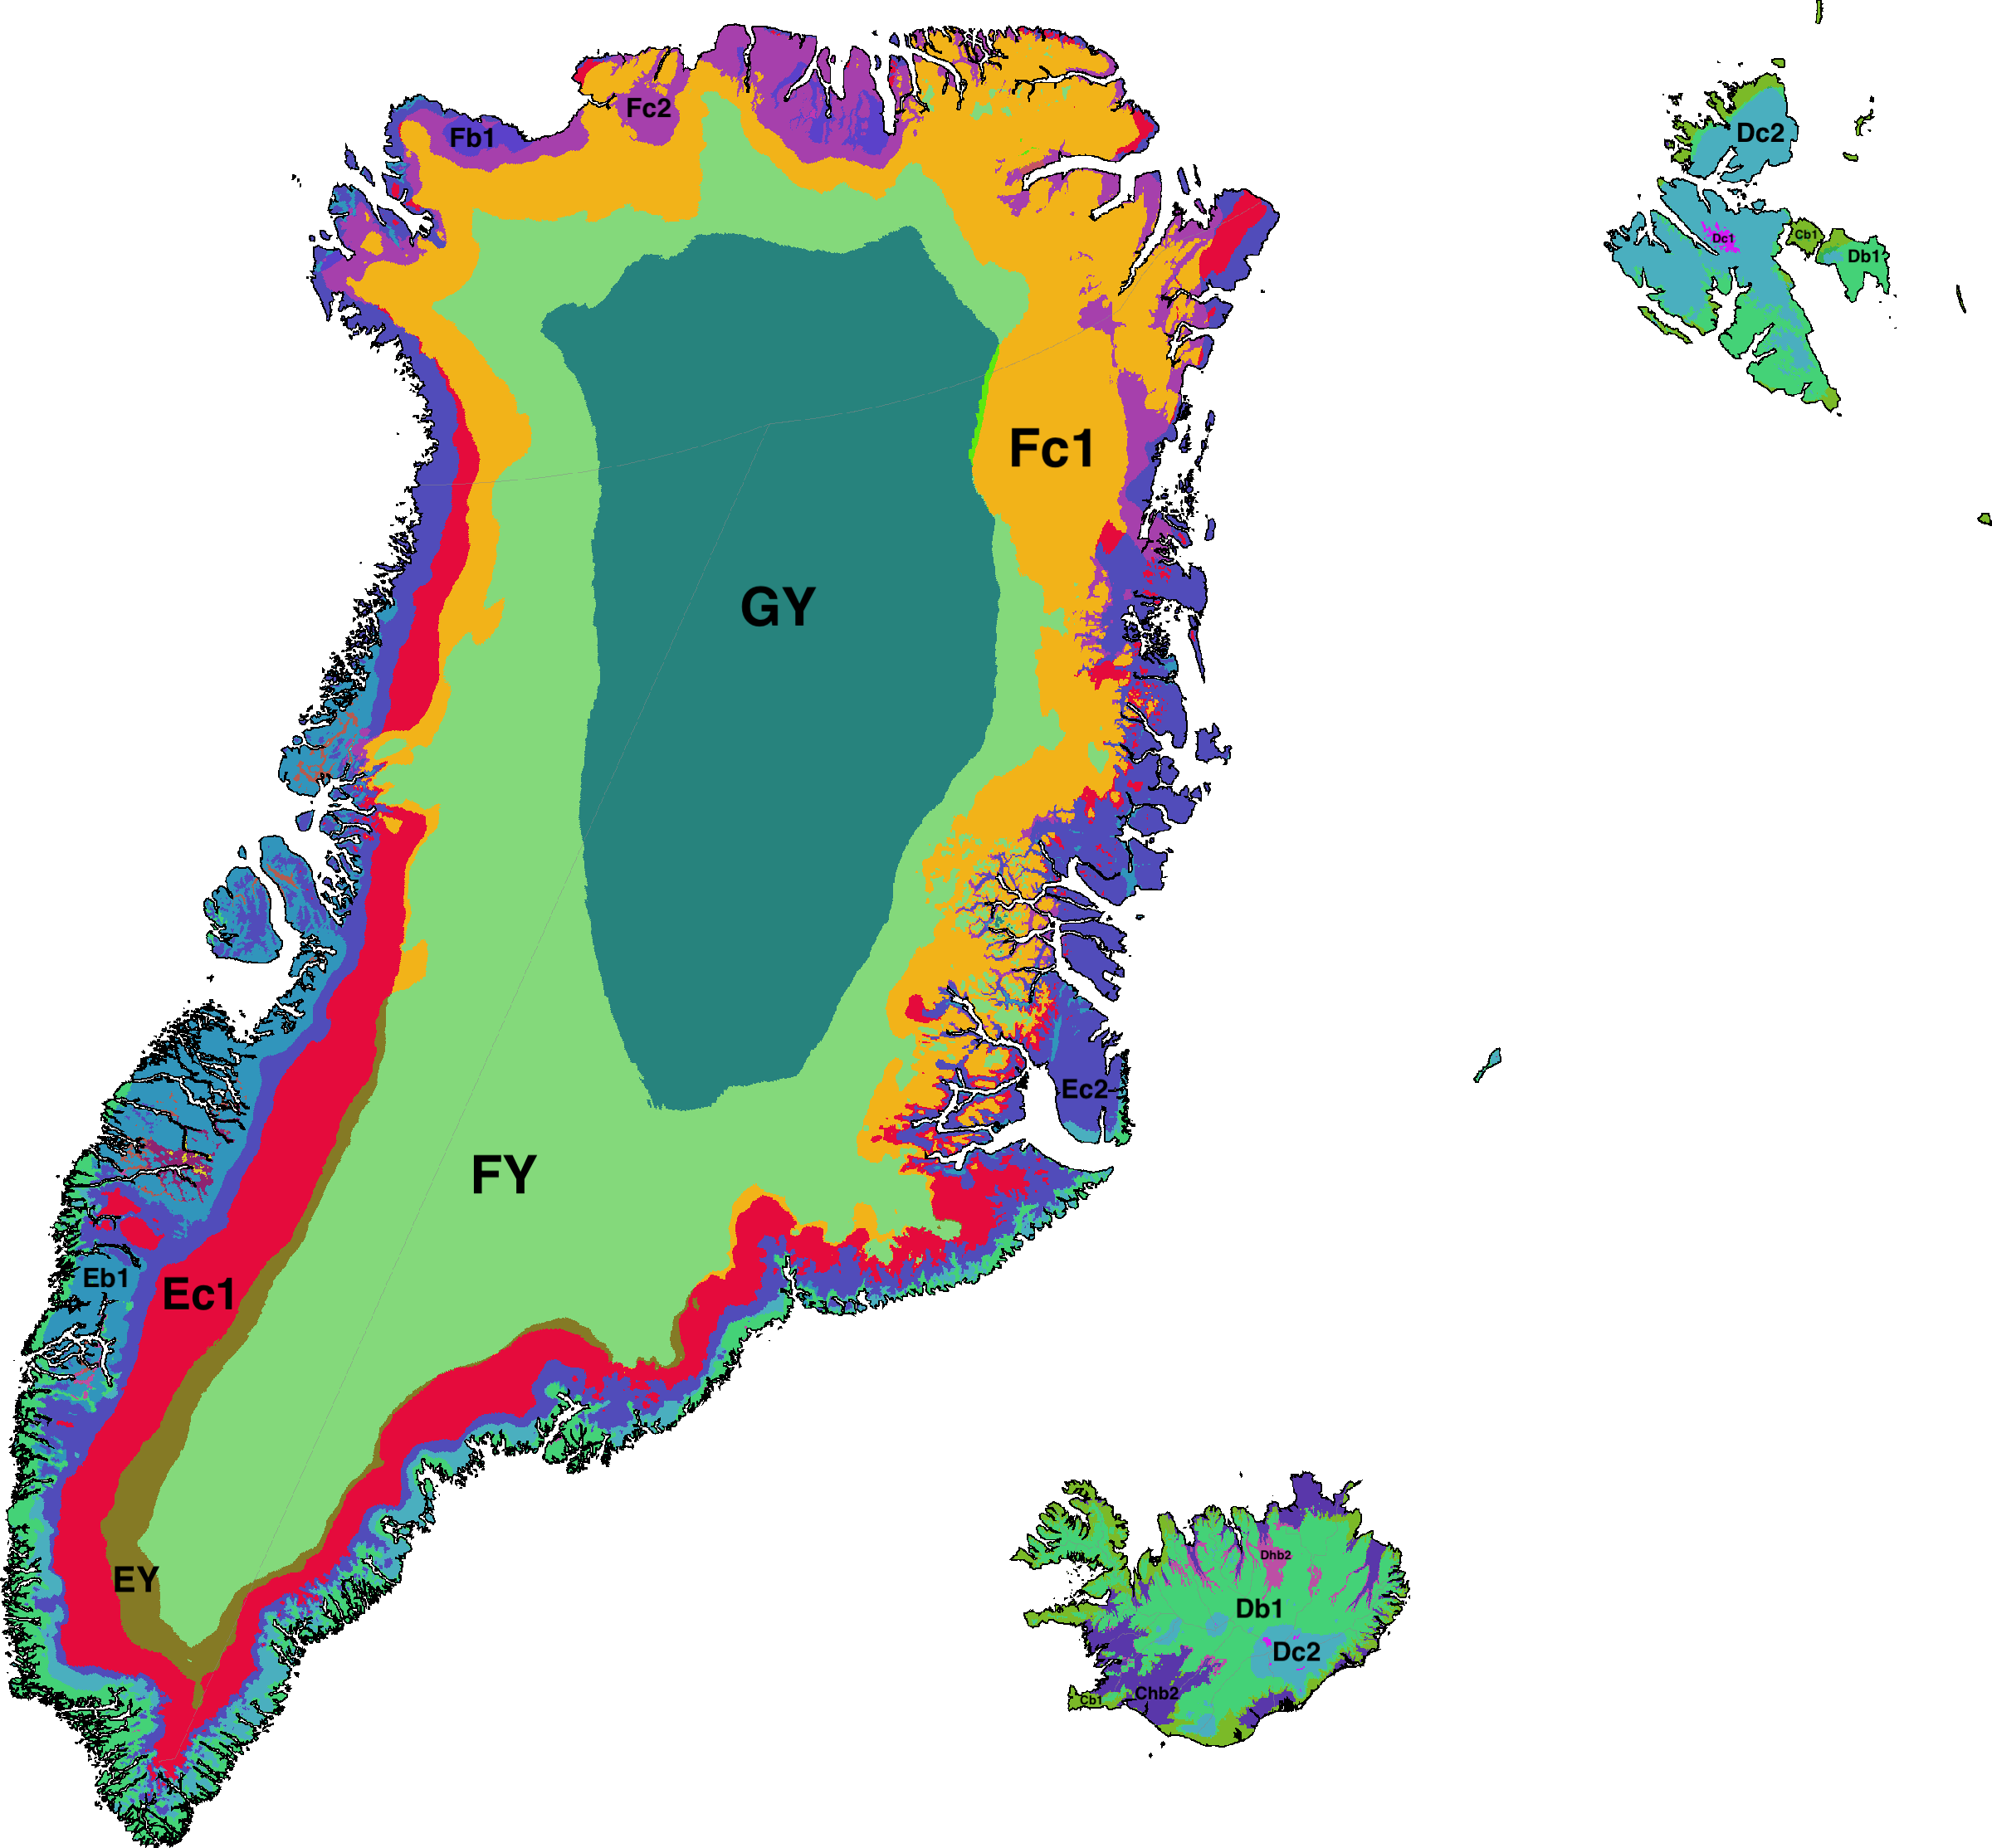
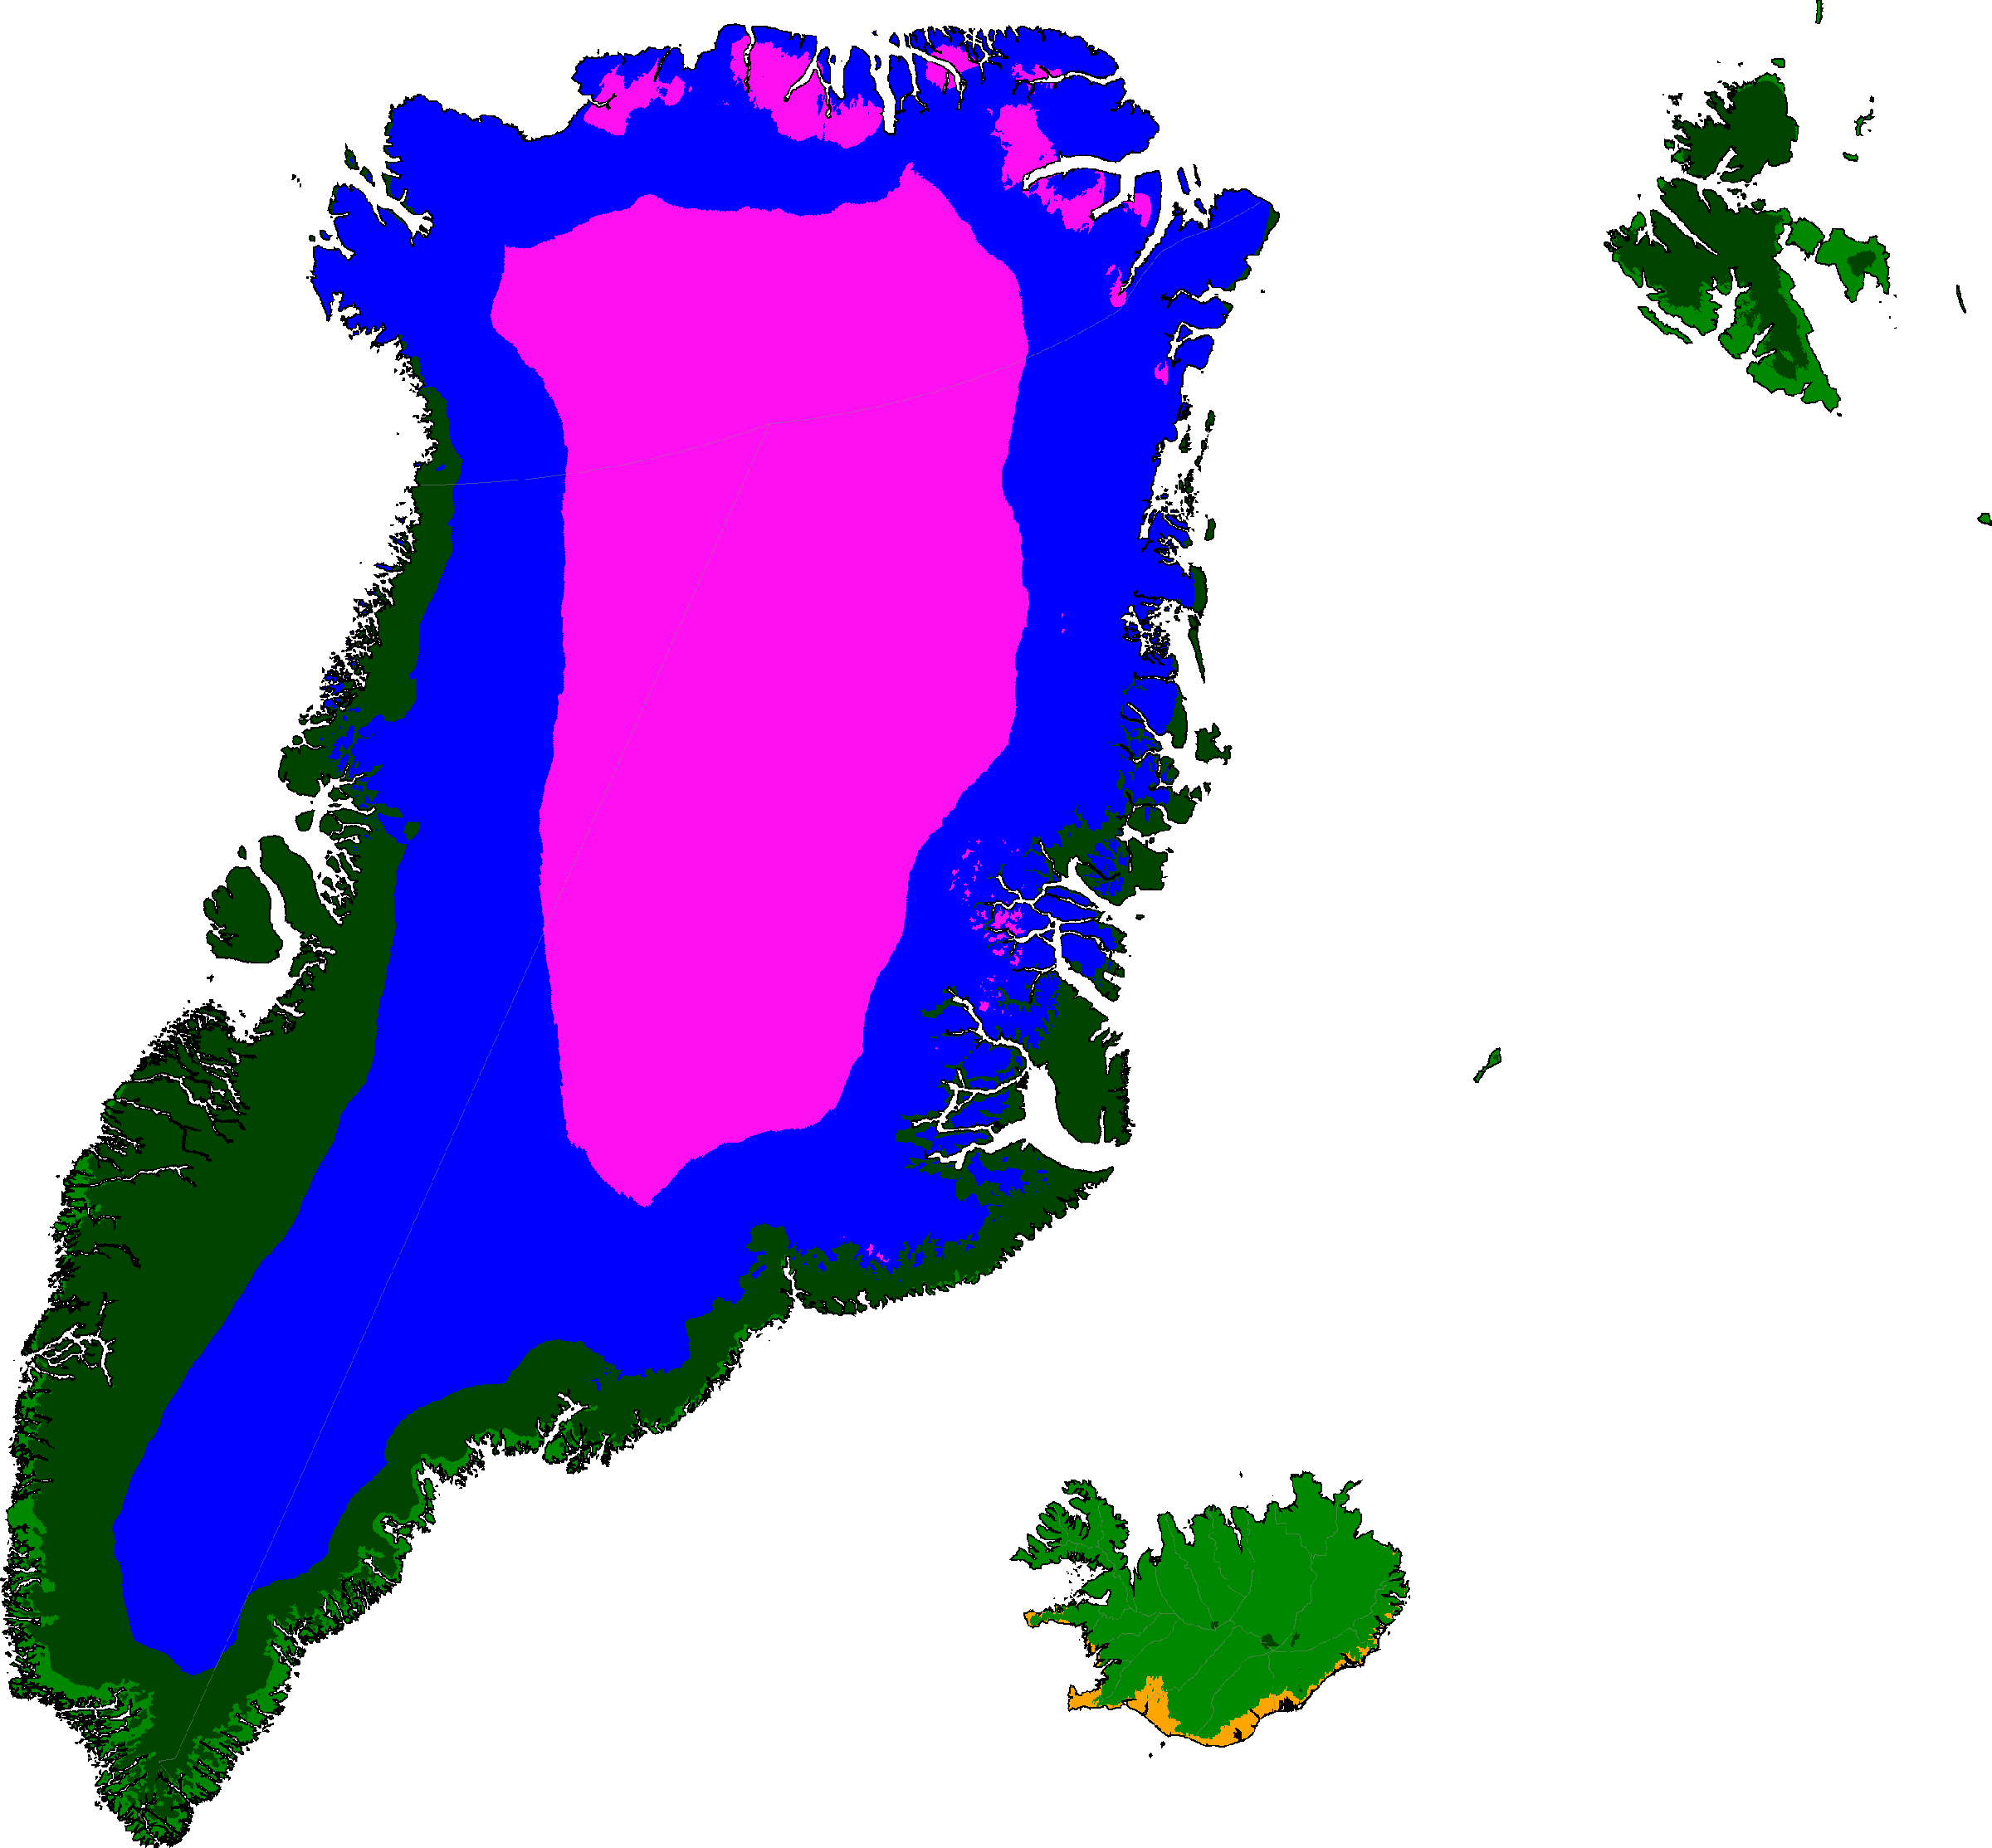
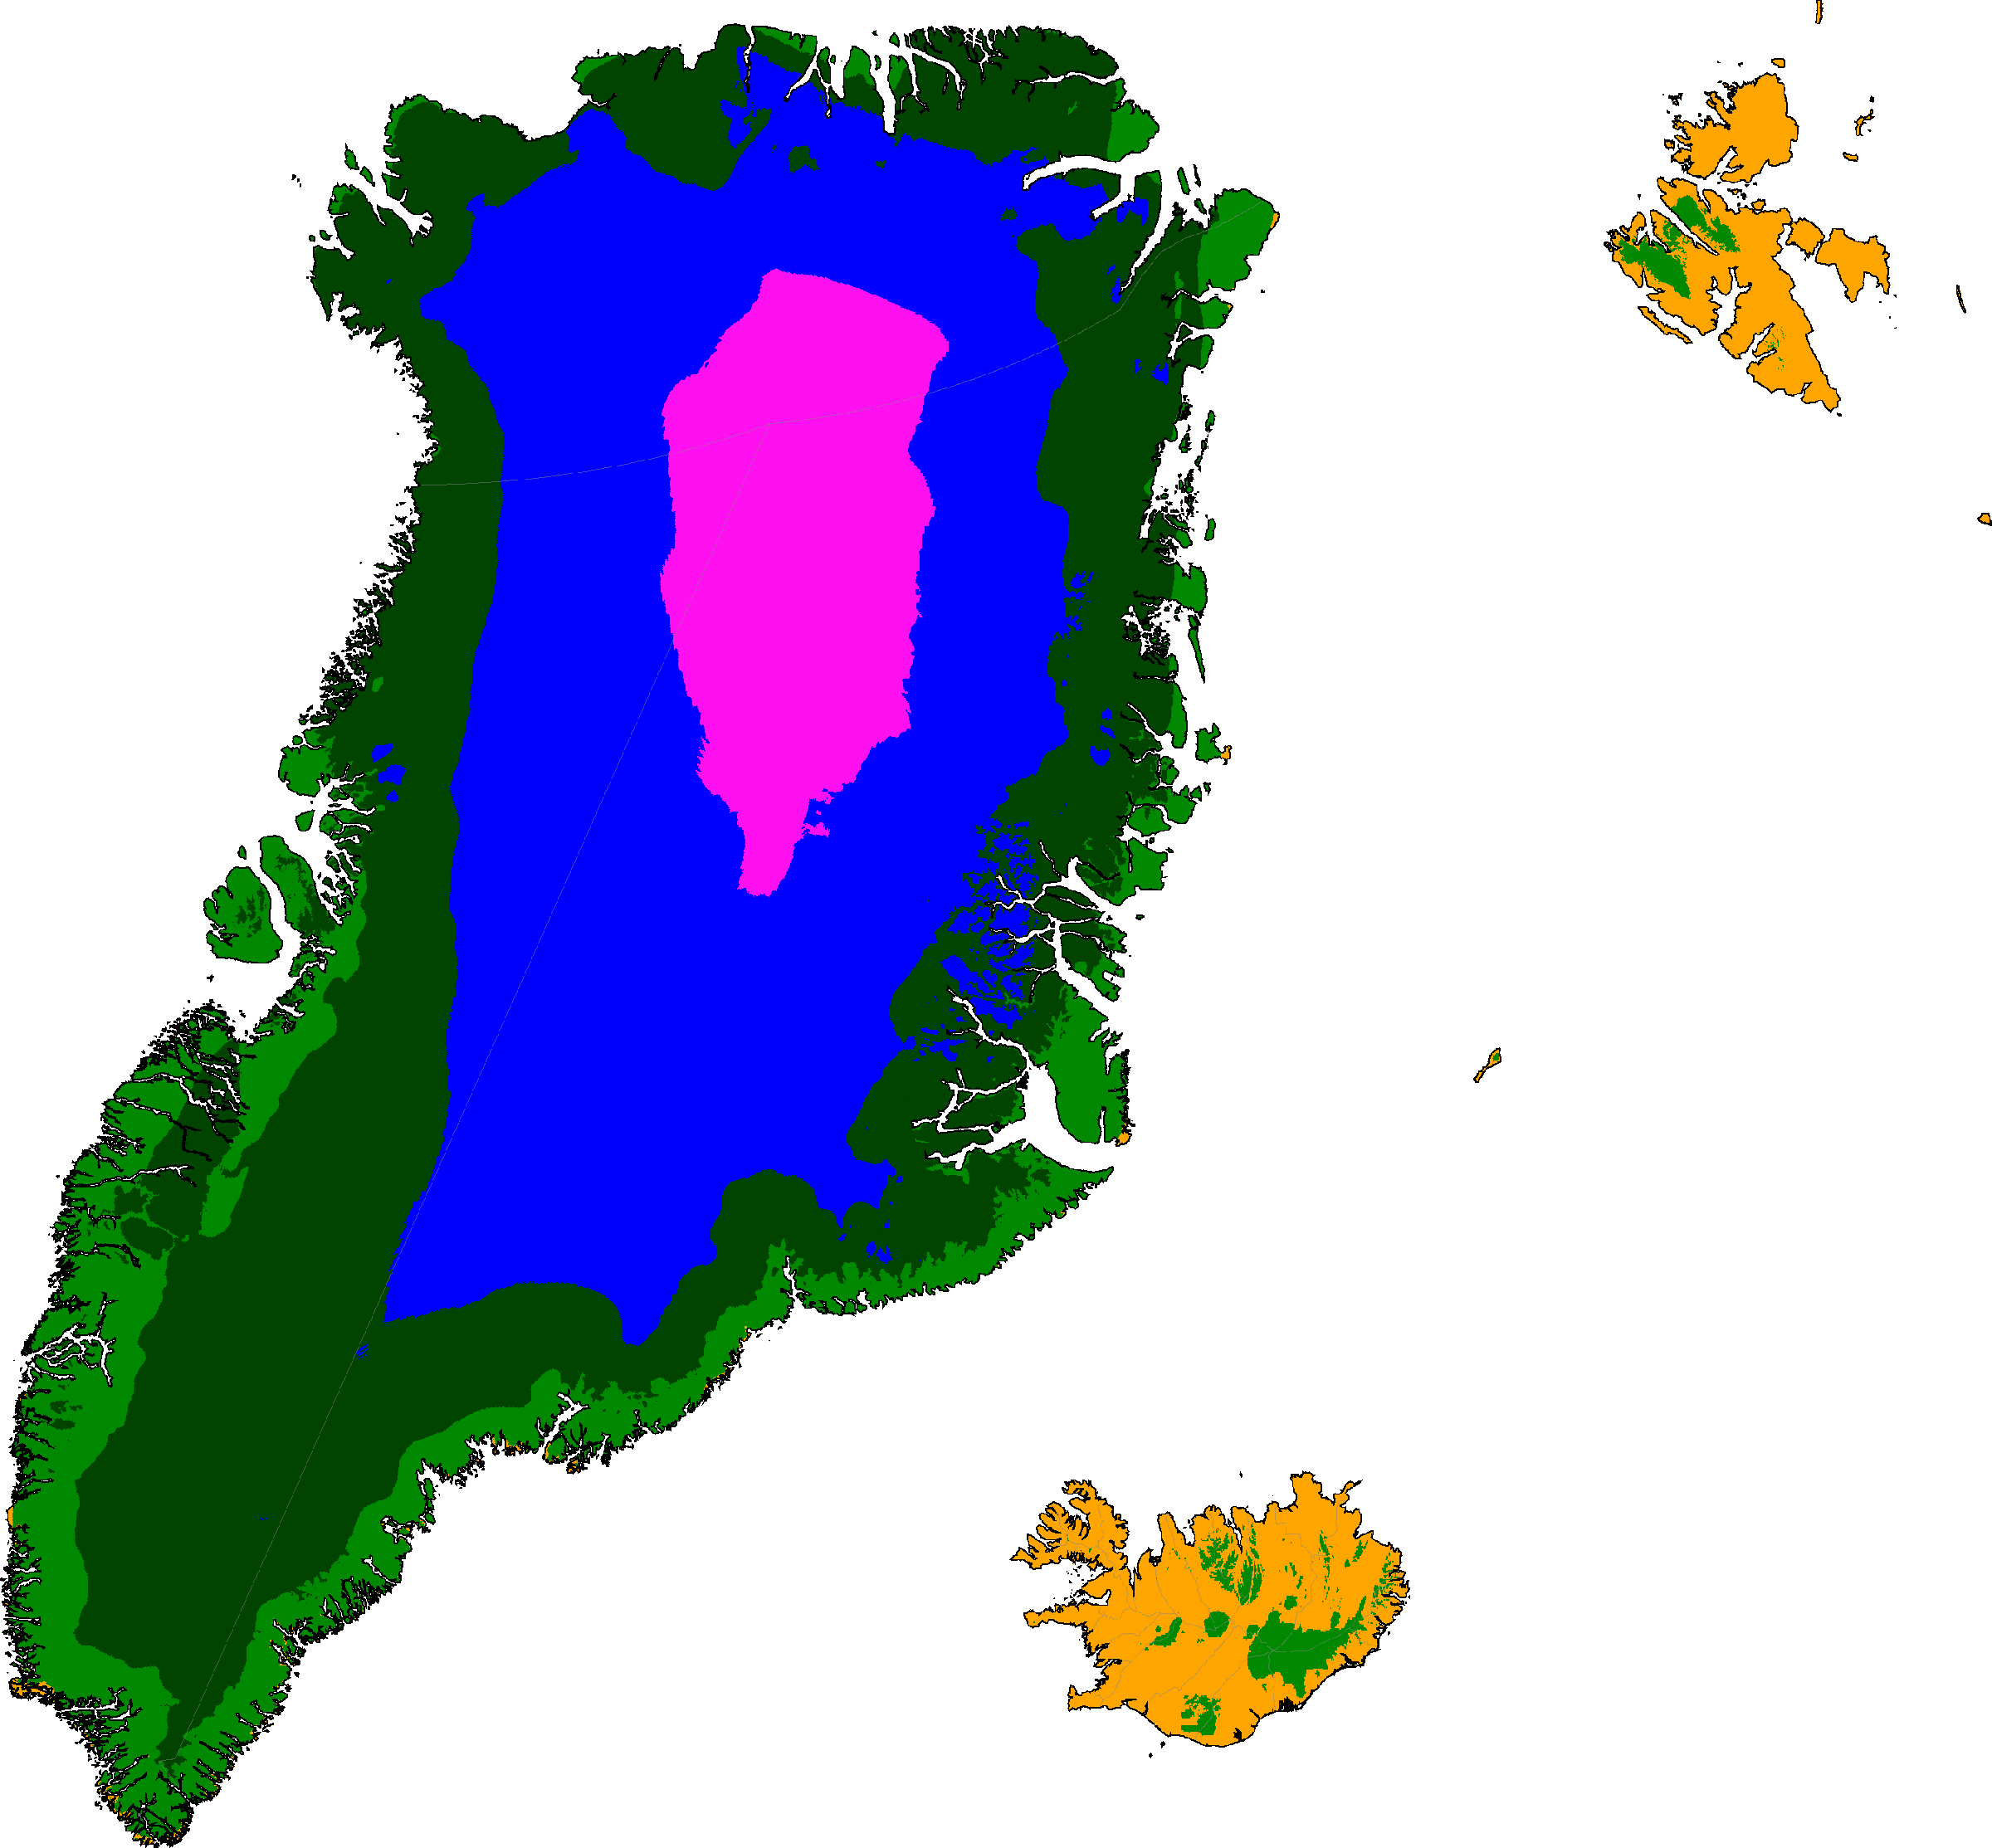
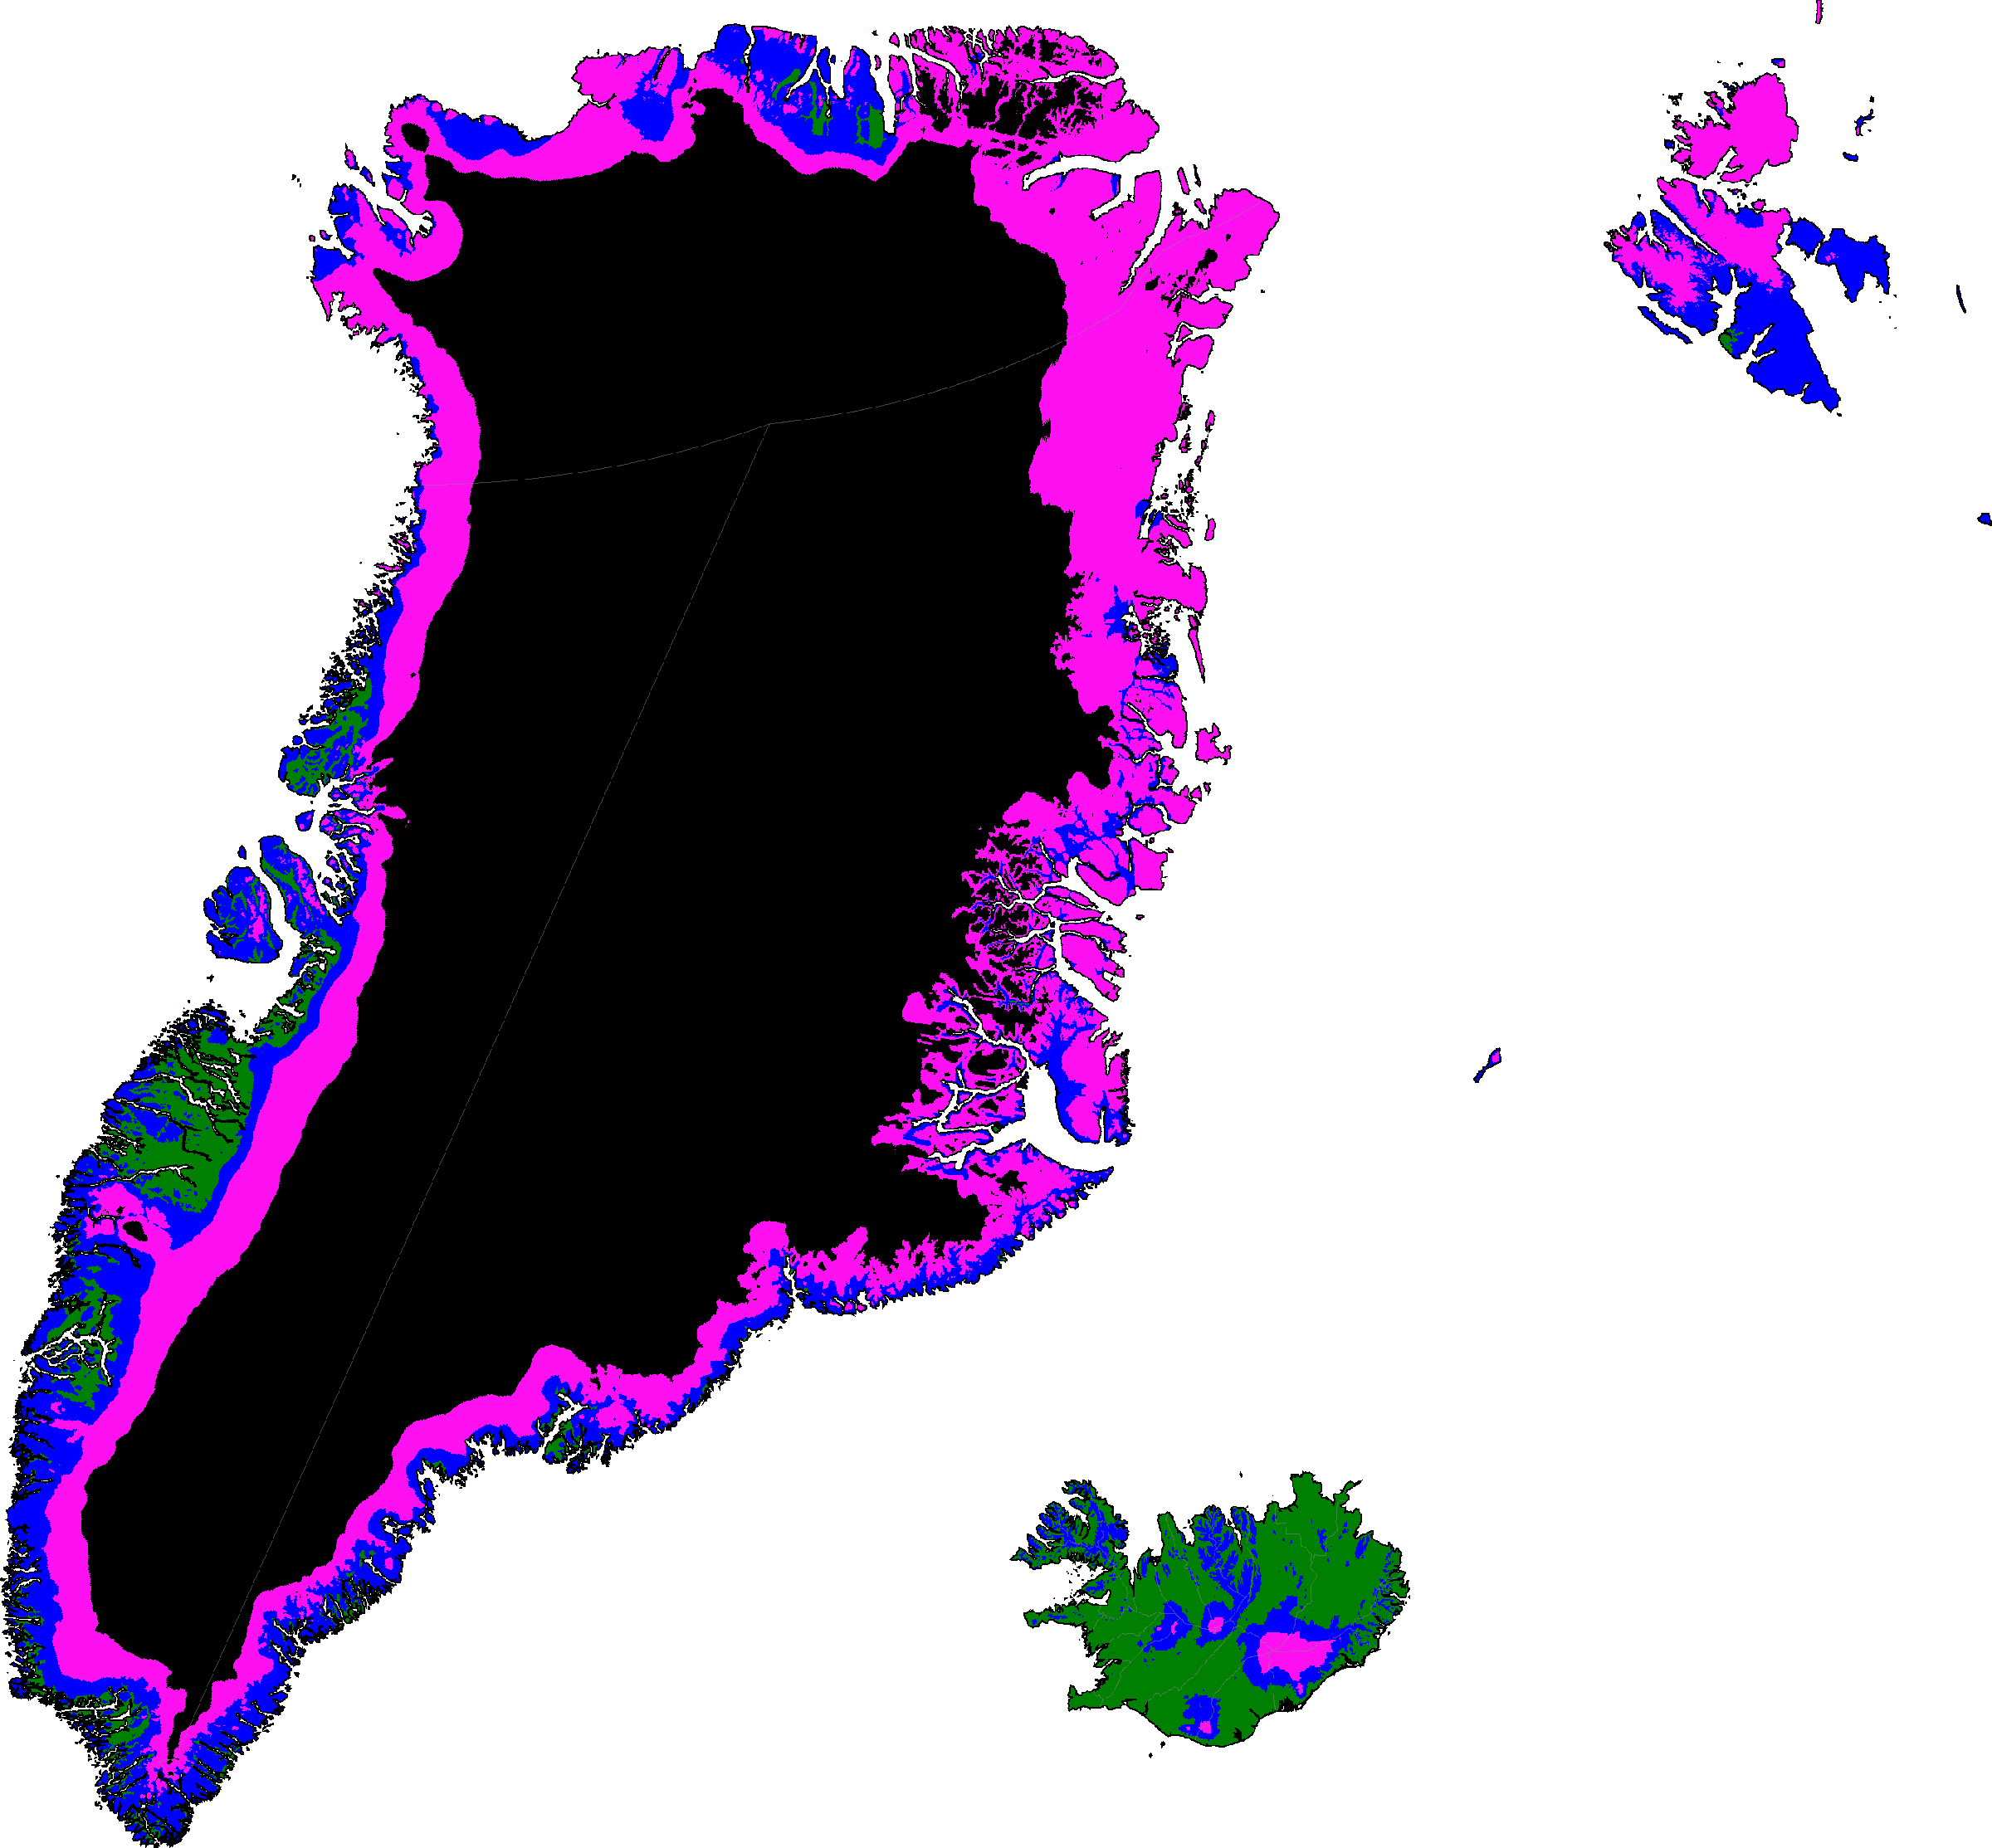
Greenland and Iceland distribution of winter categories (projections are SSP5-8.5 high emissions normals)
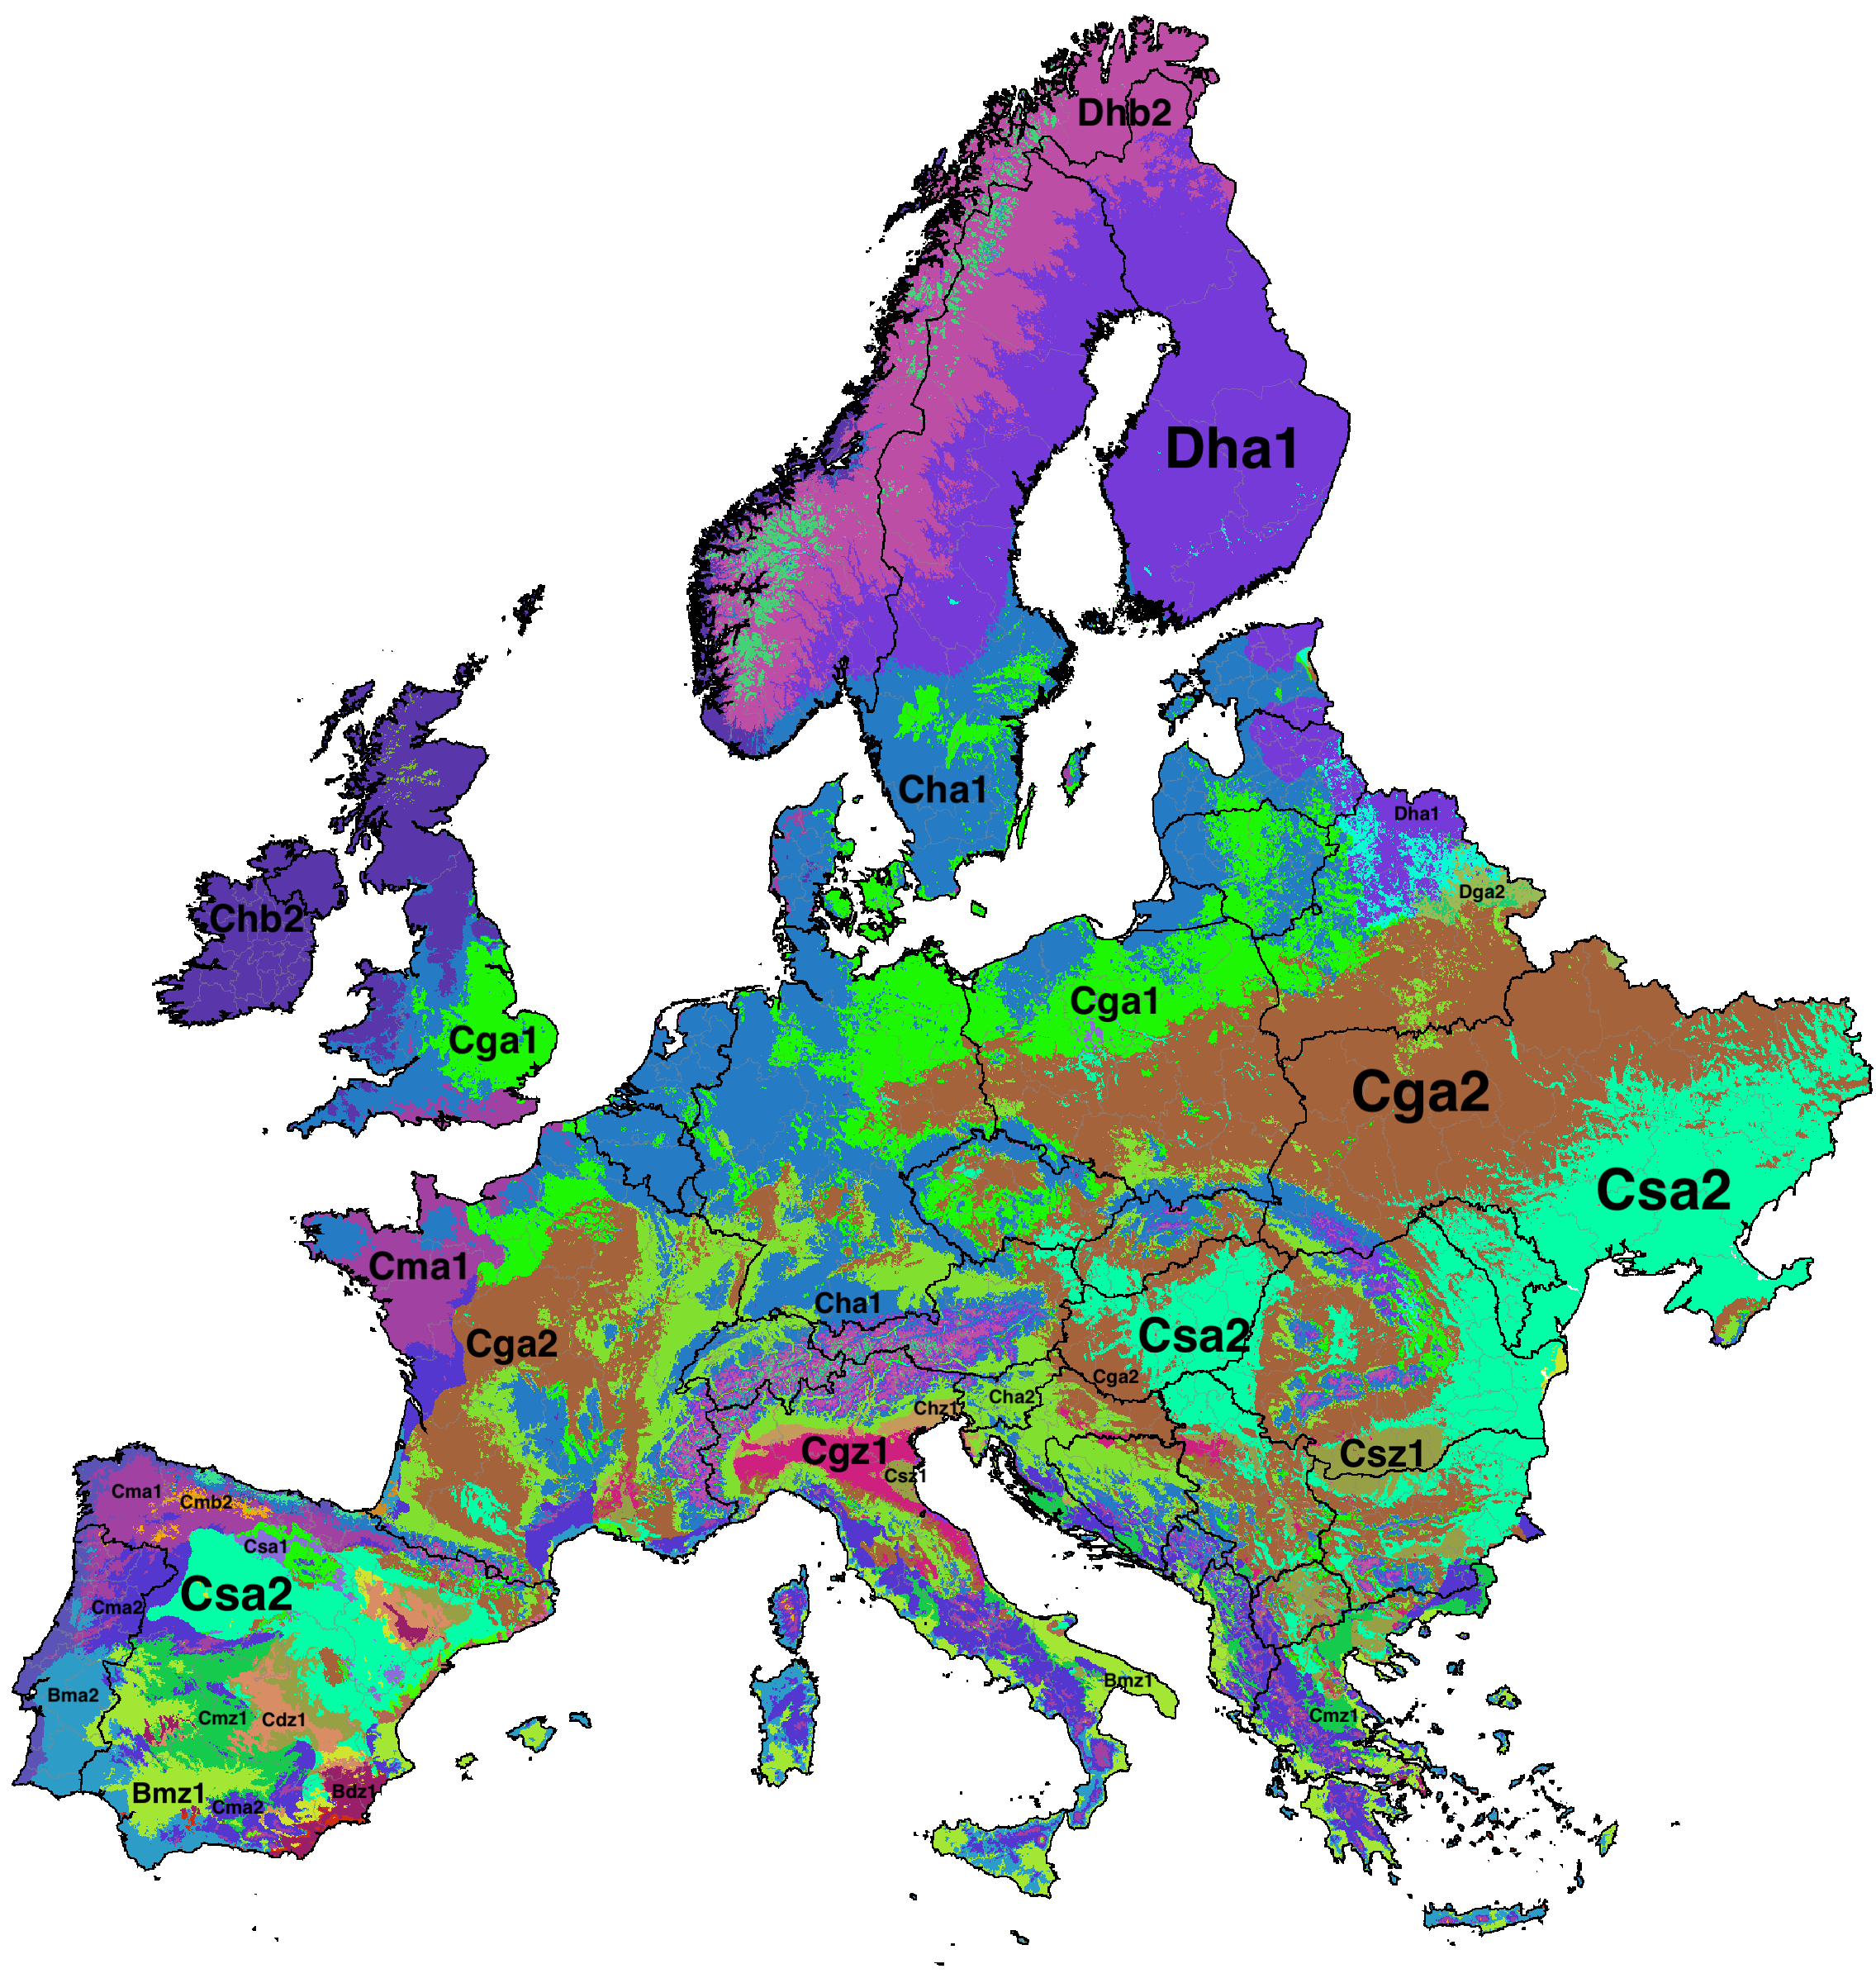
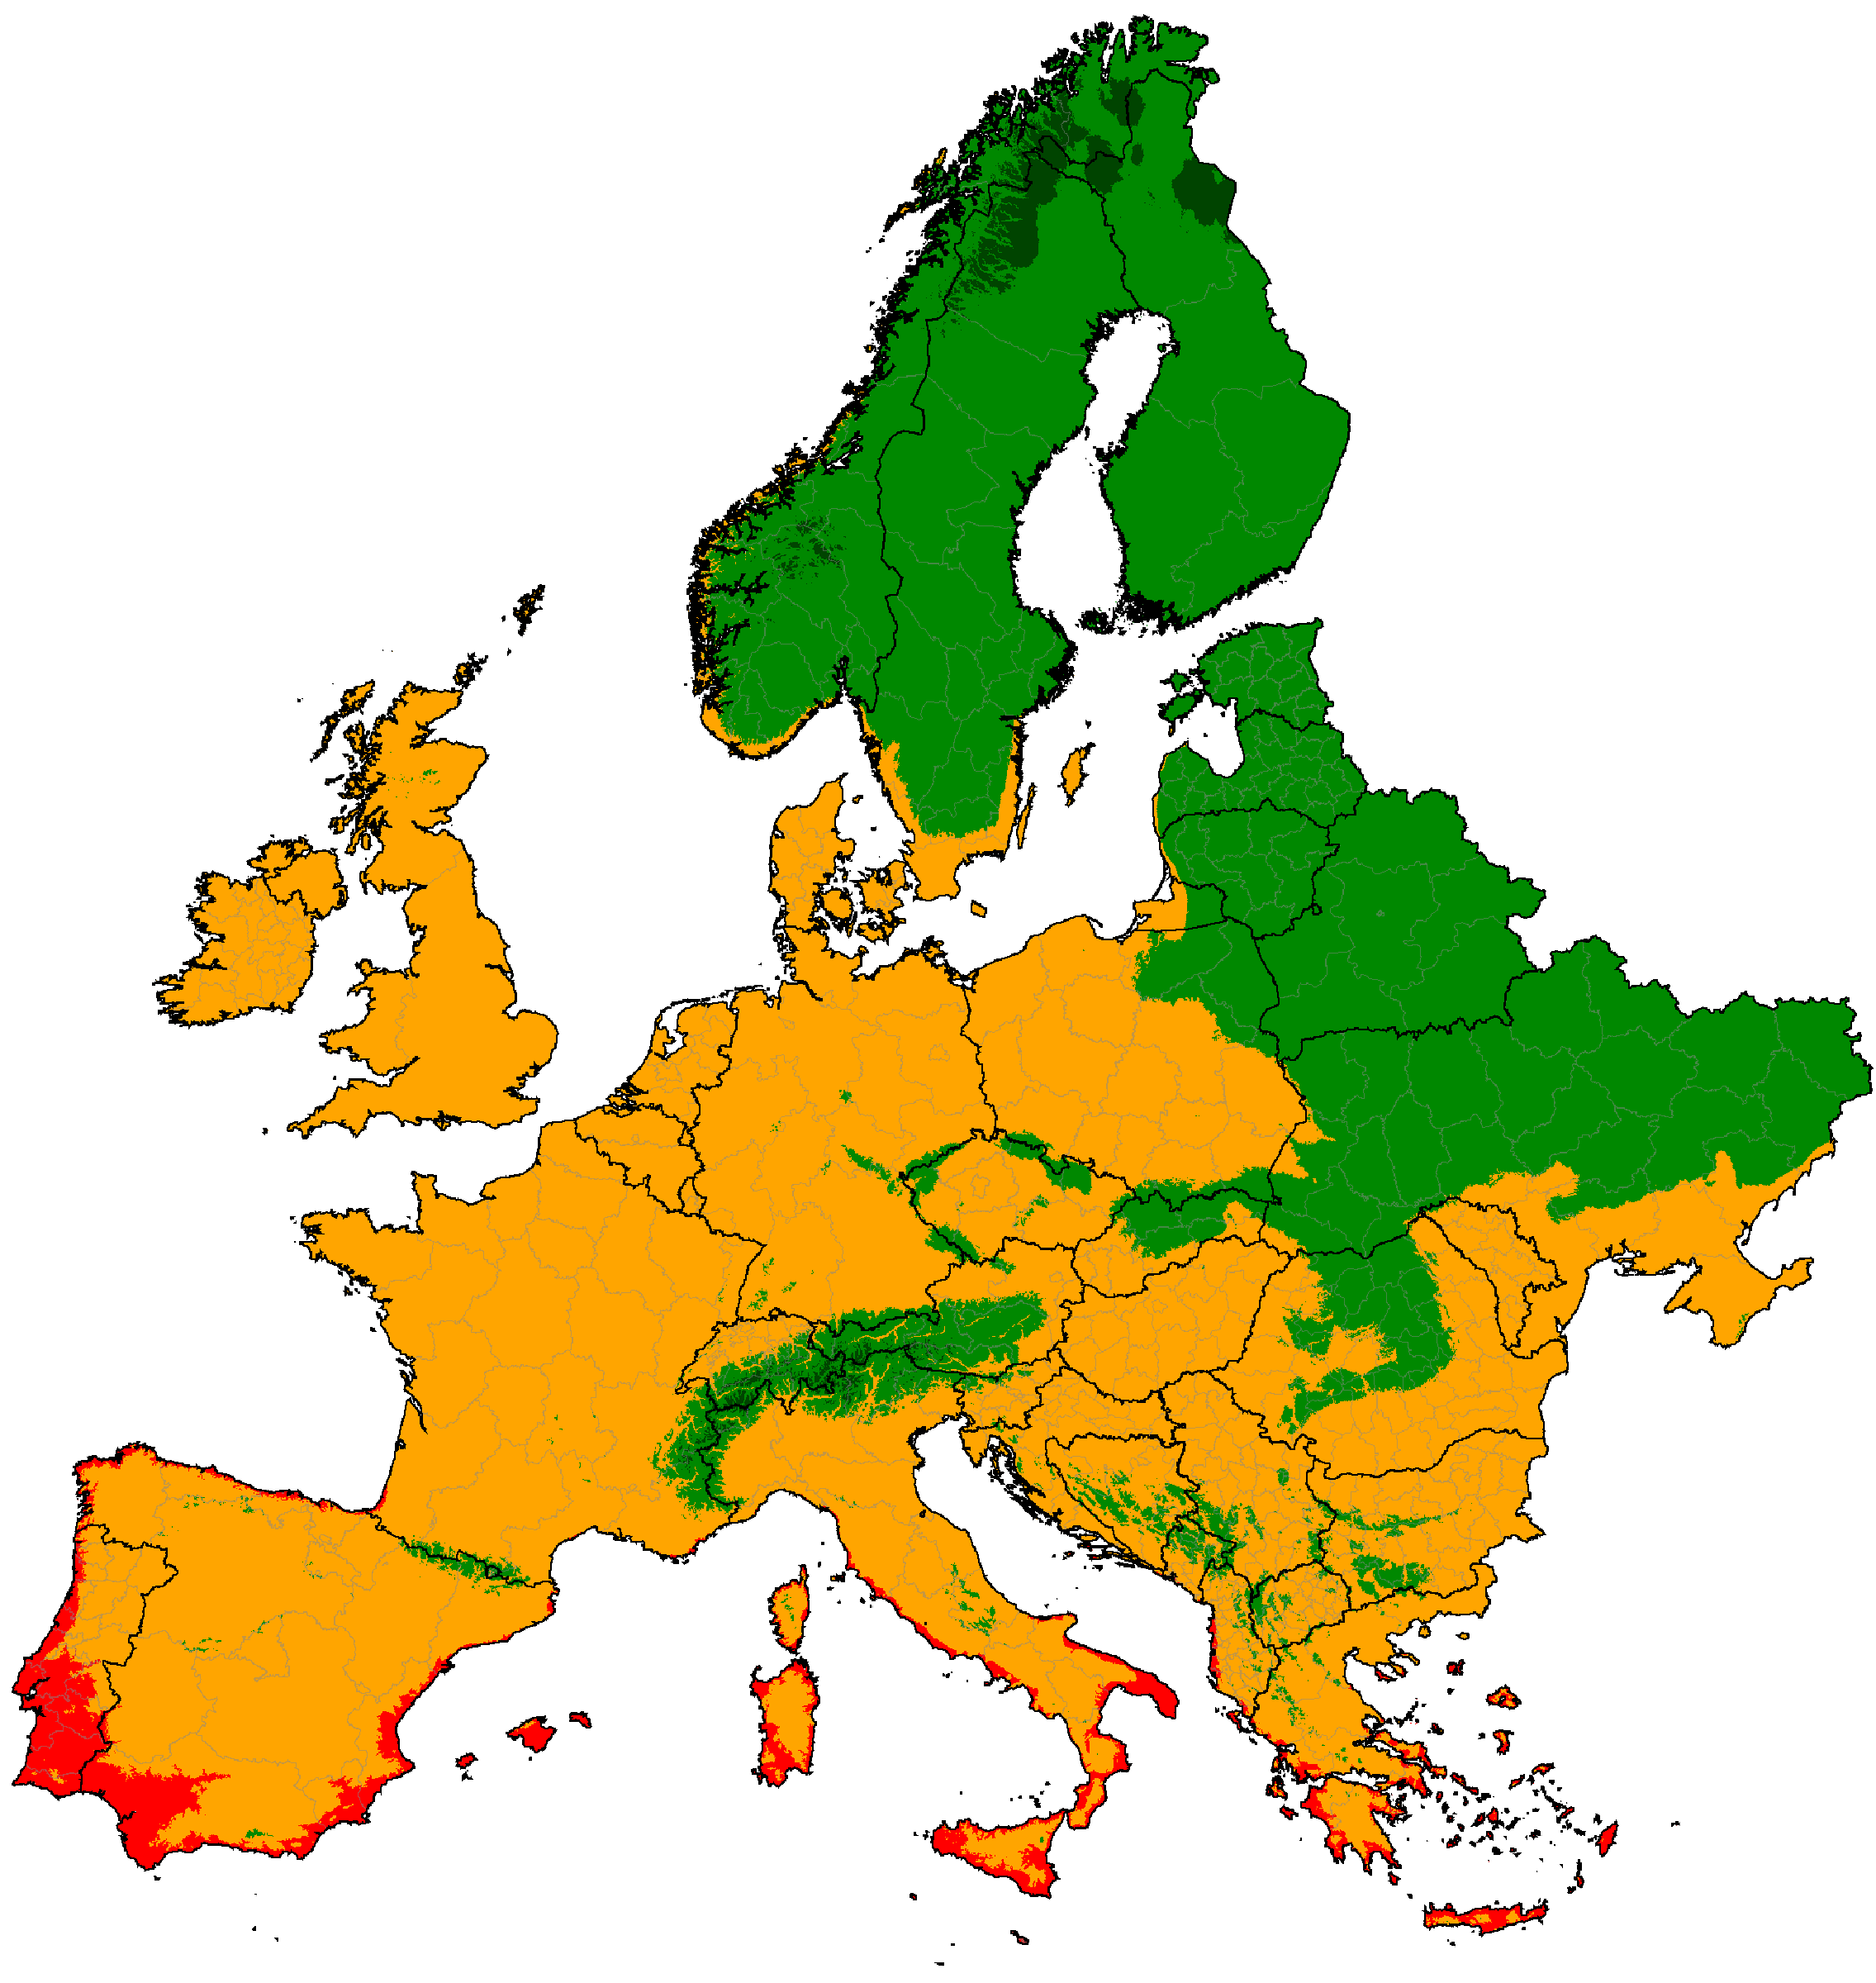
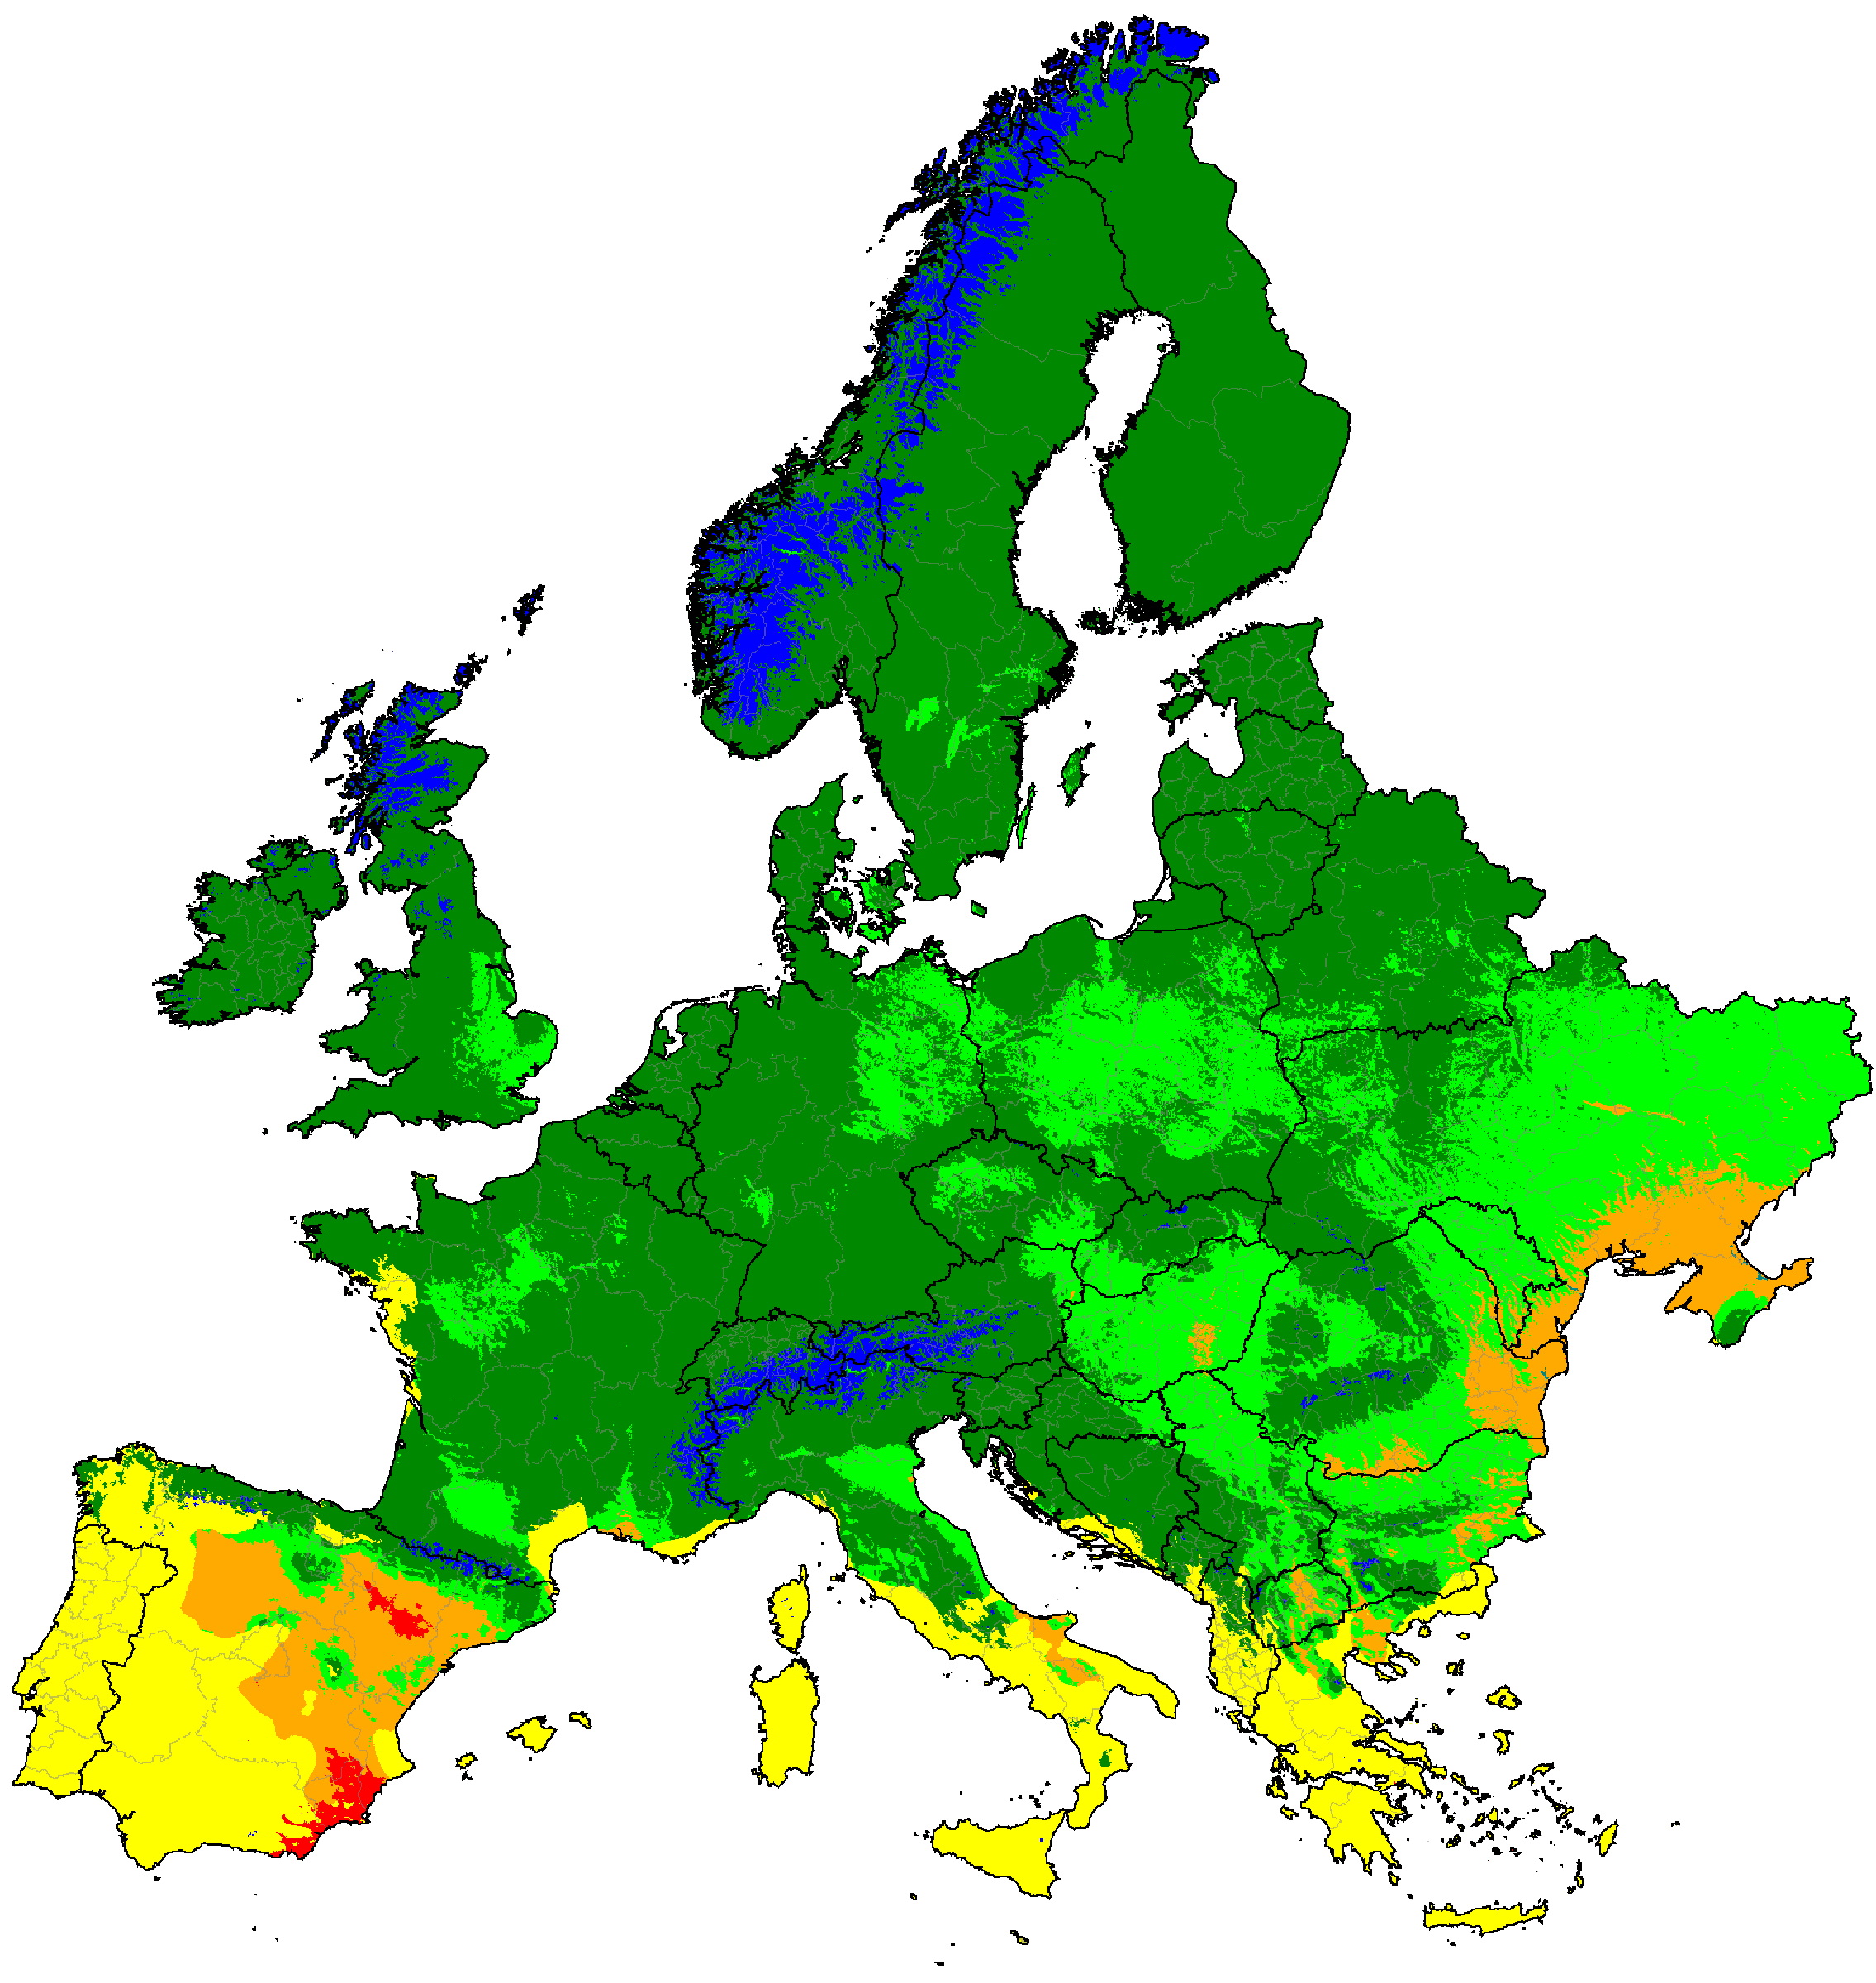
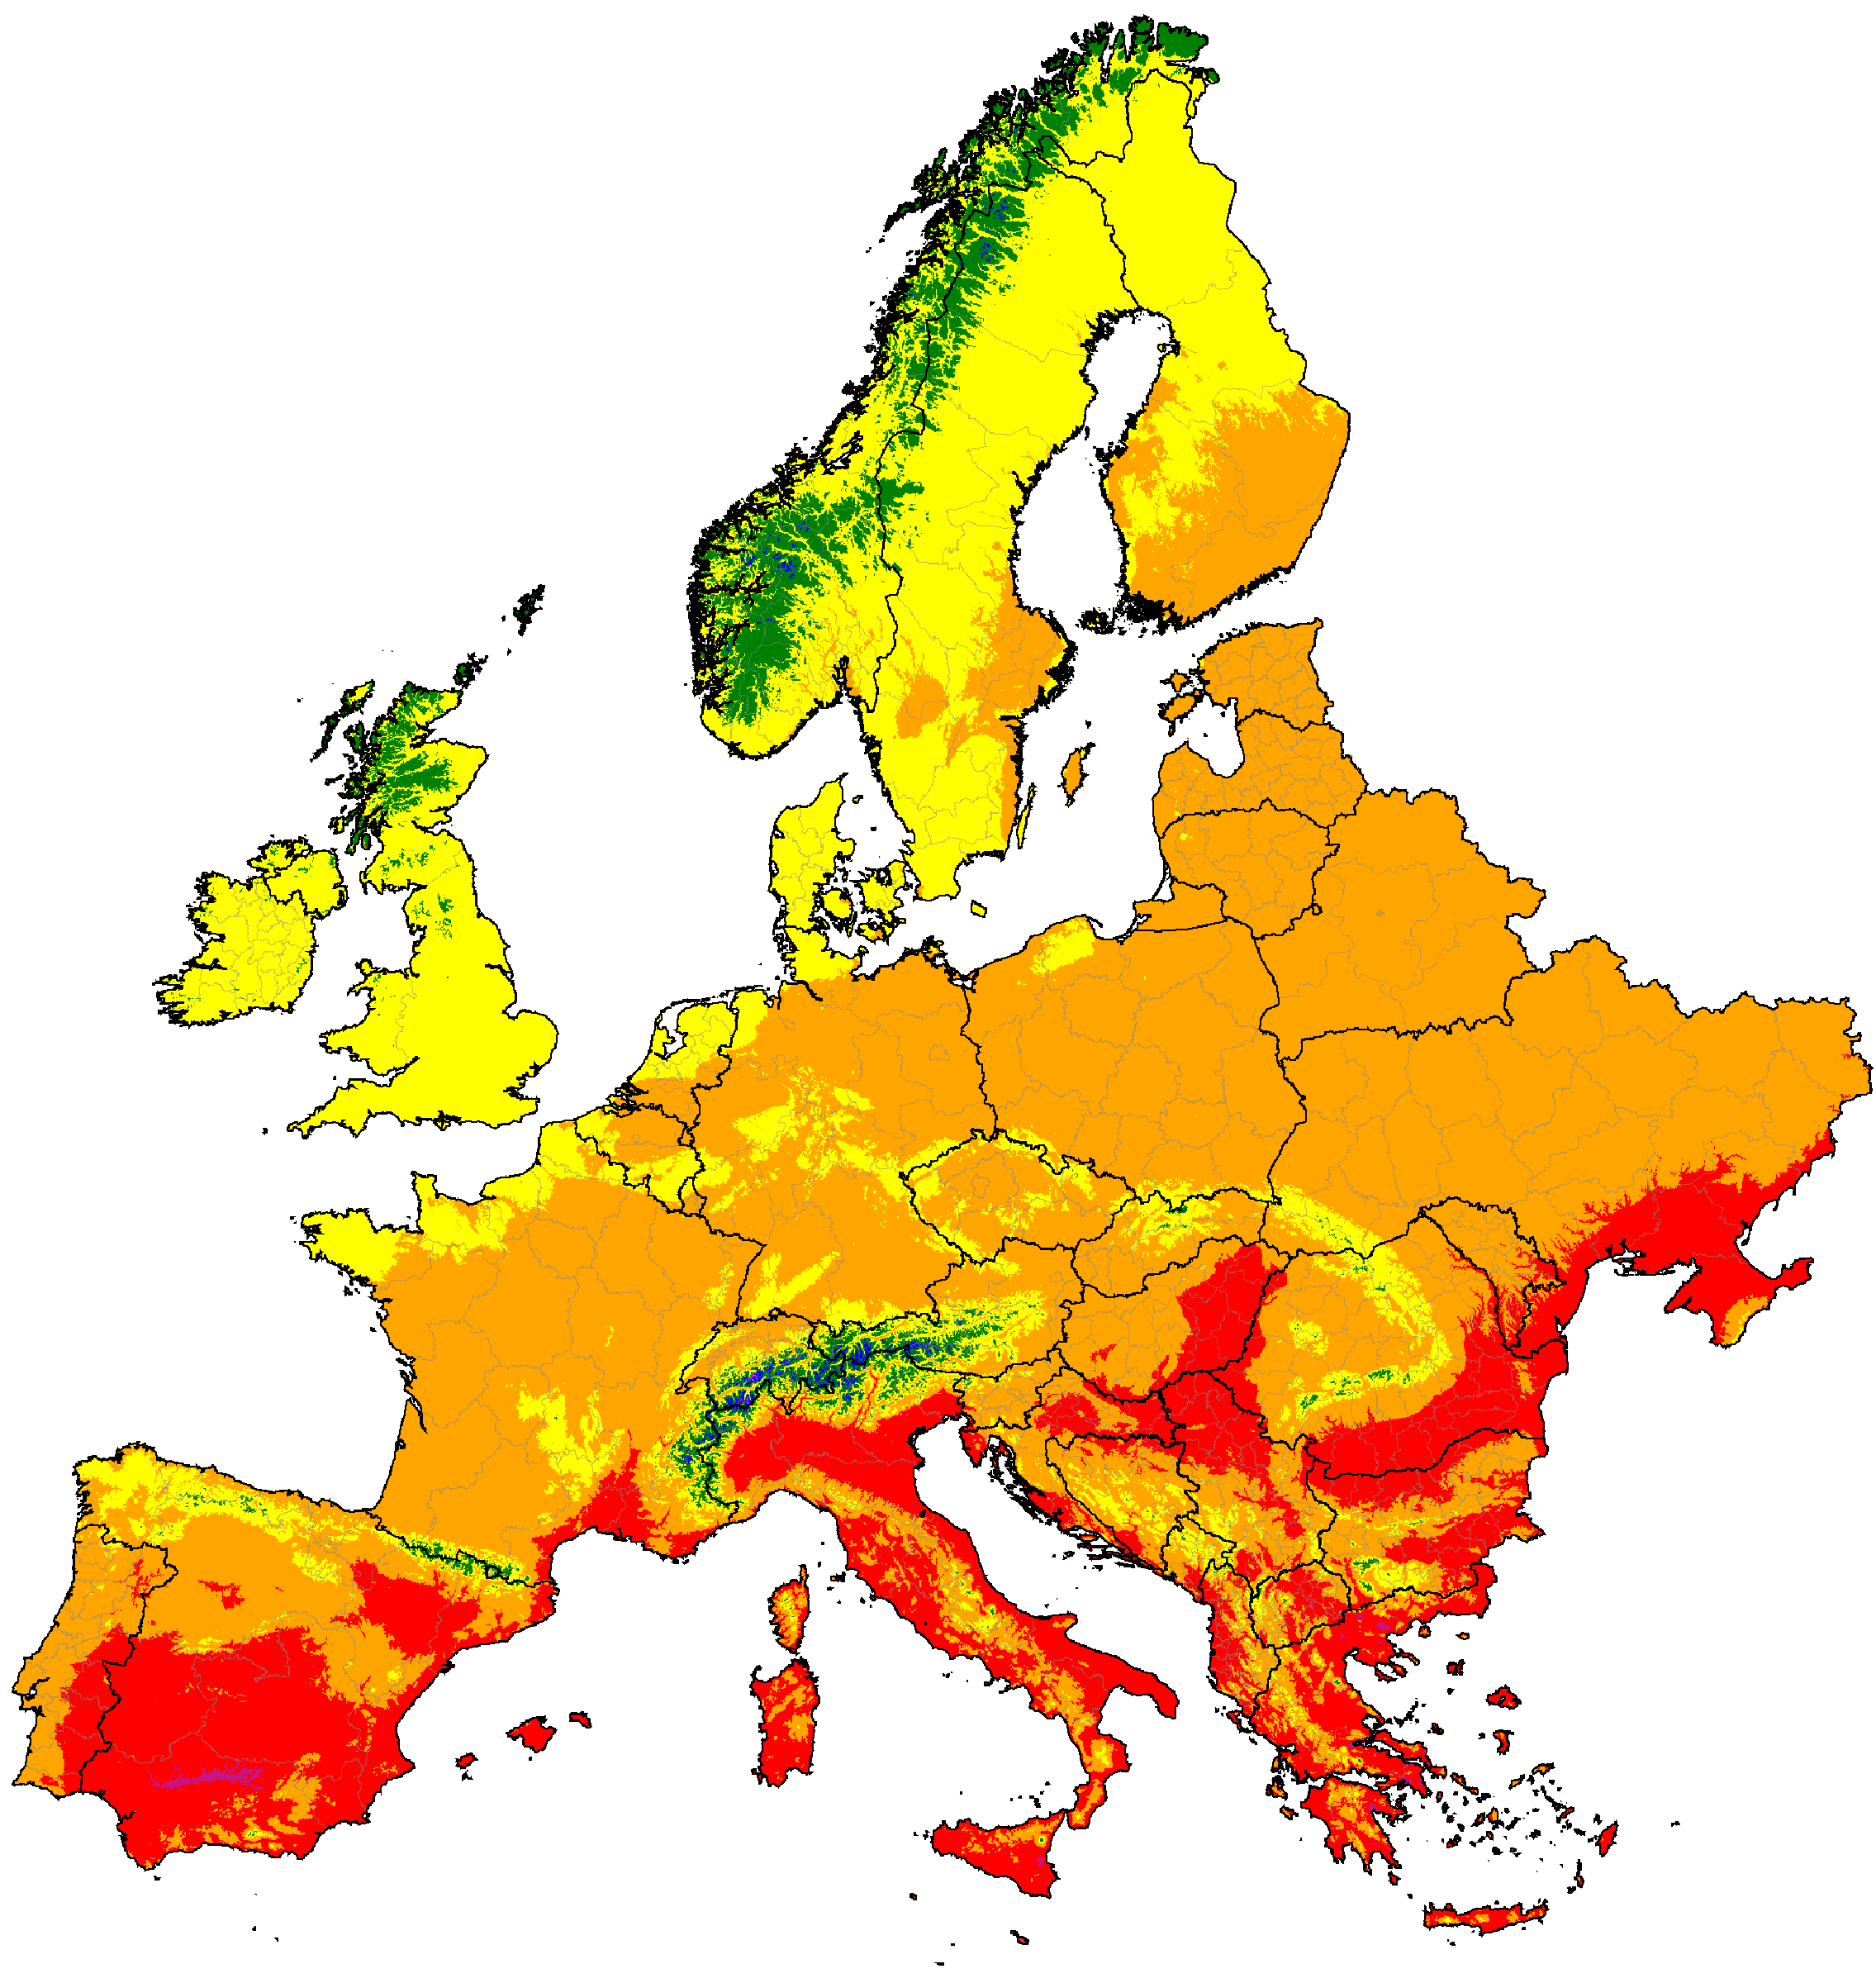
Europe distribution of winter categories (projections are SSP5-8.5 high emissions normals)
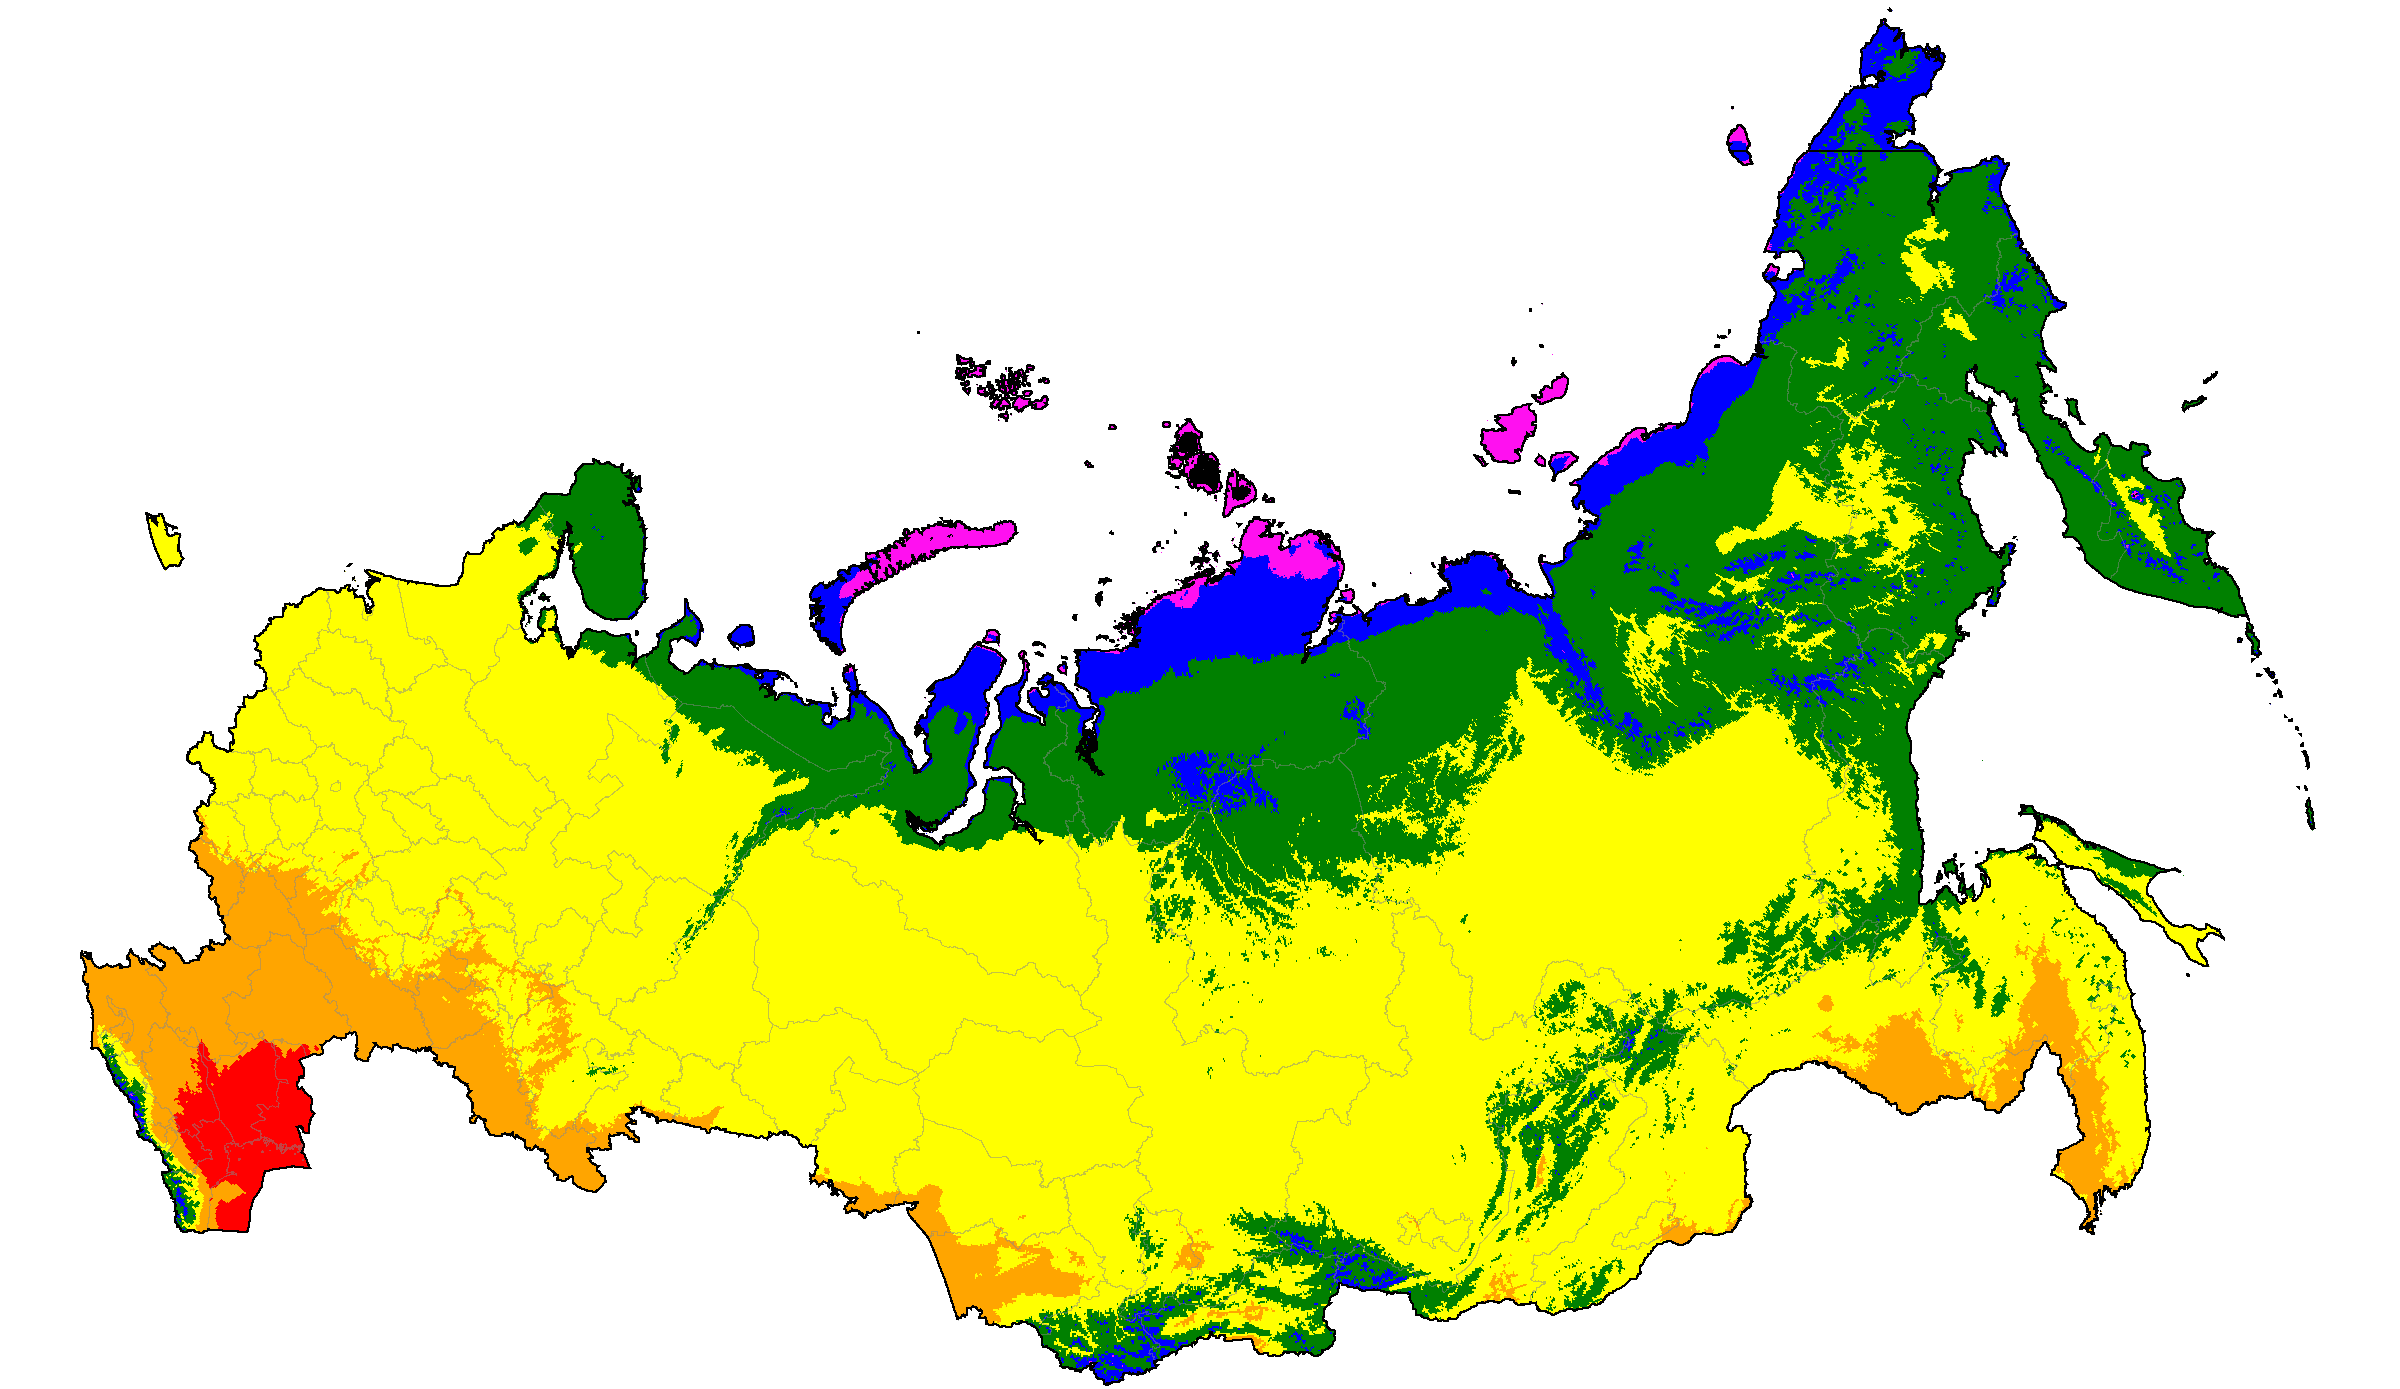
Russia distribution of winter categories (projections are SSP5-8.5 high emissions normals)
Note: The line visible in eastern Russia is a cartographic artifact of the International Date Line (180° meridian), not a political boundary.
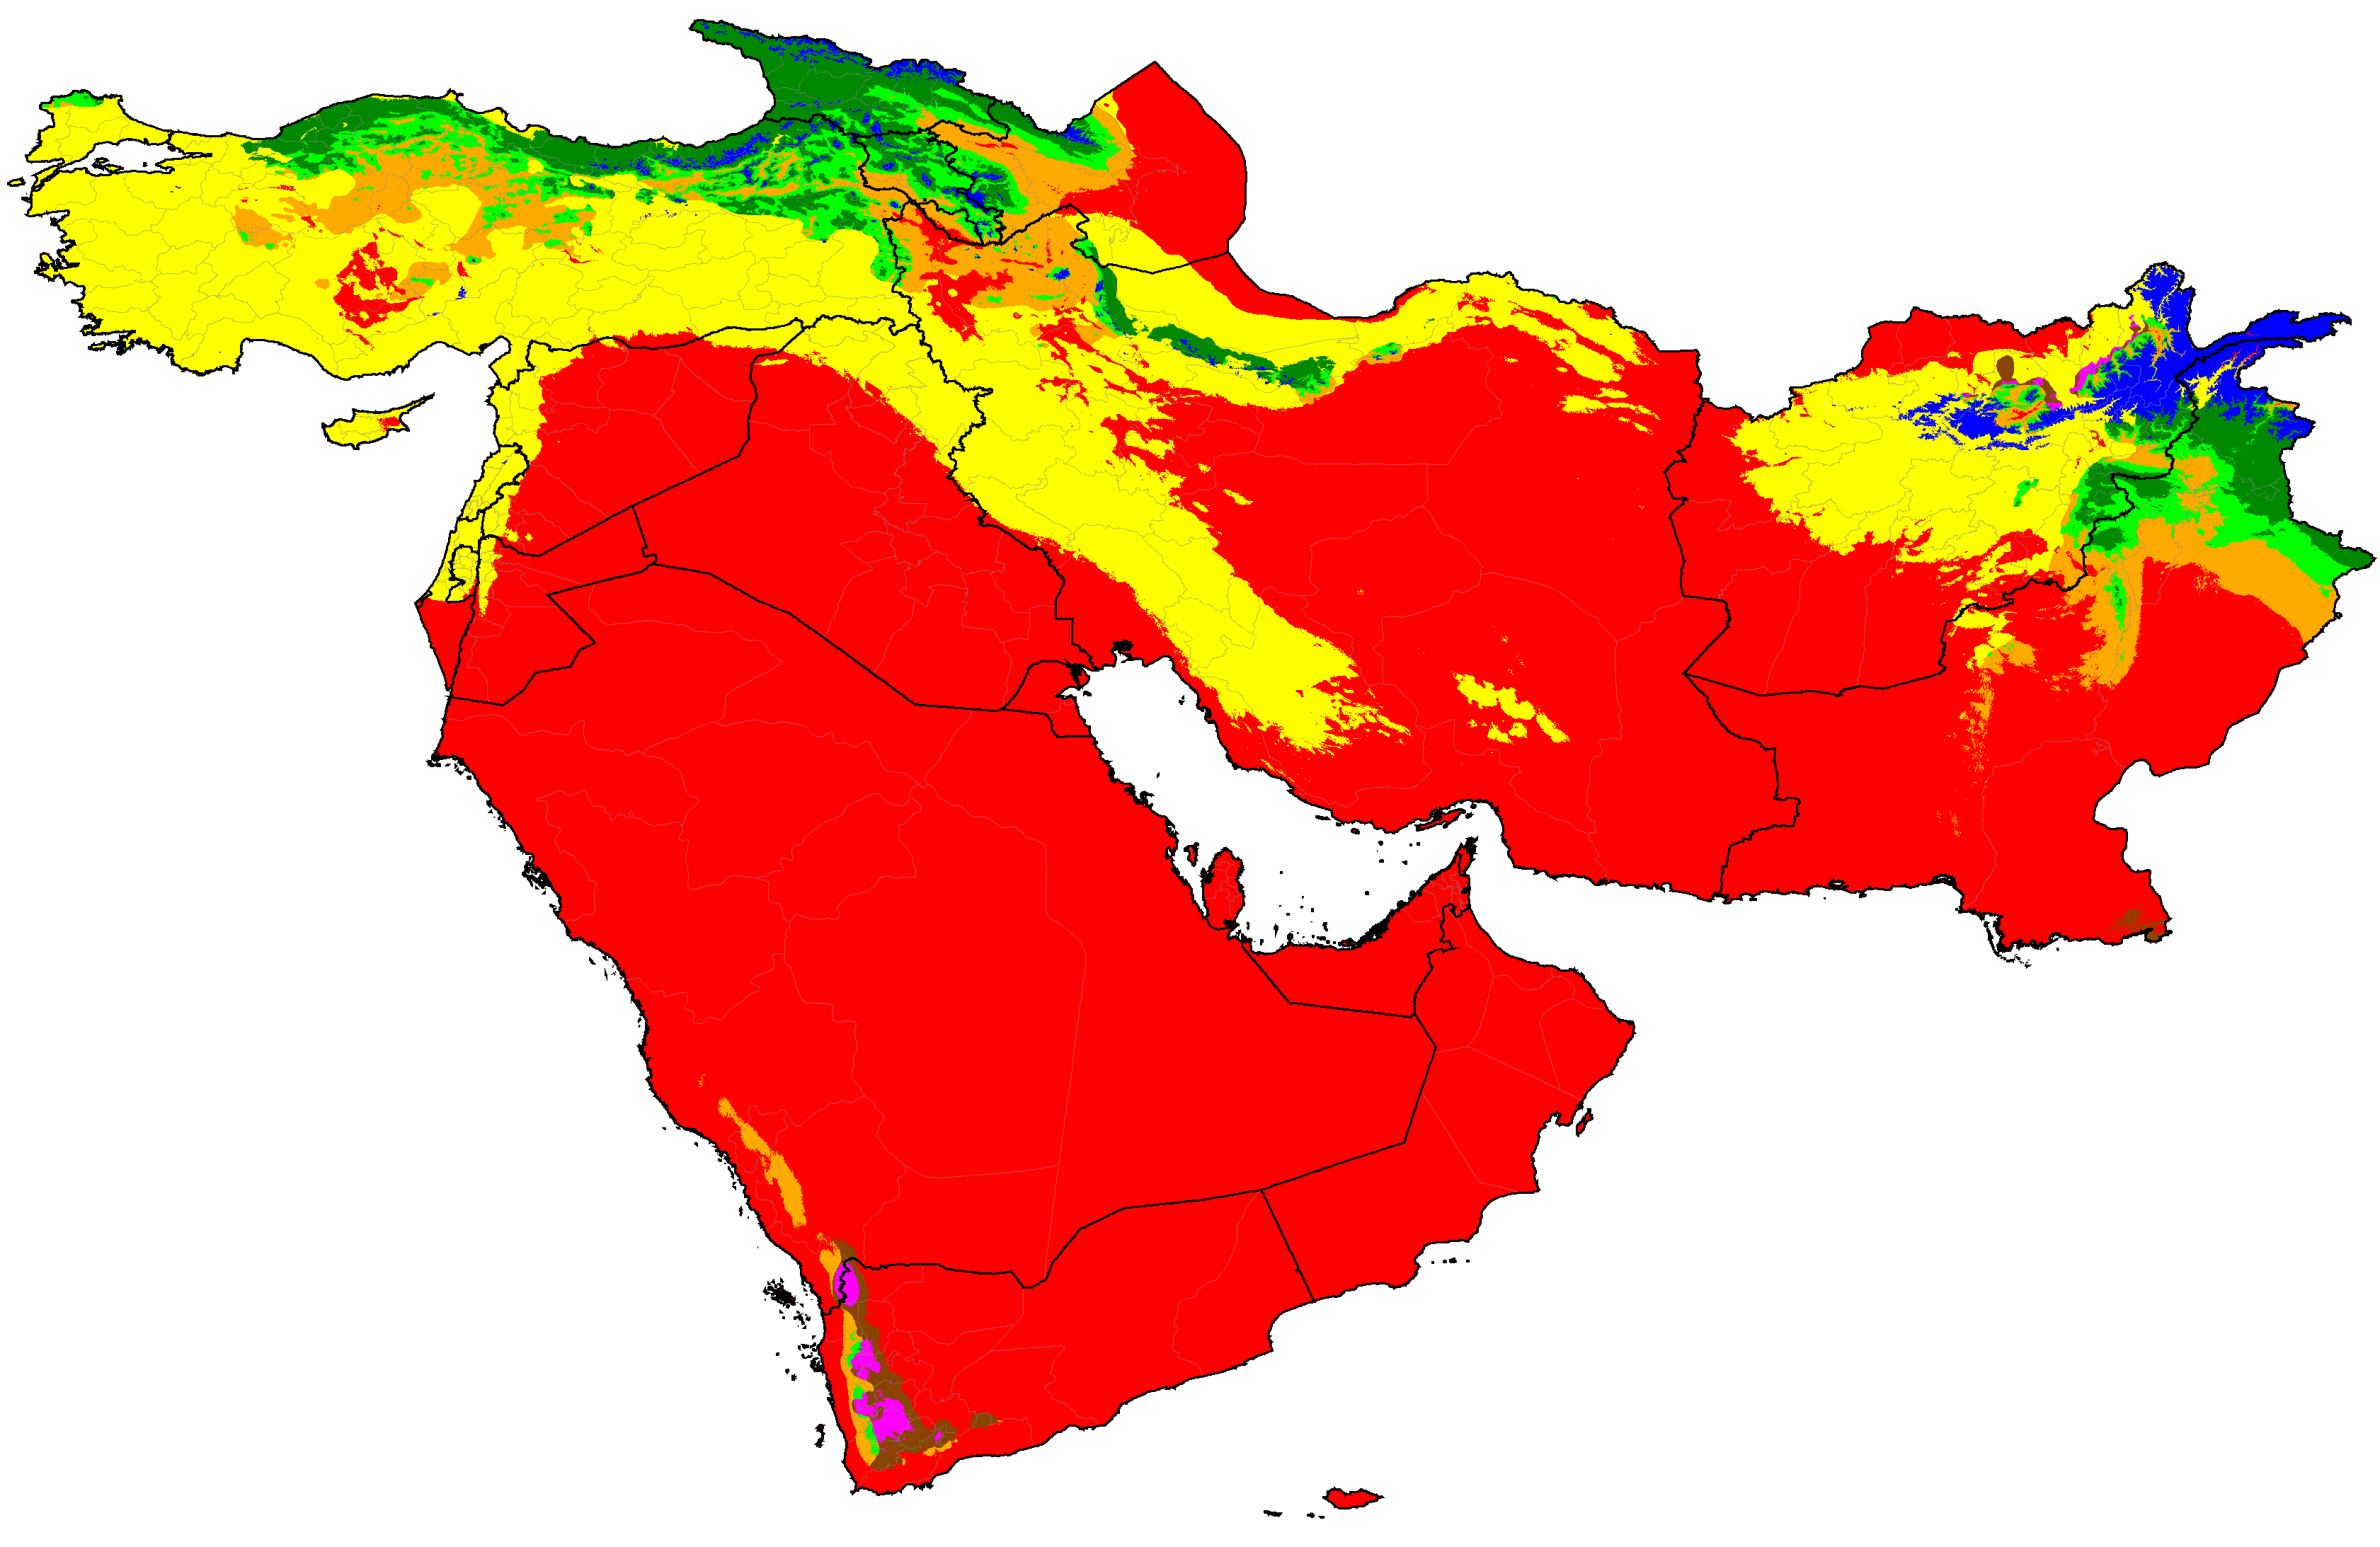
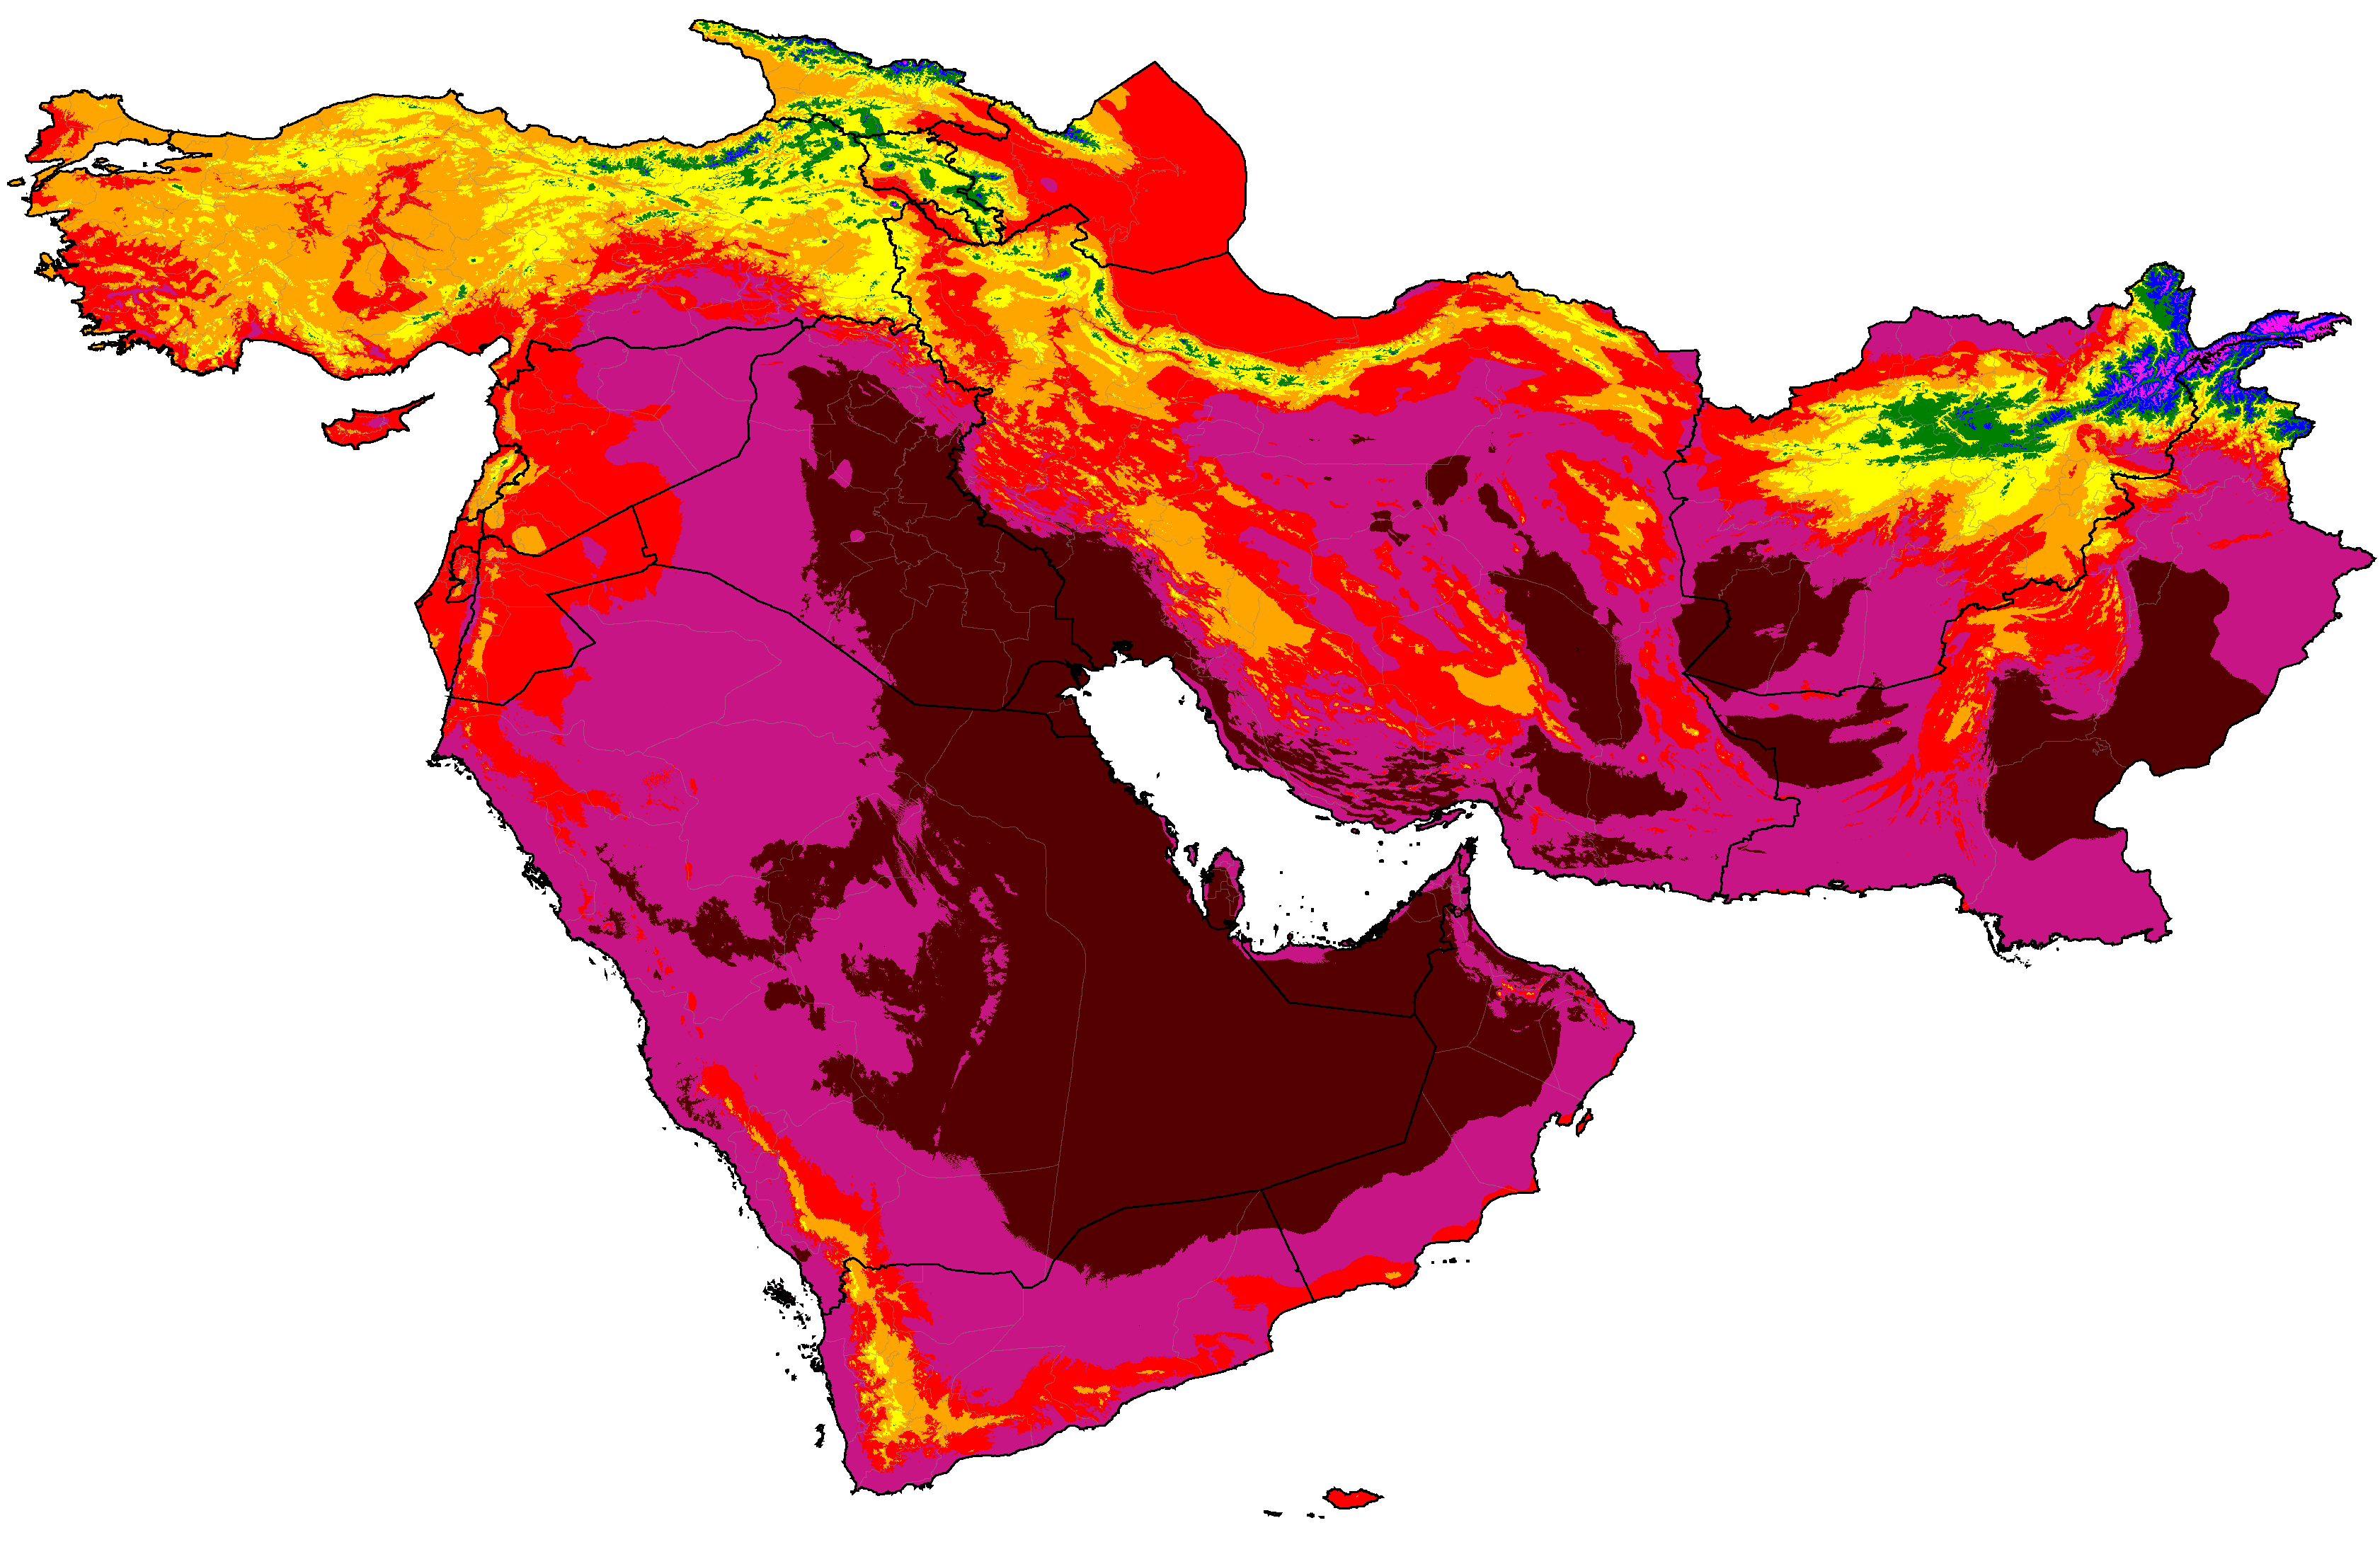
West Asia distribution of winter categories (projections are SSP5-8.5 high emissions normals)
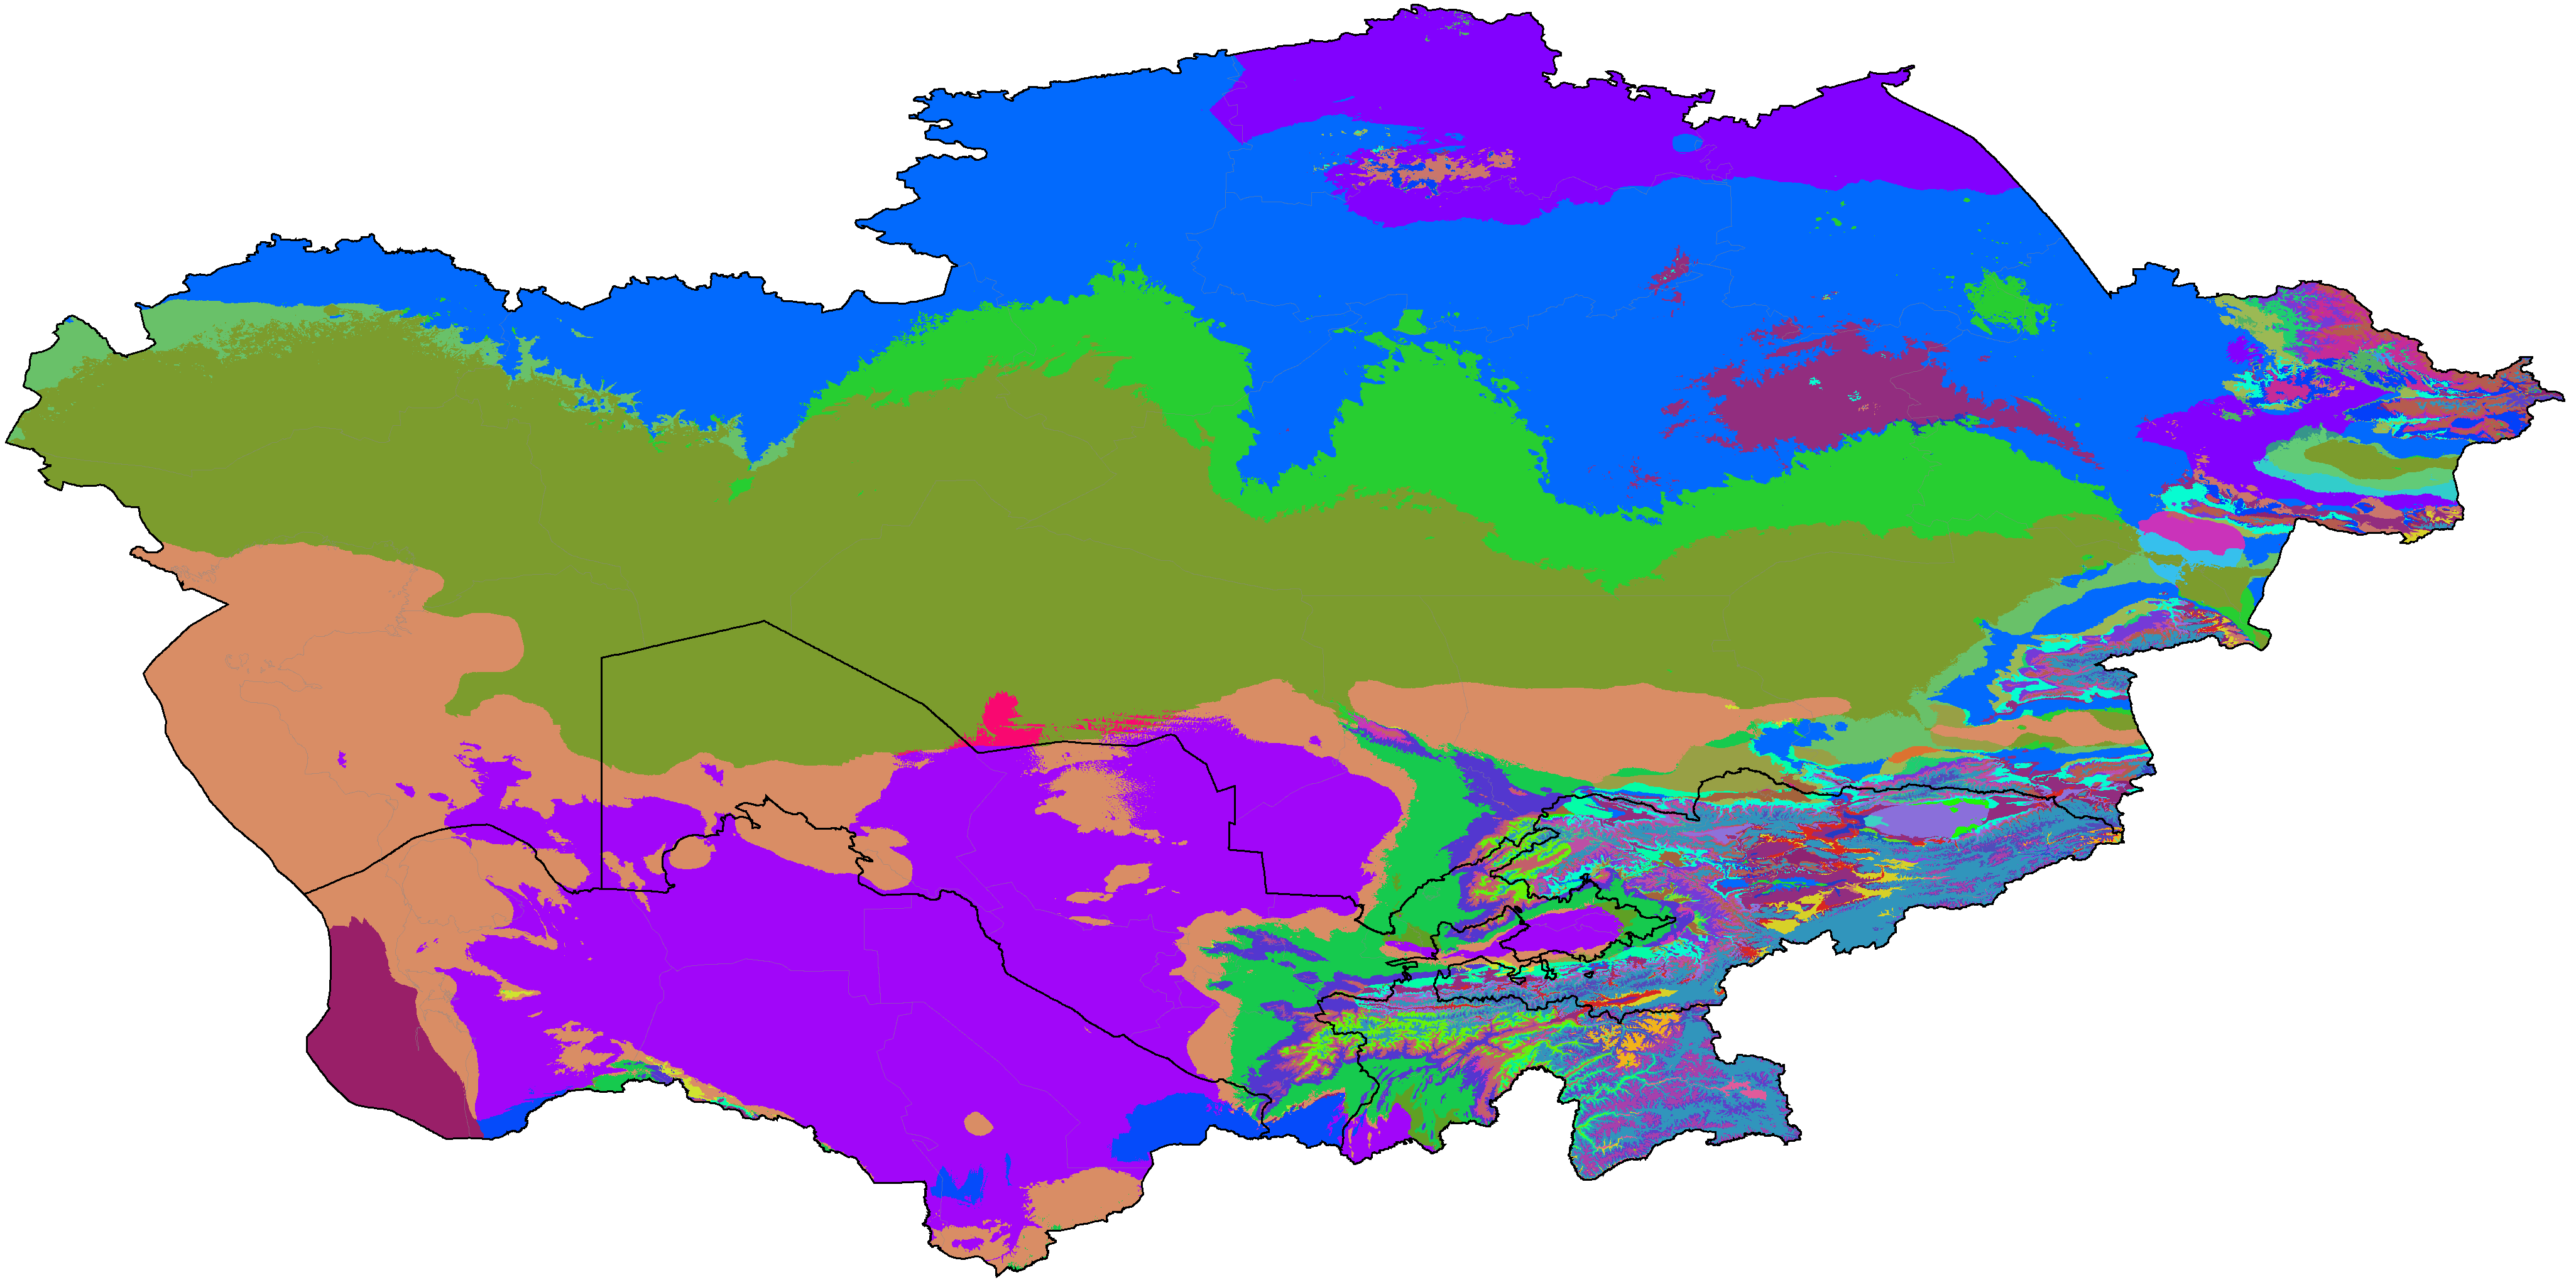
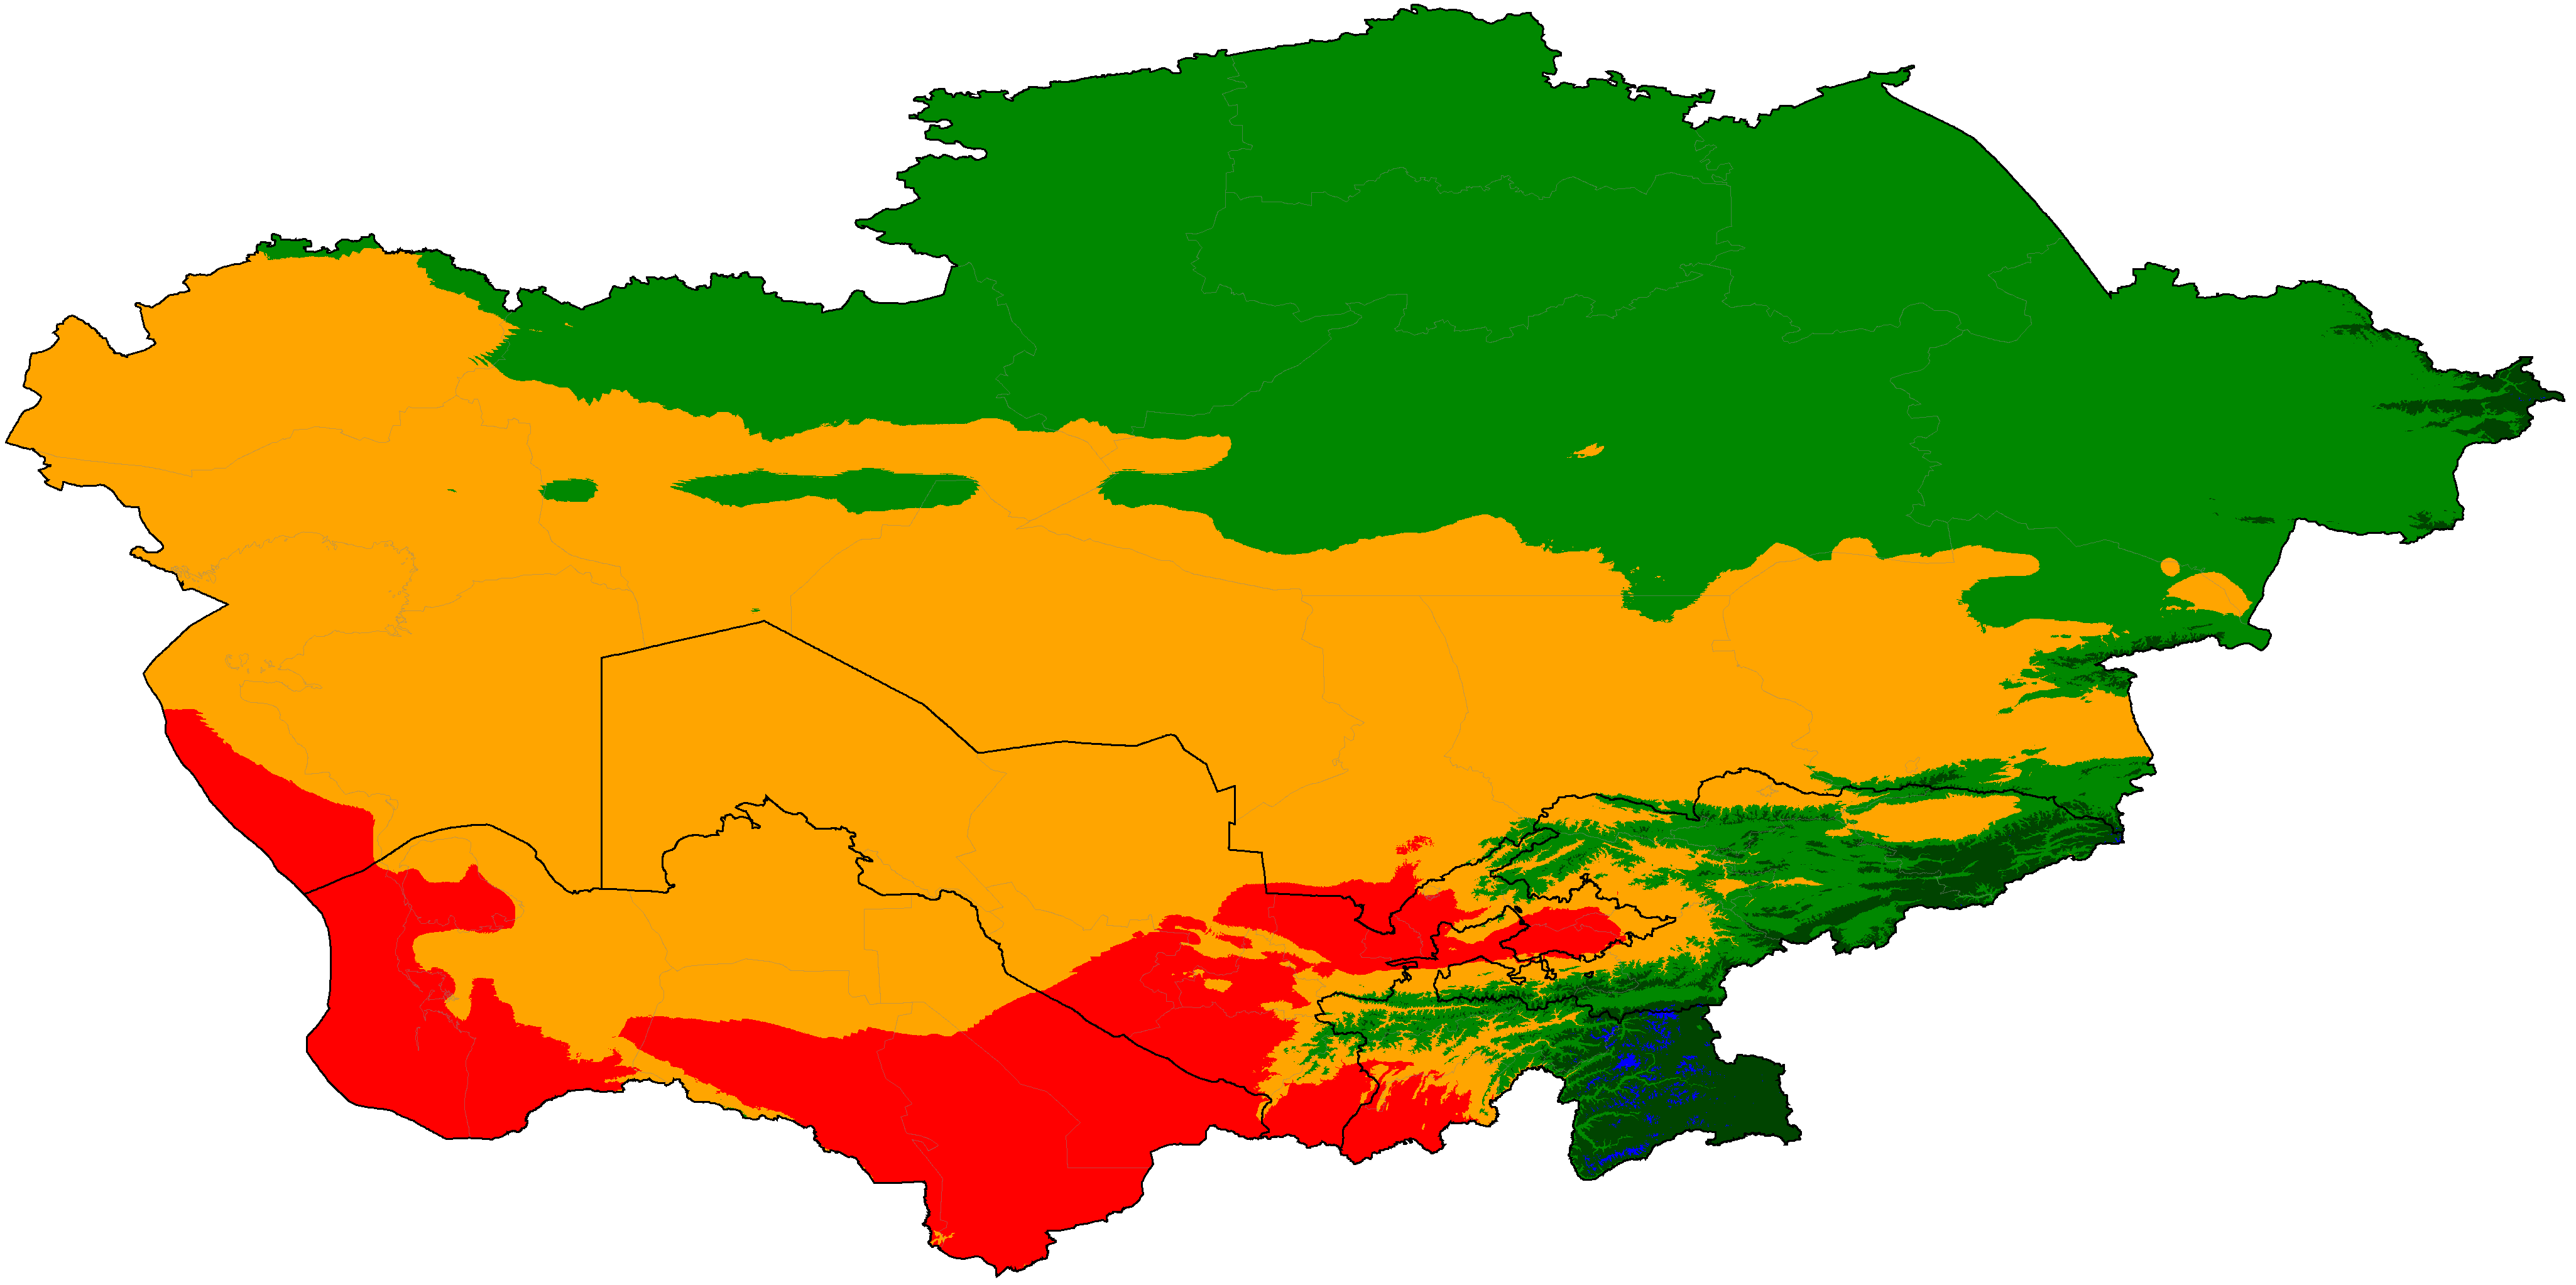
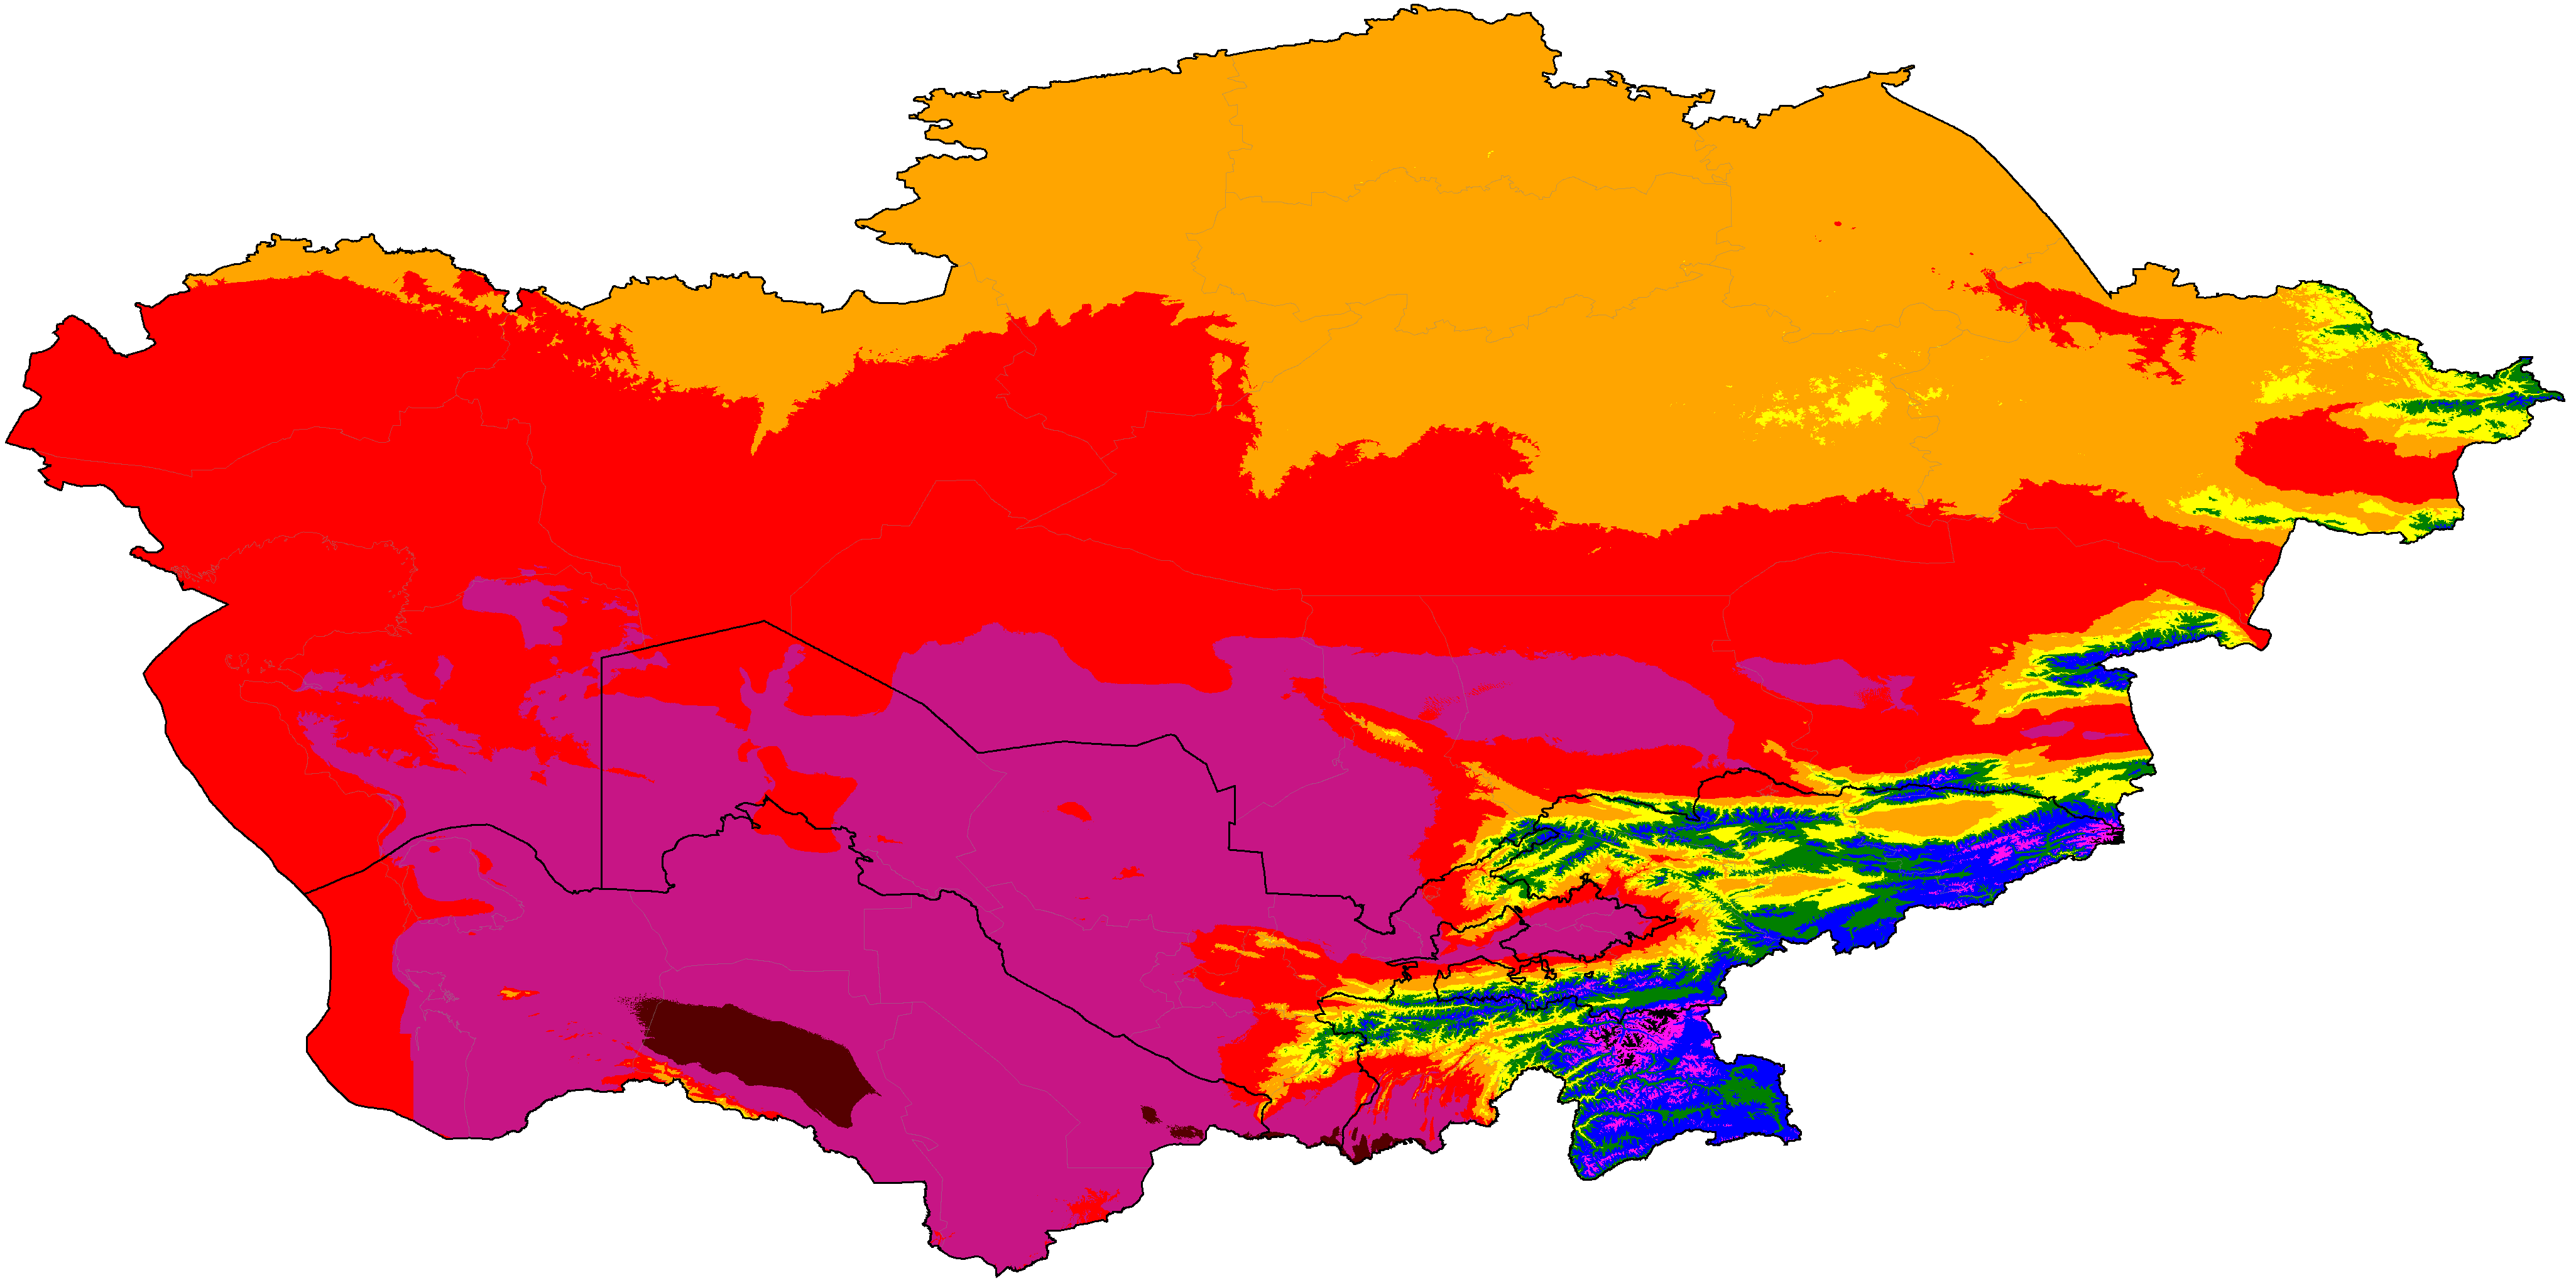
Central Asia distribution of winter categories (projections are SSP5-8.5 high emissions normals)
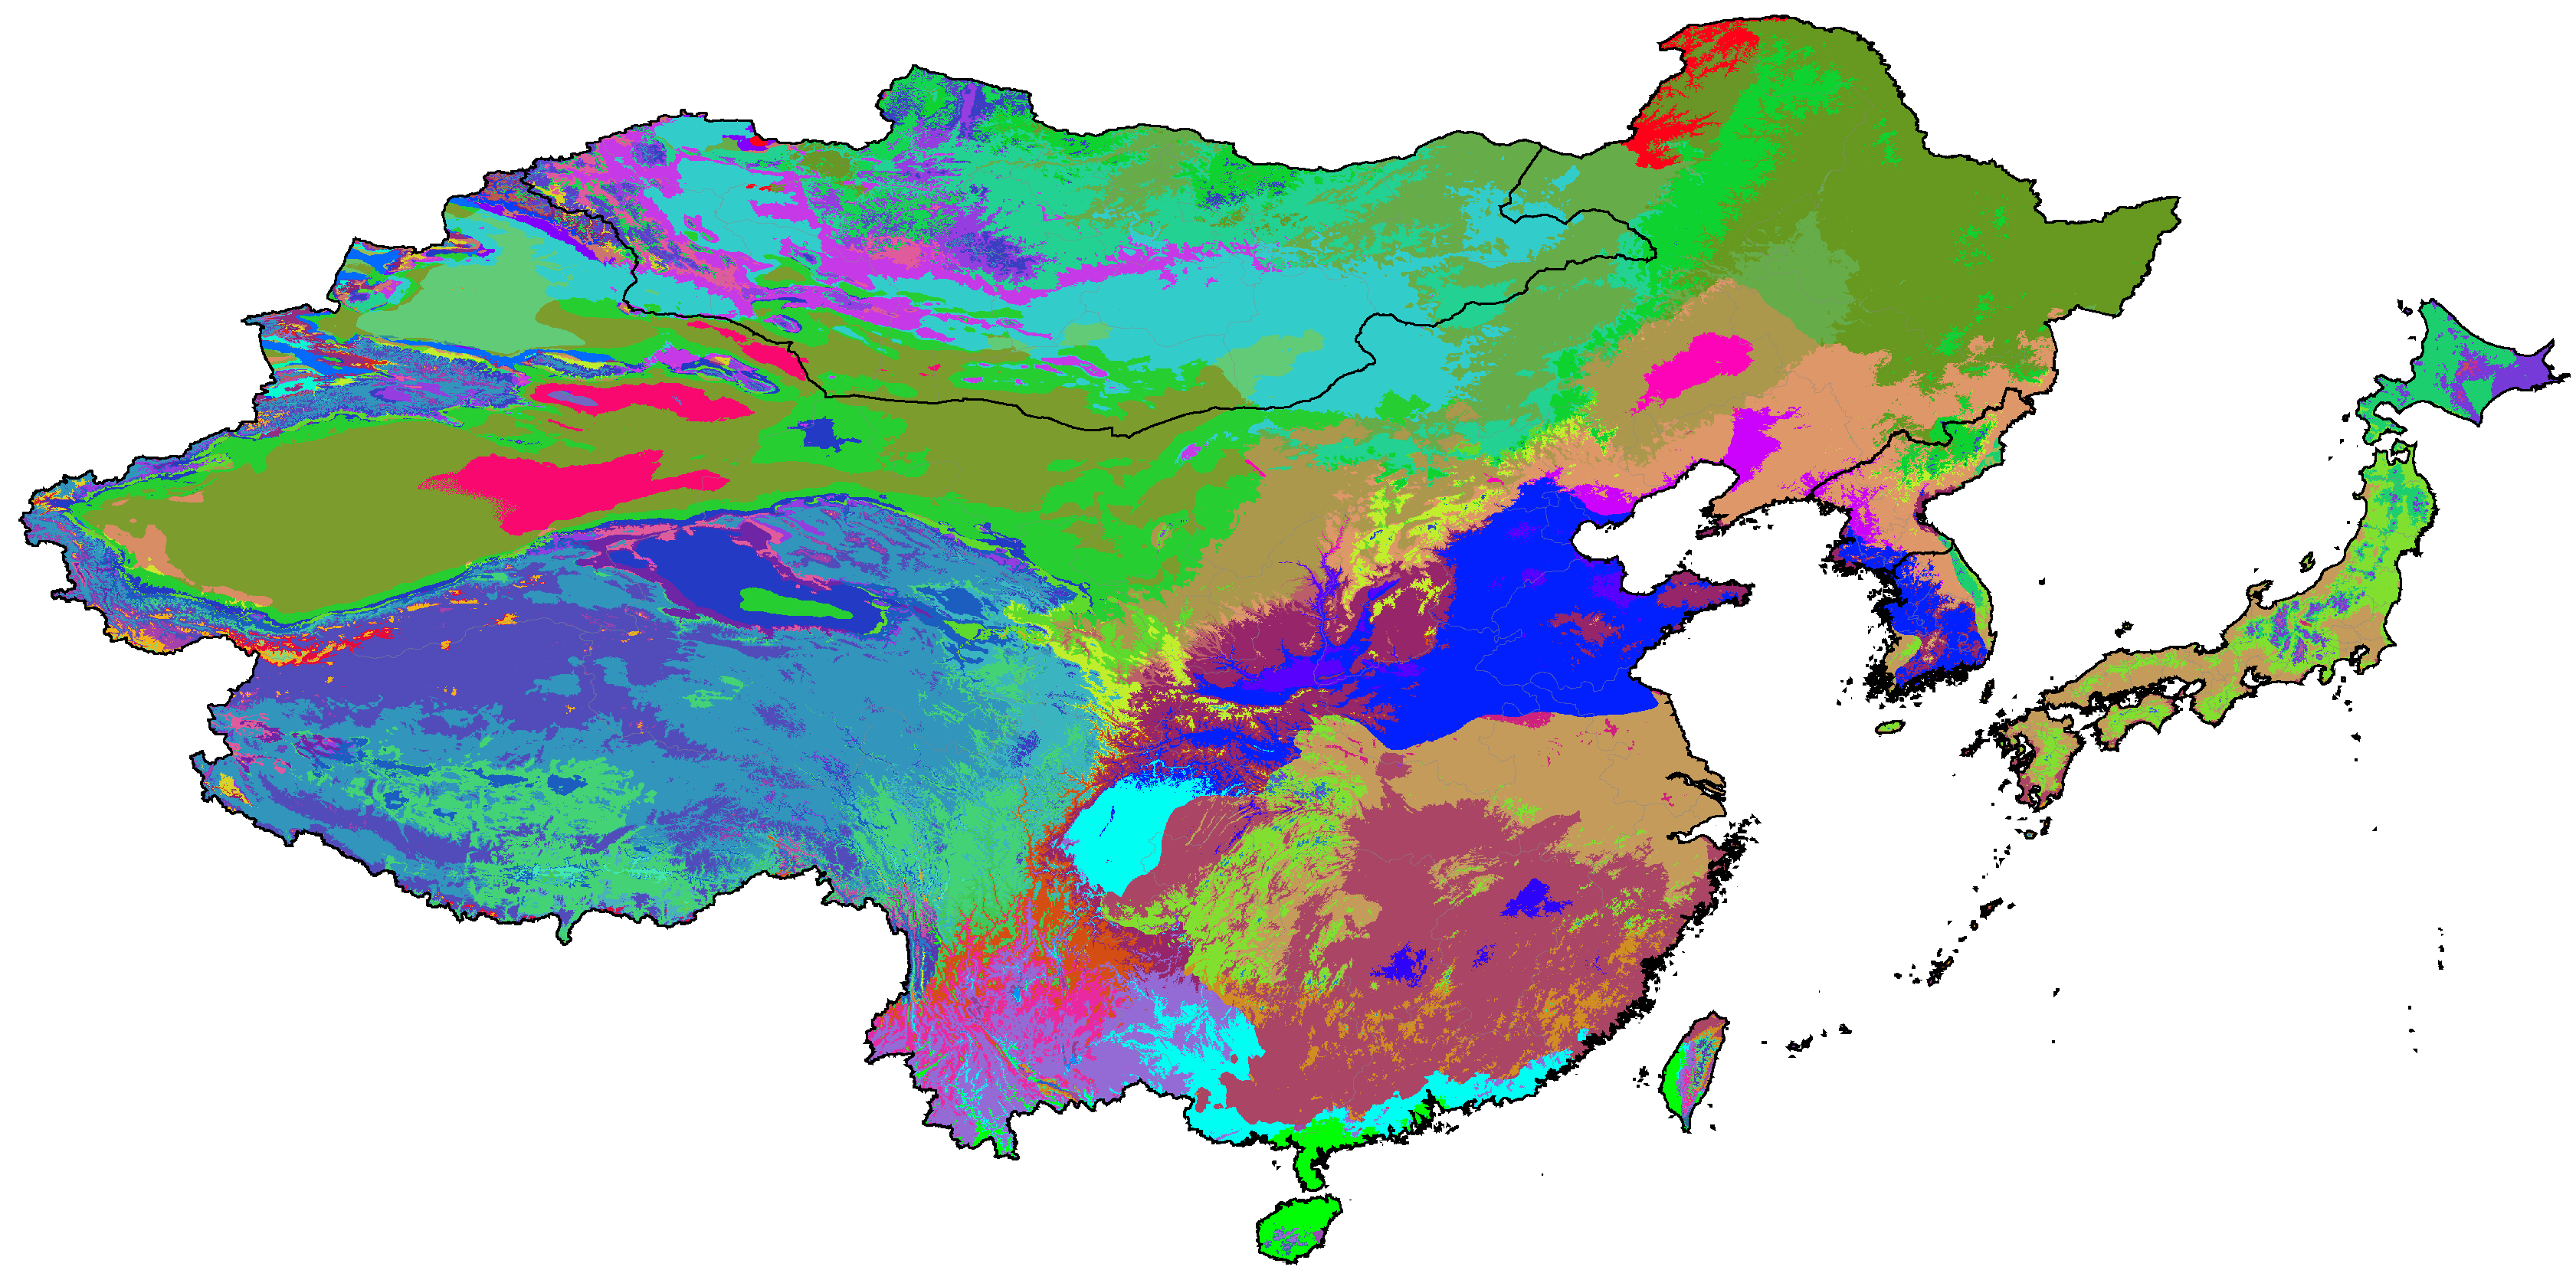
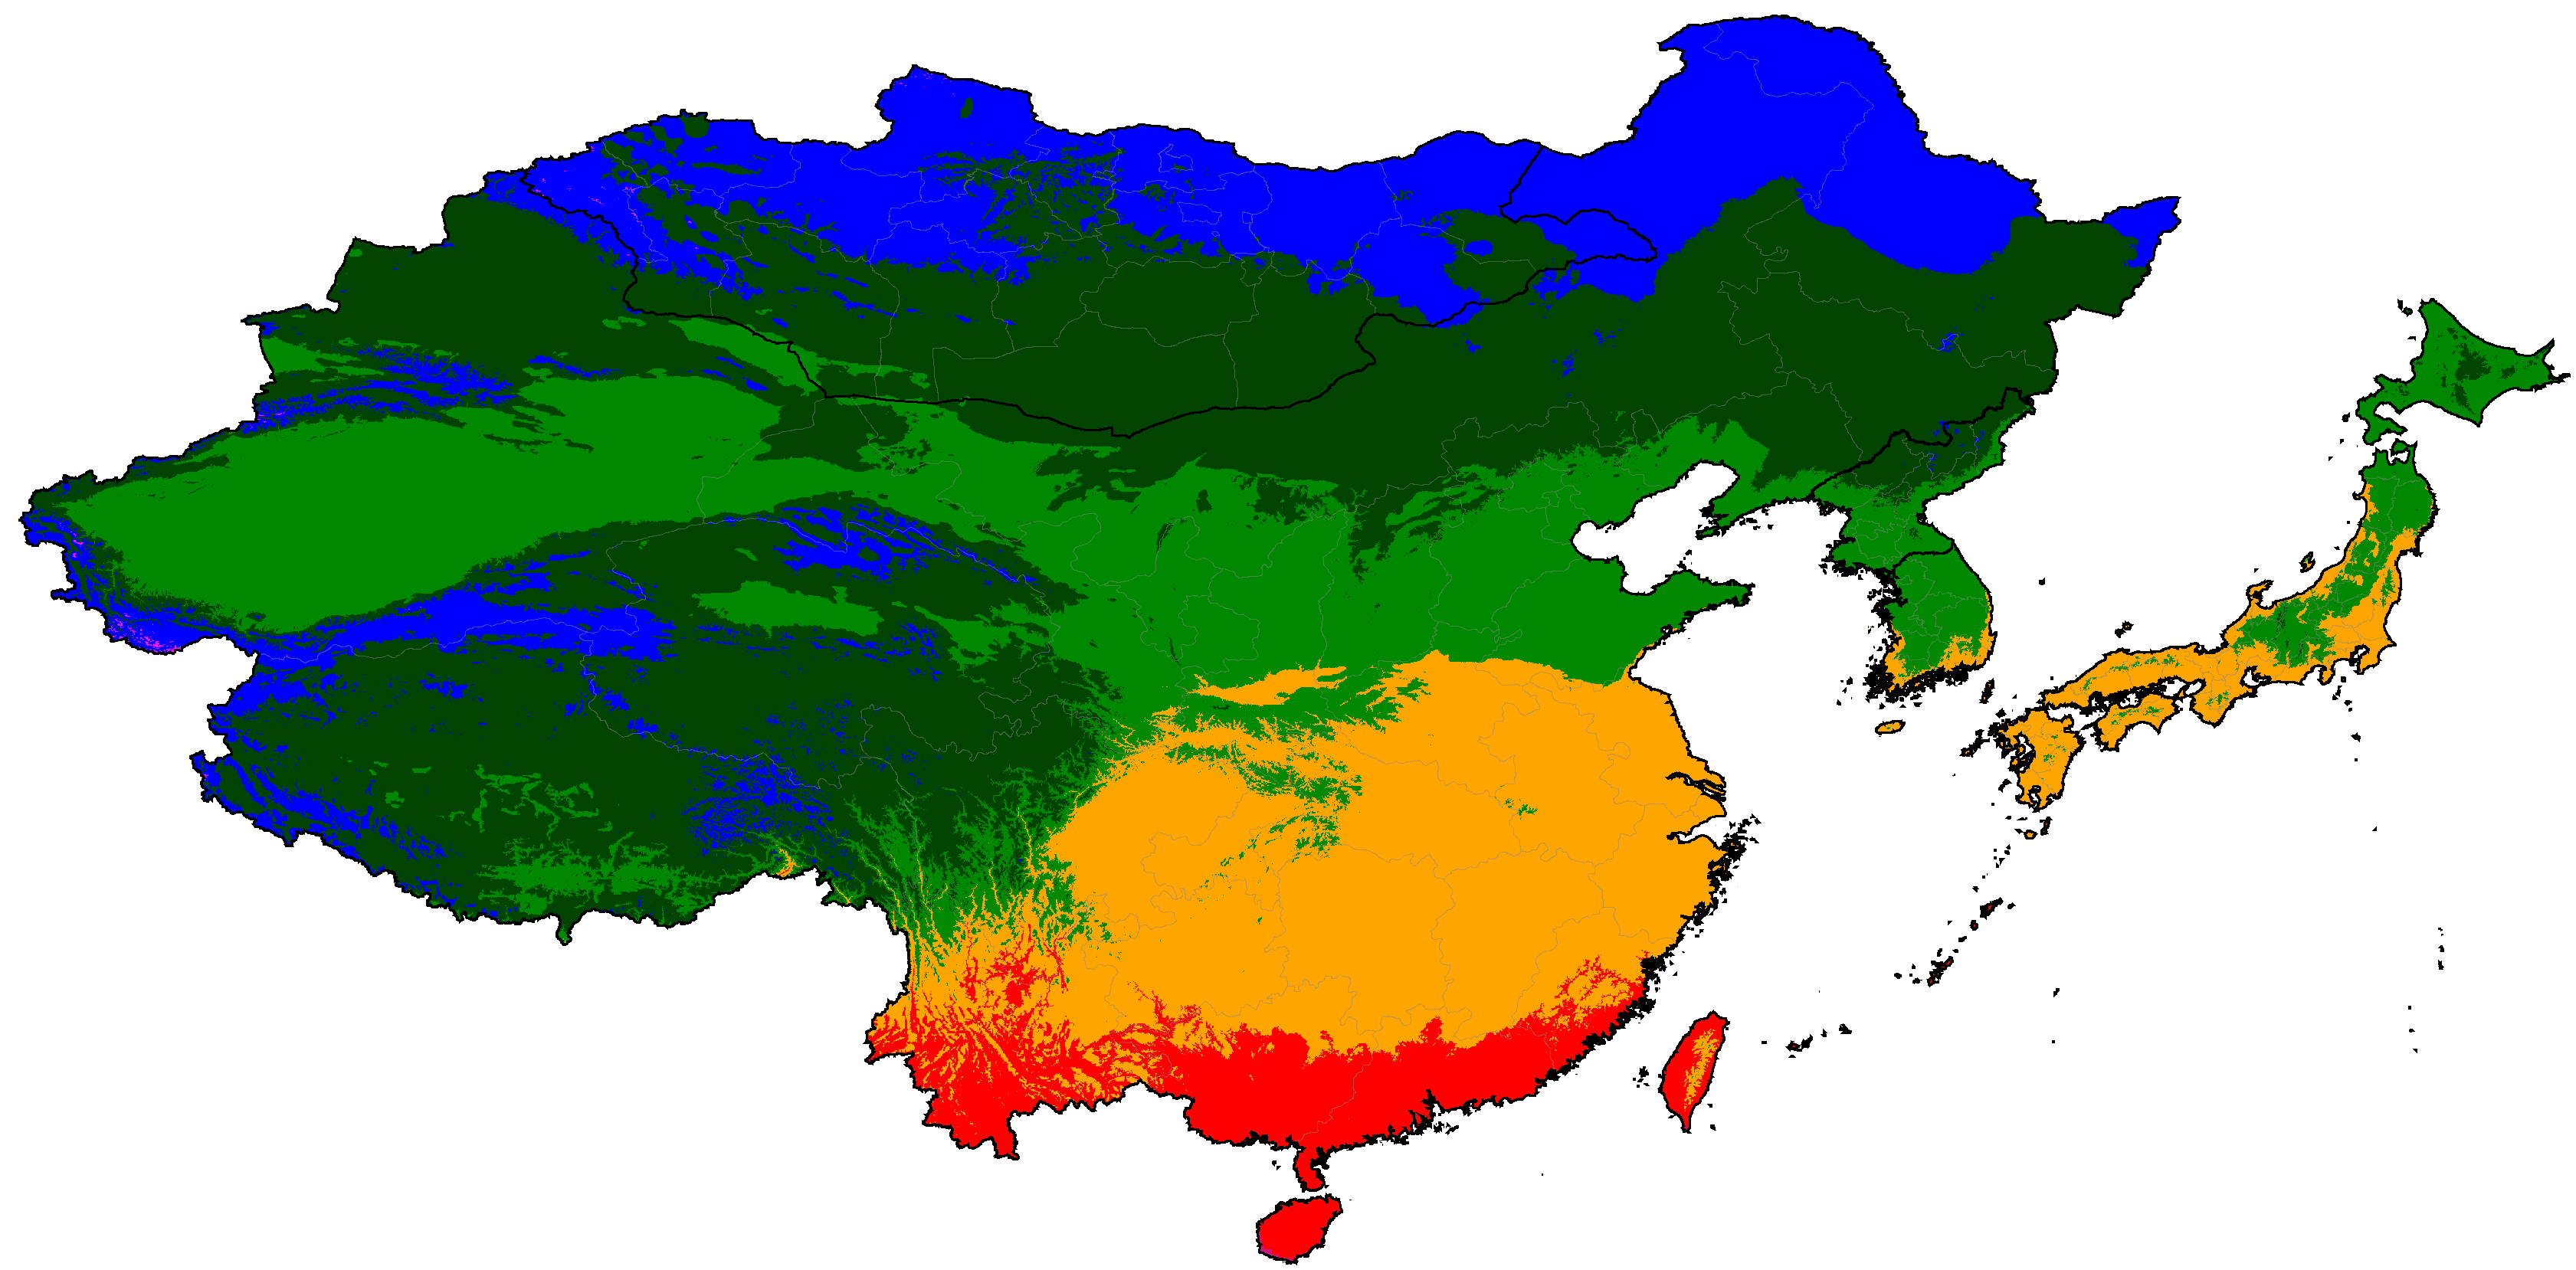
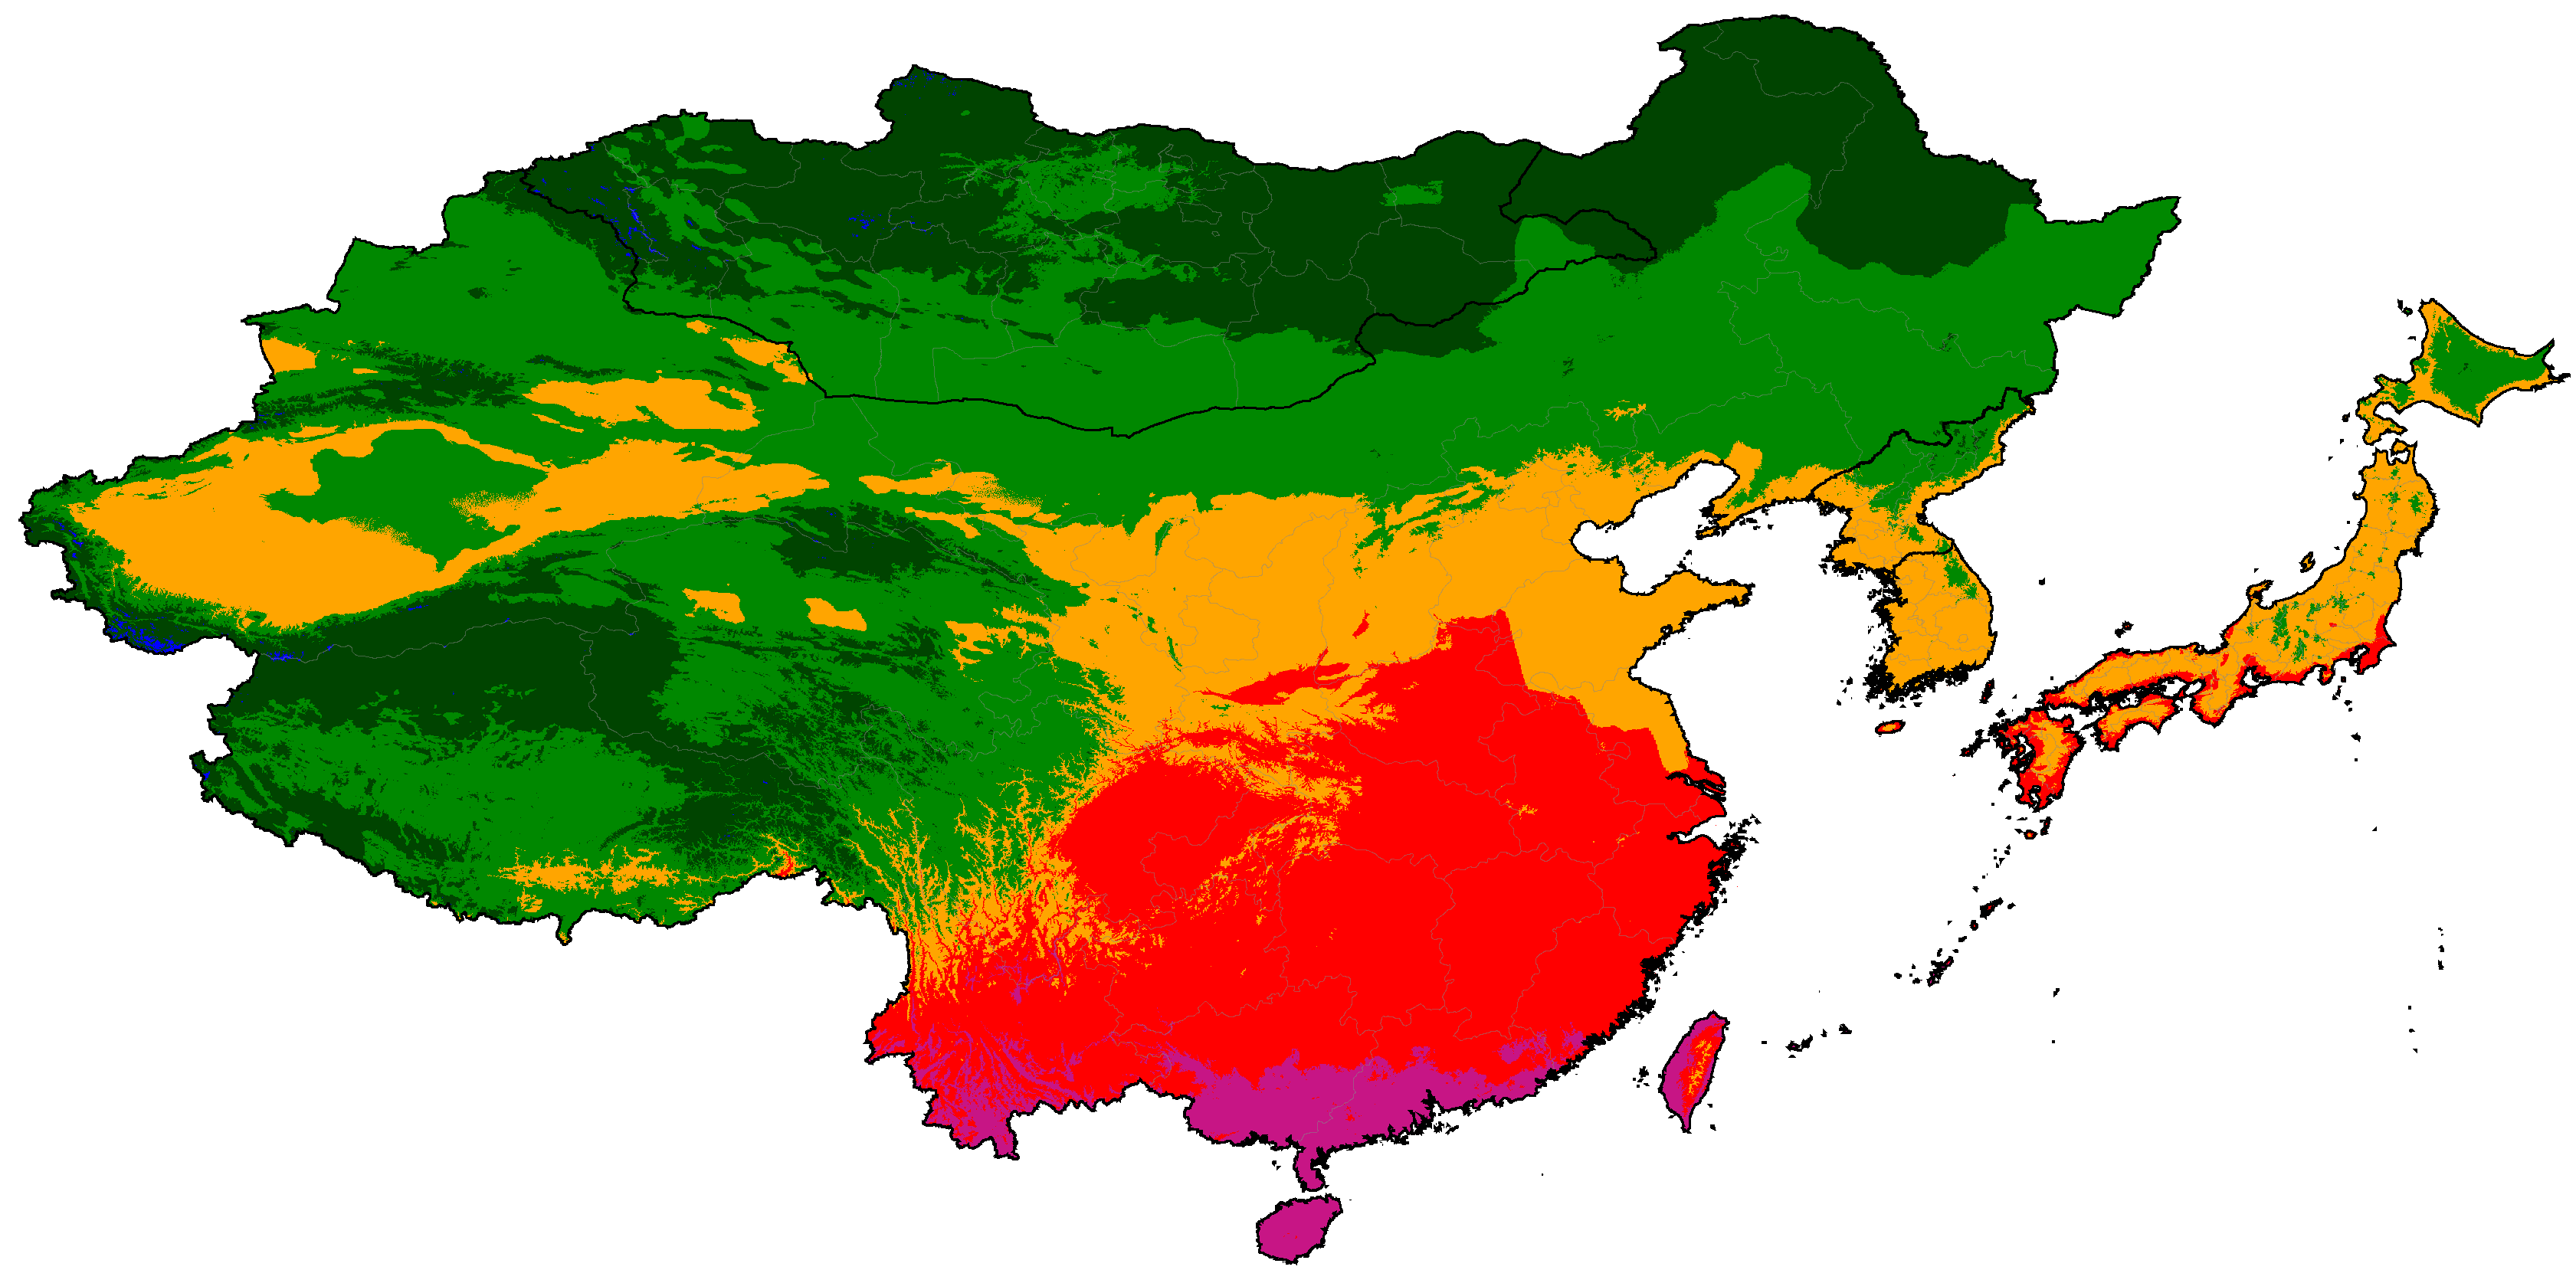
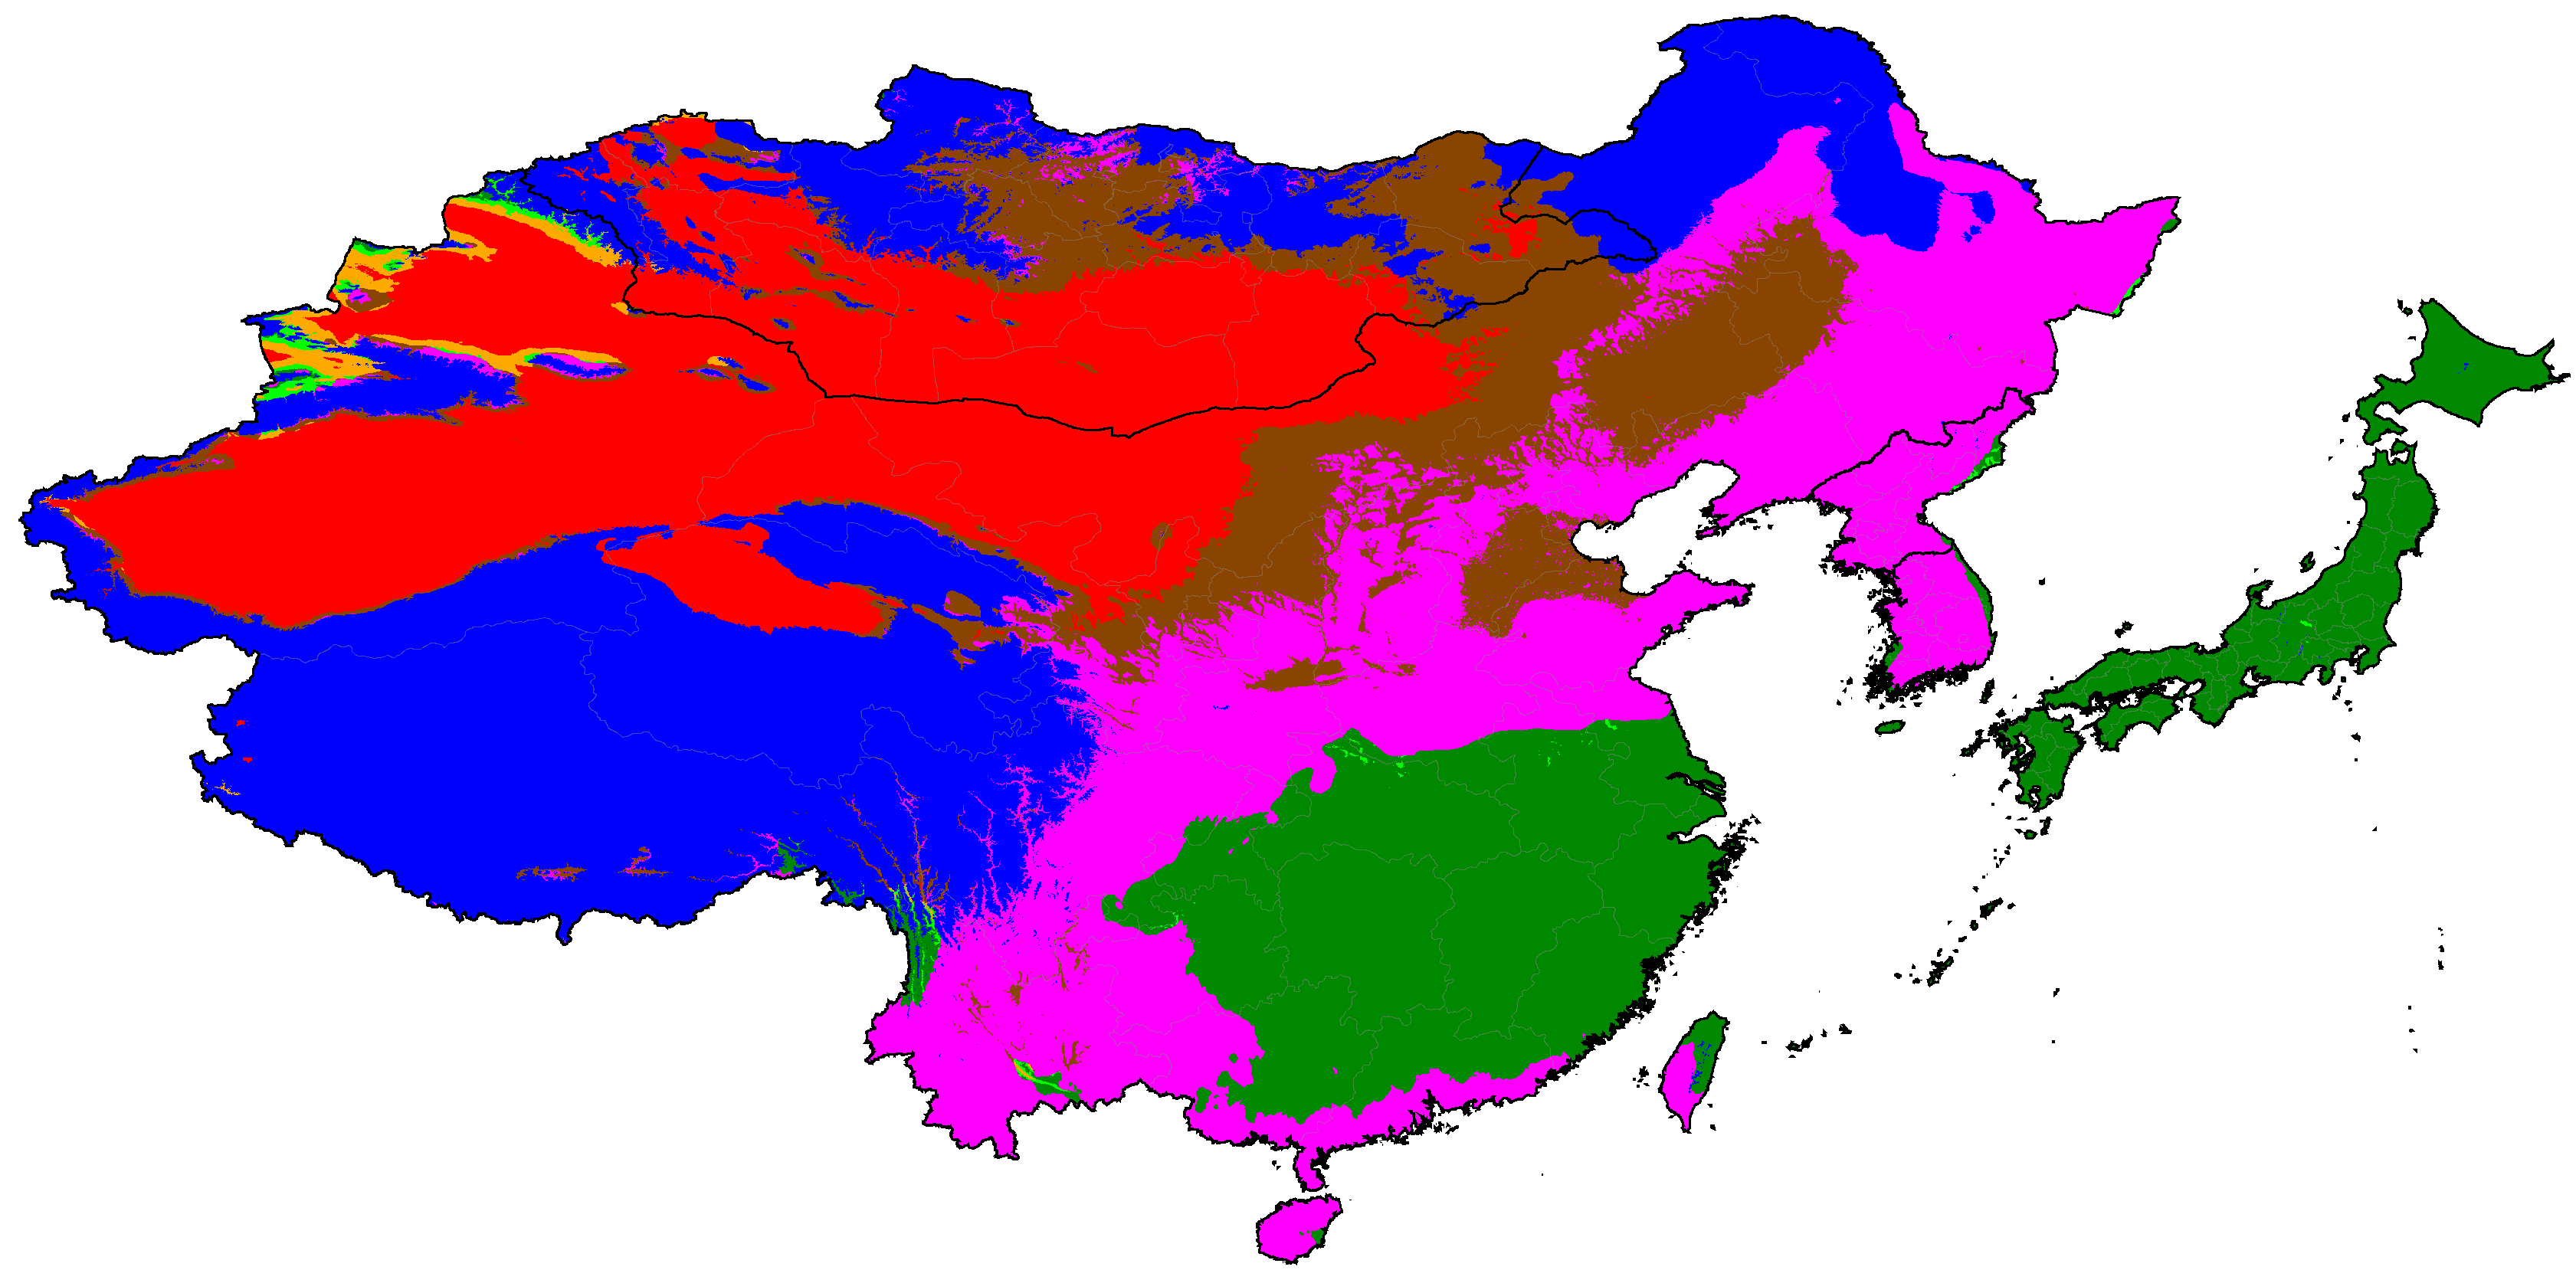
East Asia distribution of winter categories (projections are SSP5-8.5 high emissions normals)
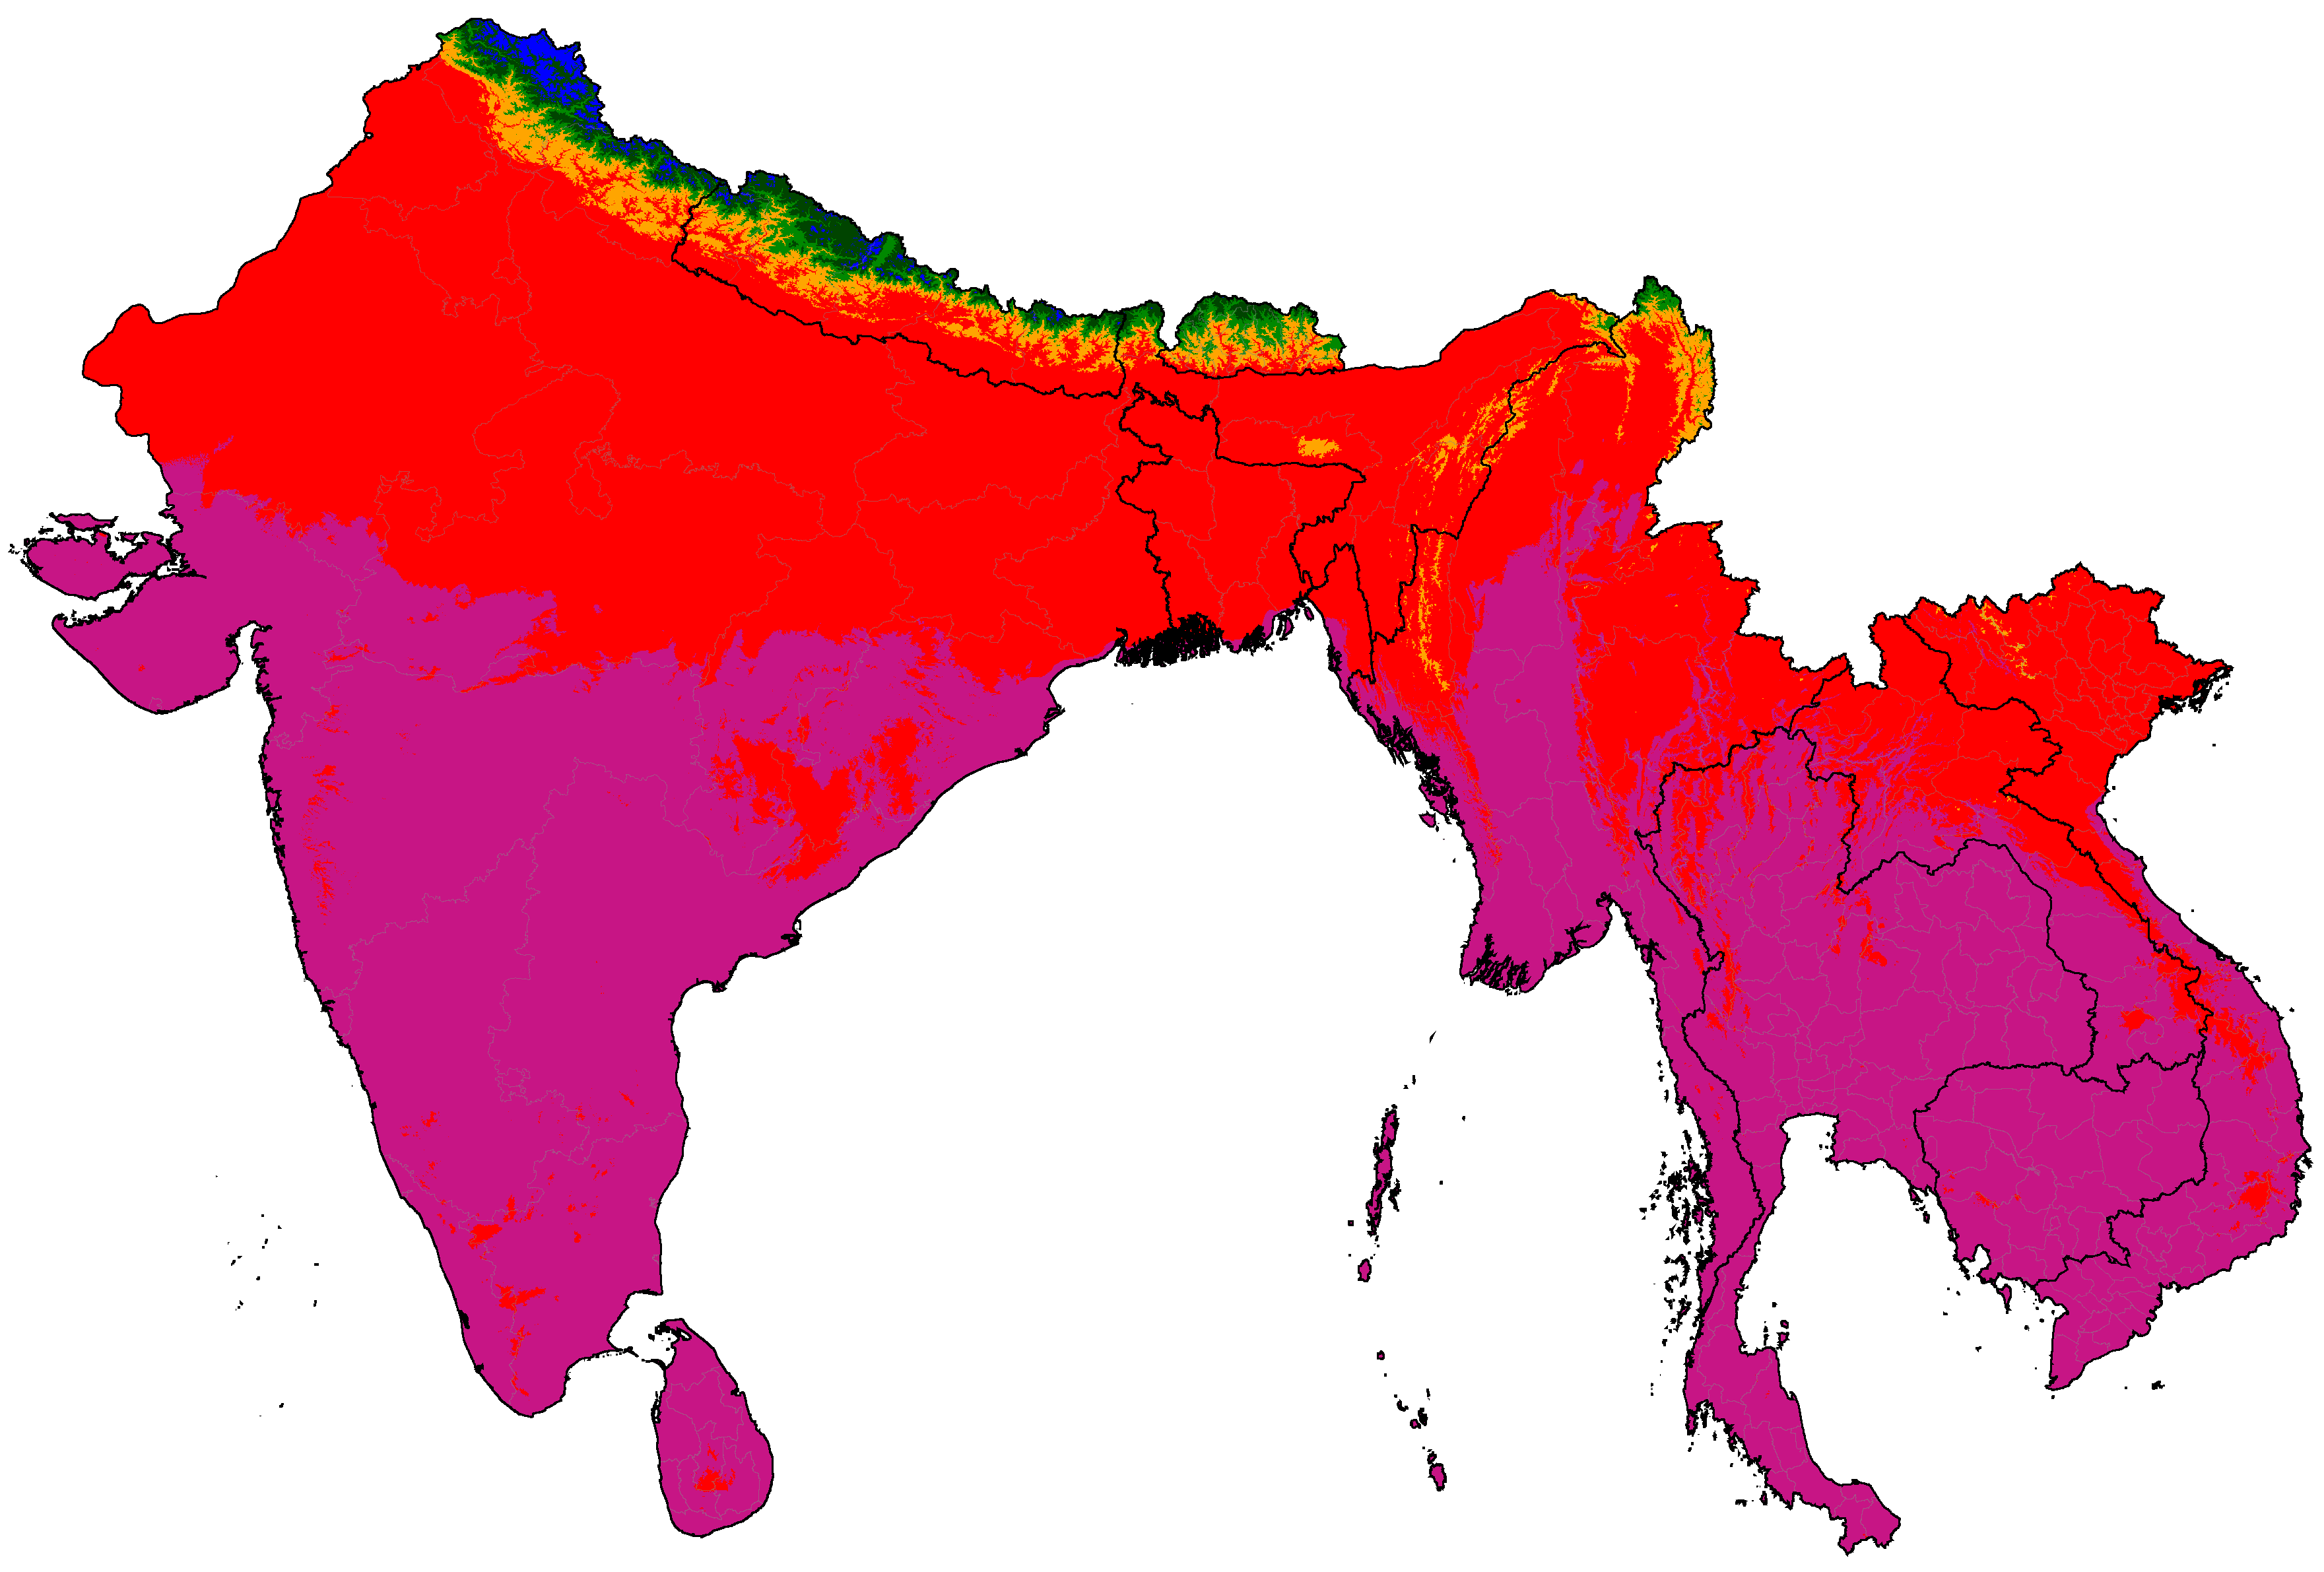
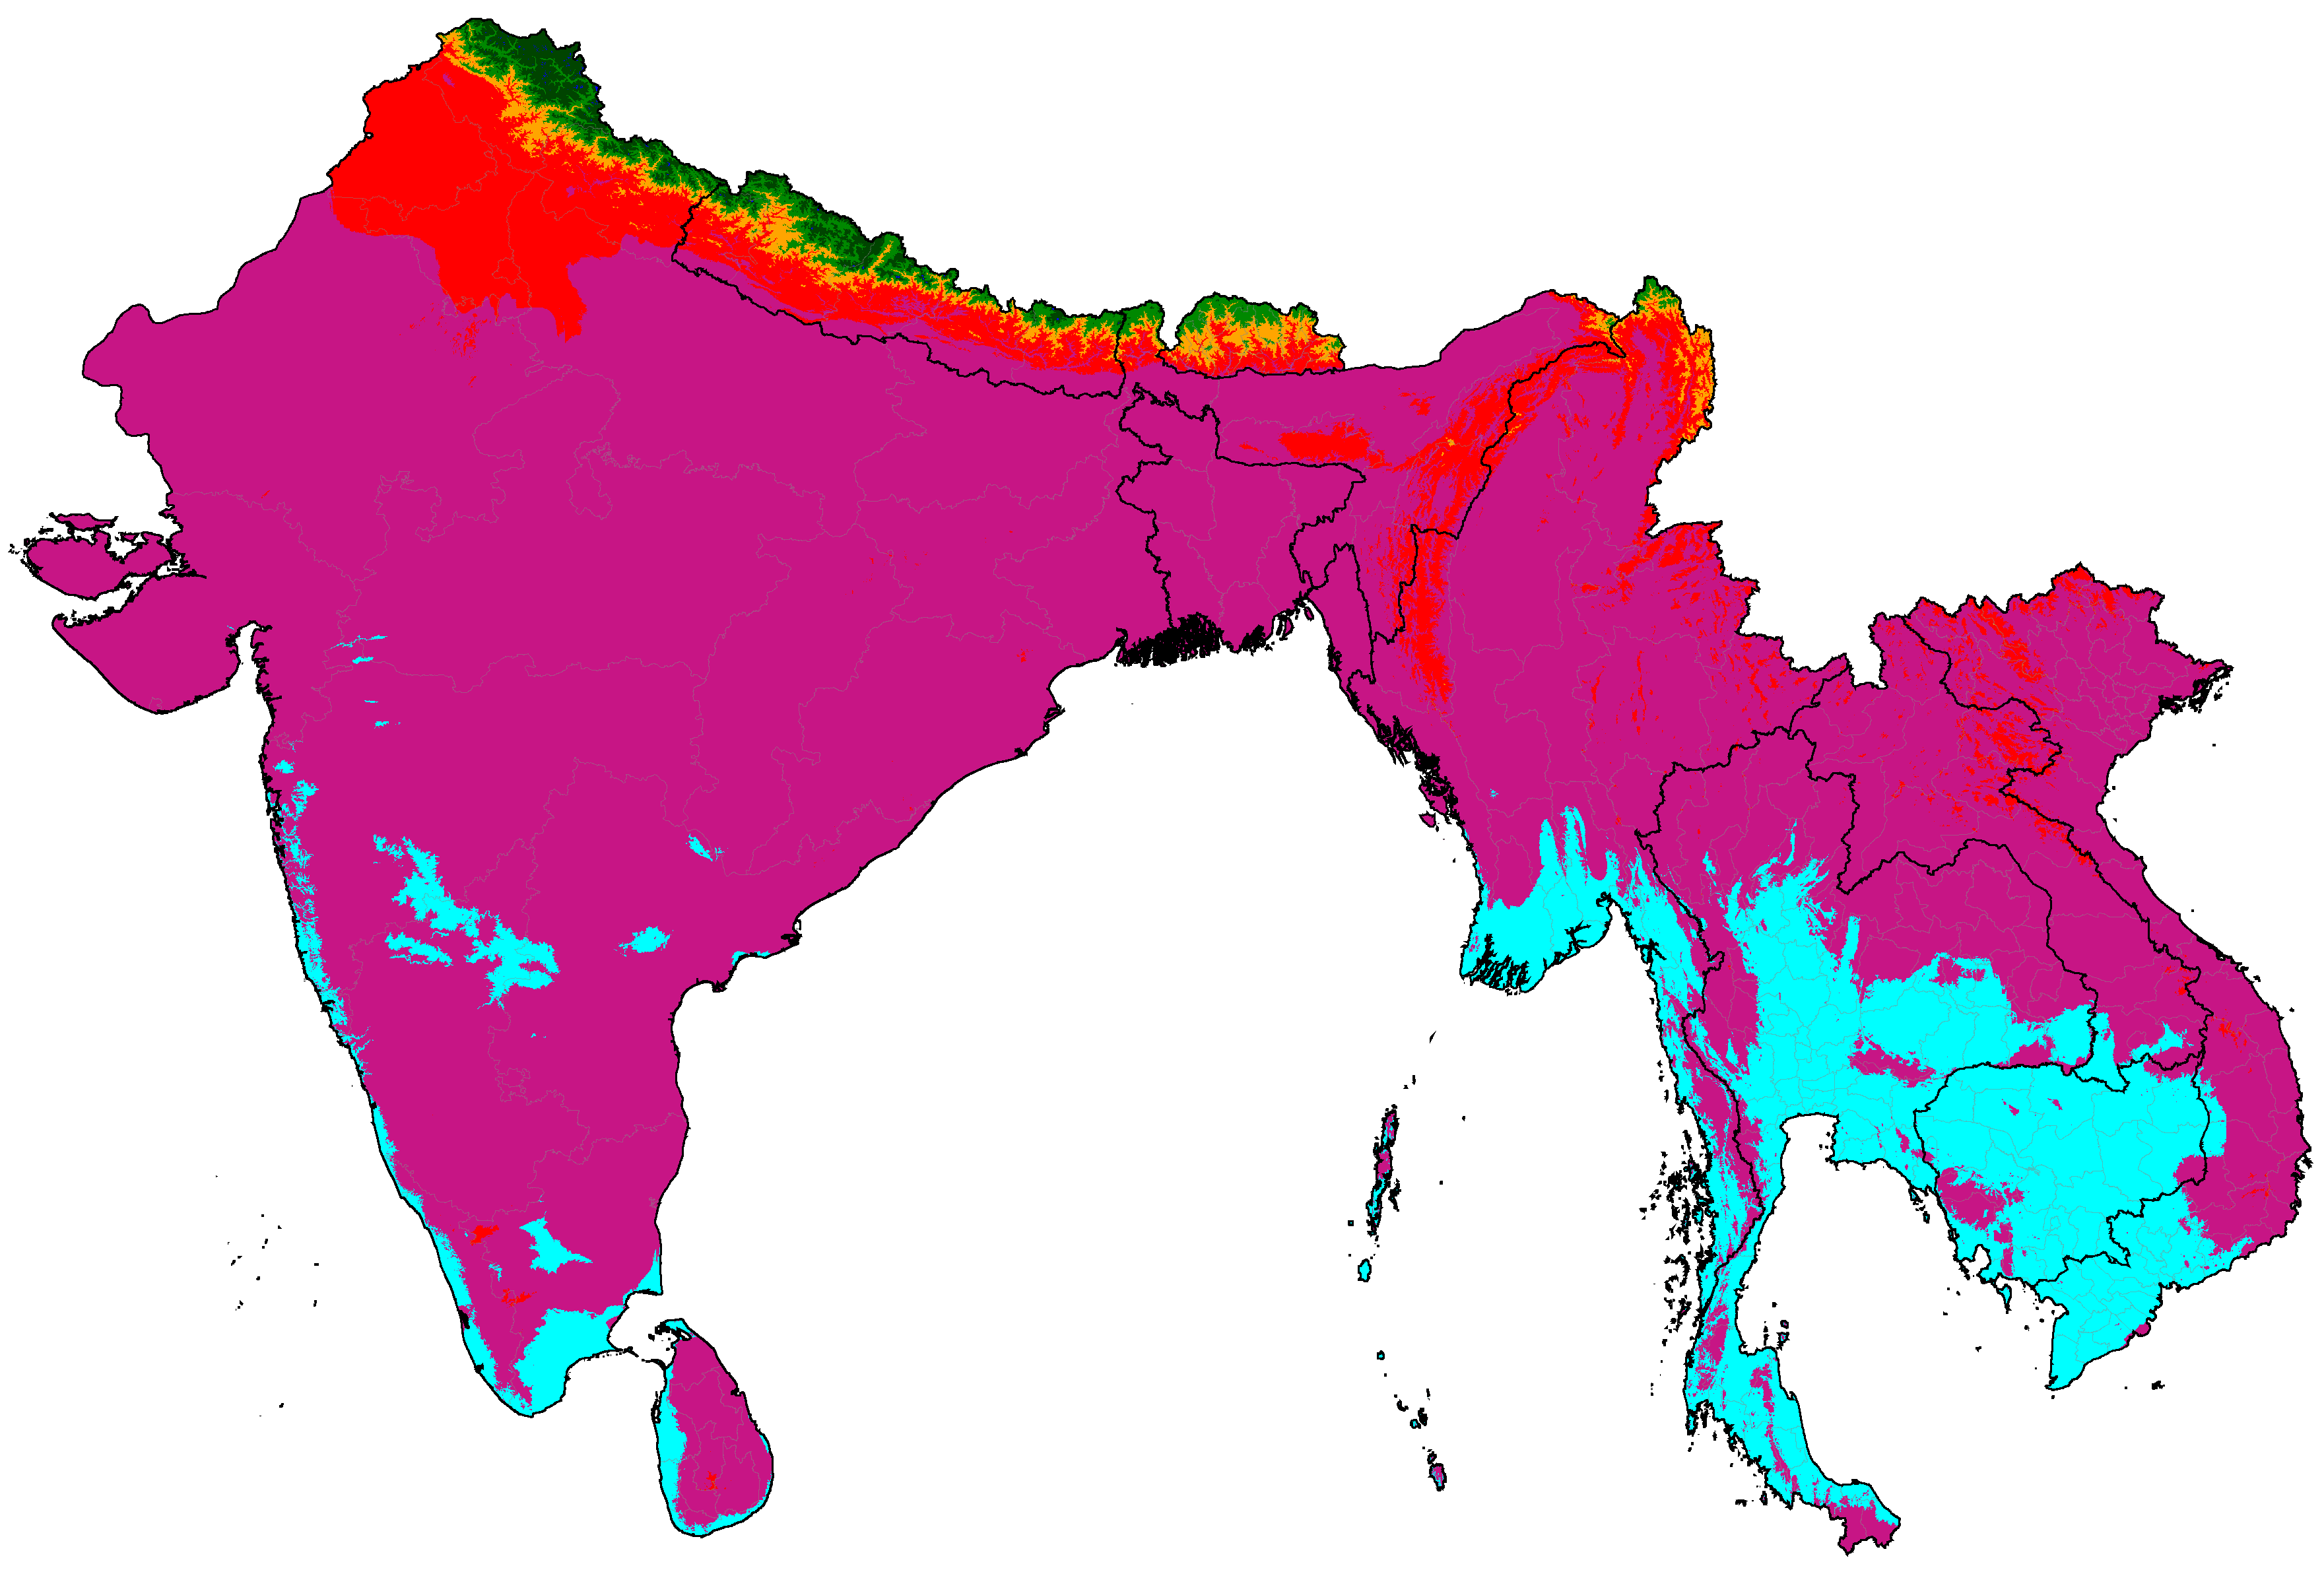
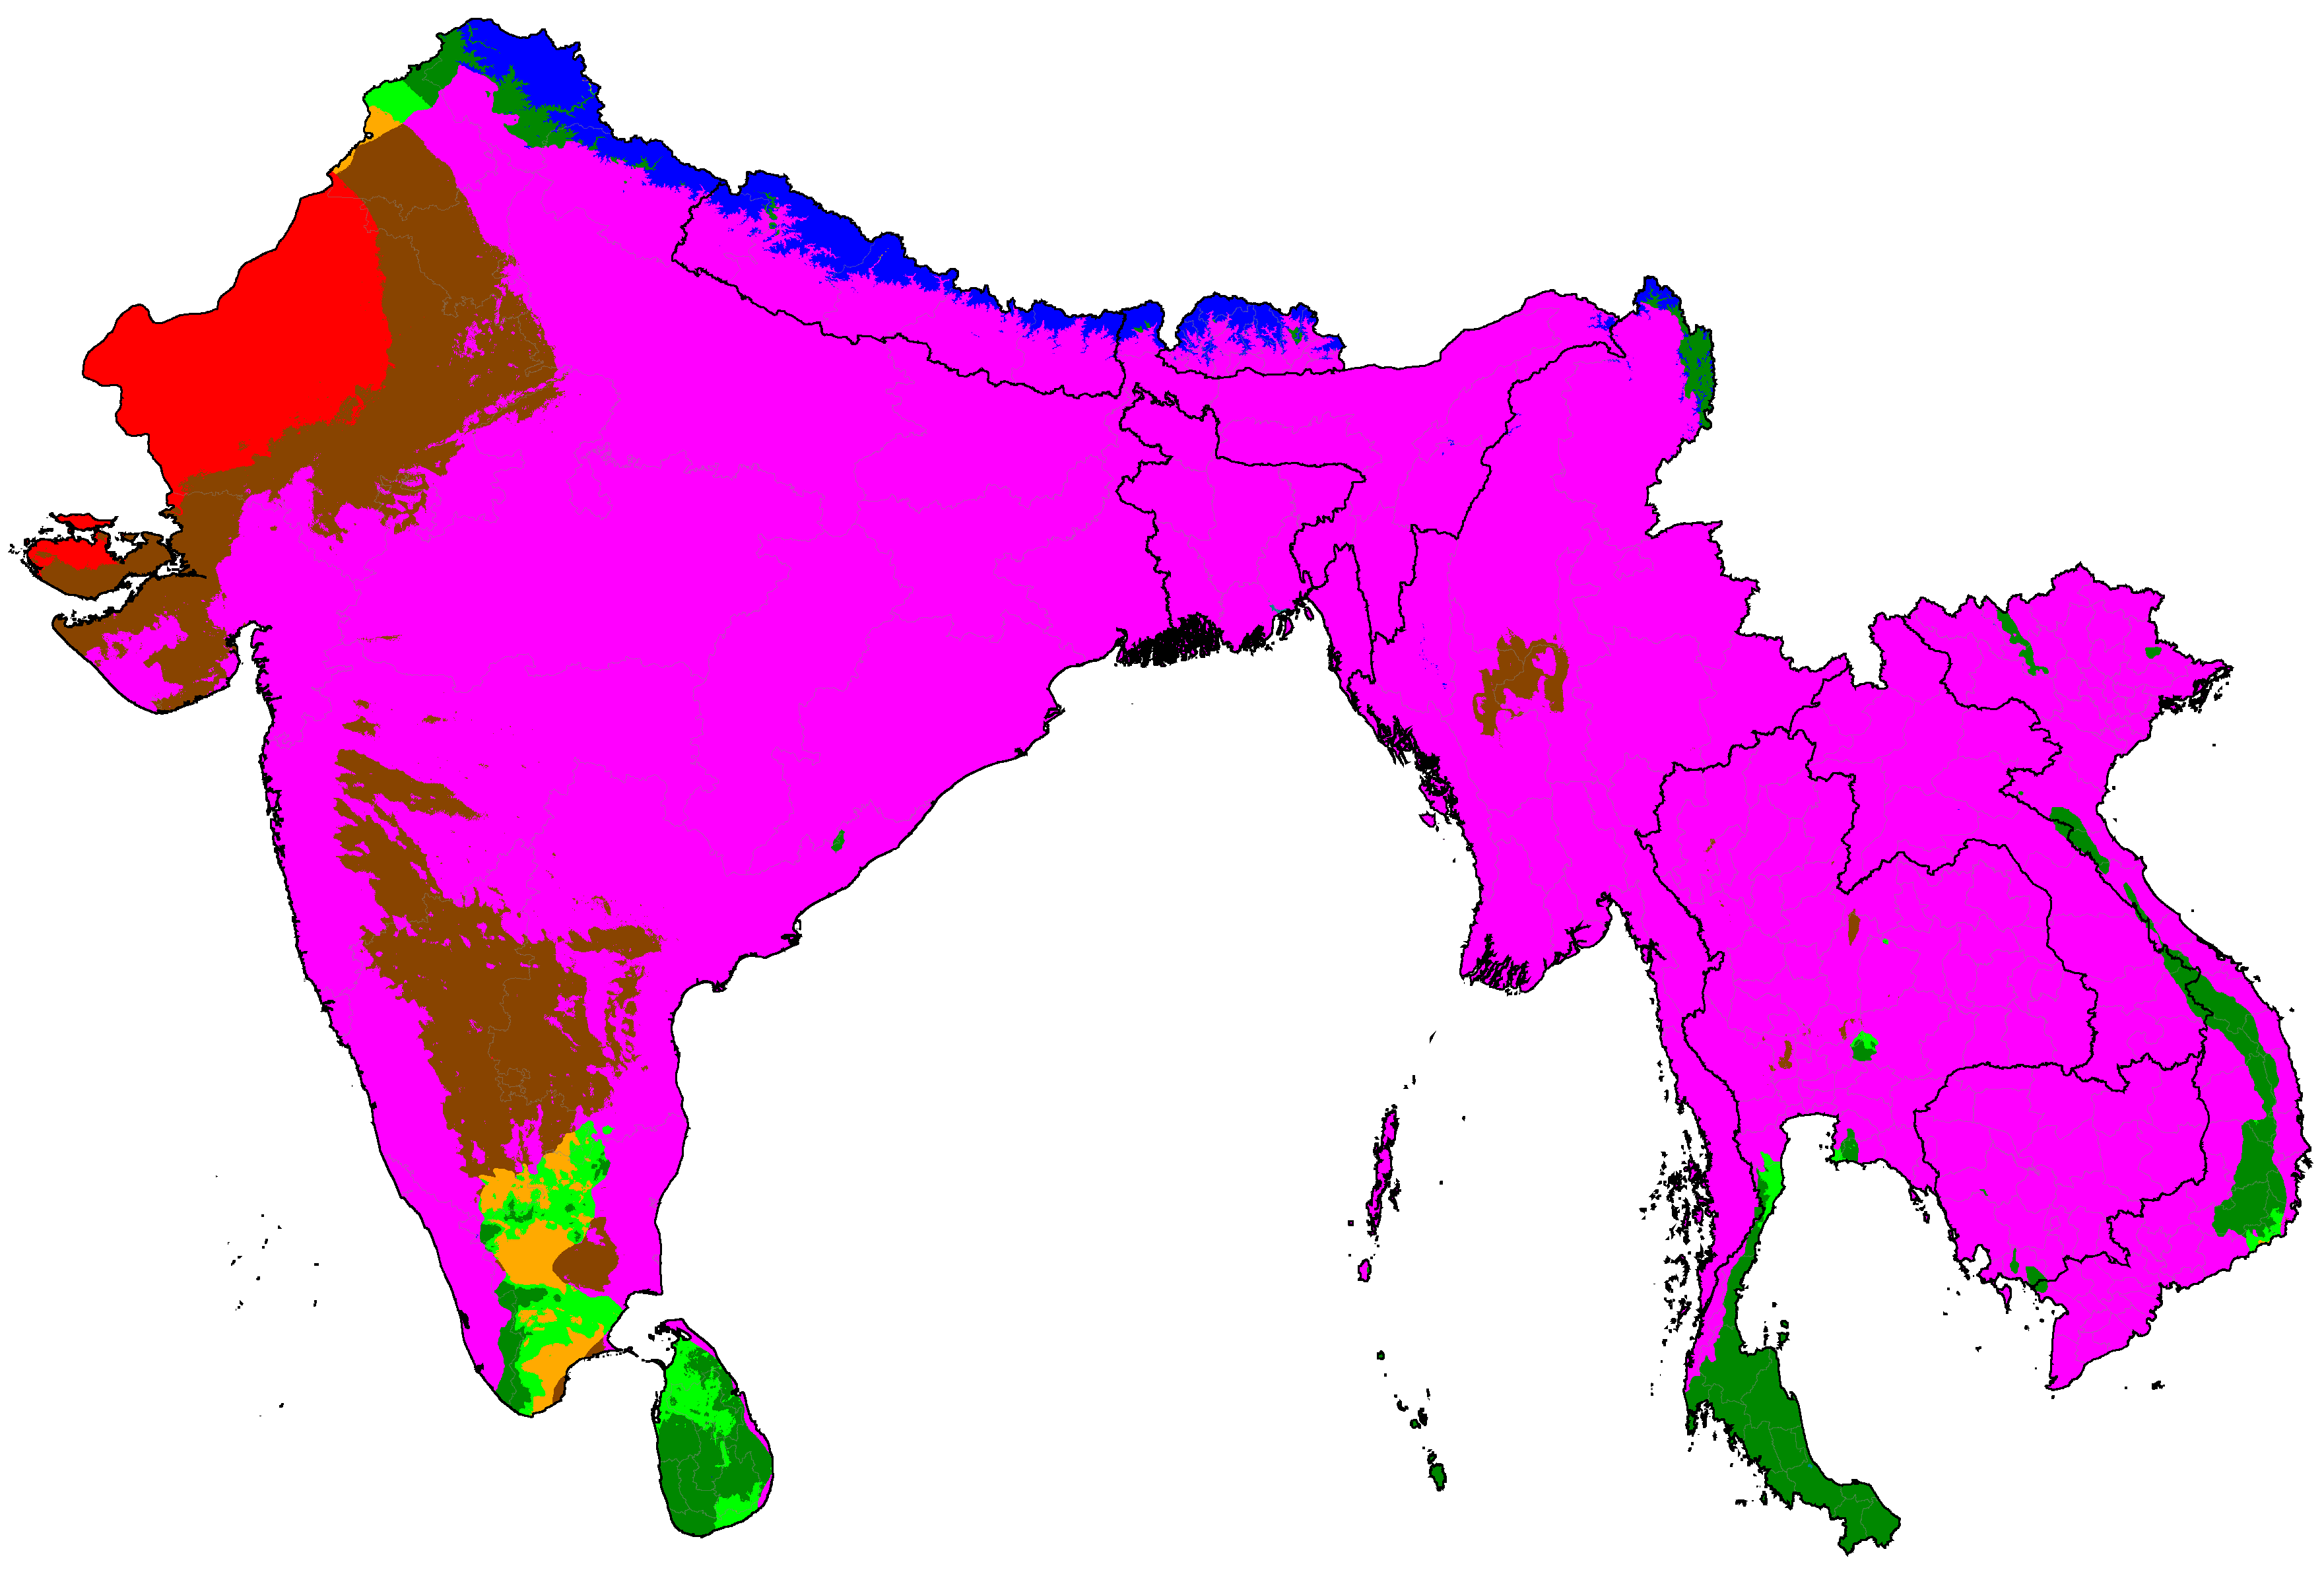
South Asia distribution of winter categories (projections are SSP5-8.5 high emissions normals)
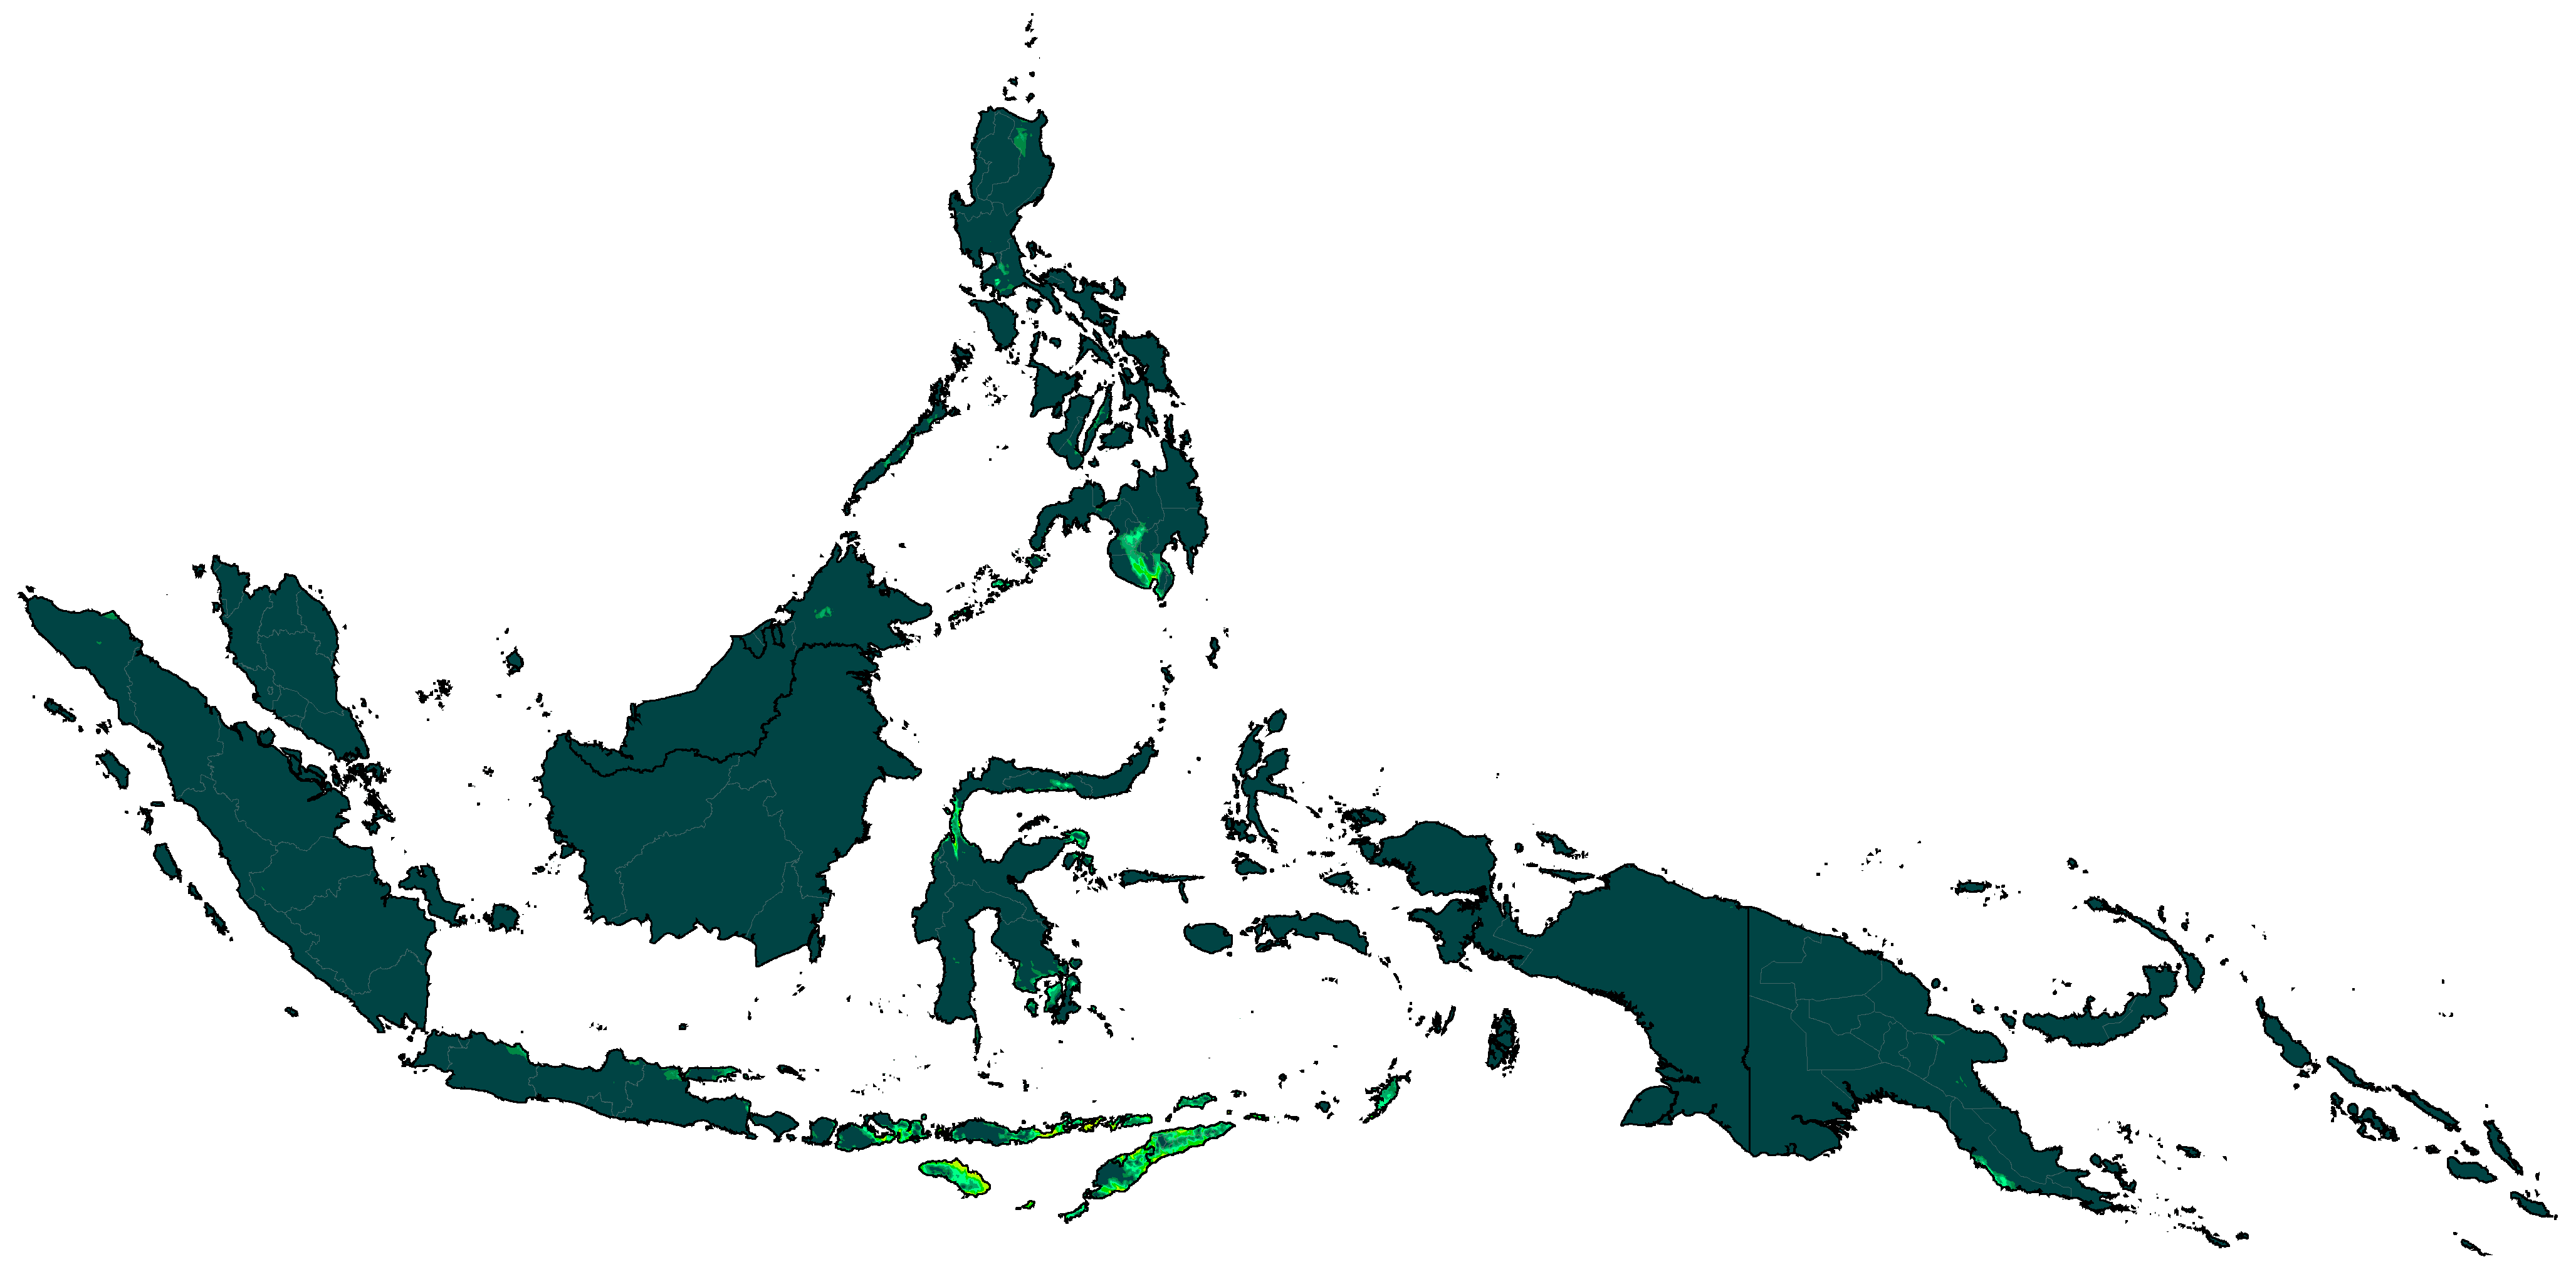
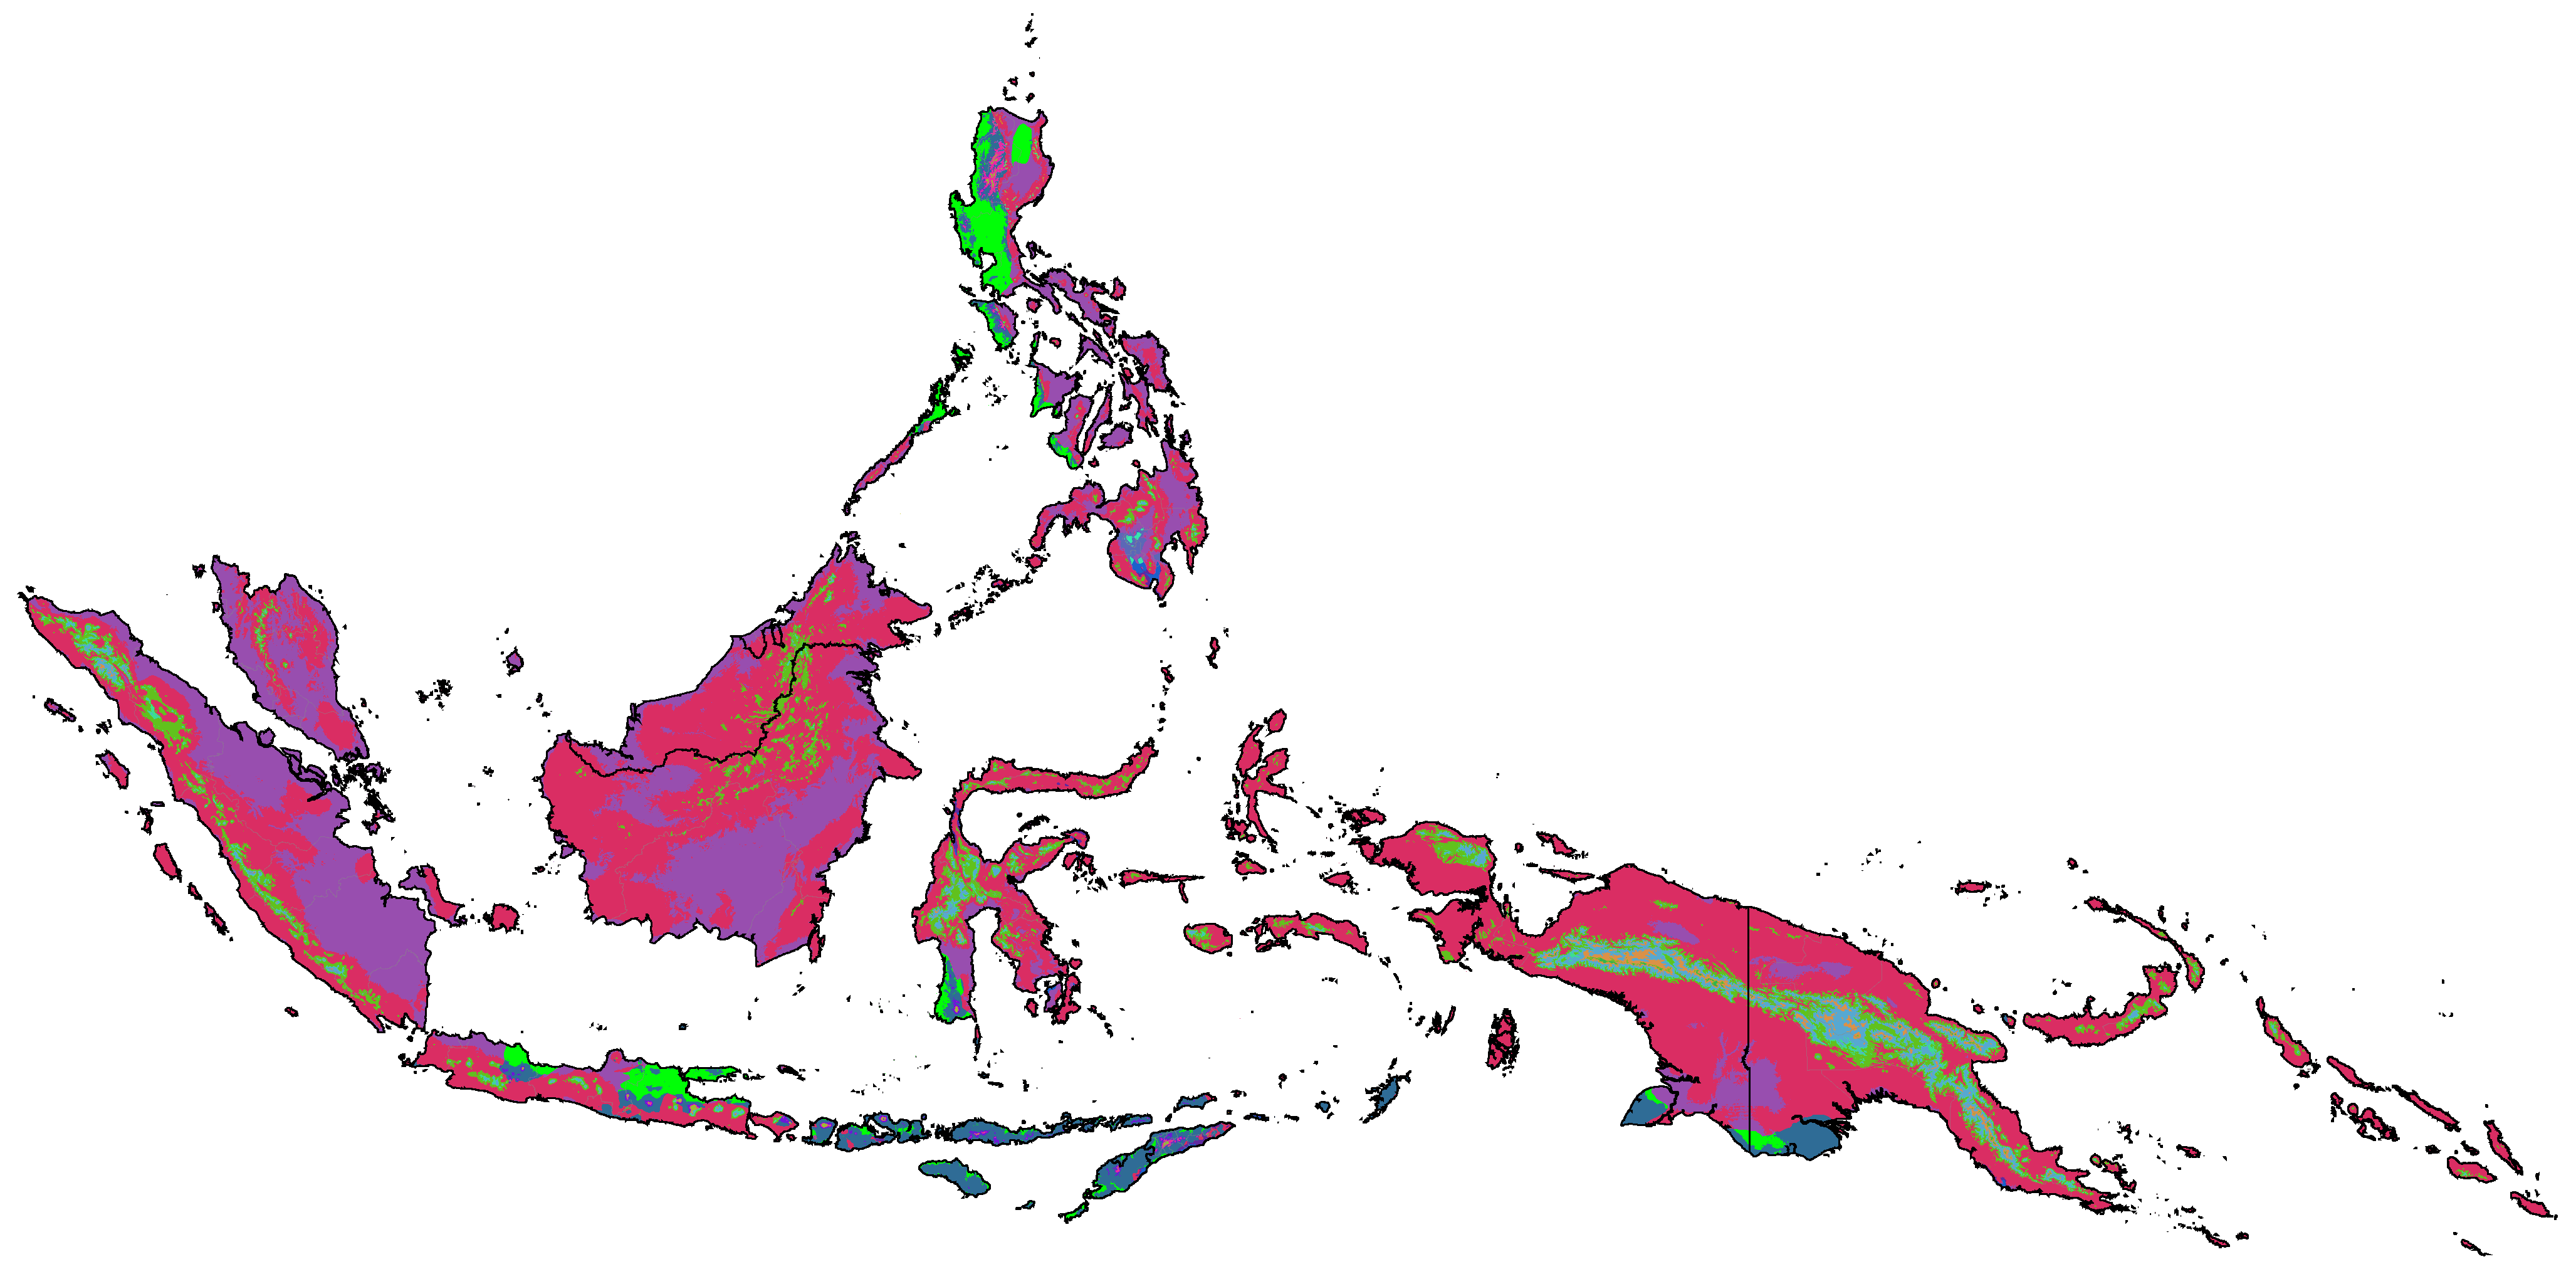
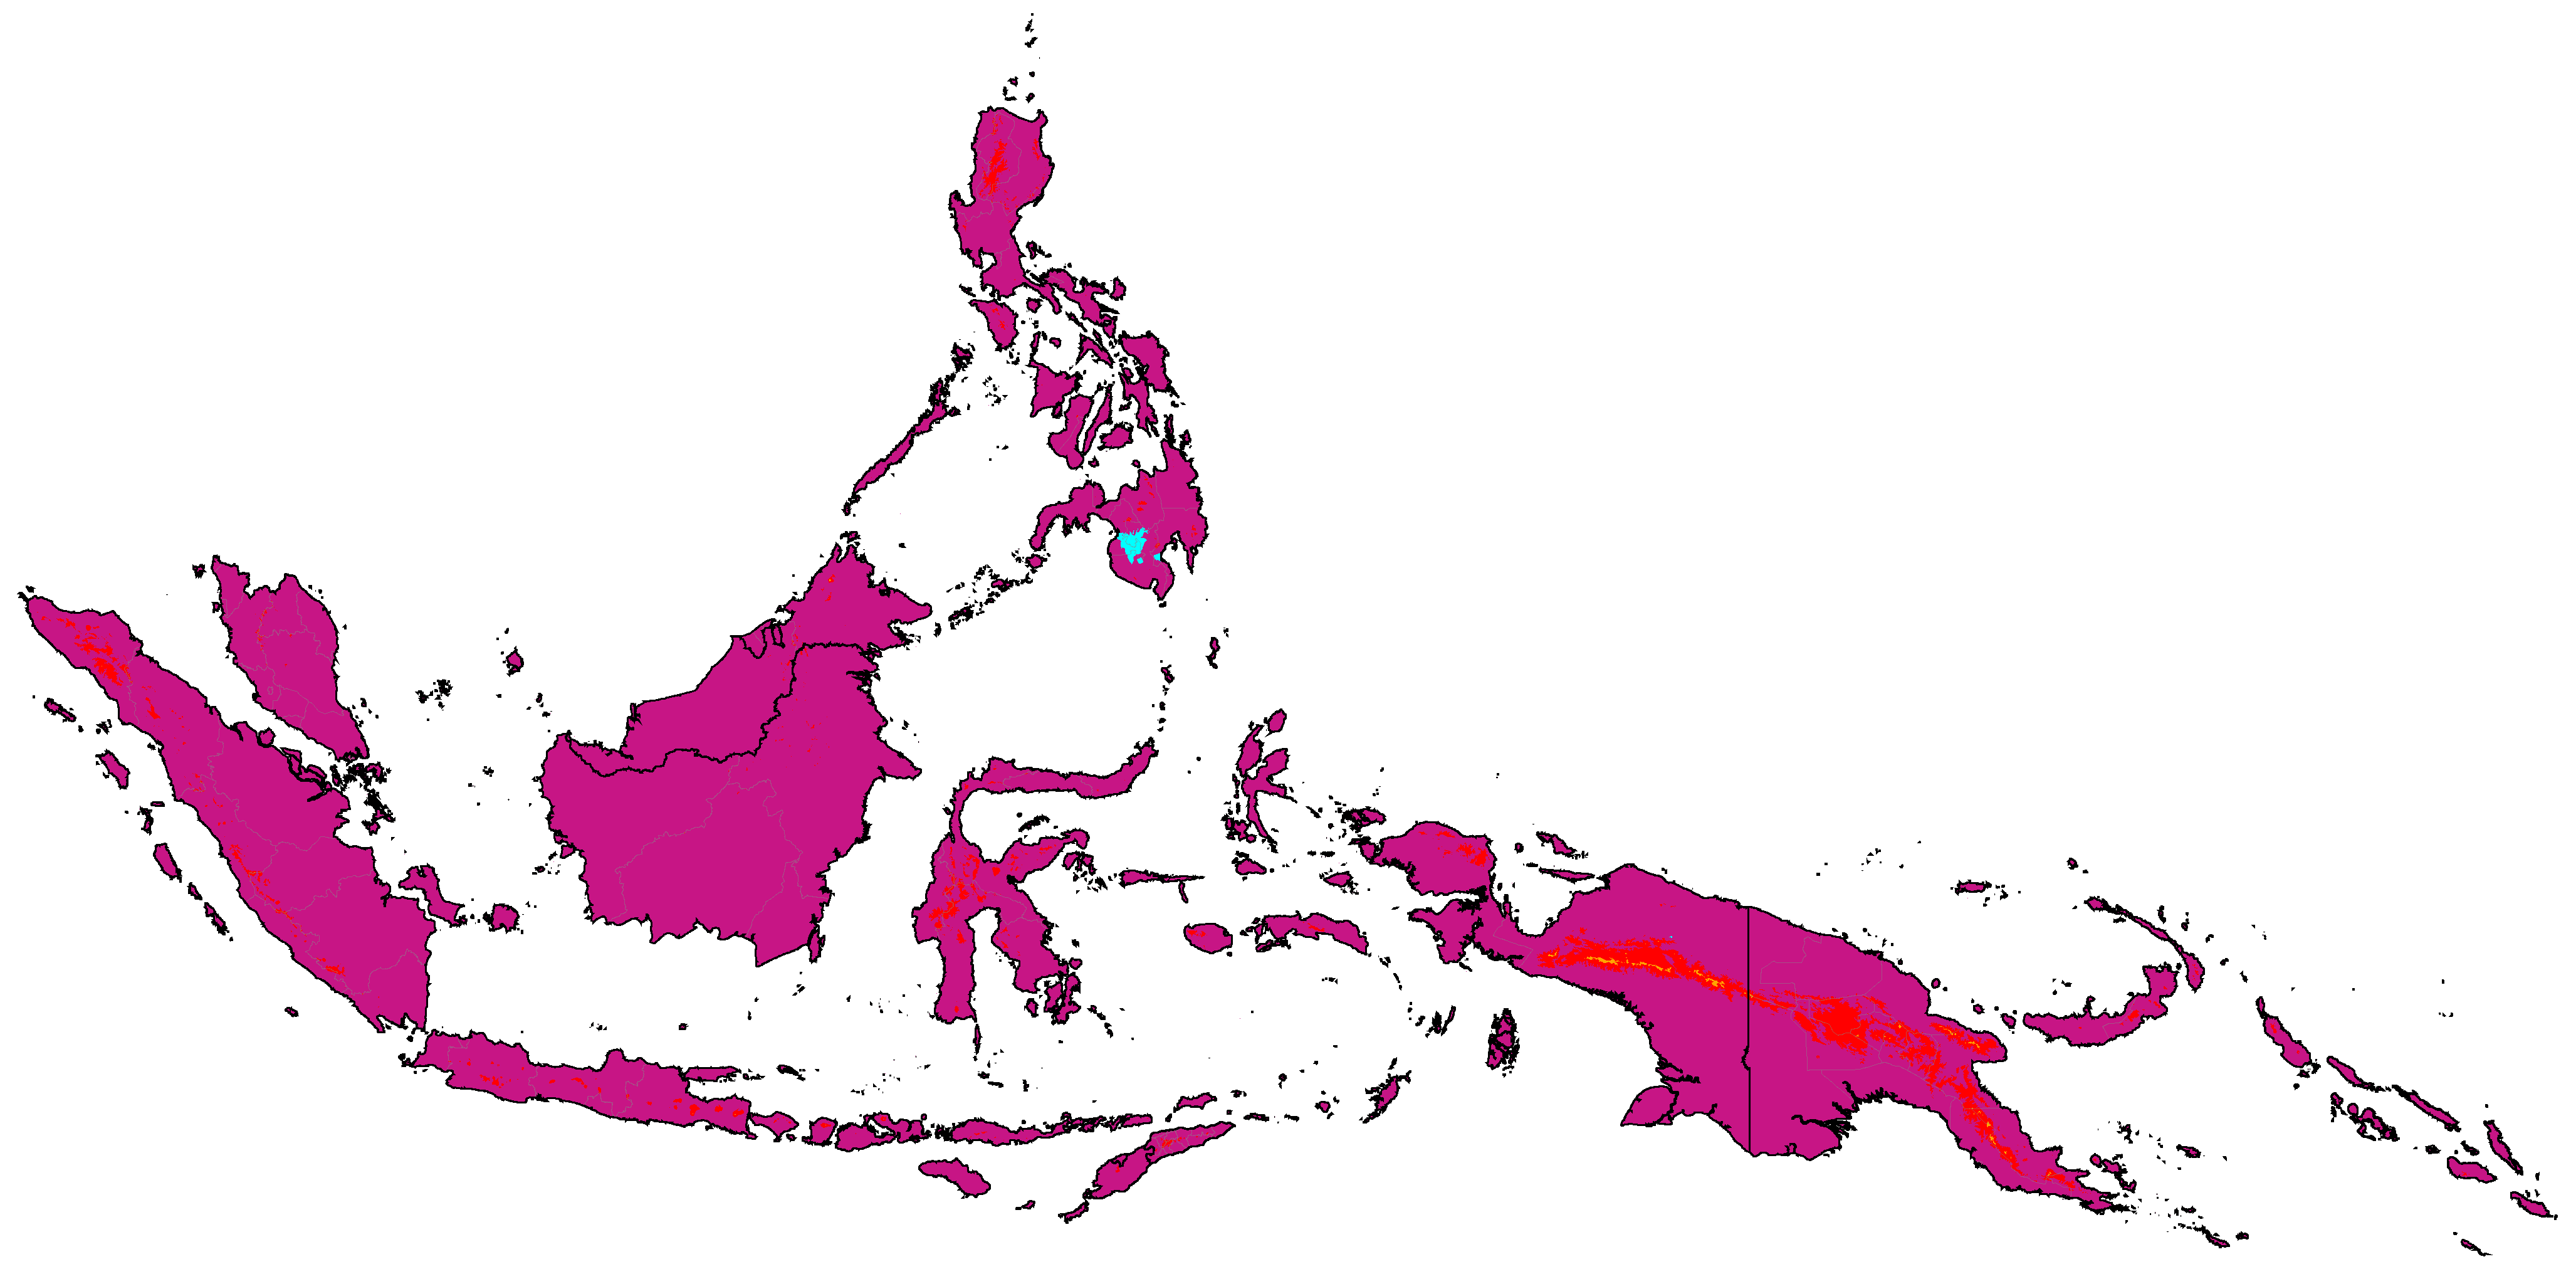
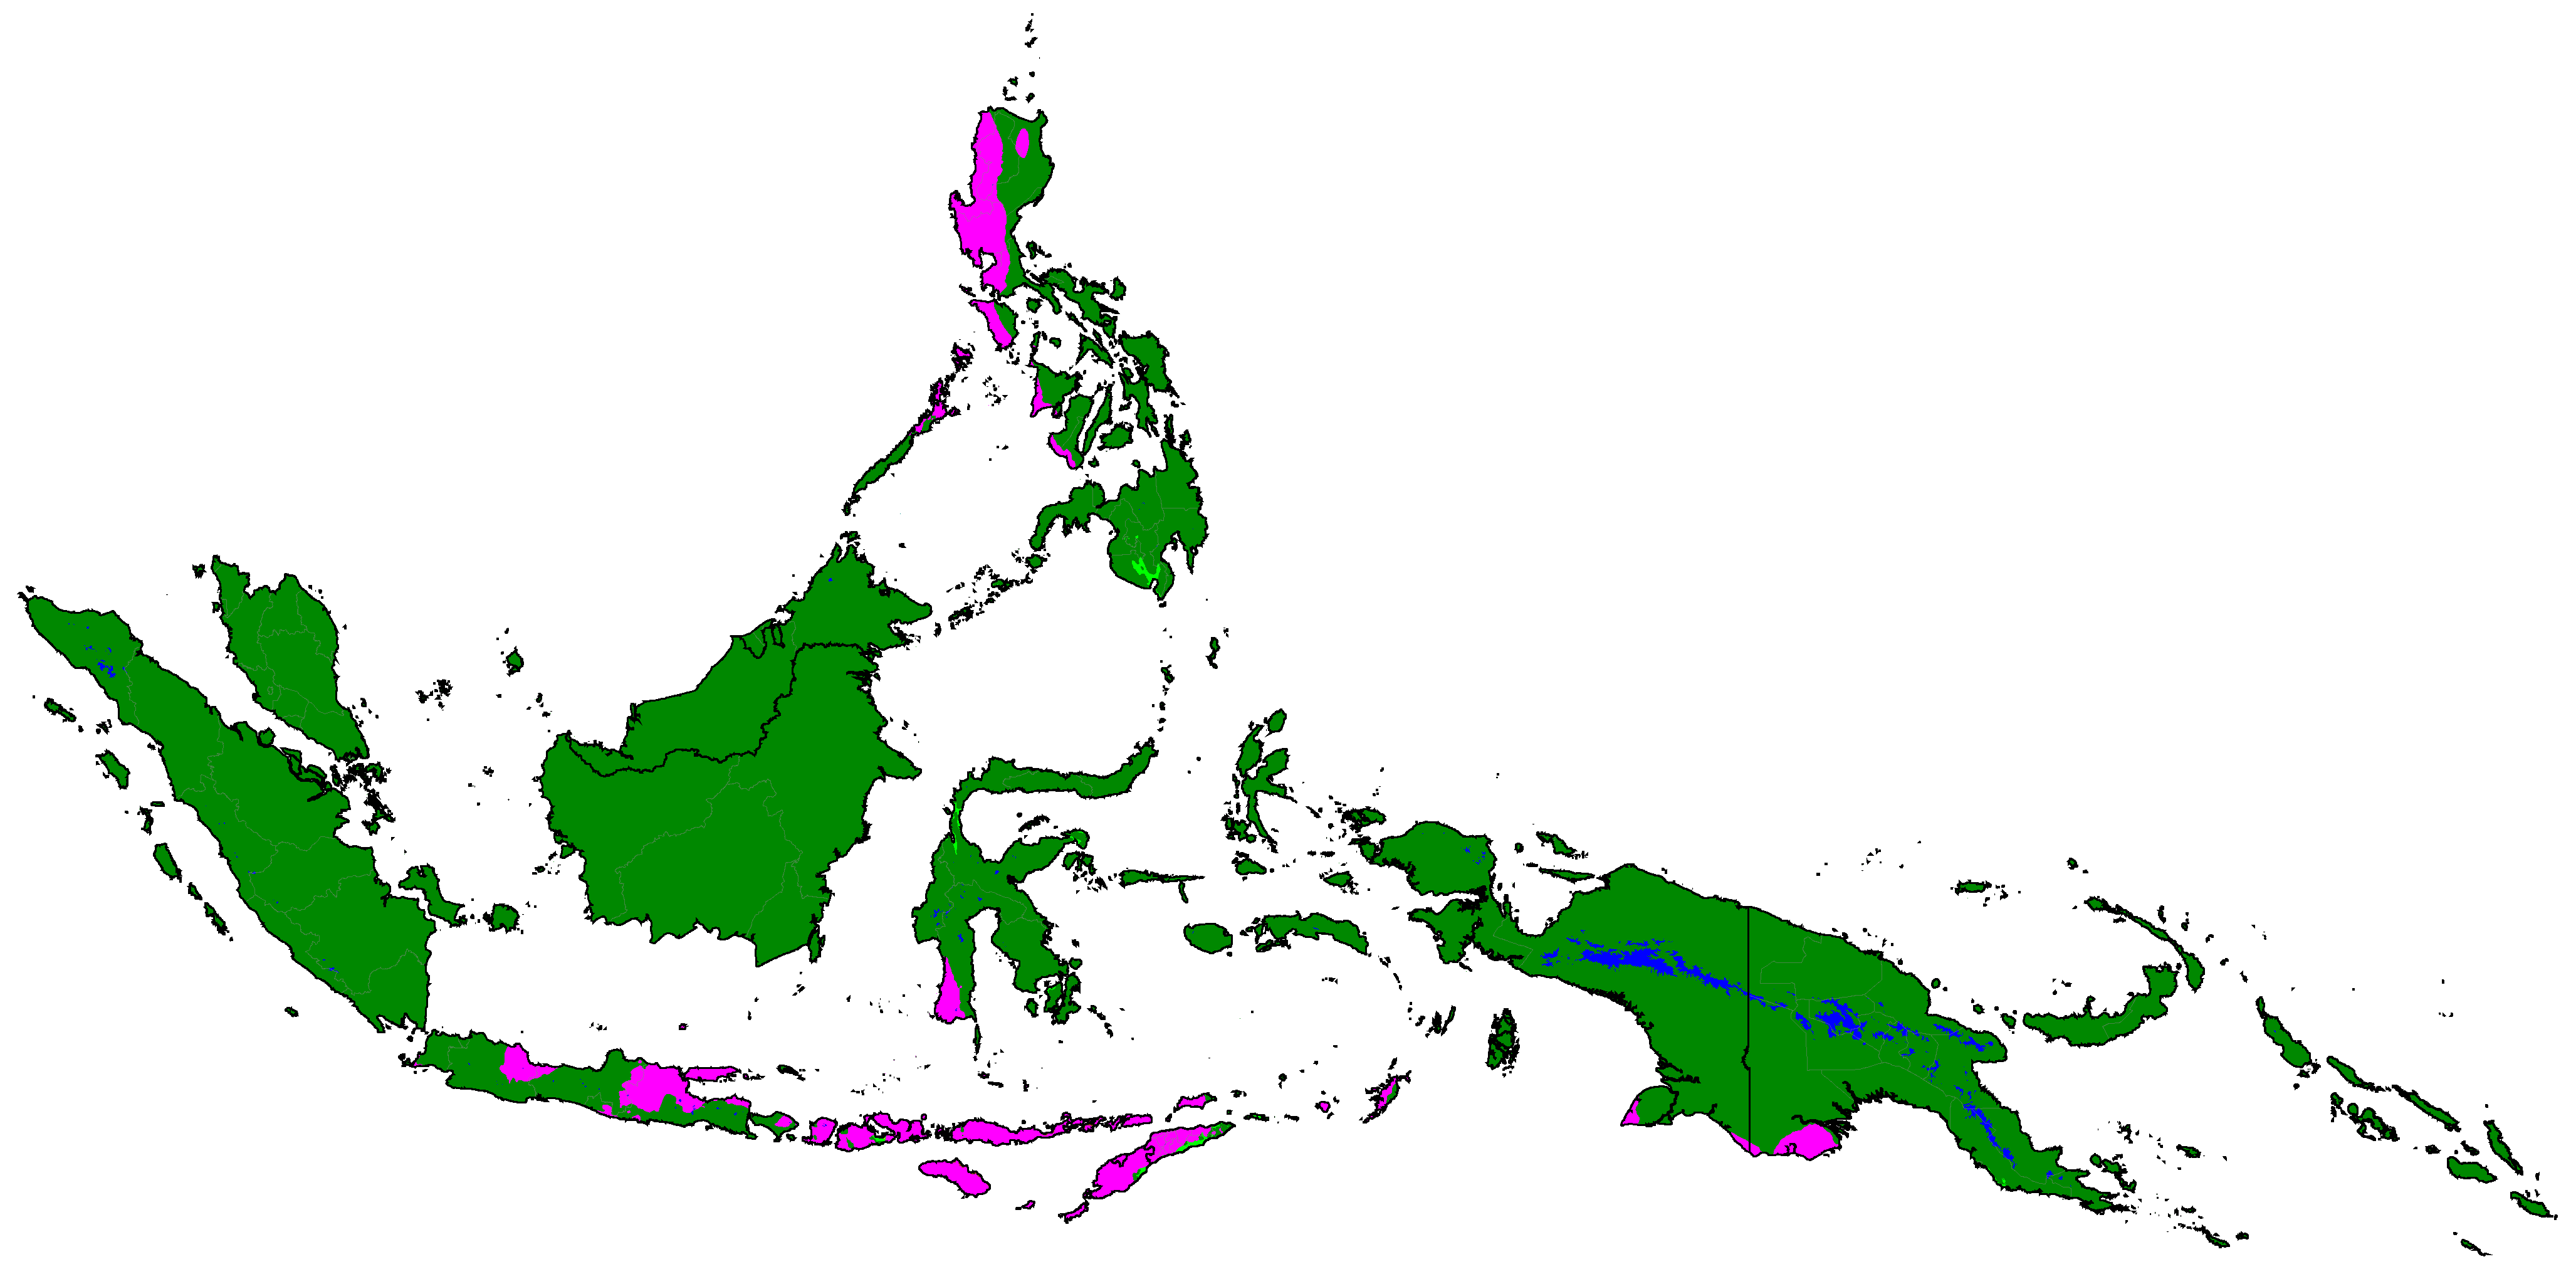
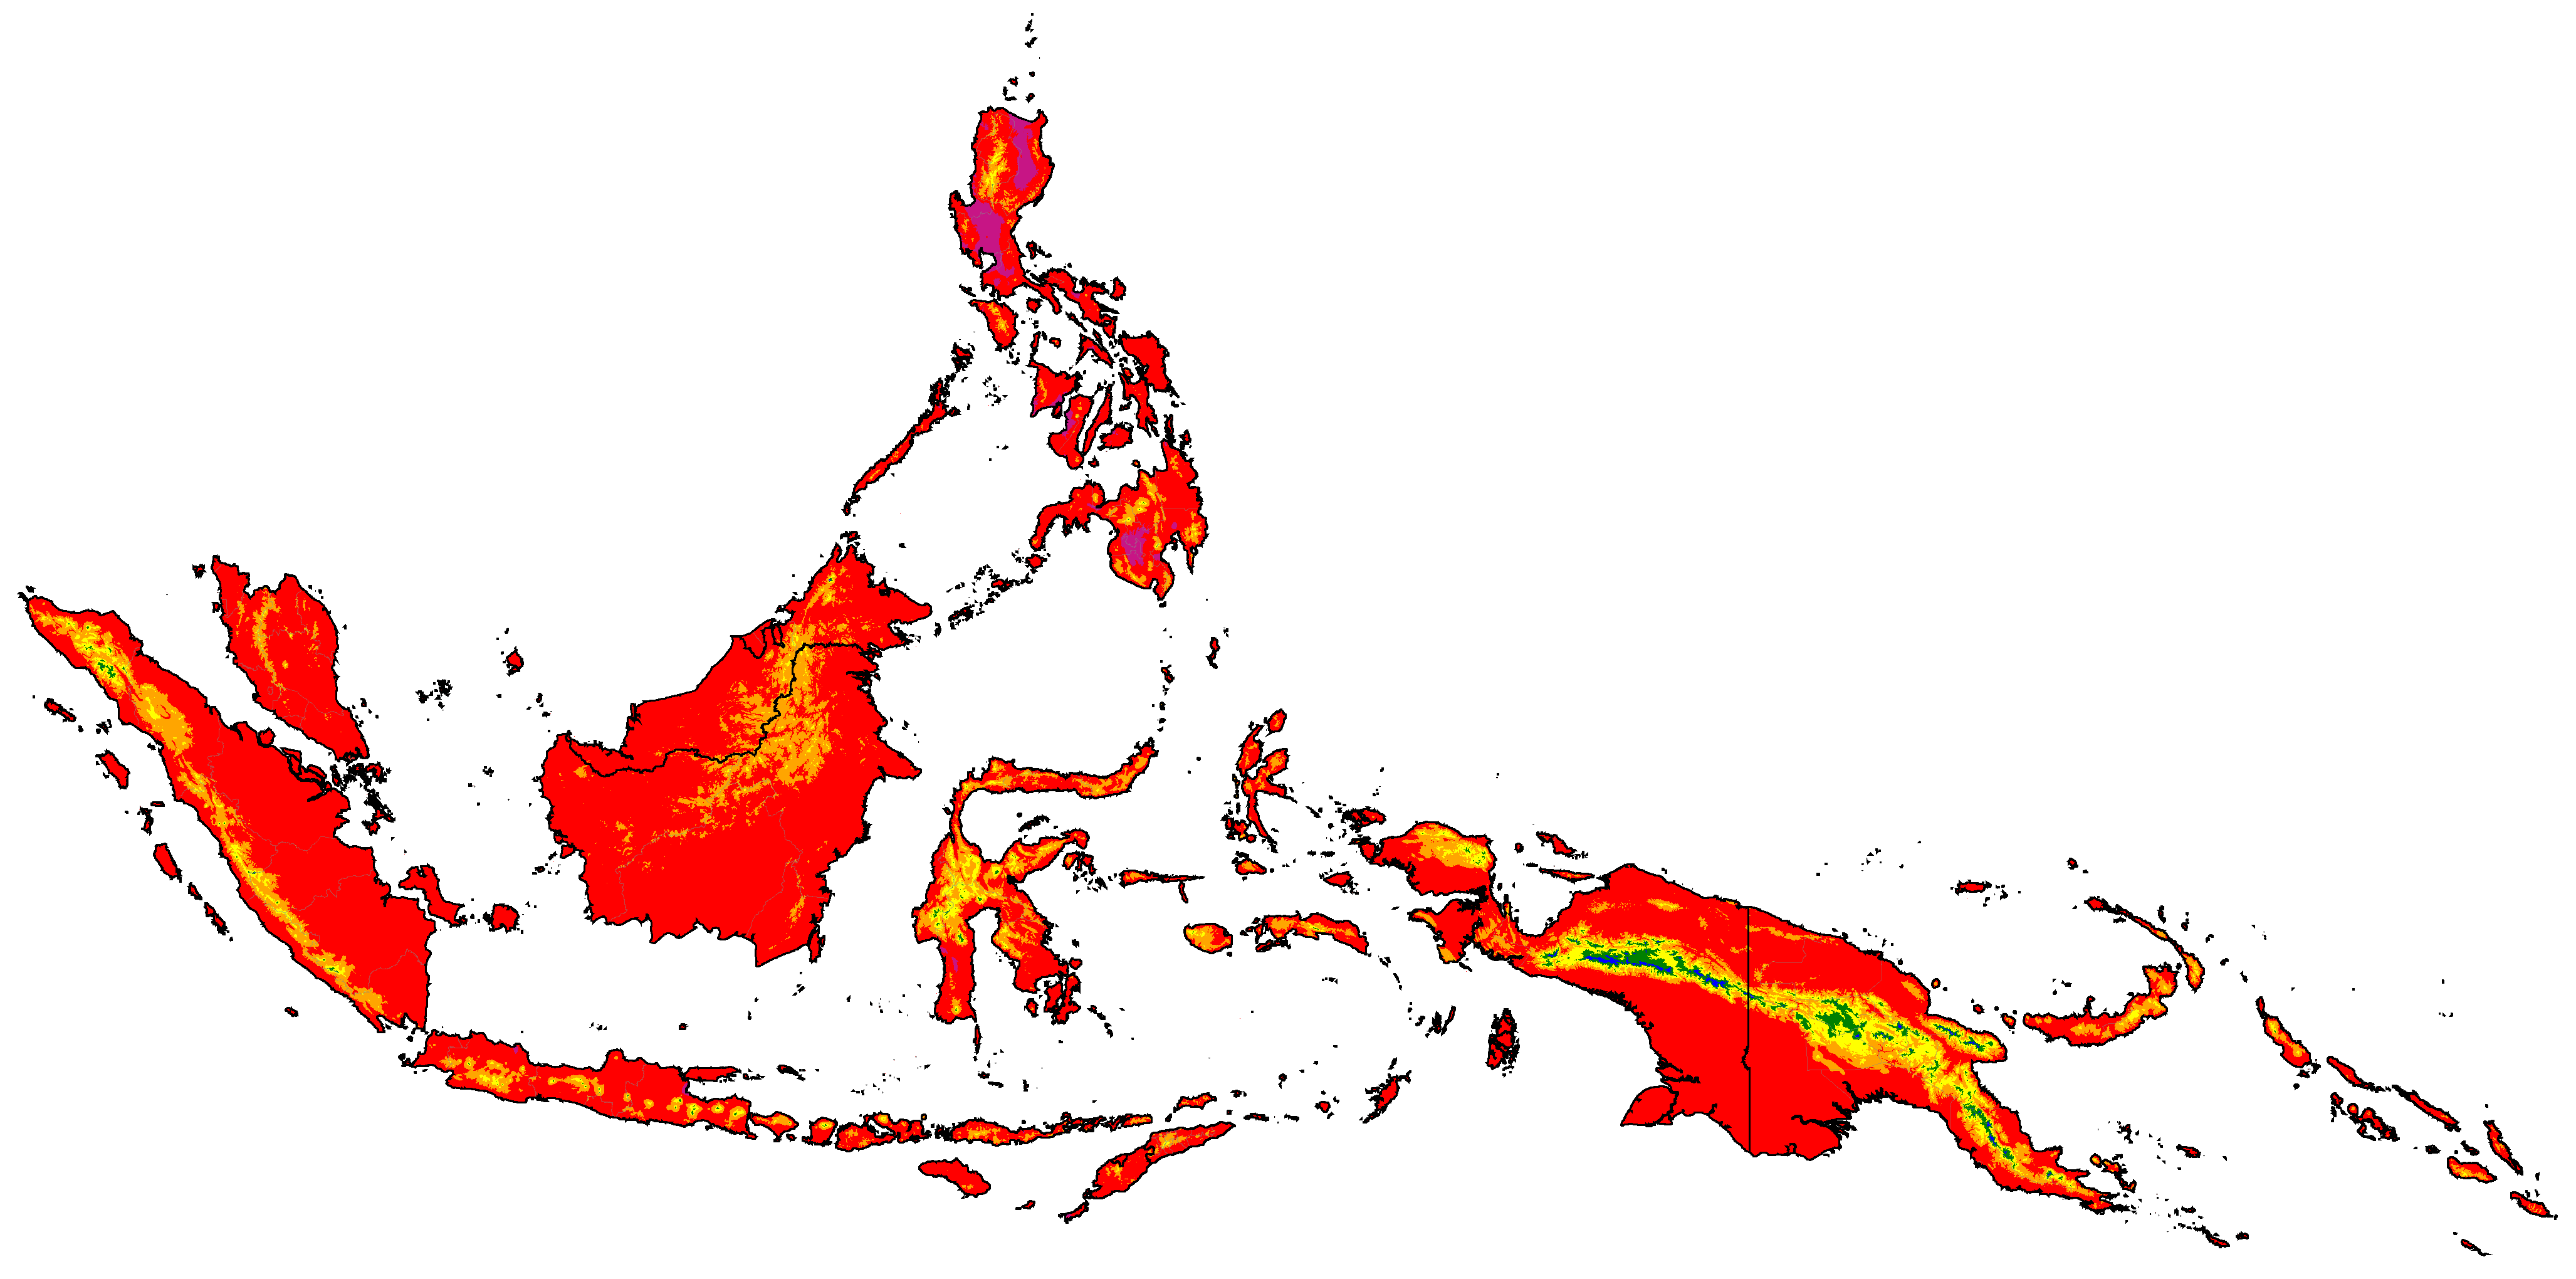
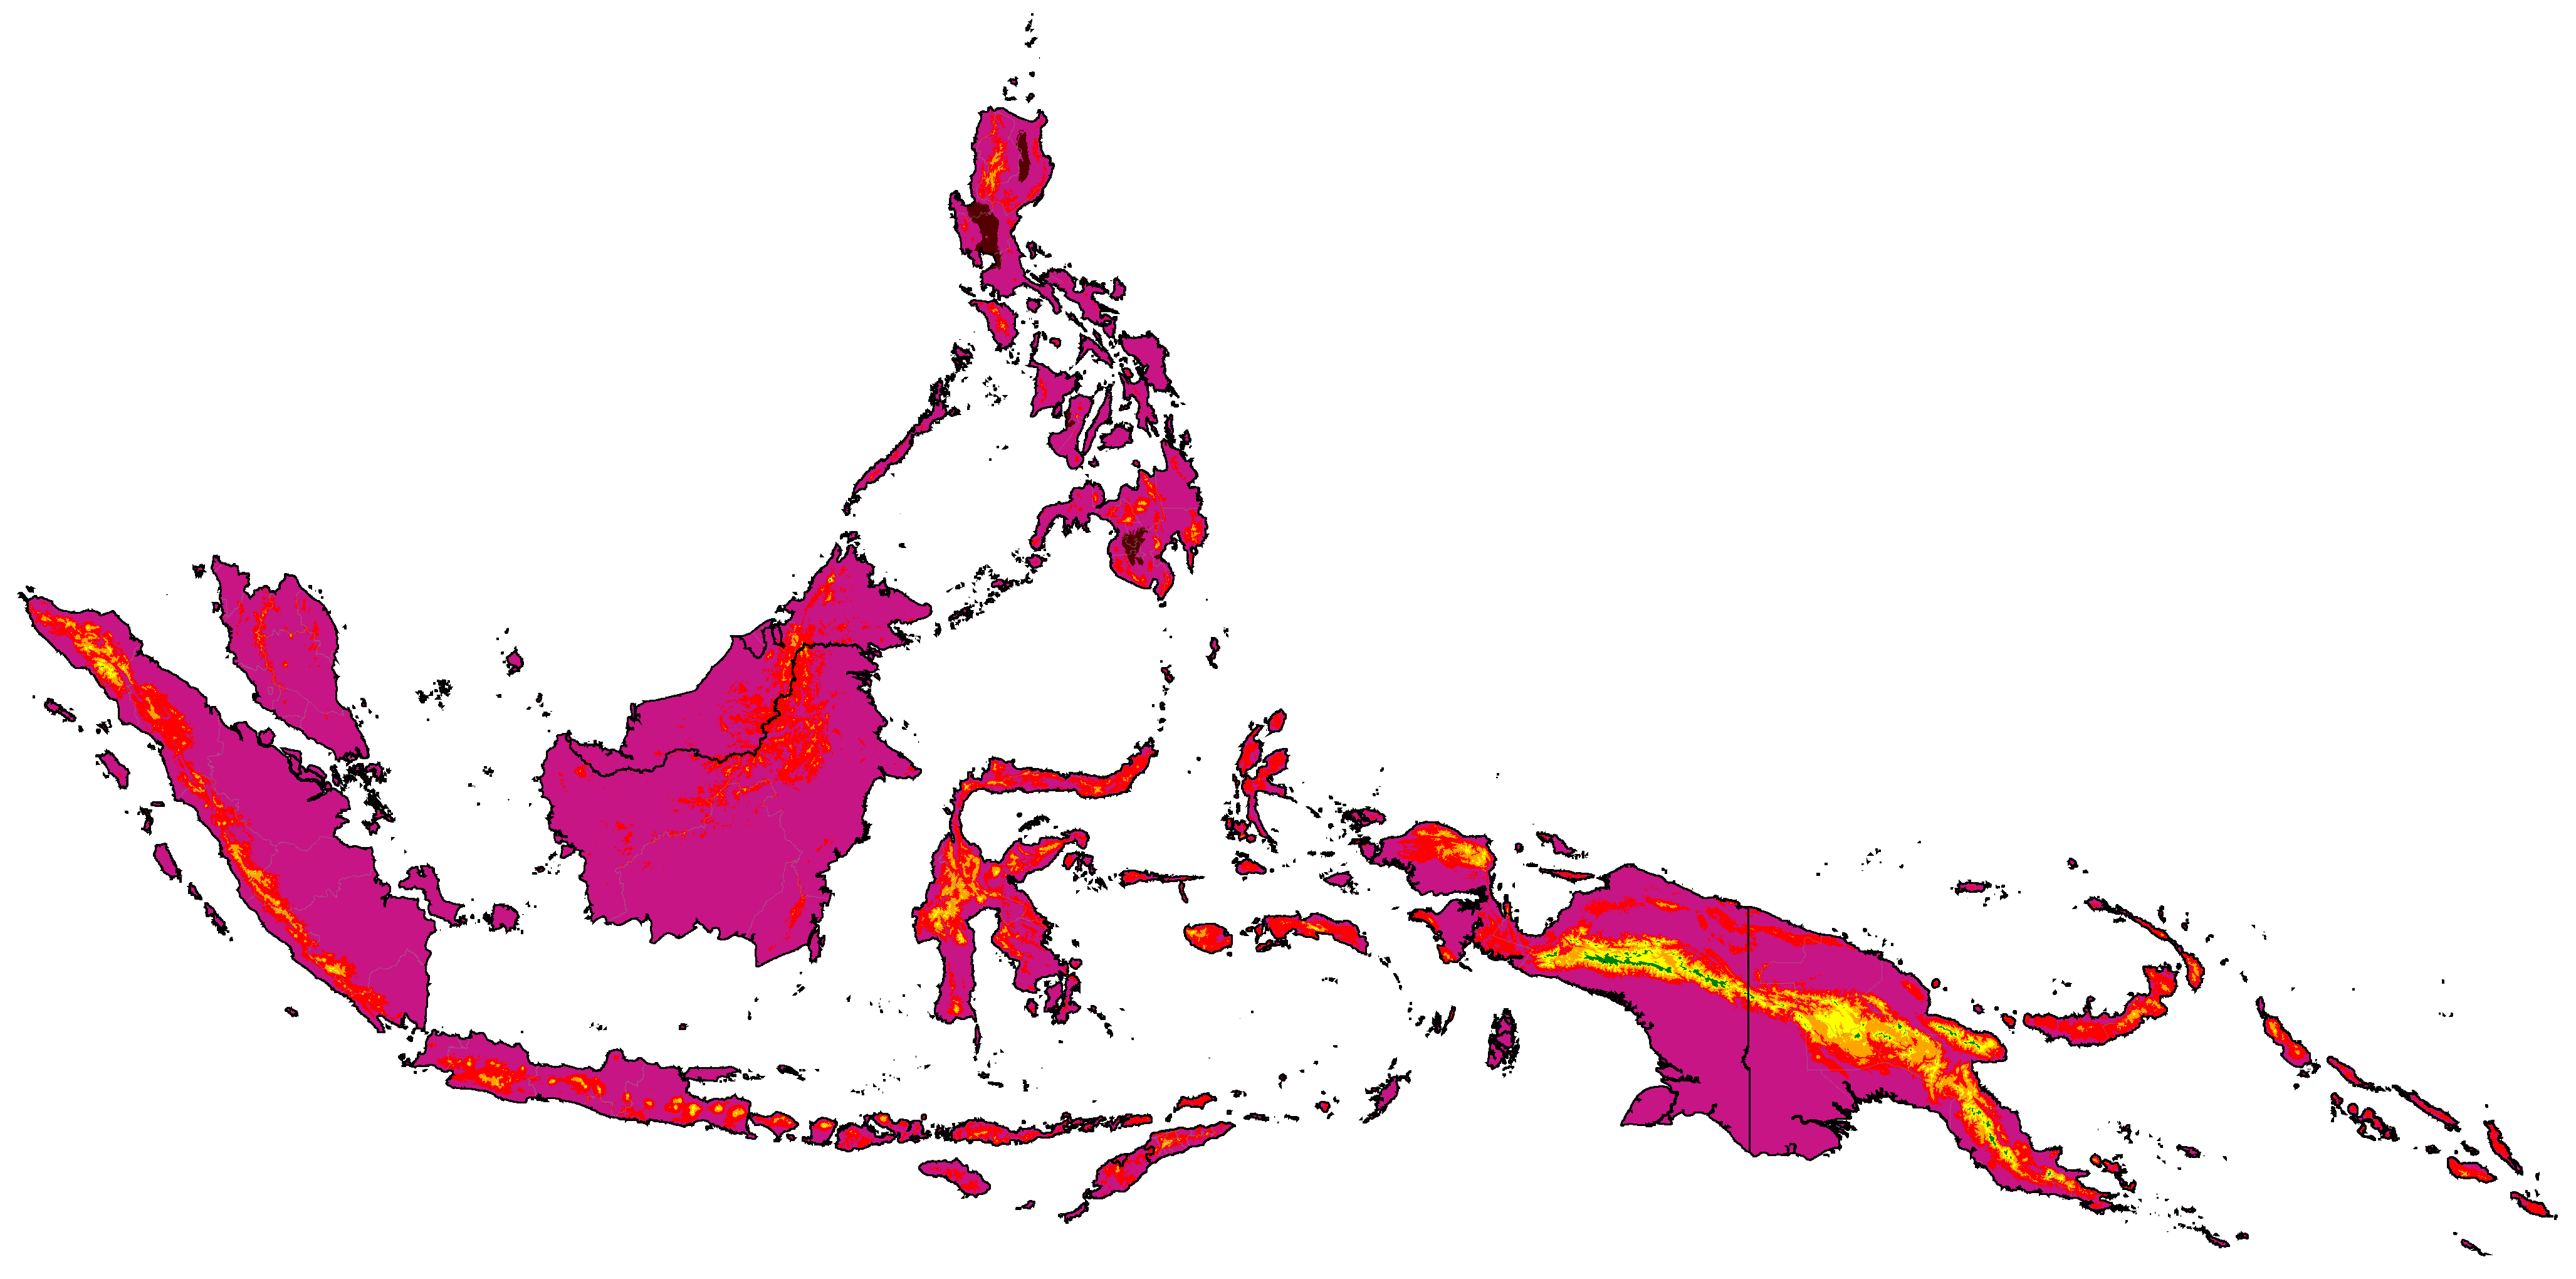
Maritime Southeast Asia distribution of winter categories (projections are SSP5-8.5 high emissions normals)

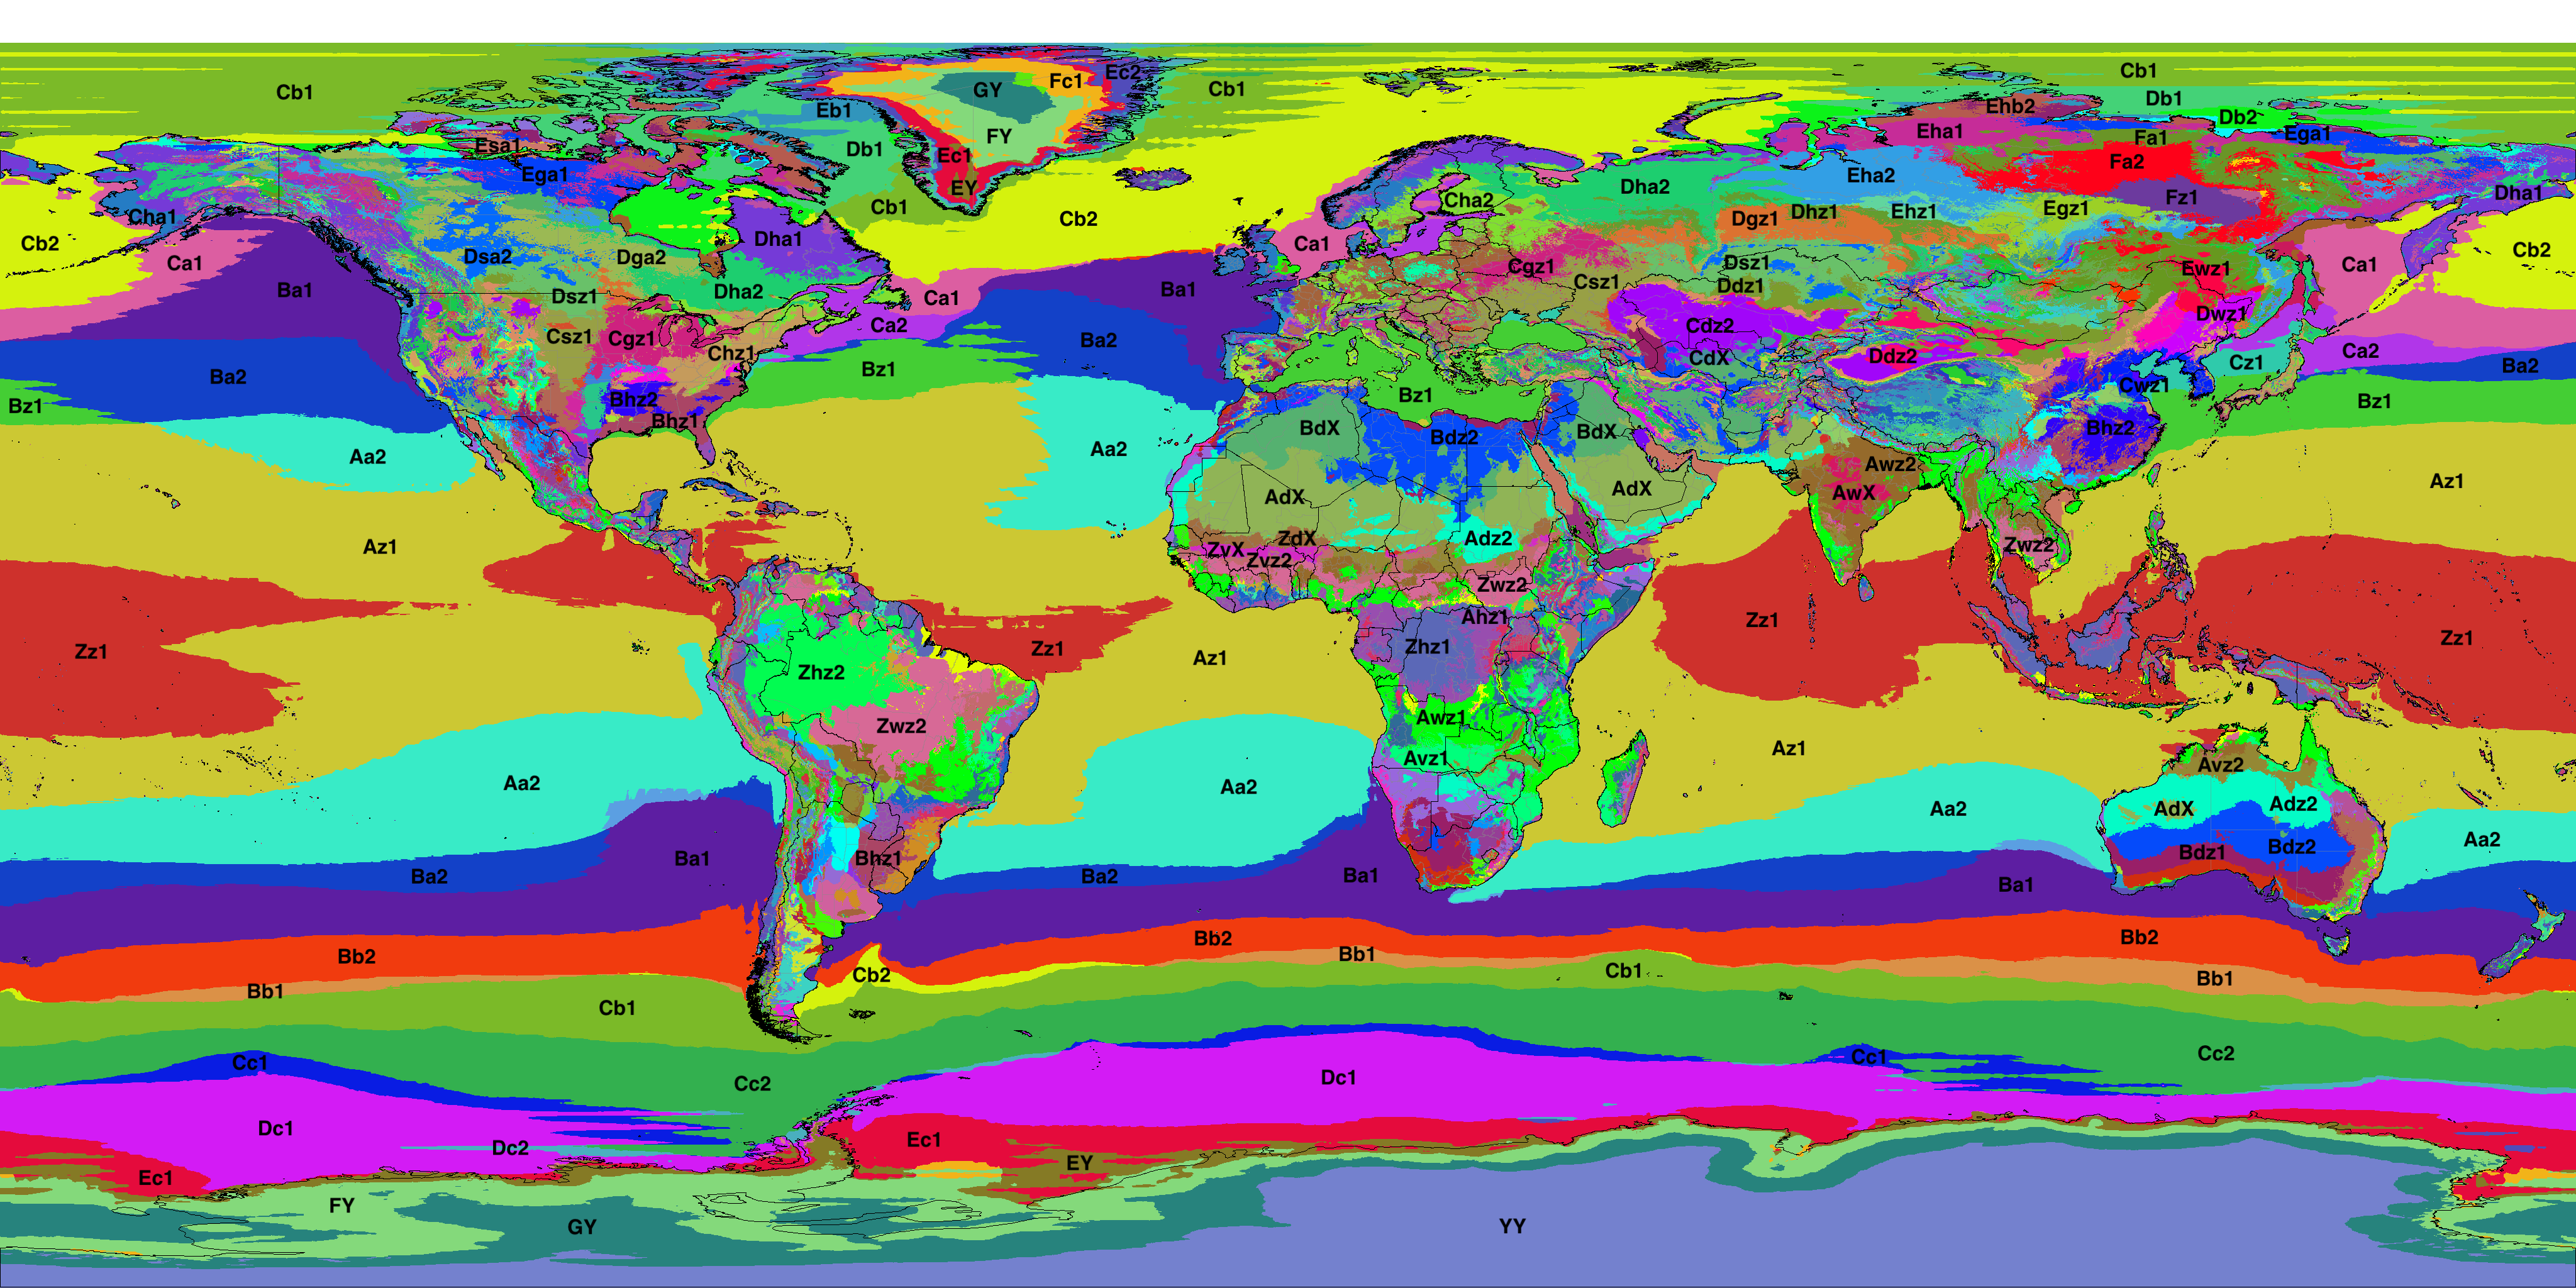
Global distribution of aridity categories (projections are SSP5-8.5 high emissions normals)


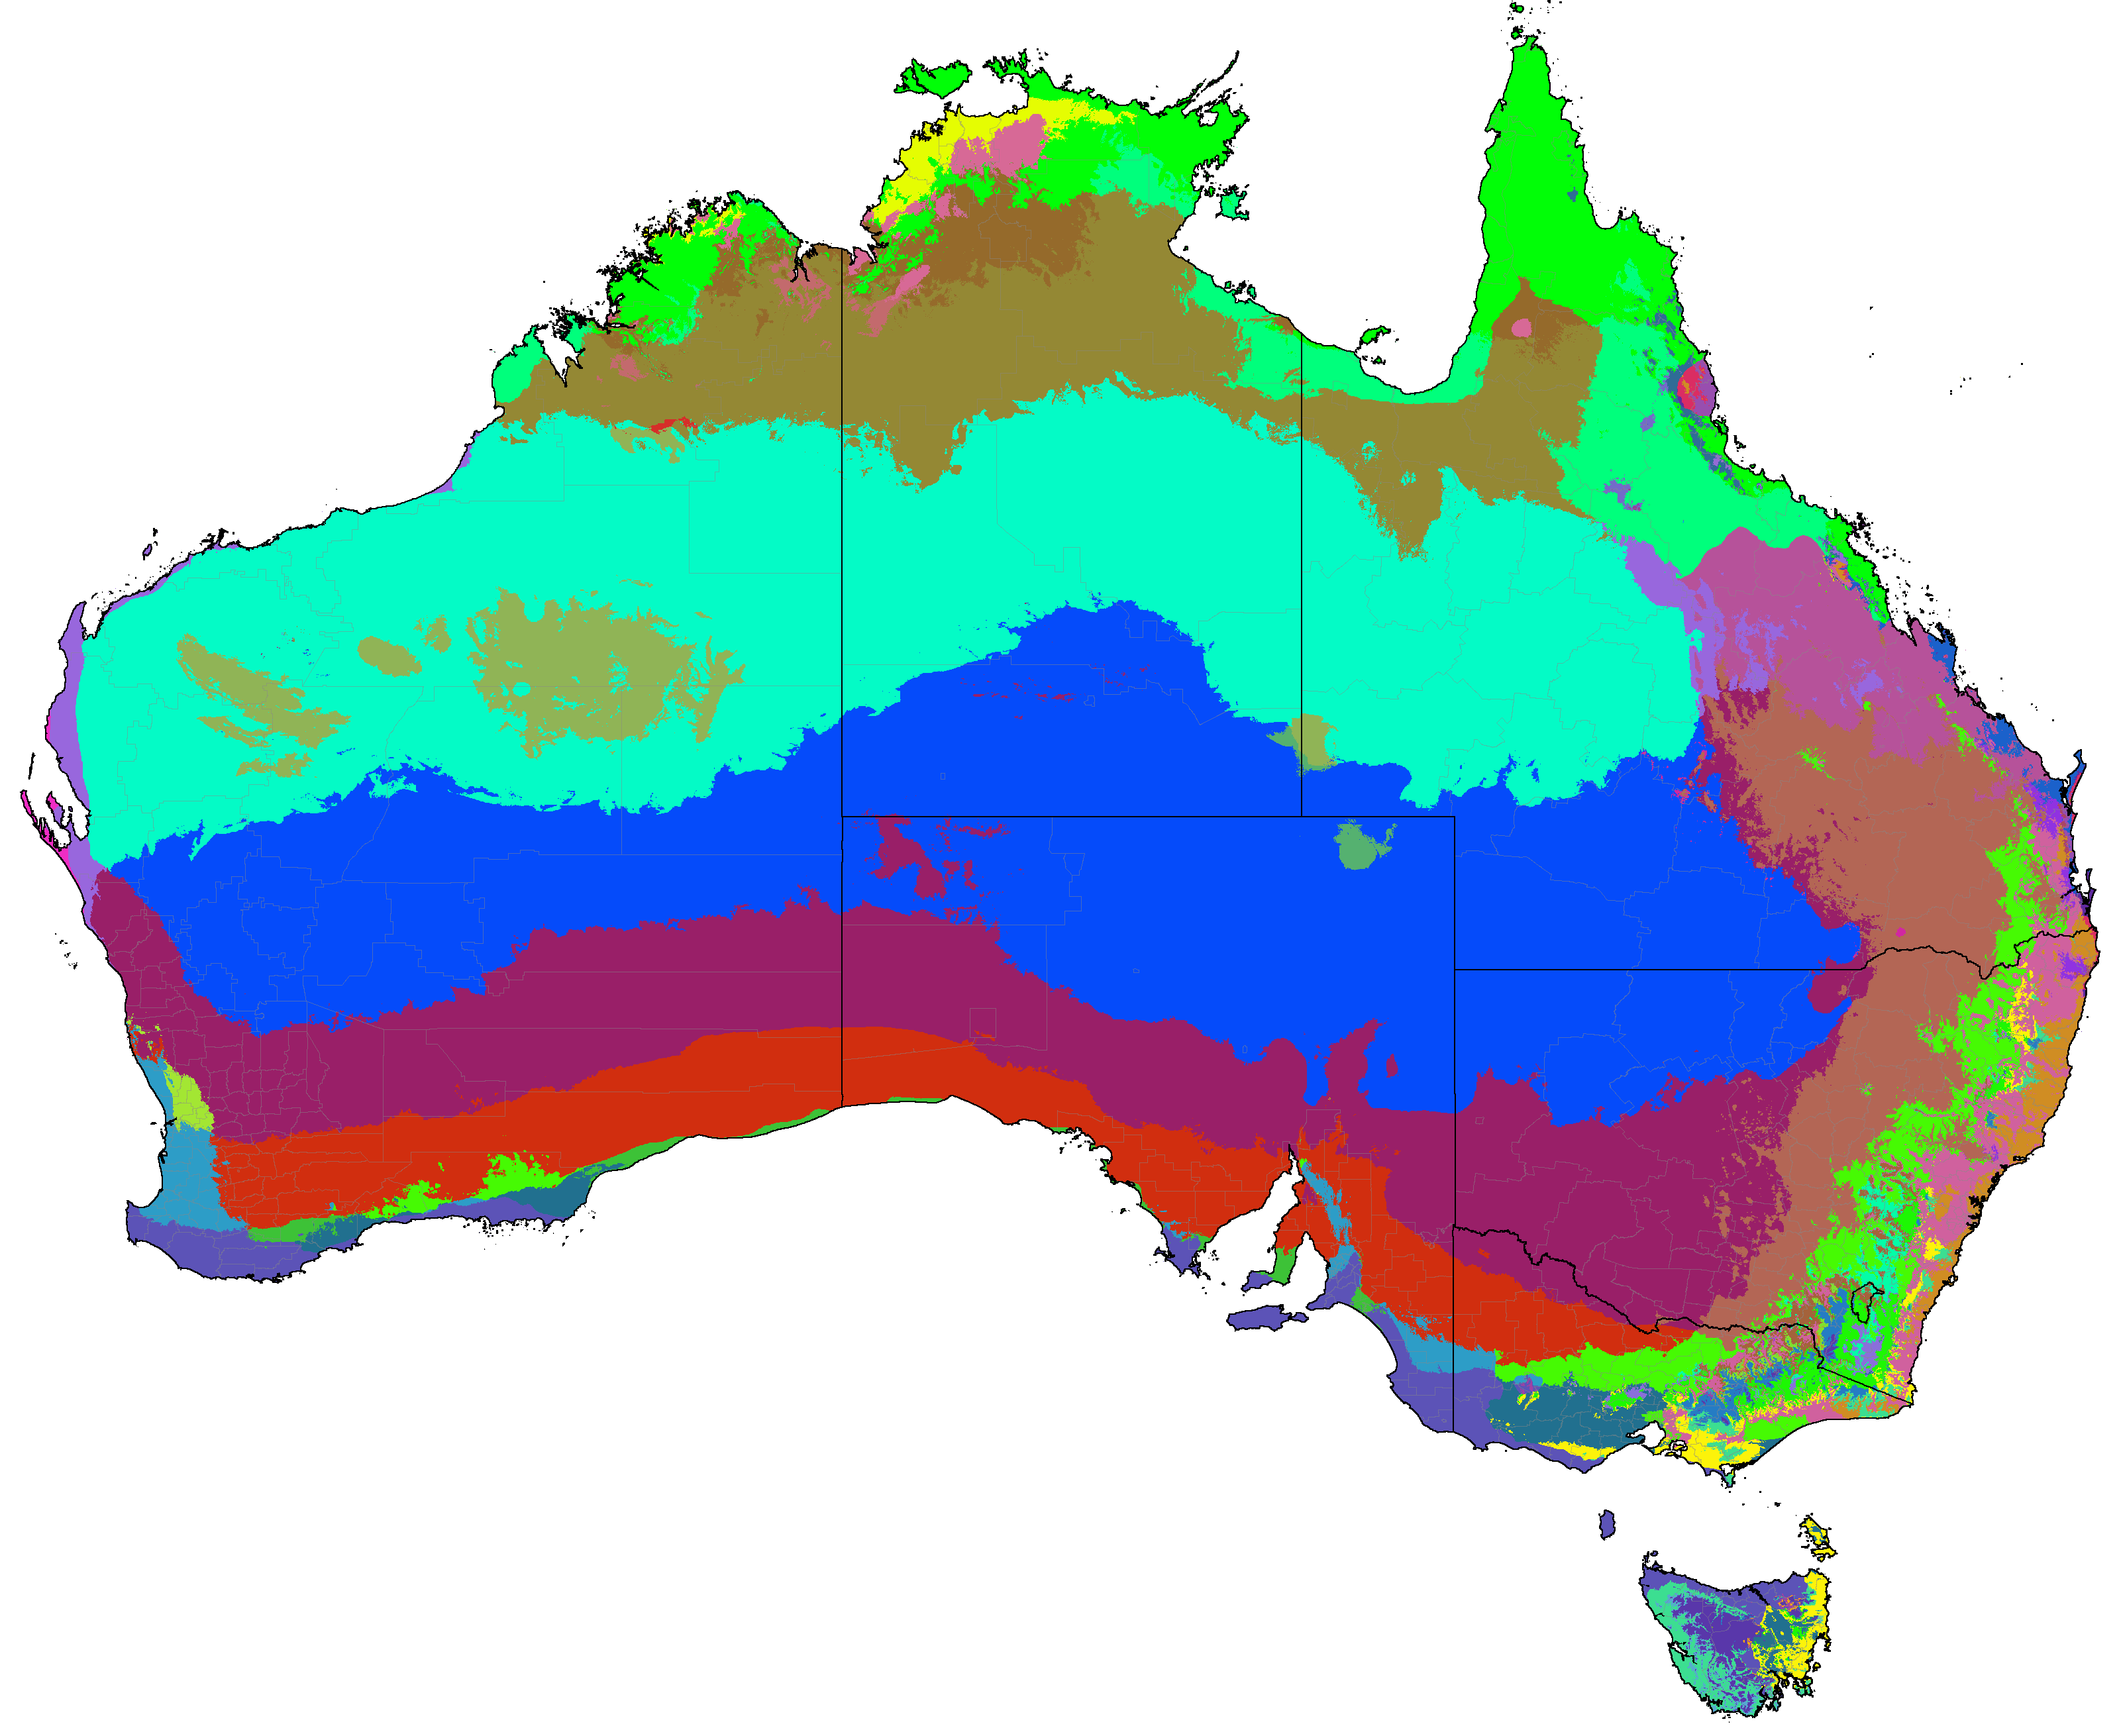
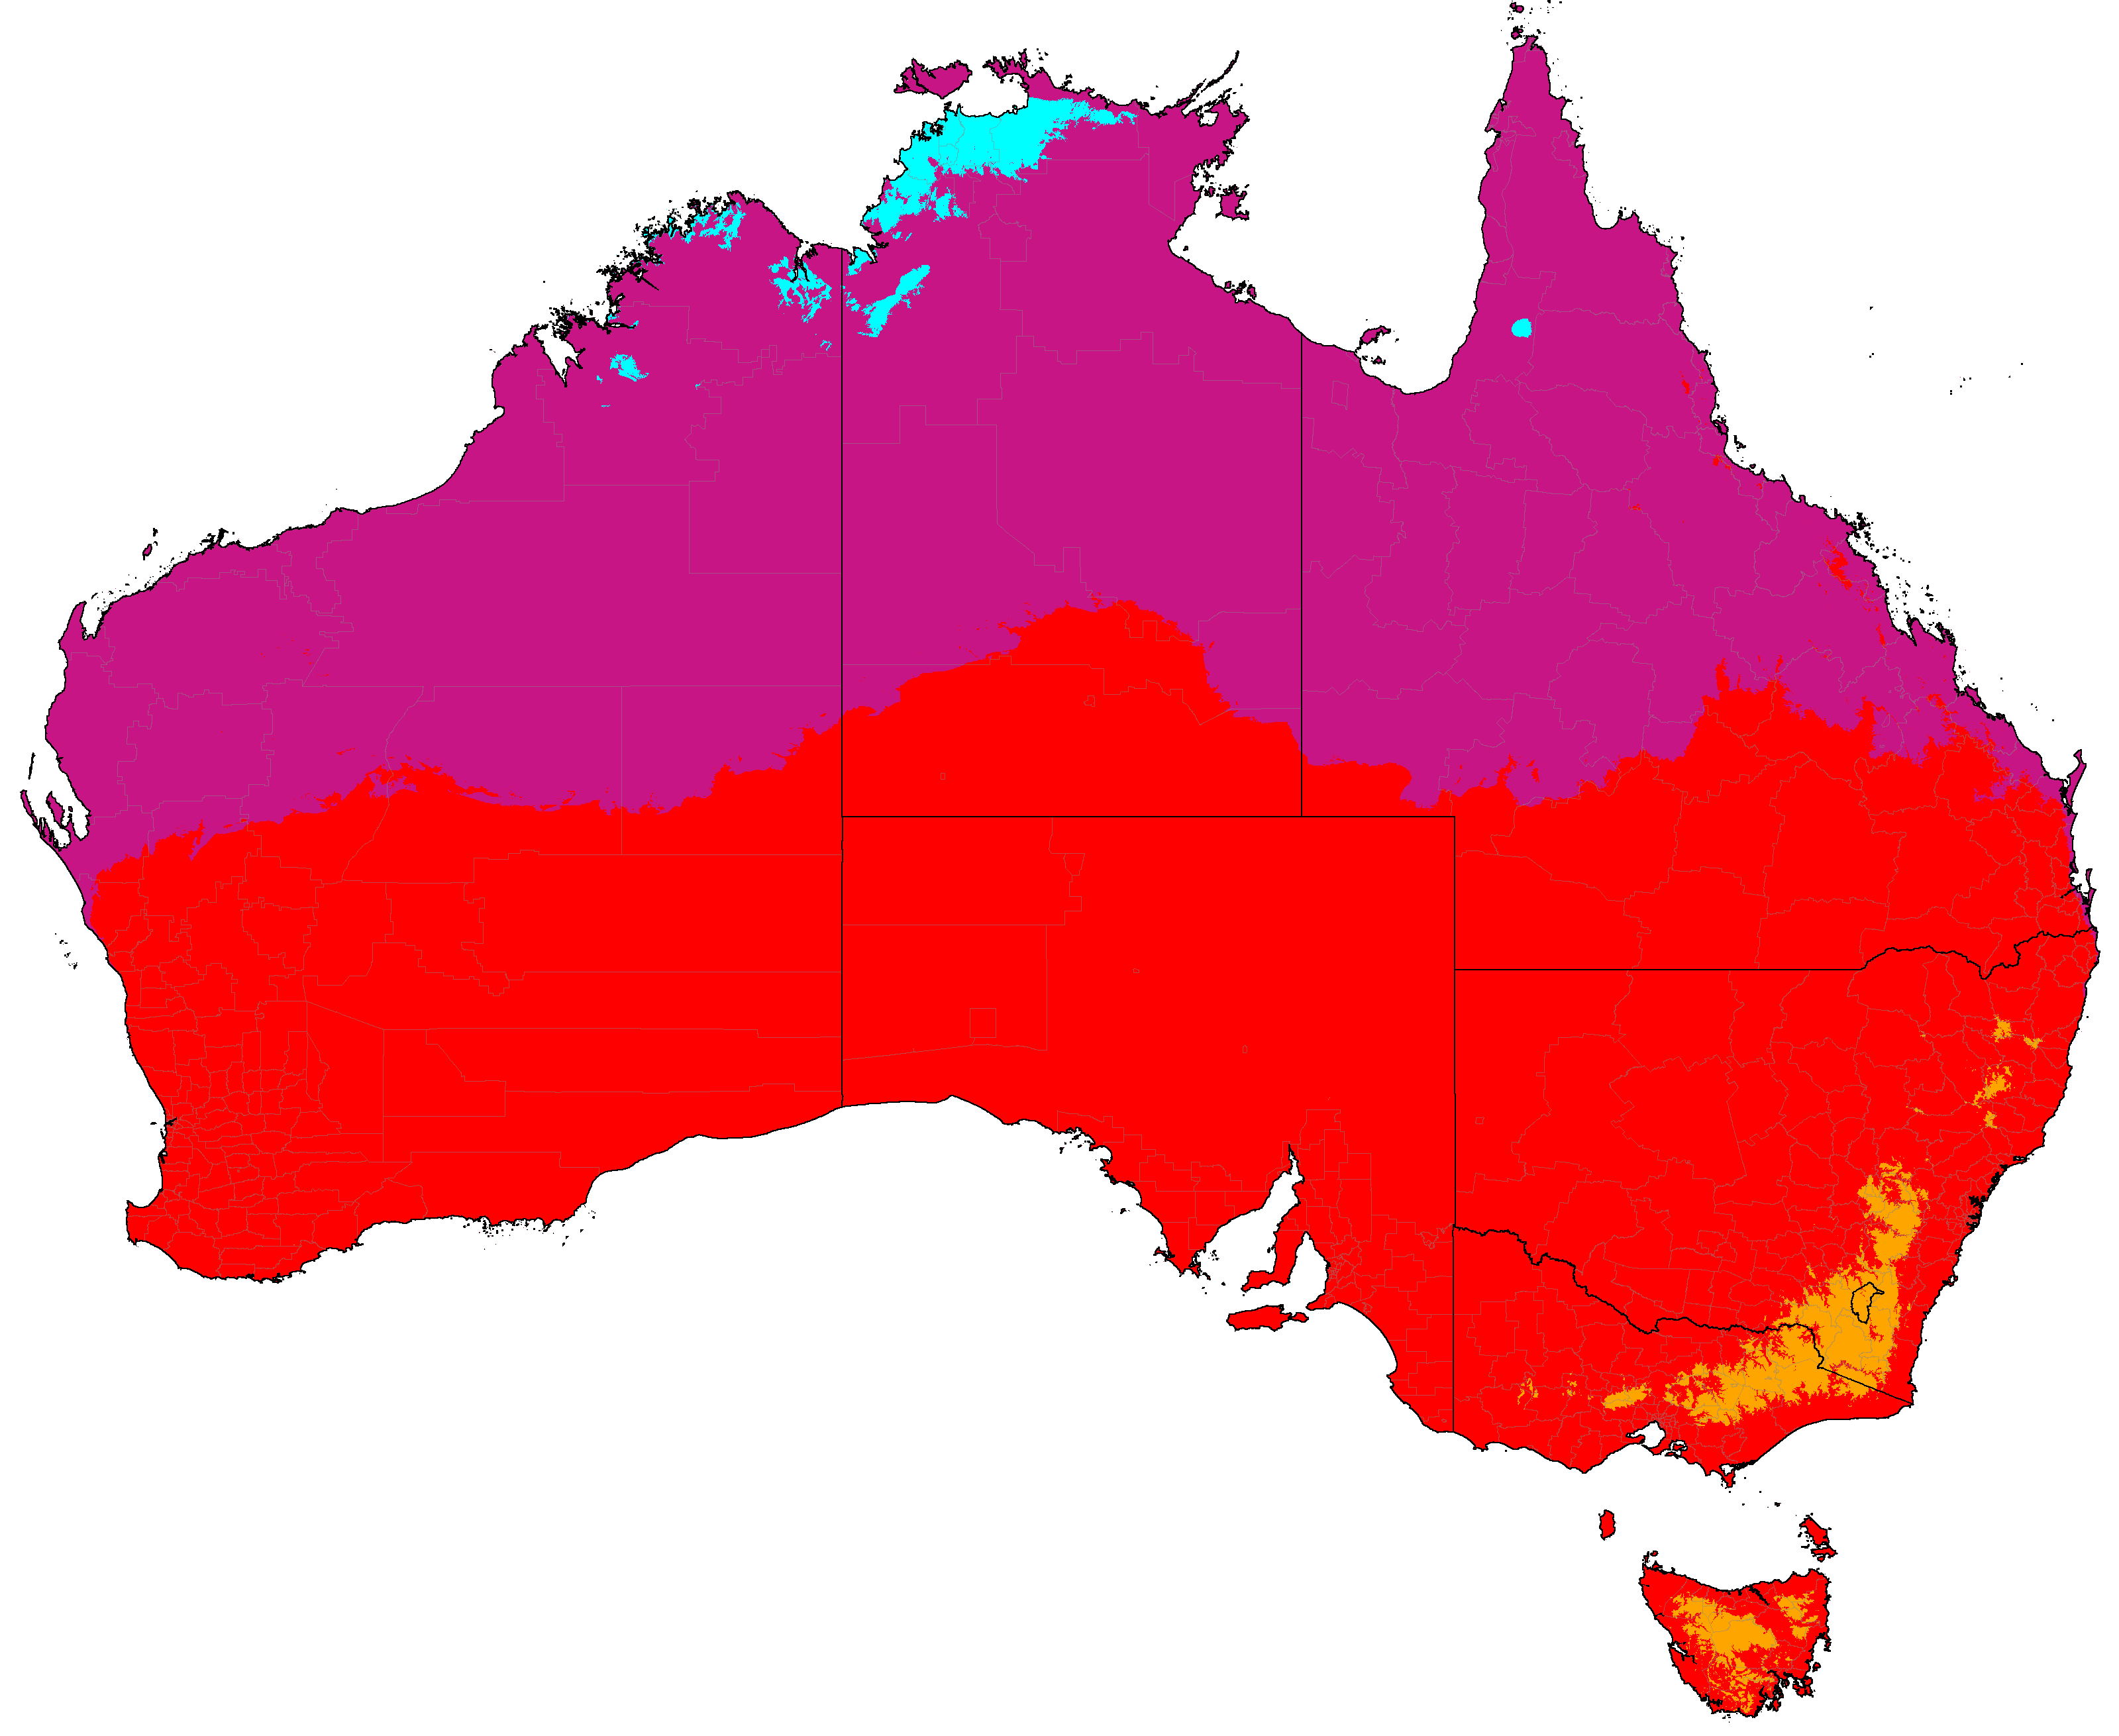
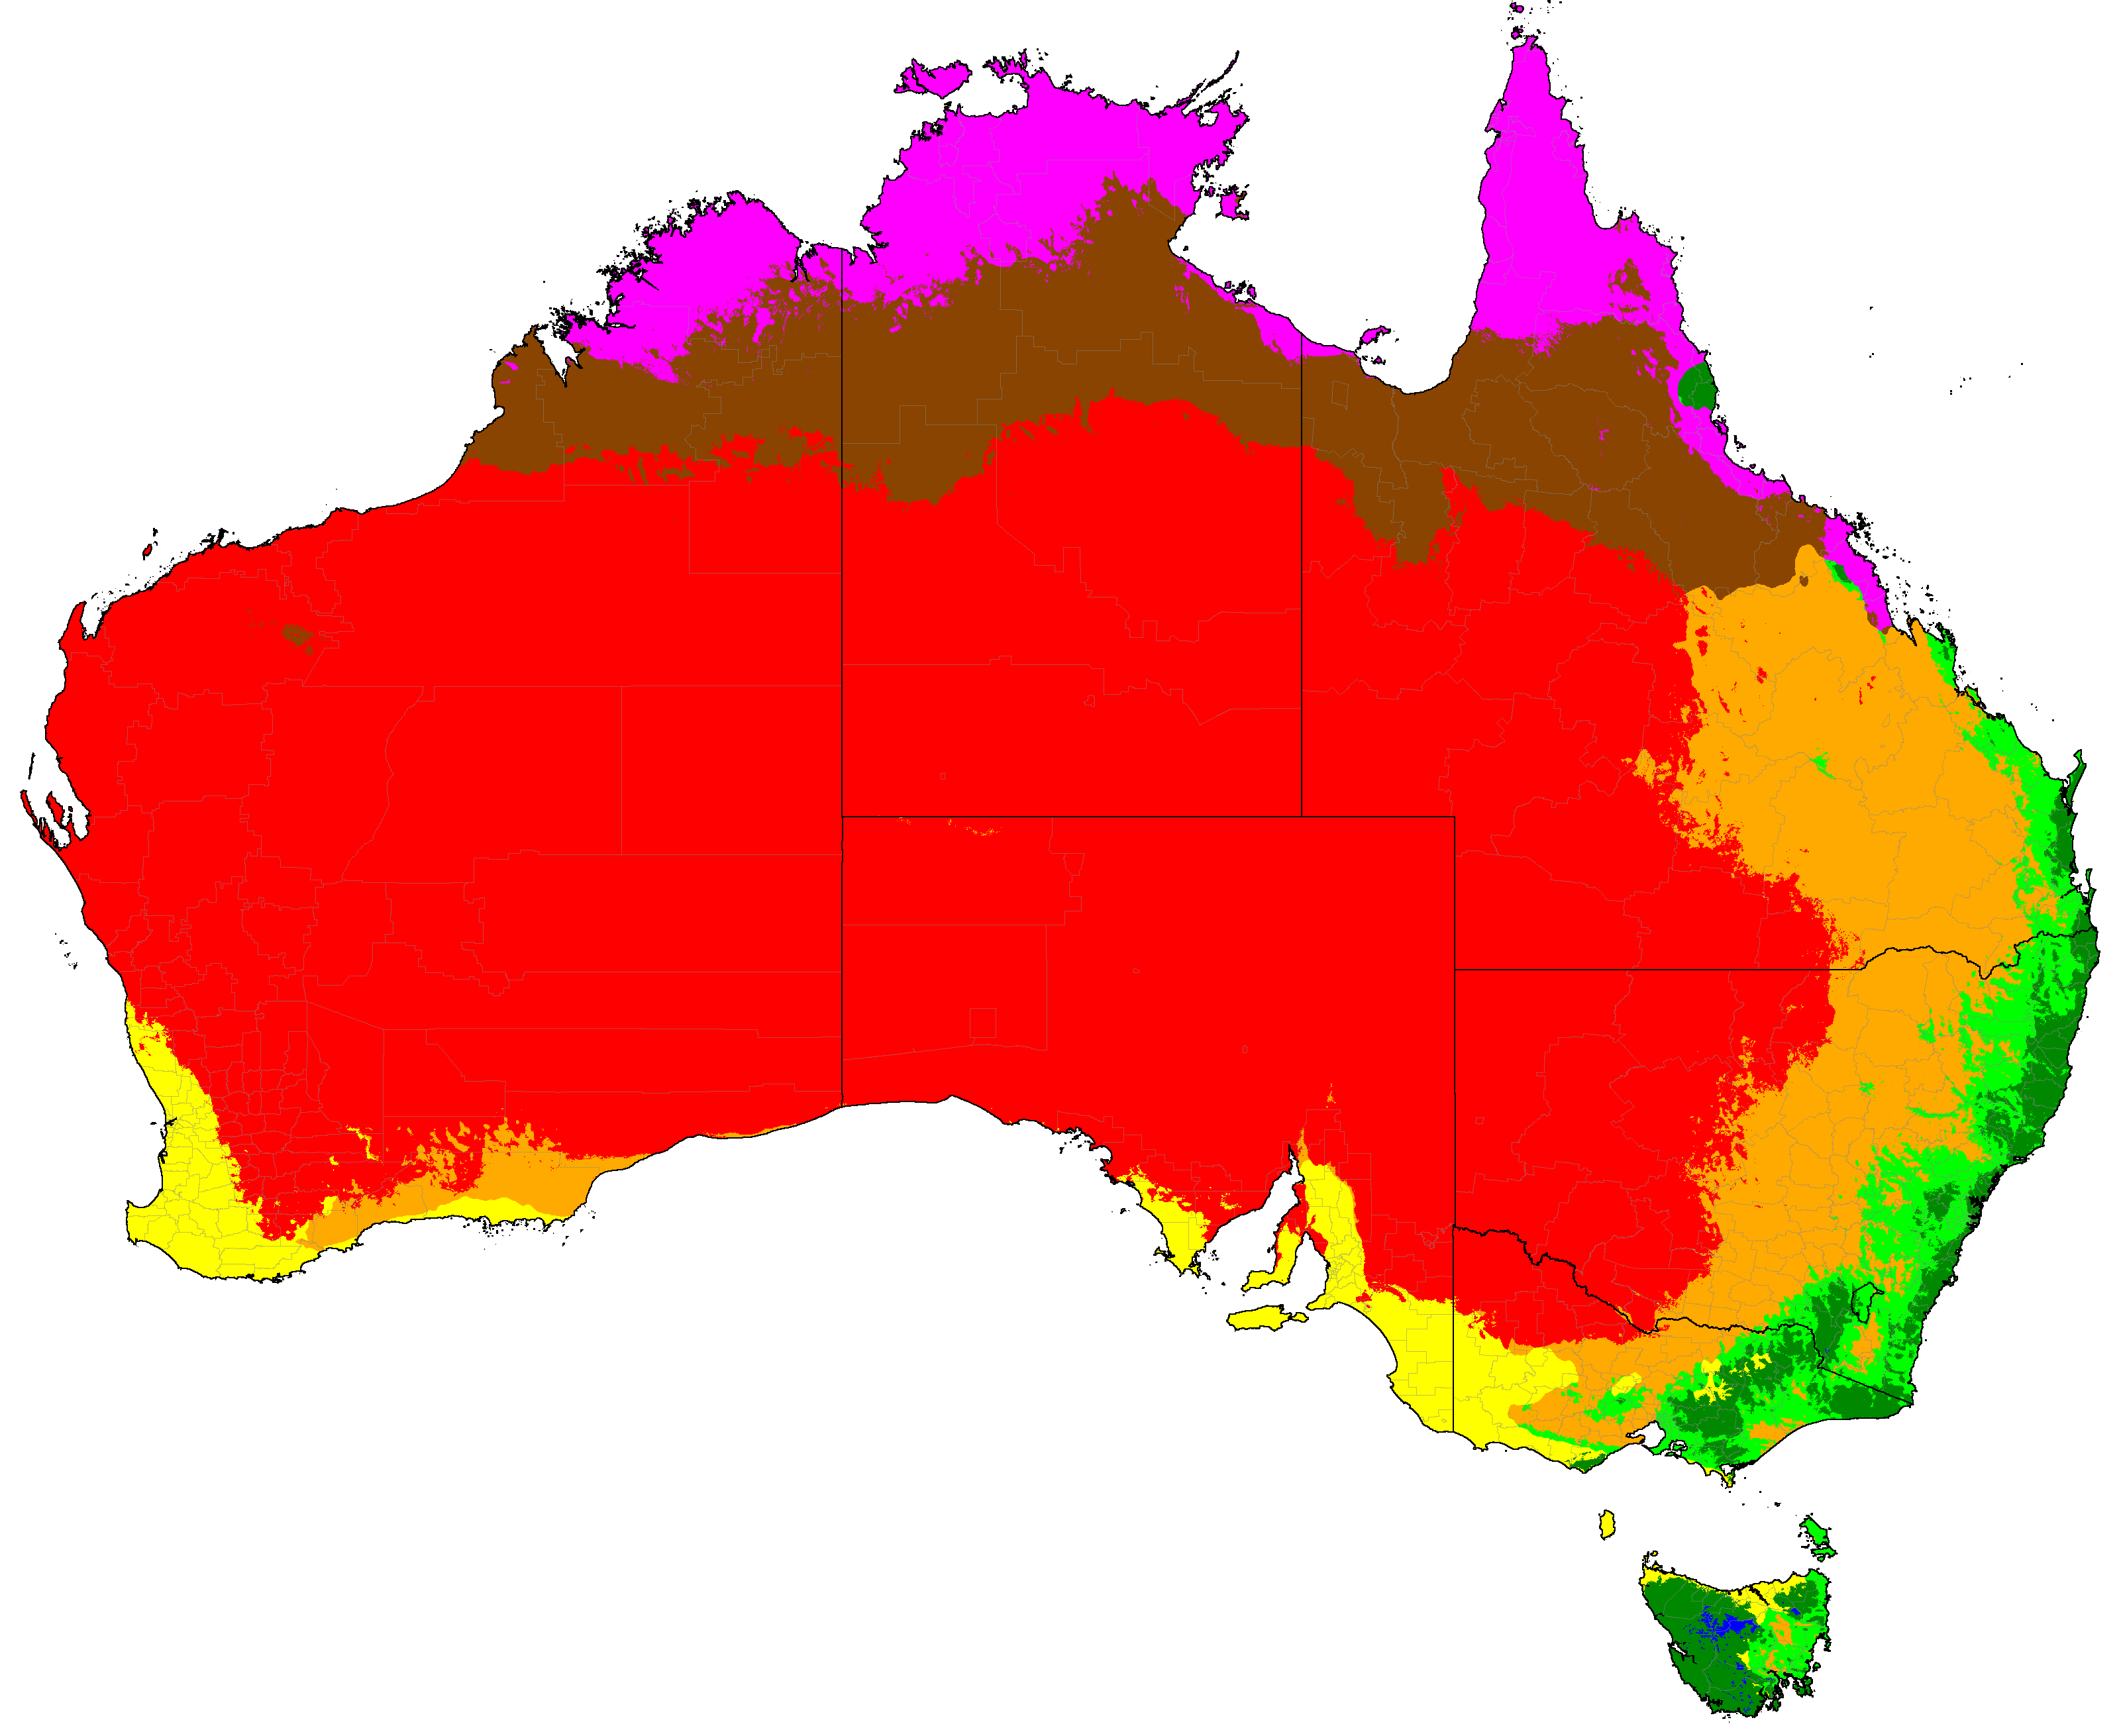
Australia distribution of aridity categories (projections are SSP5-8.5 high emissions normals)
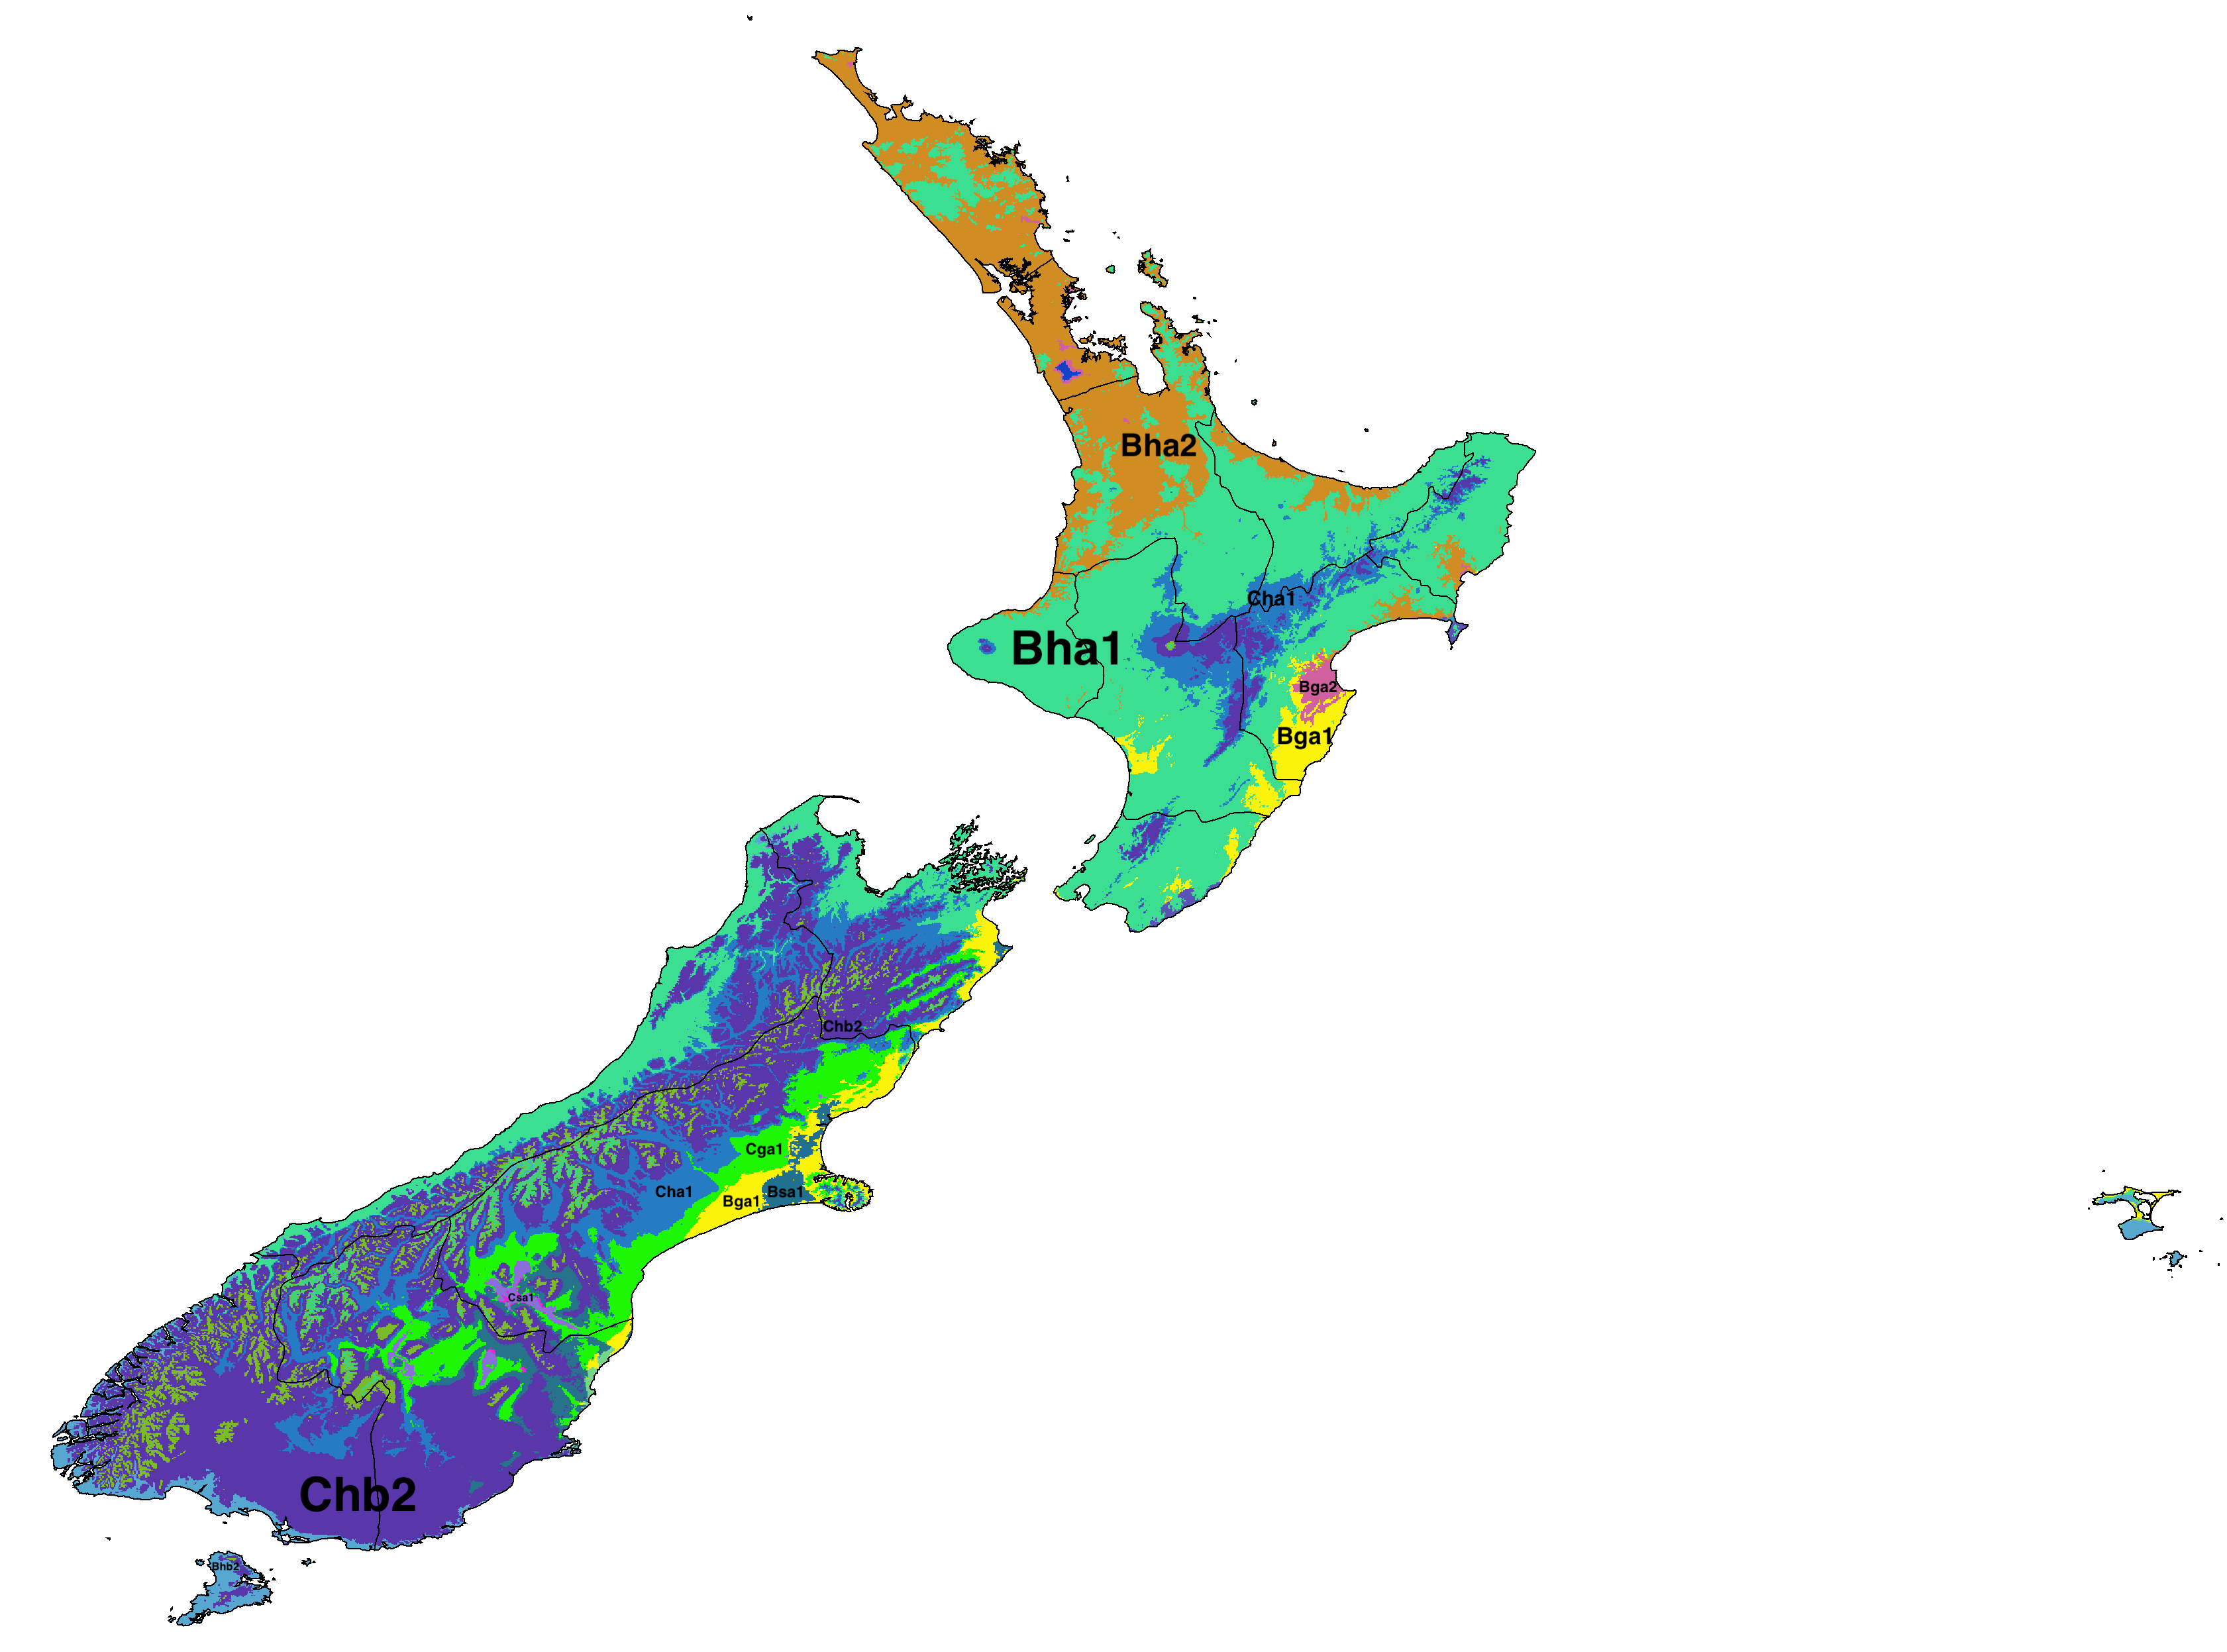
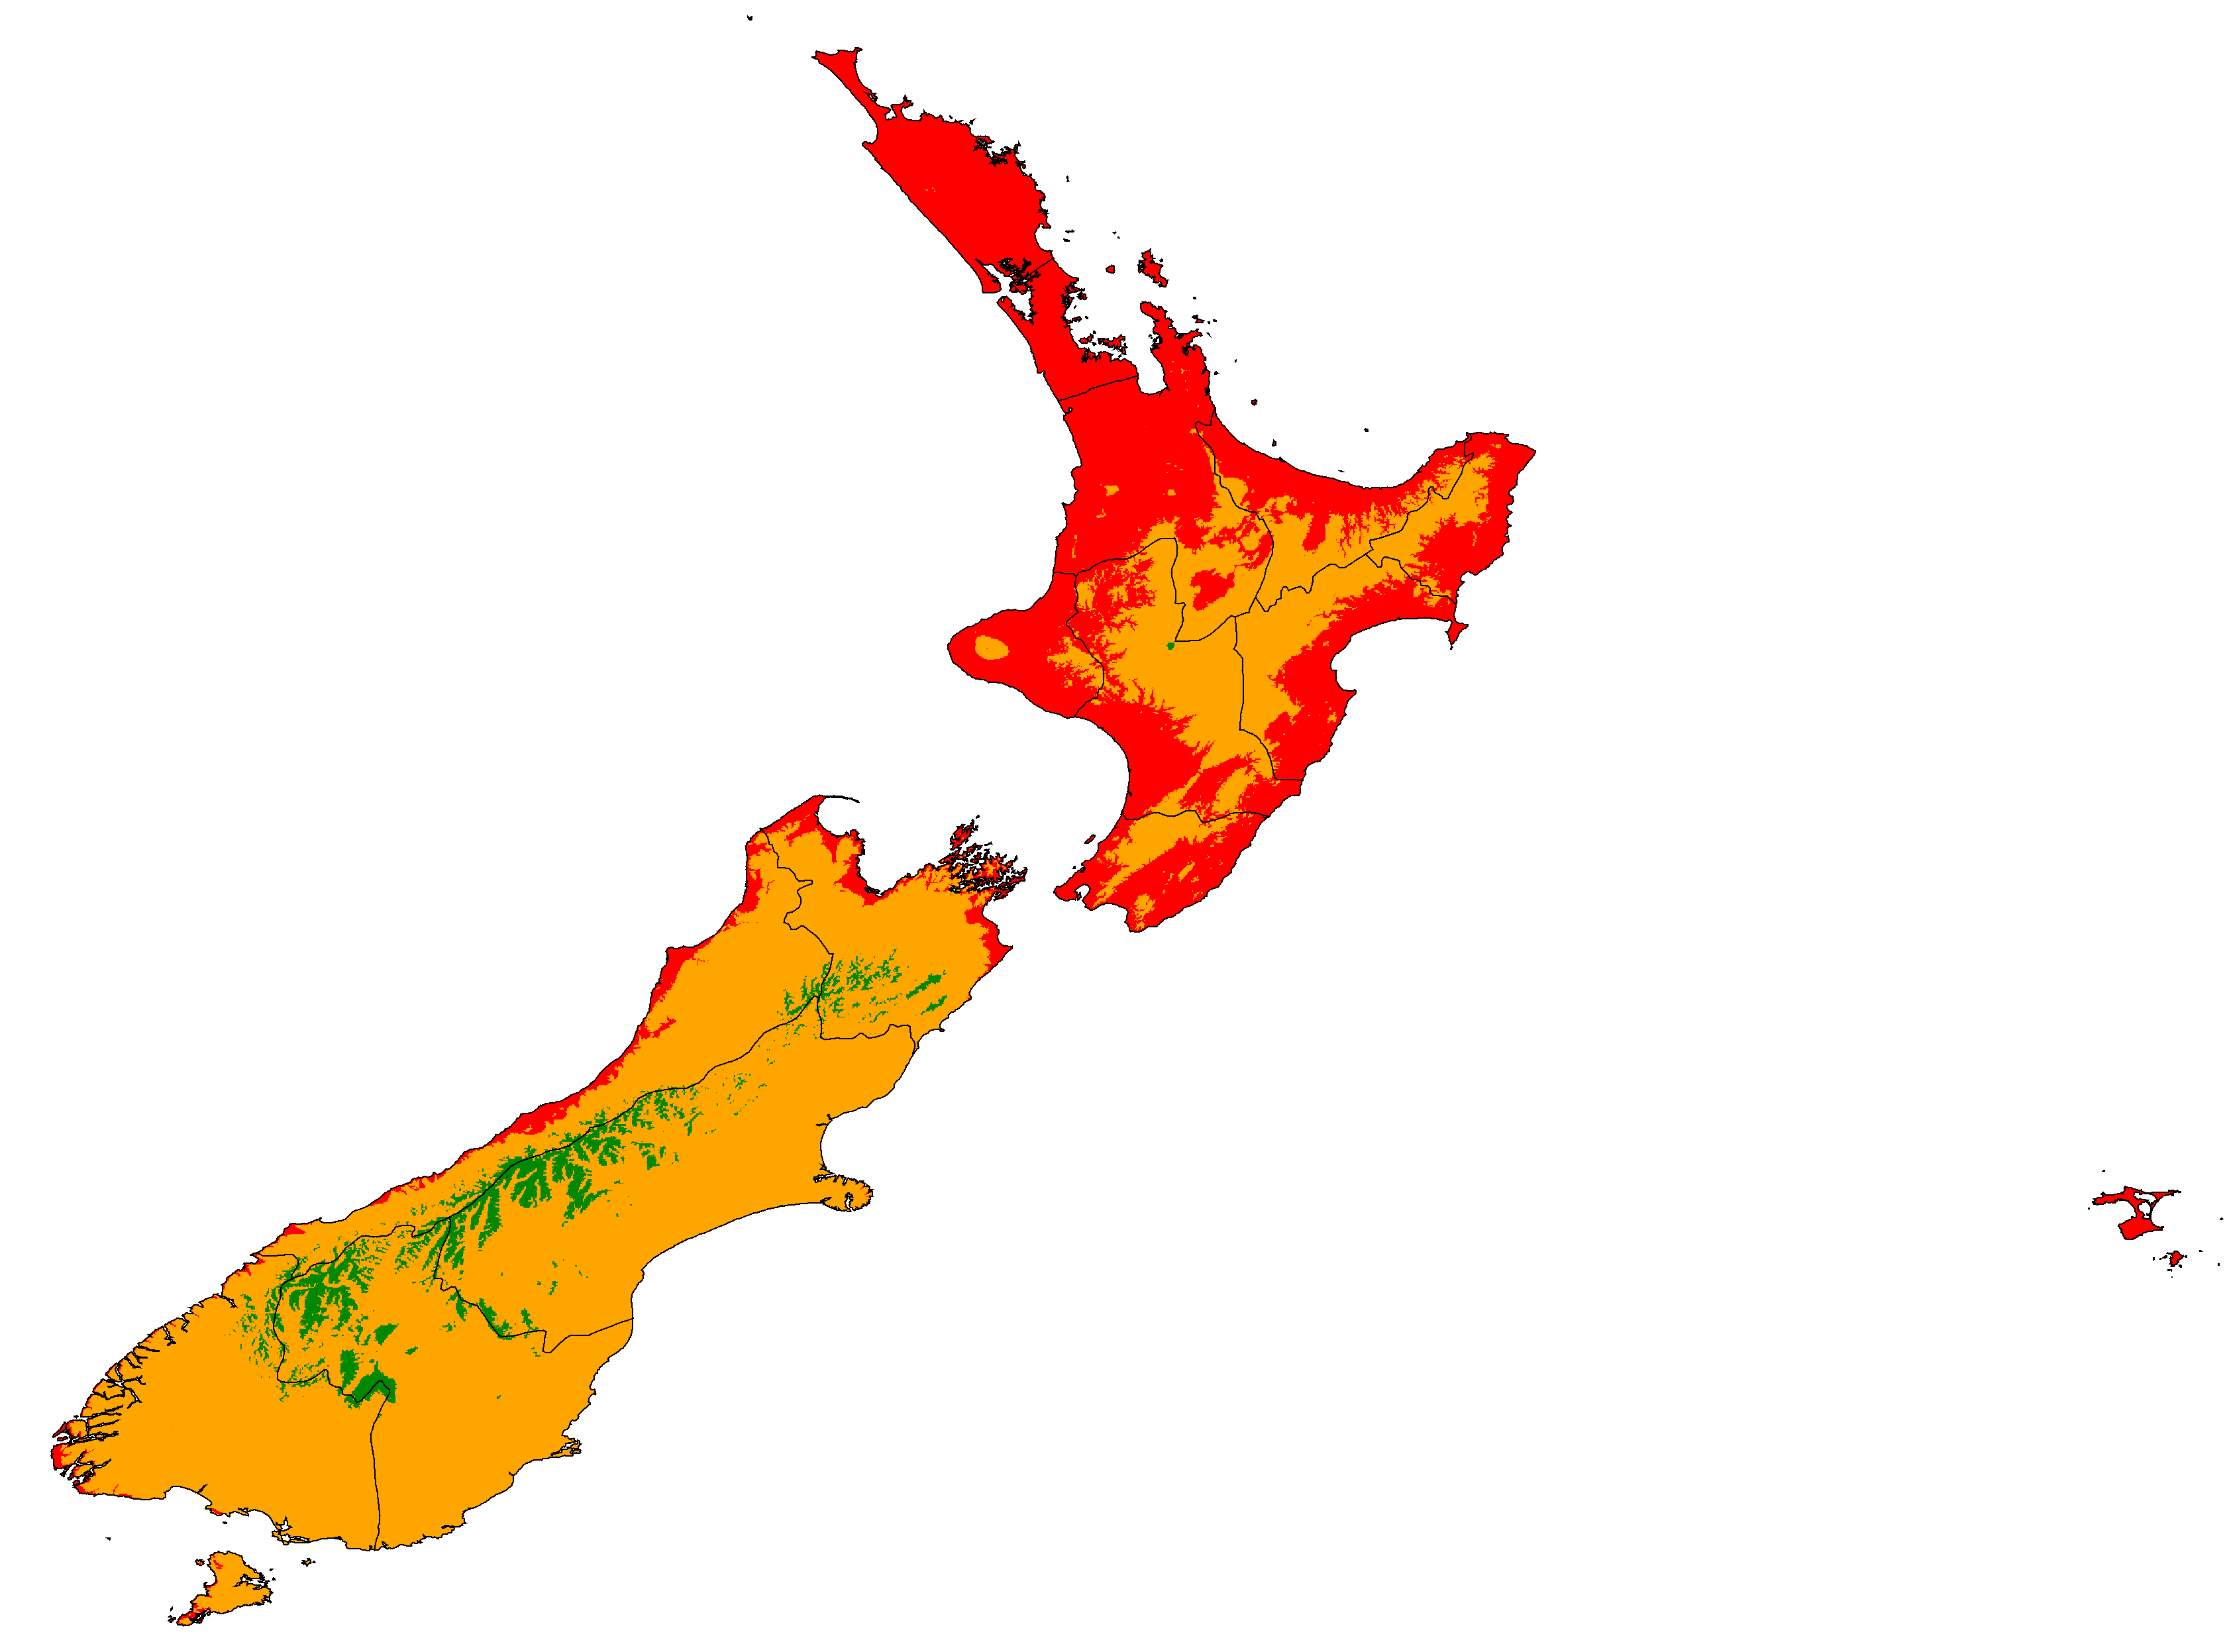
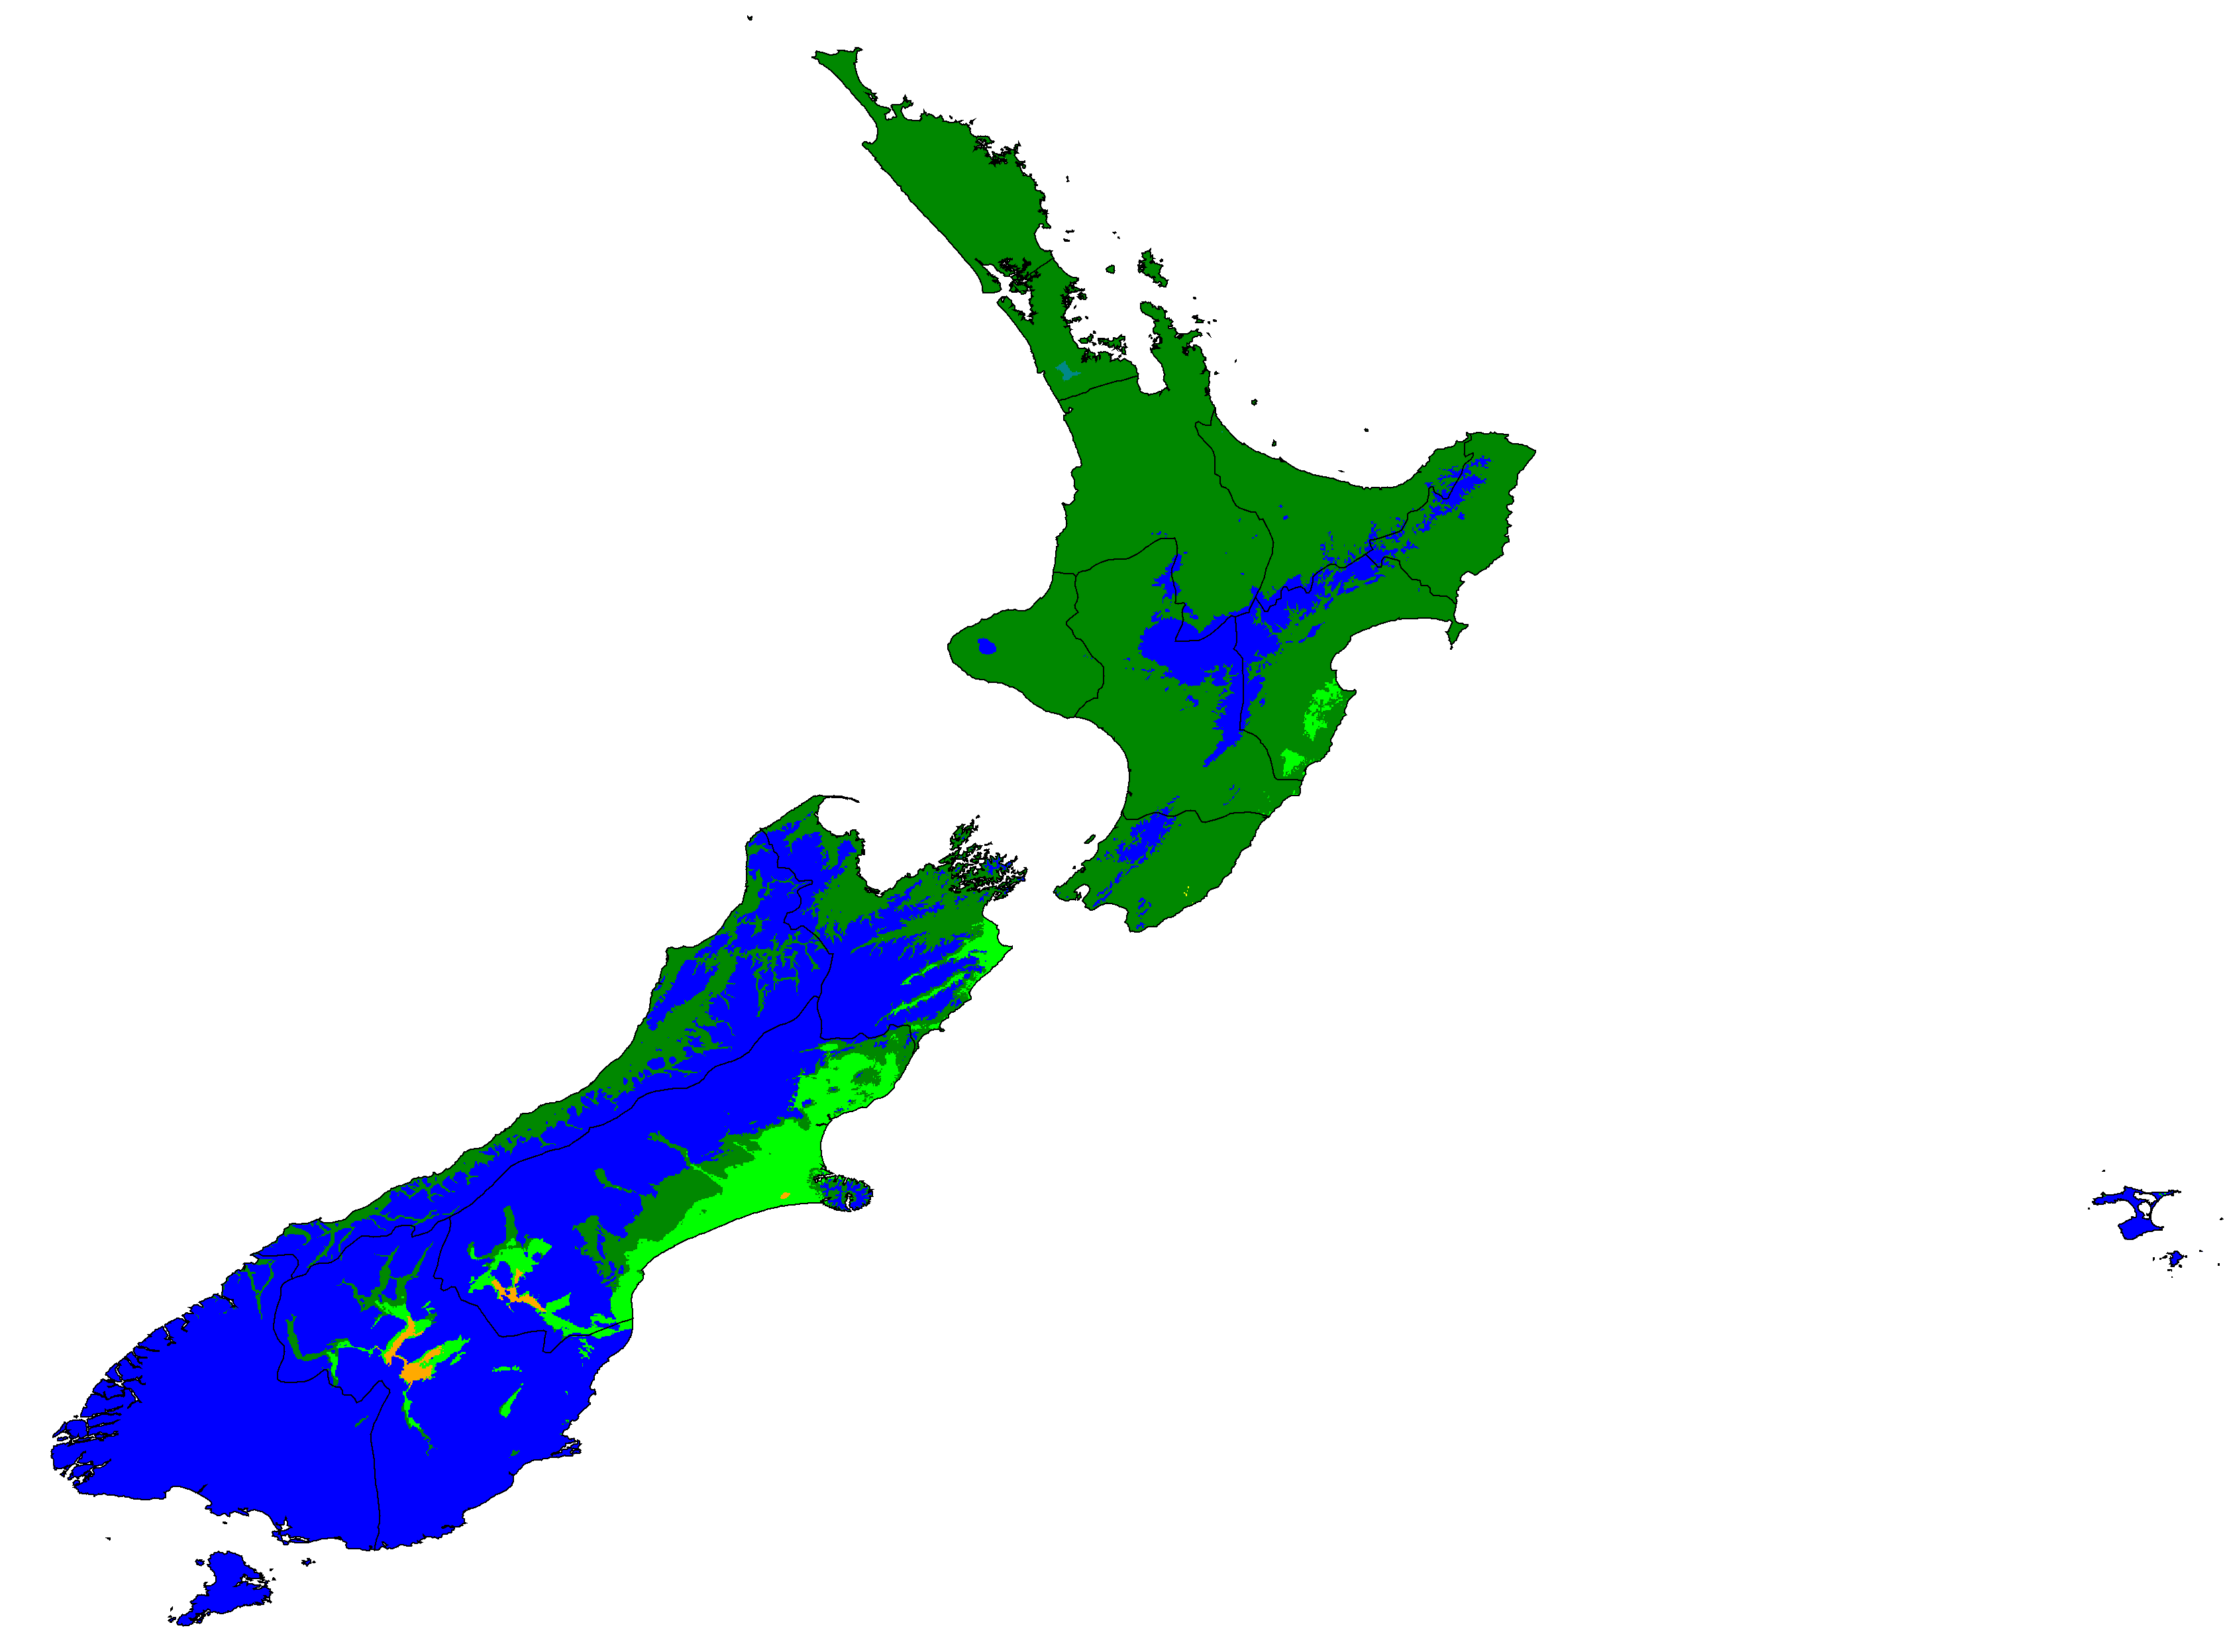
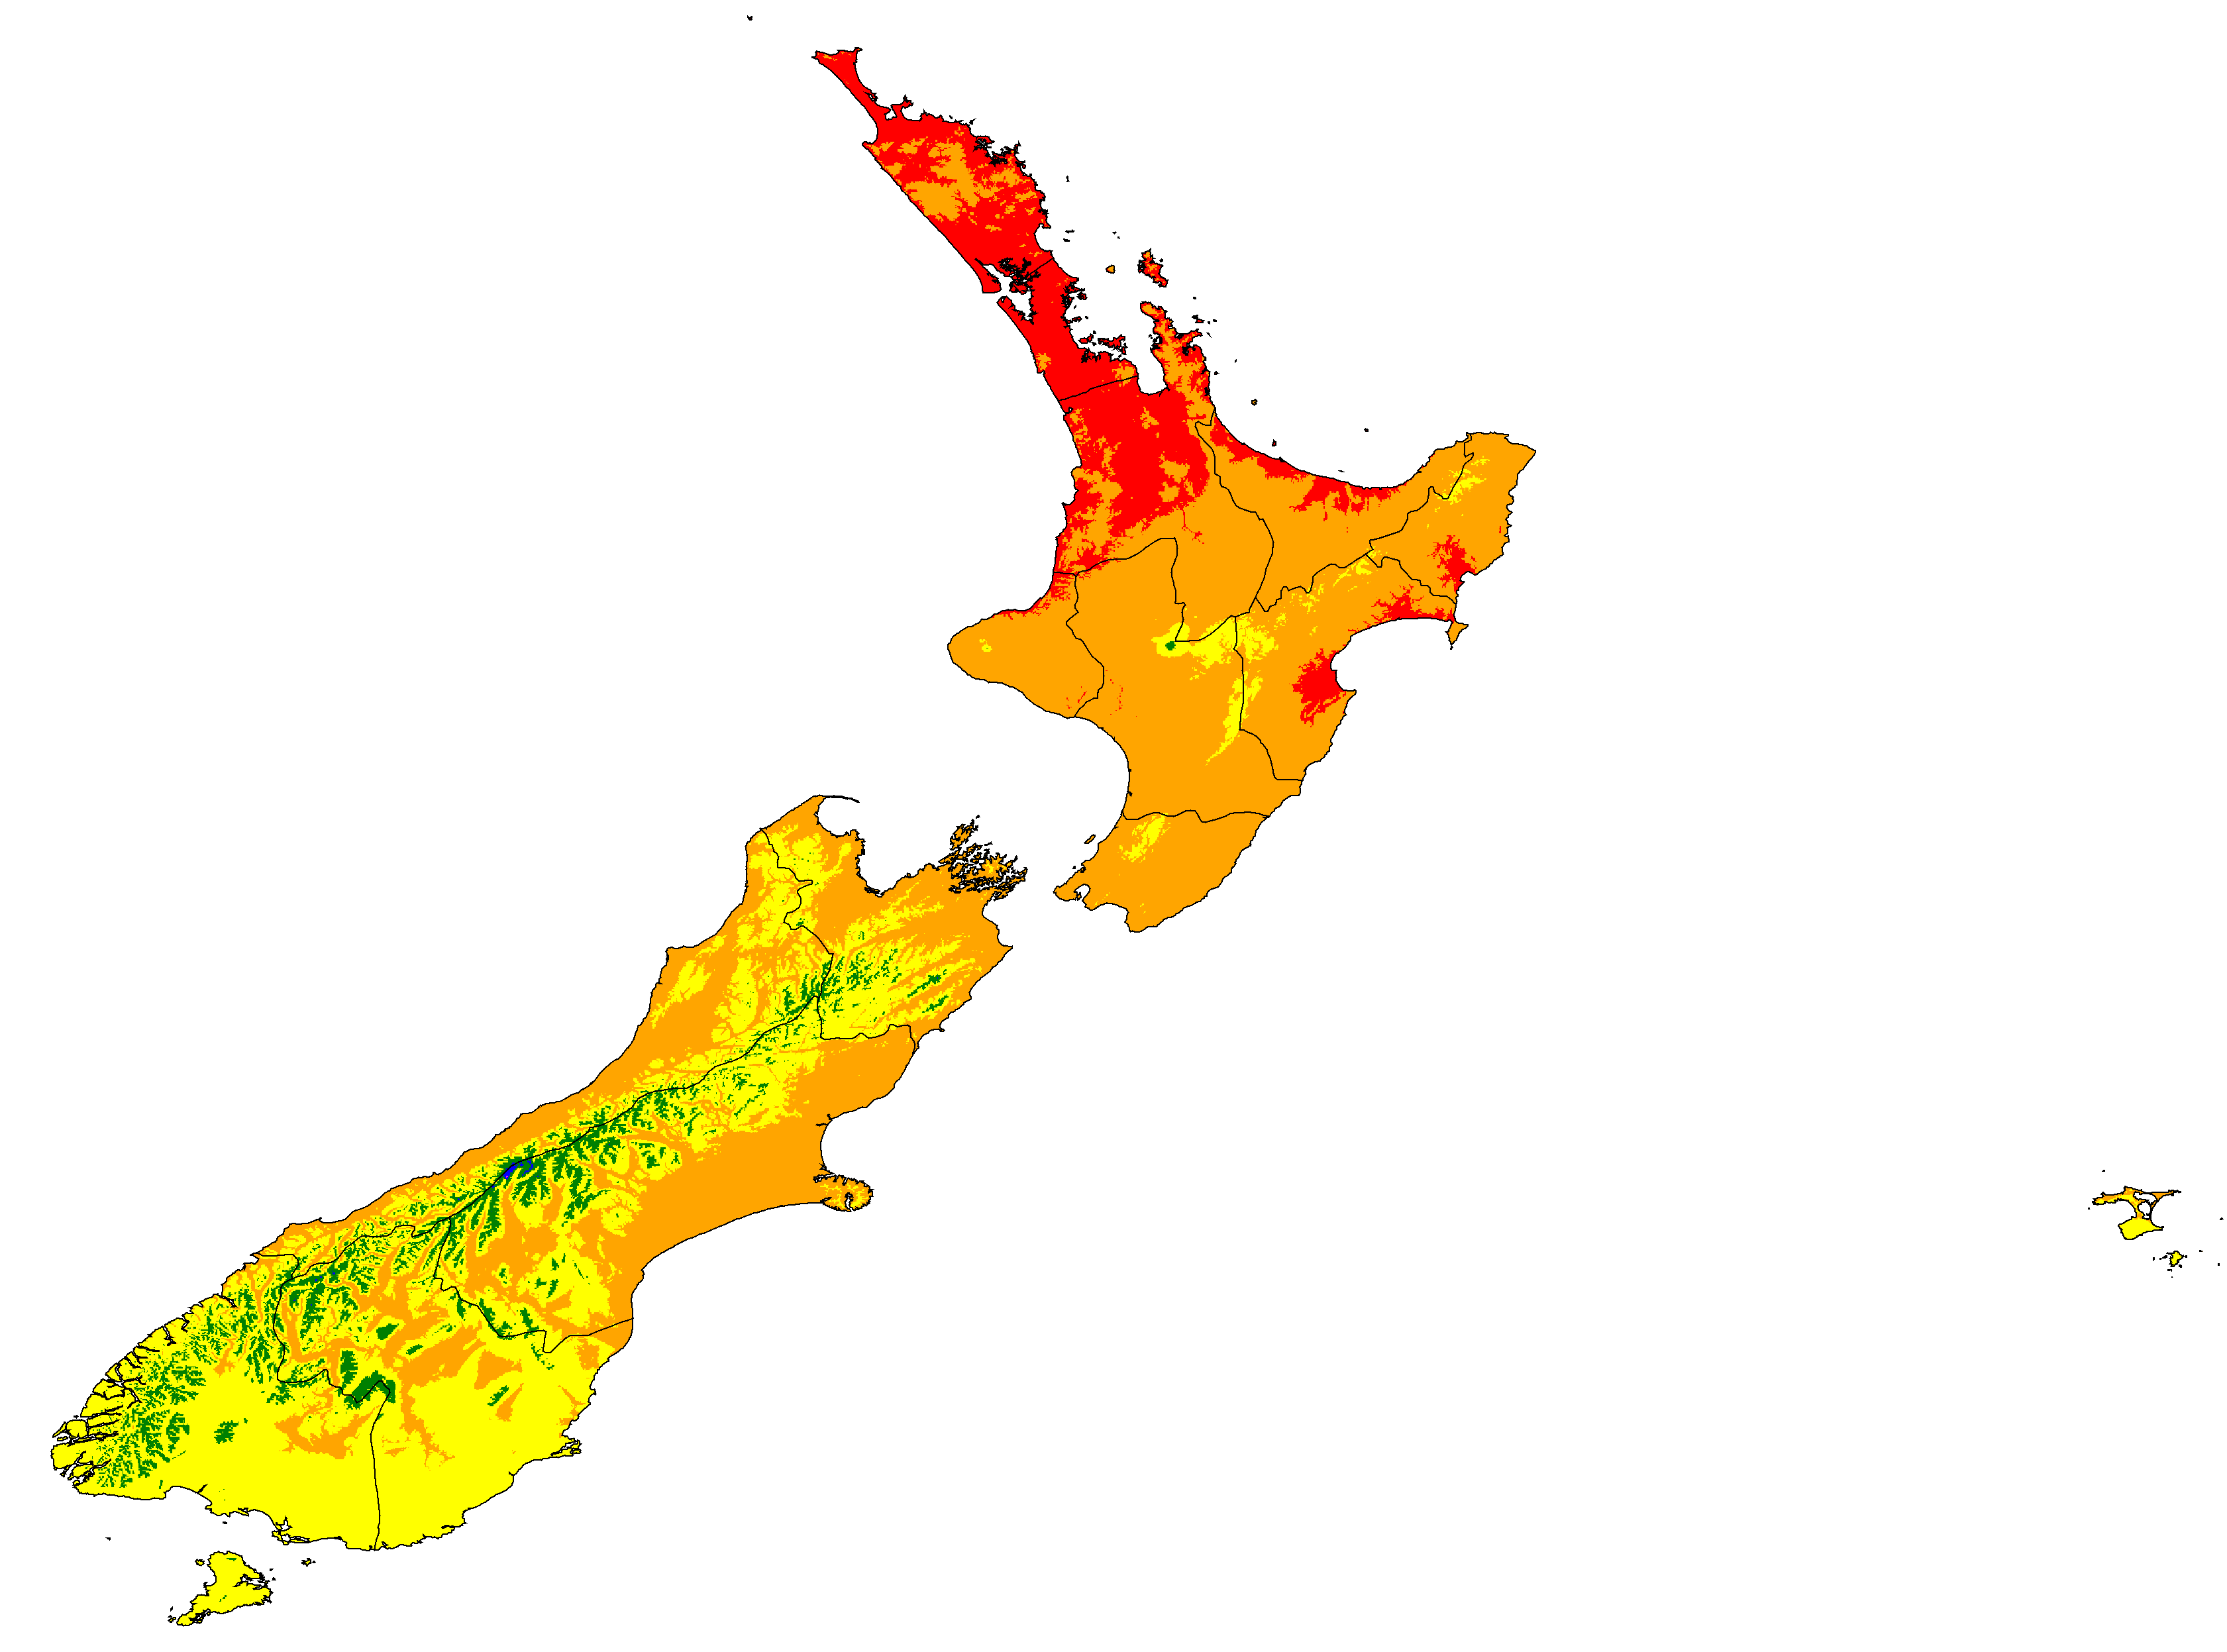
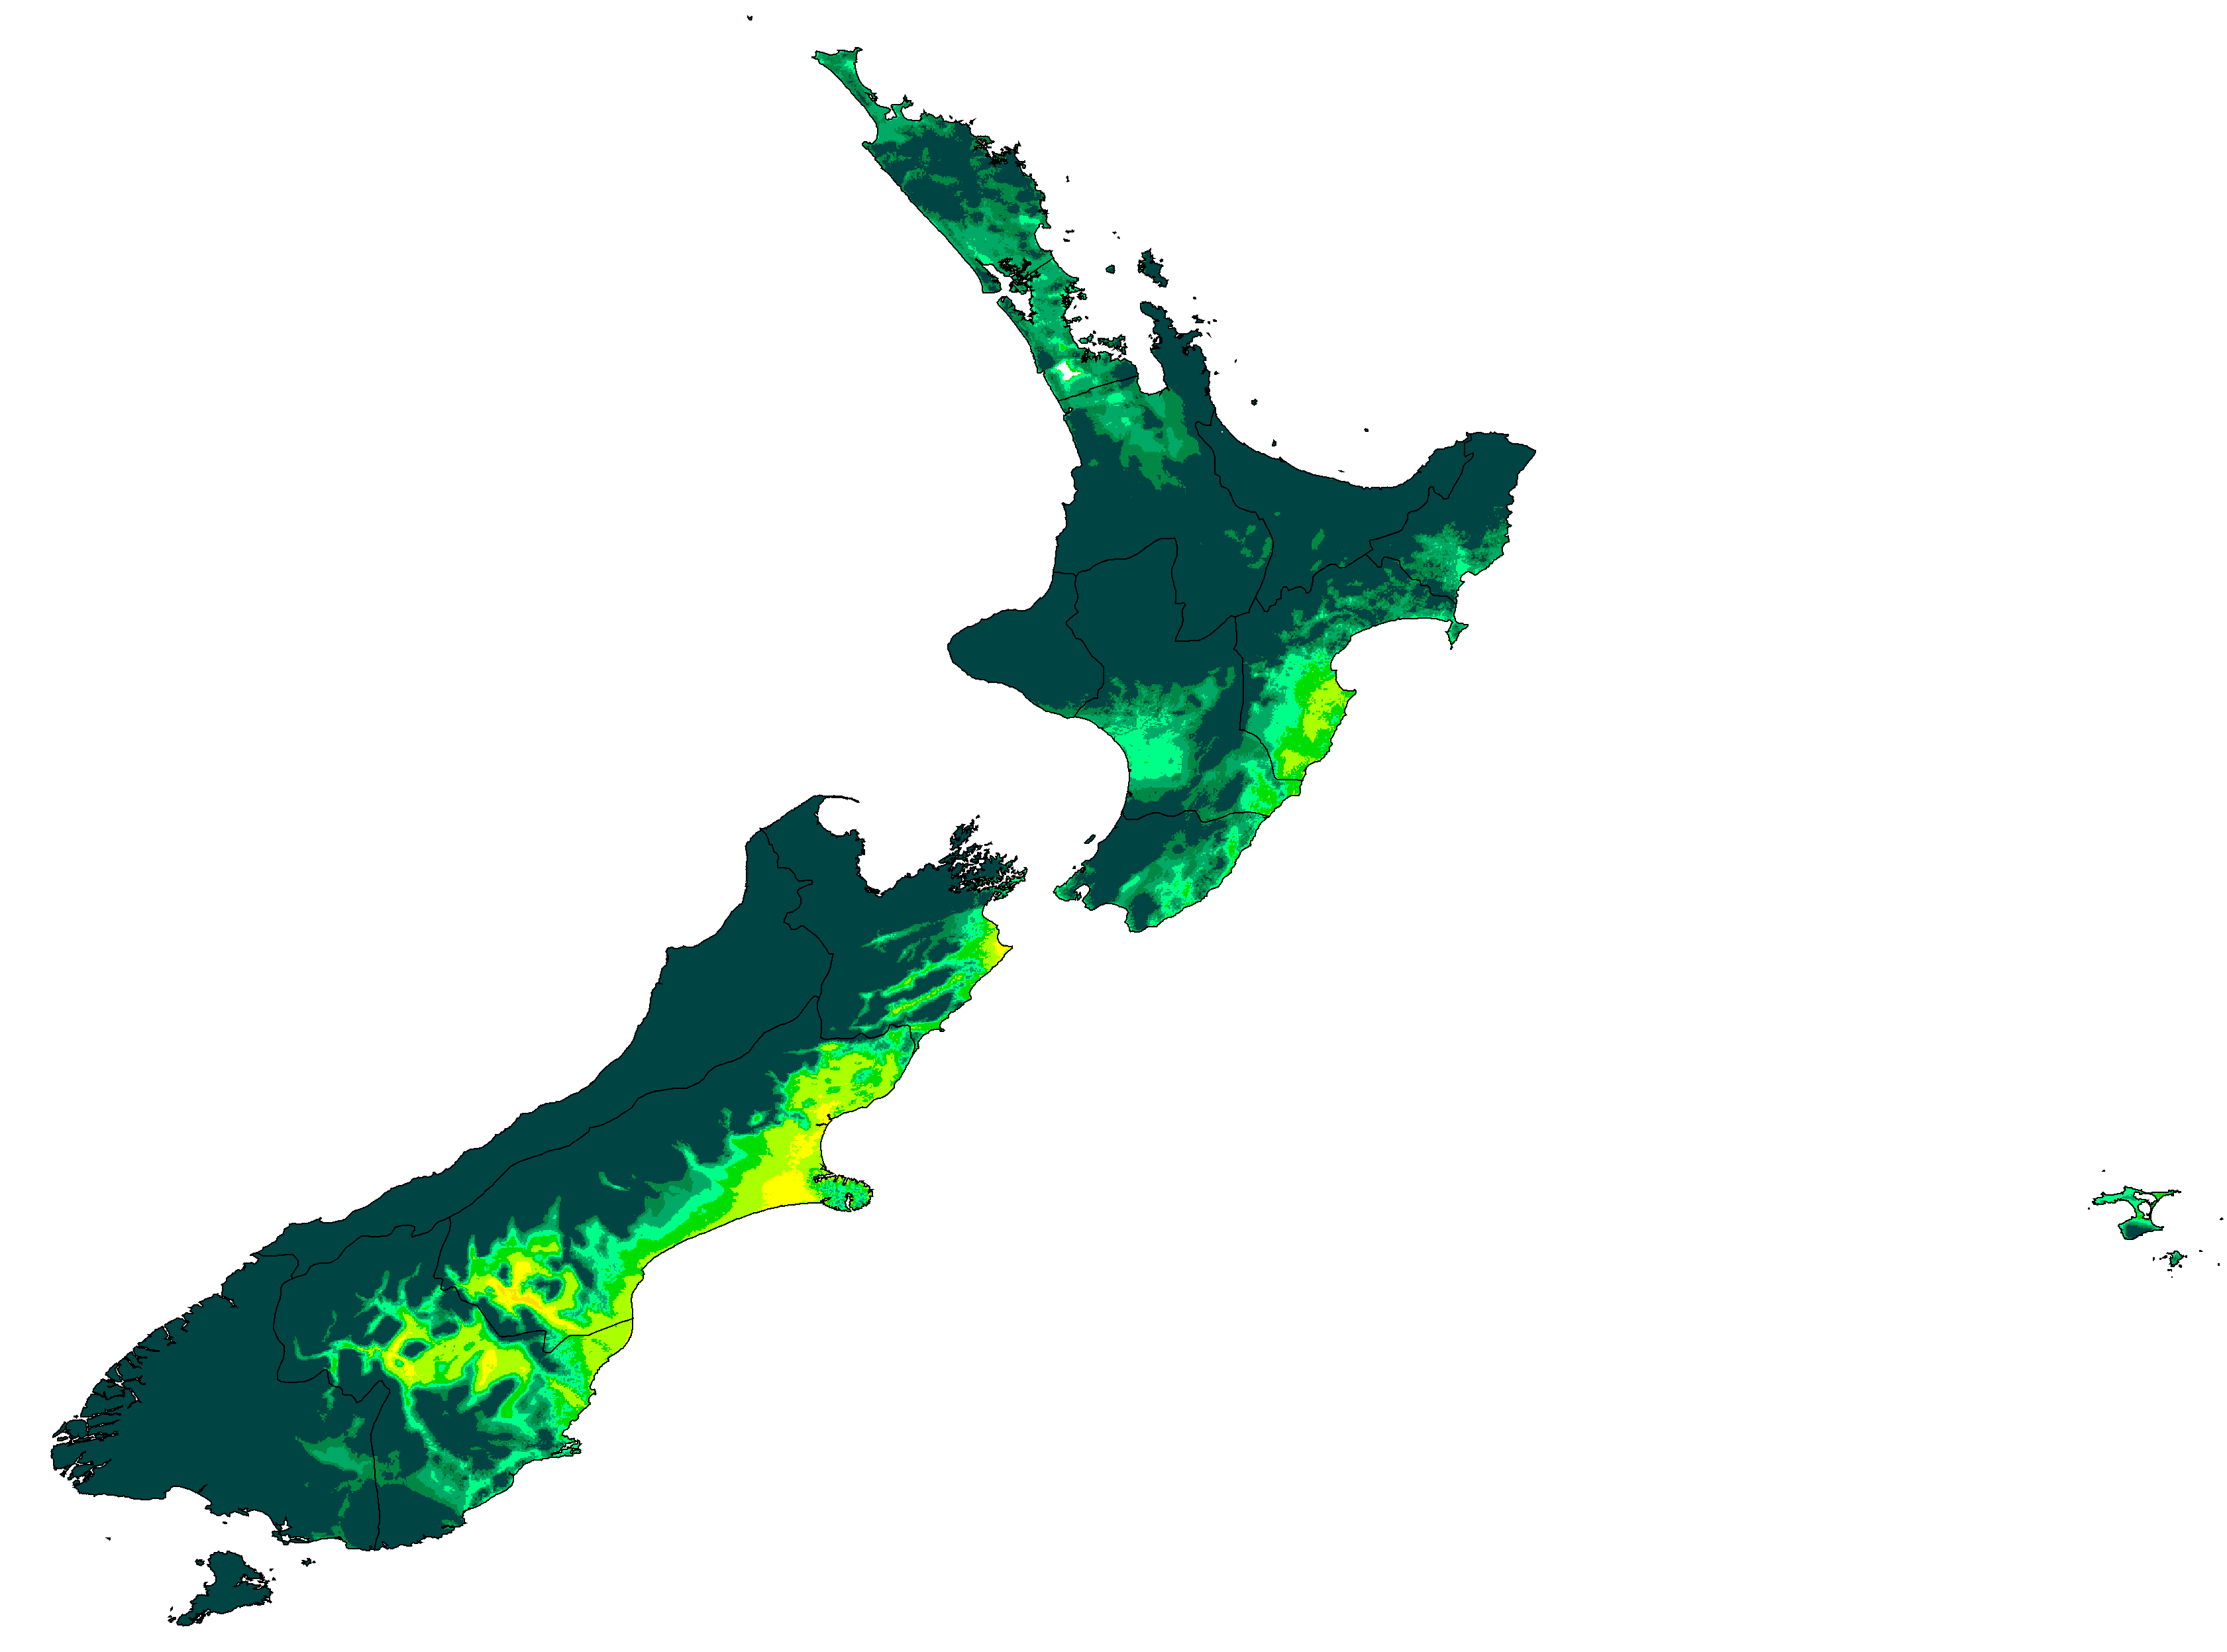
New Zealand distribution of aridity categories (projections are SSP5-8.5 high emissions normals)
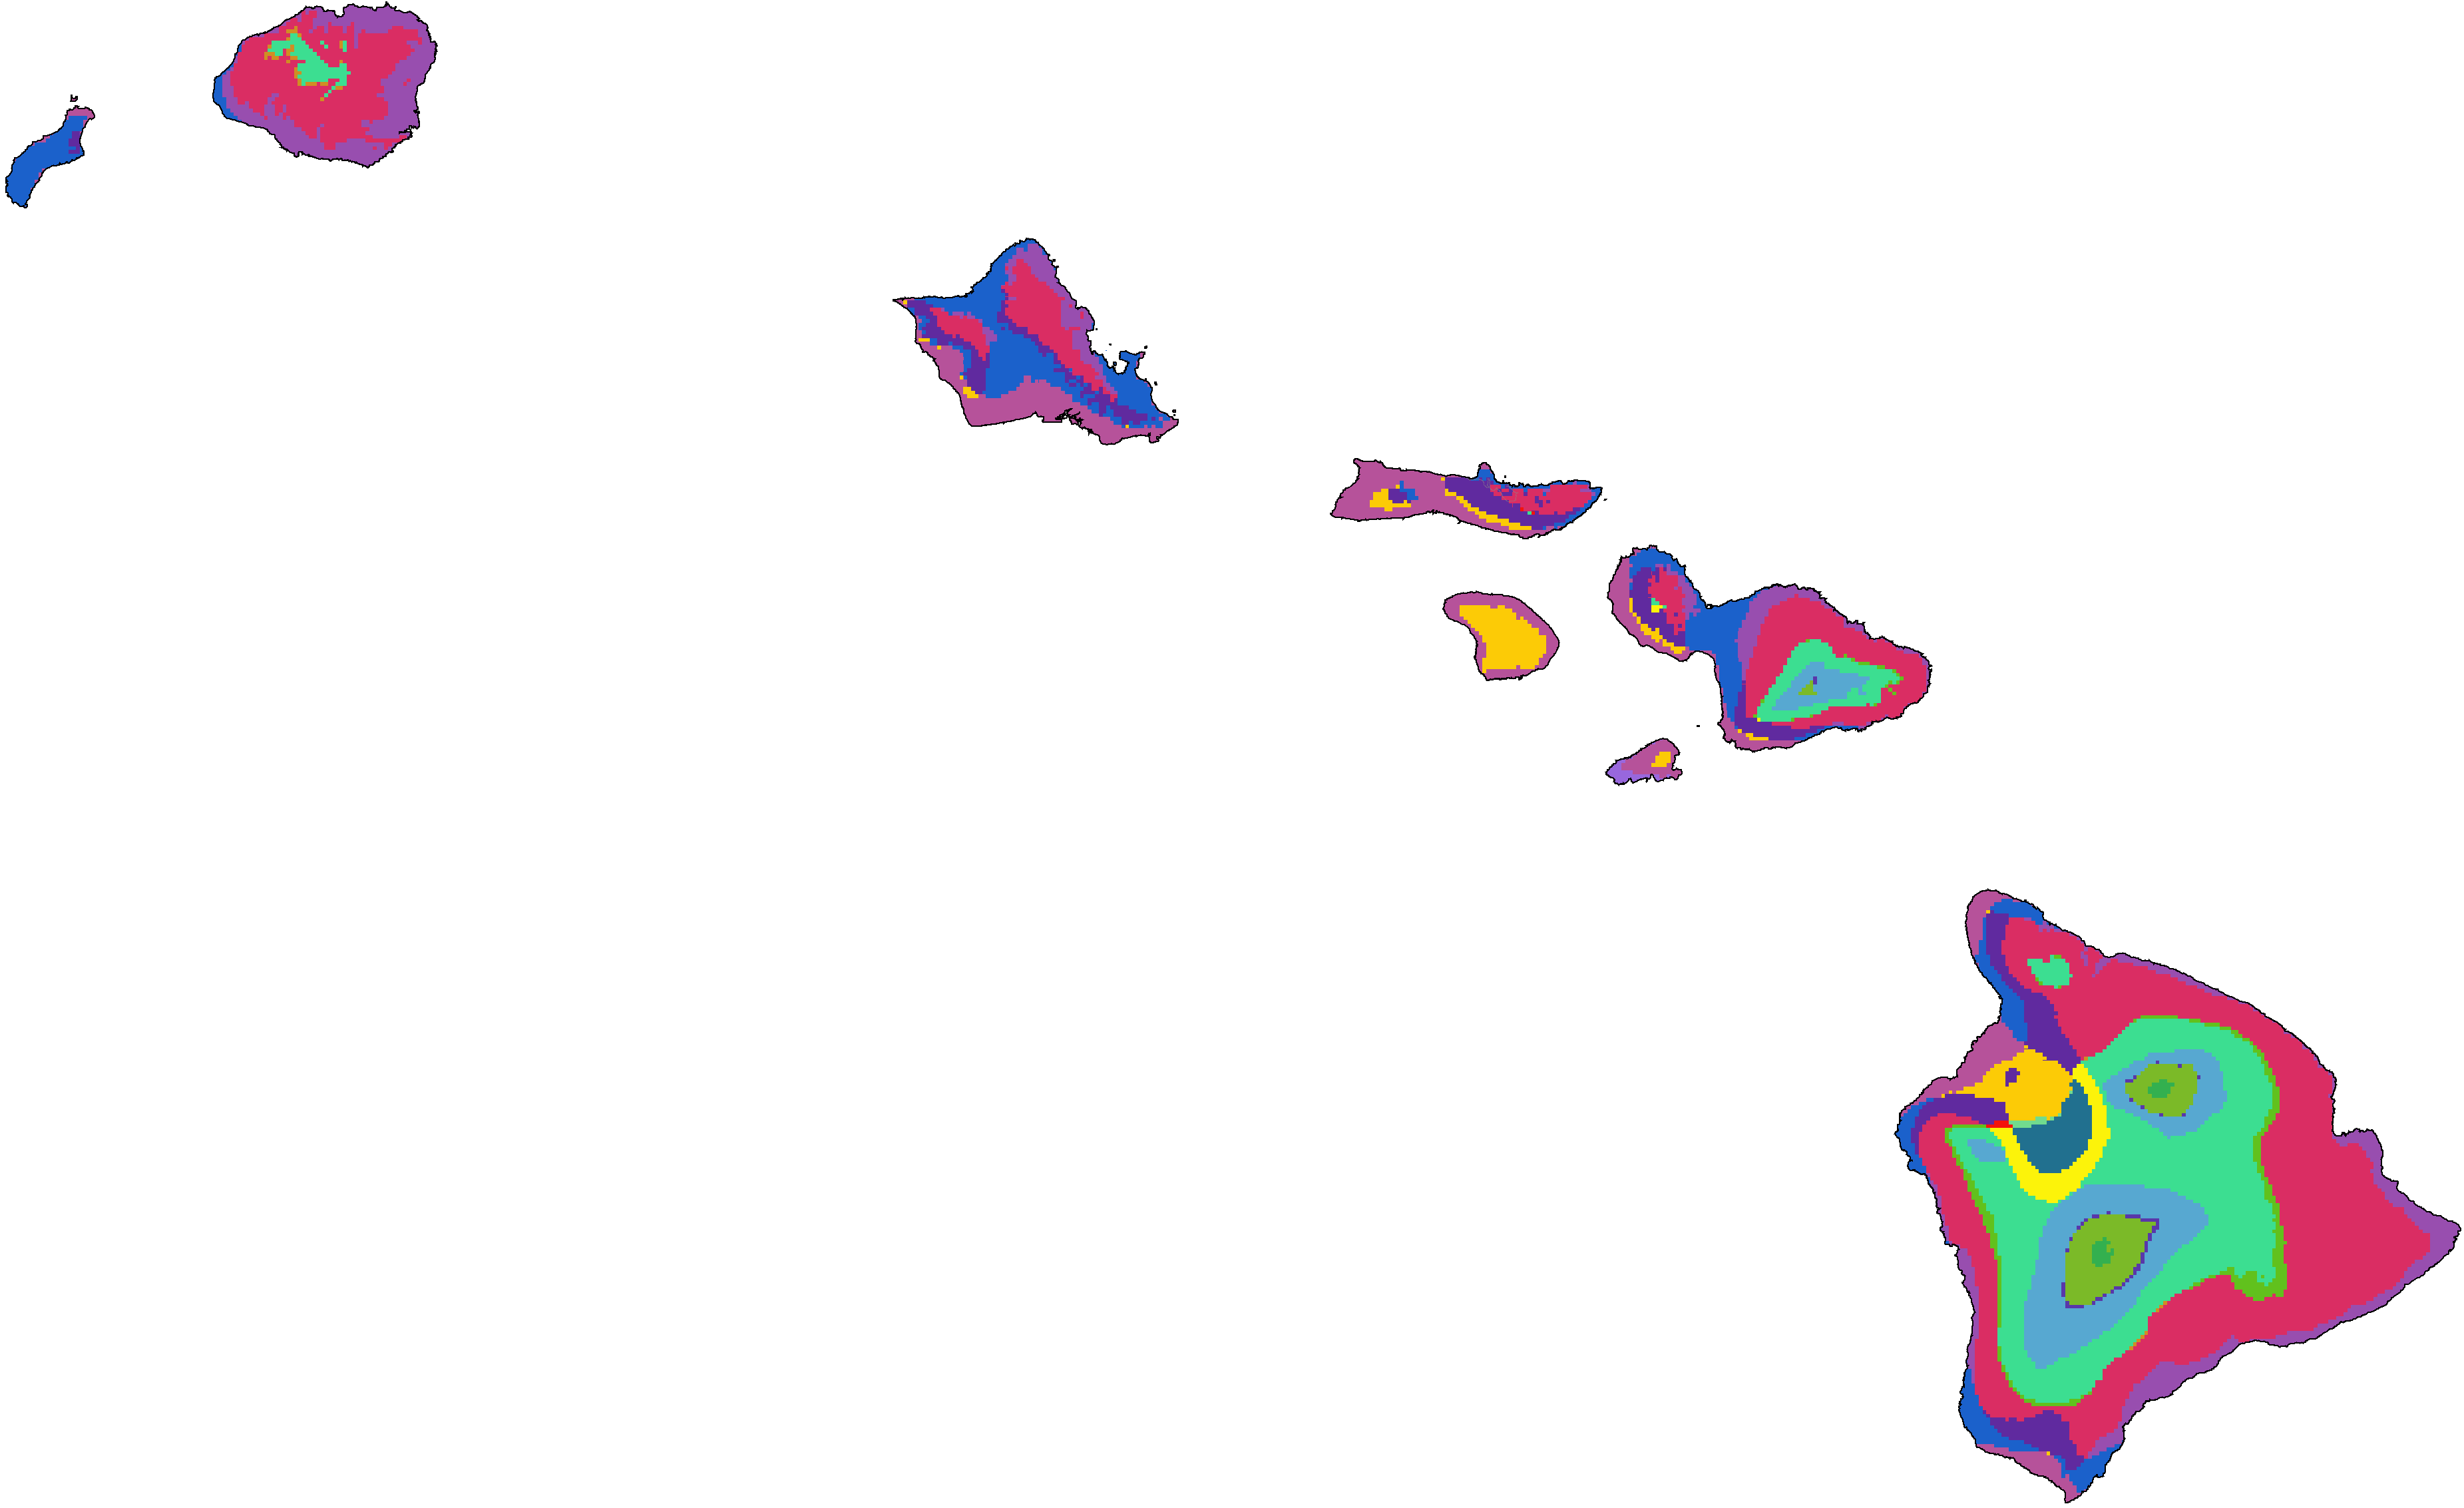
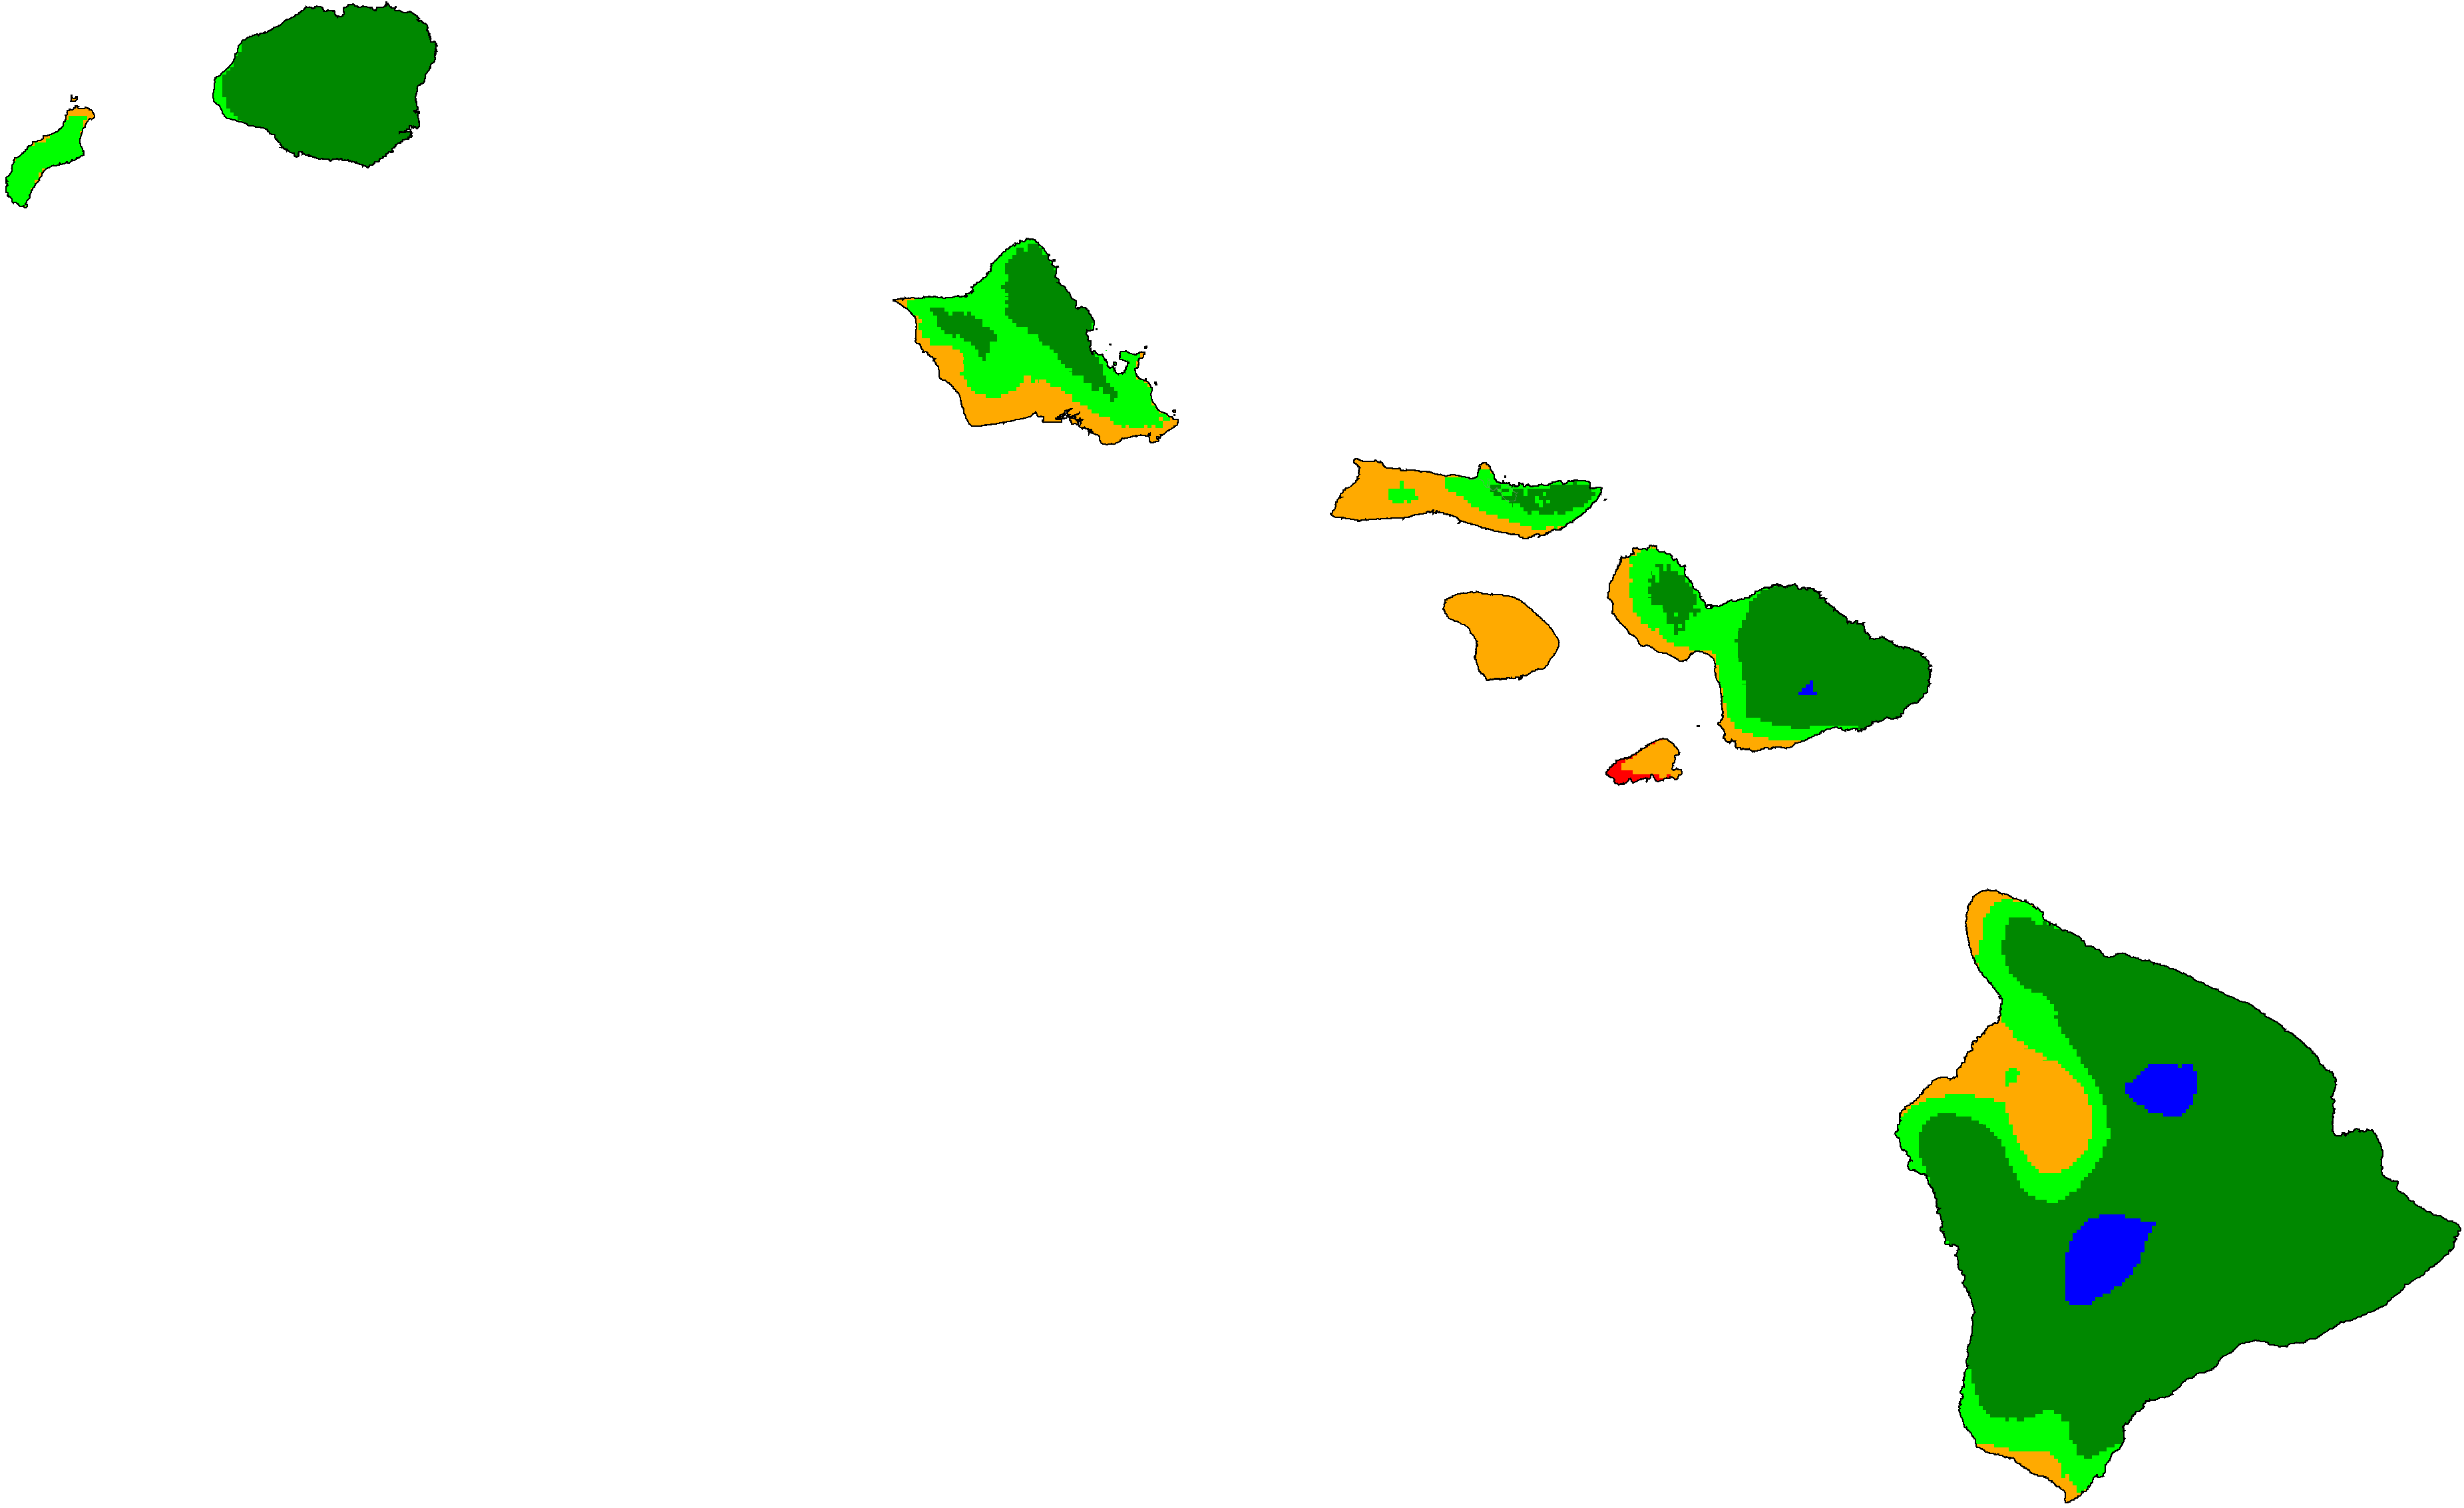
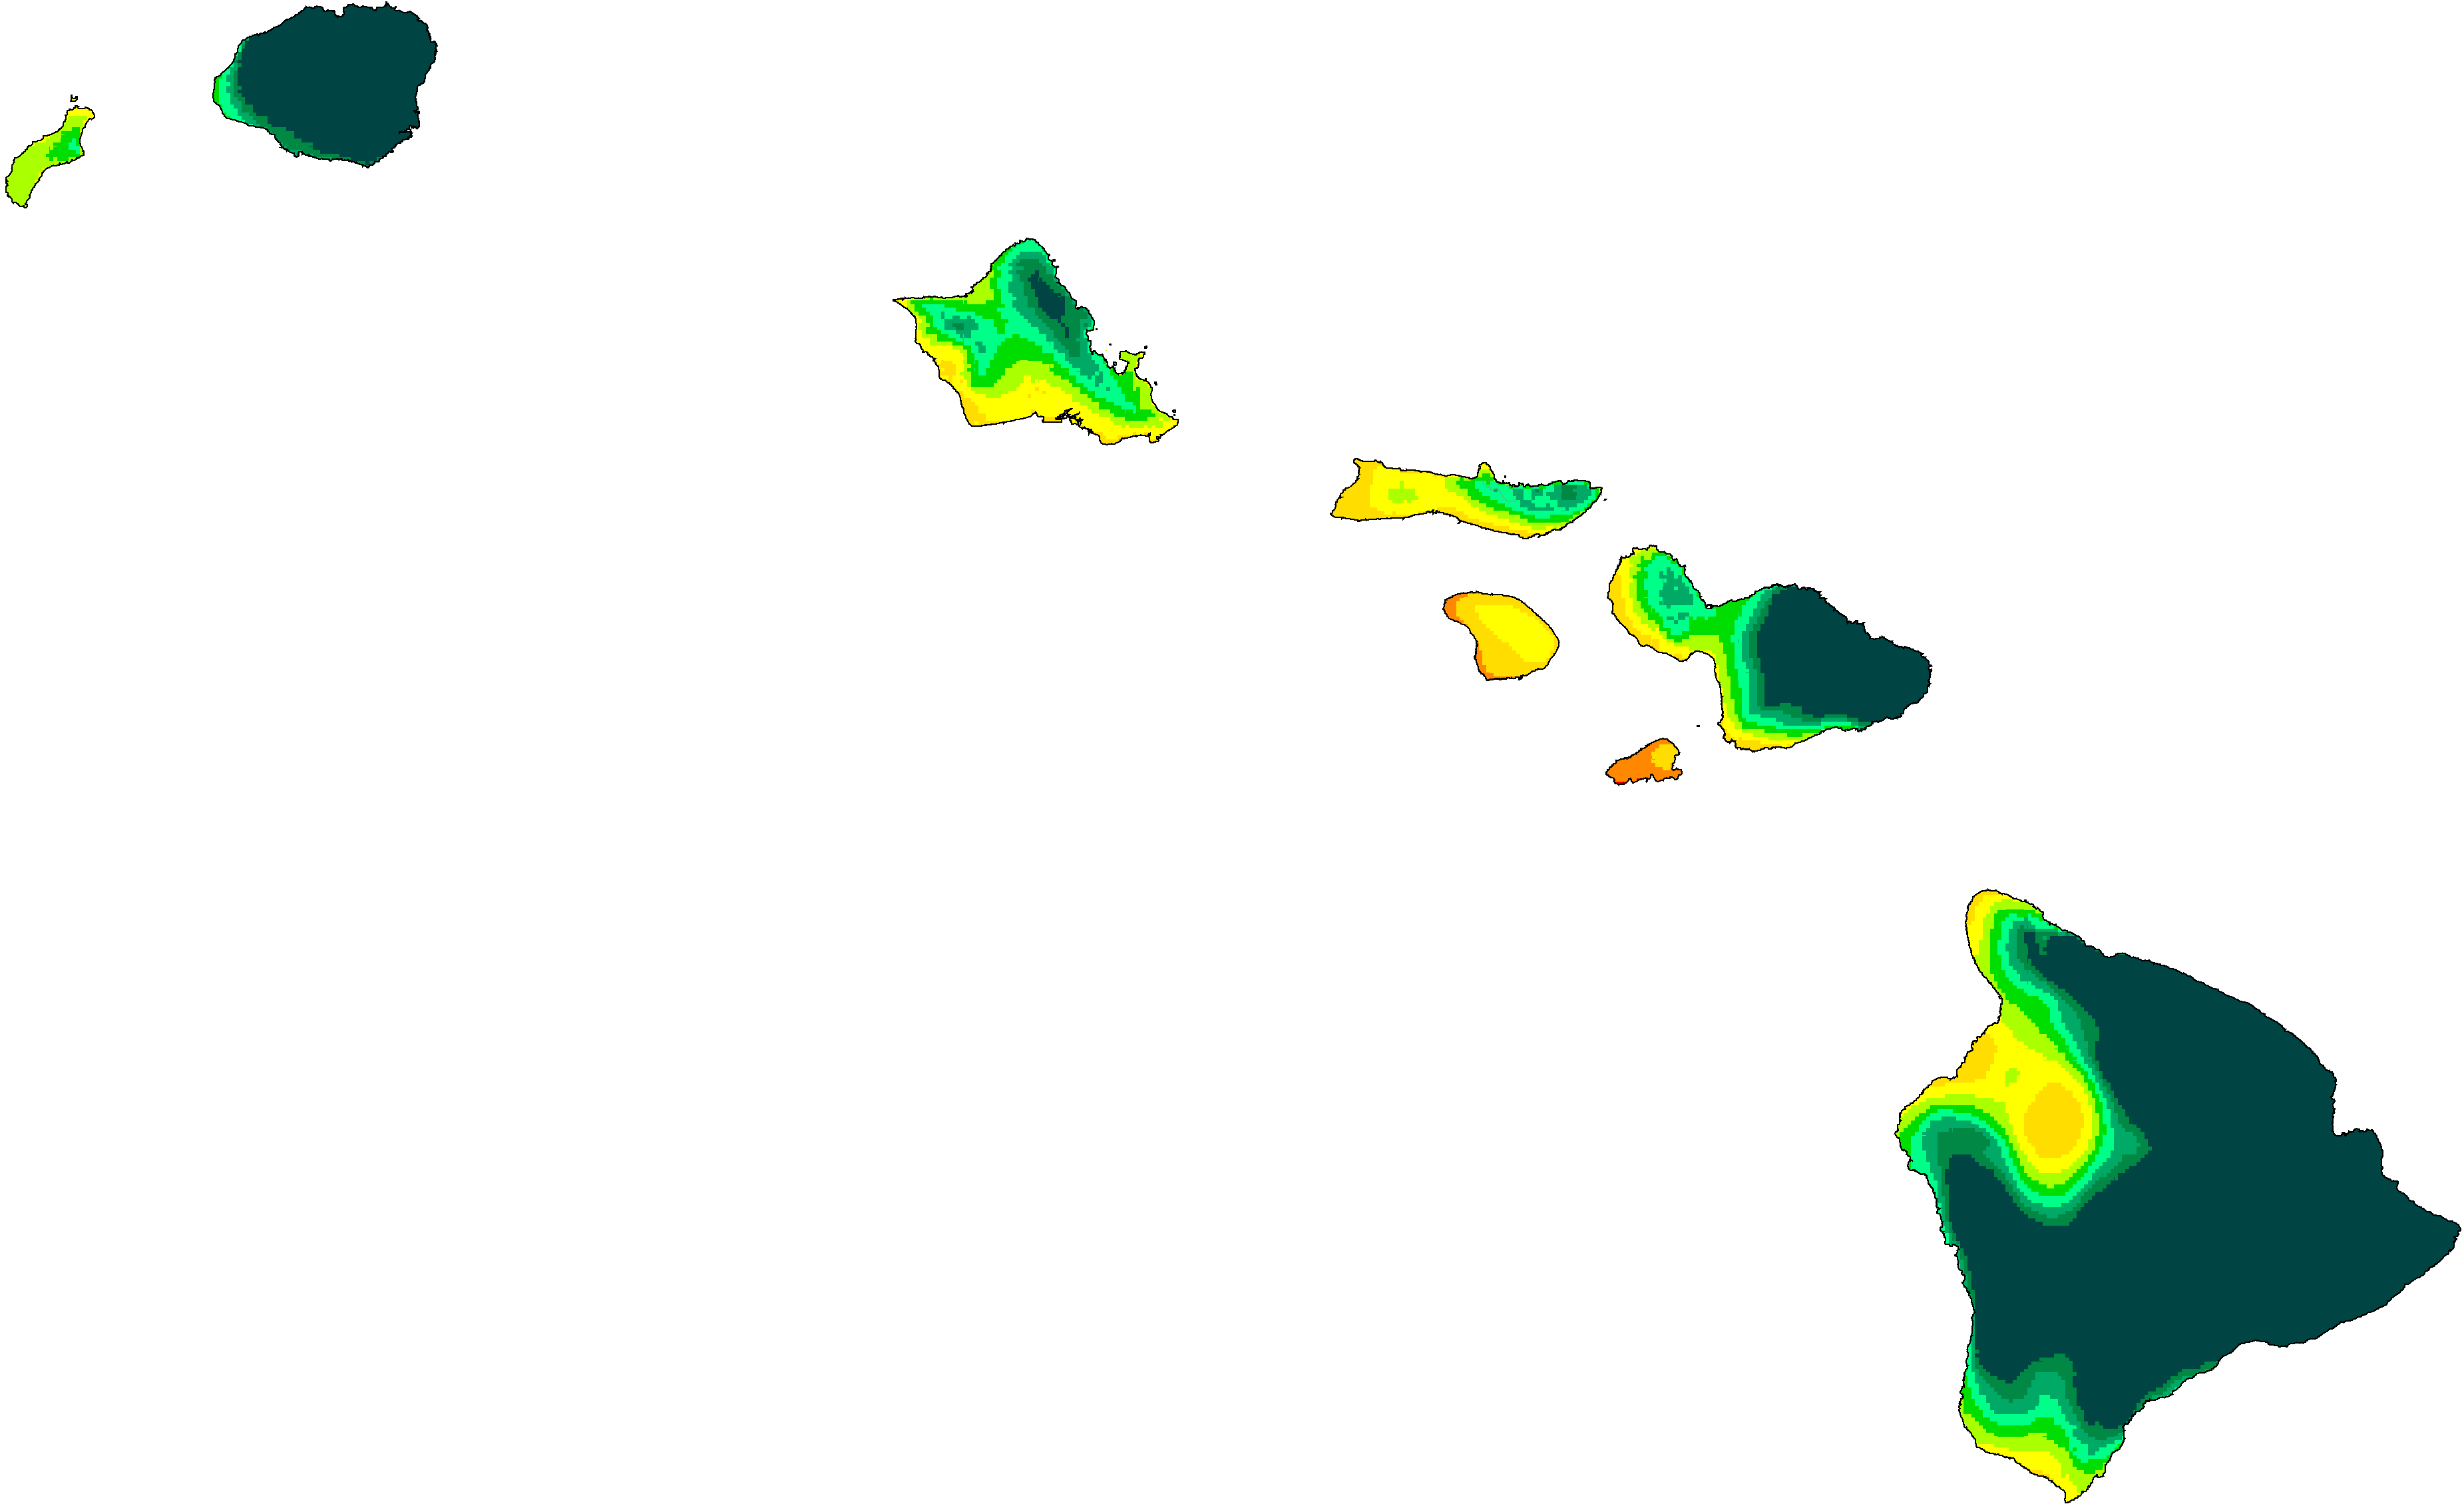
Hawaii distribution of aridity categories (projections are SSP5-8.5 high emissions normals)

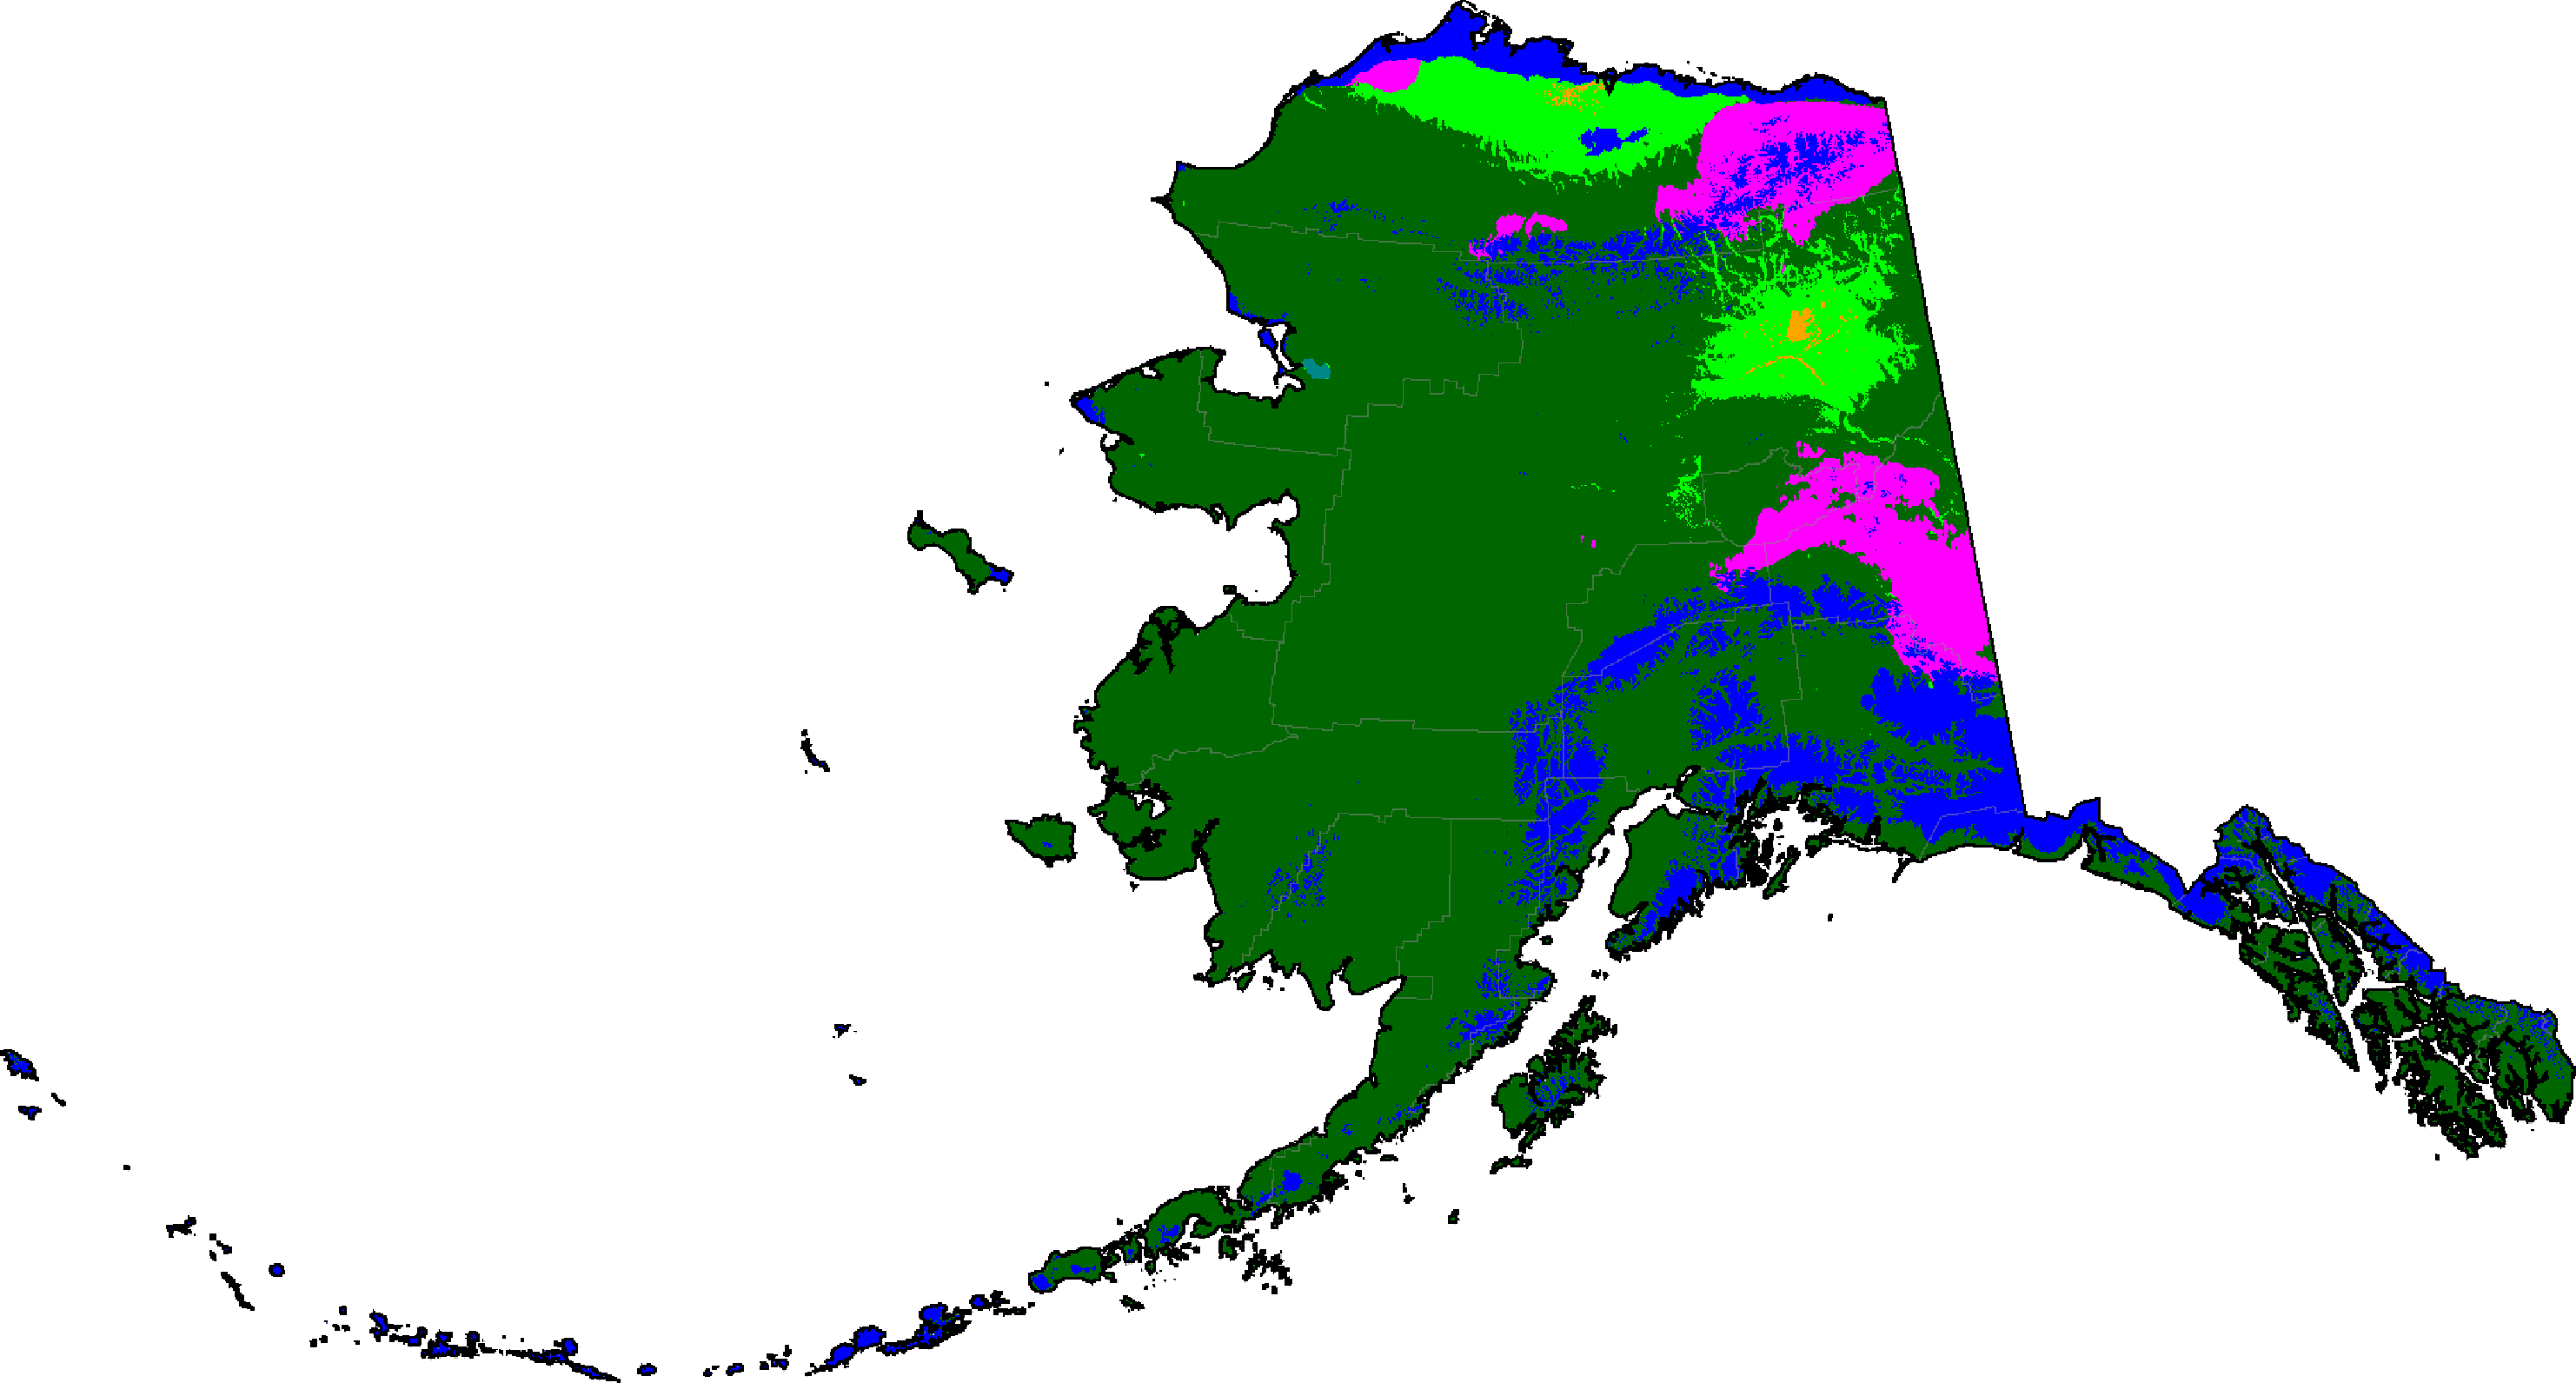
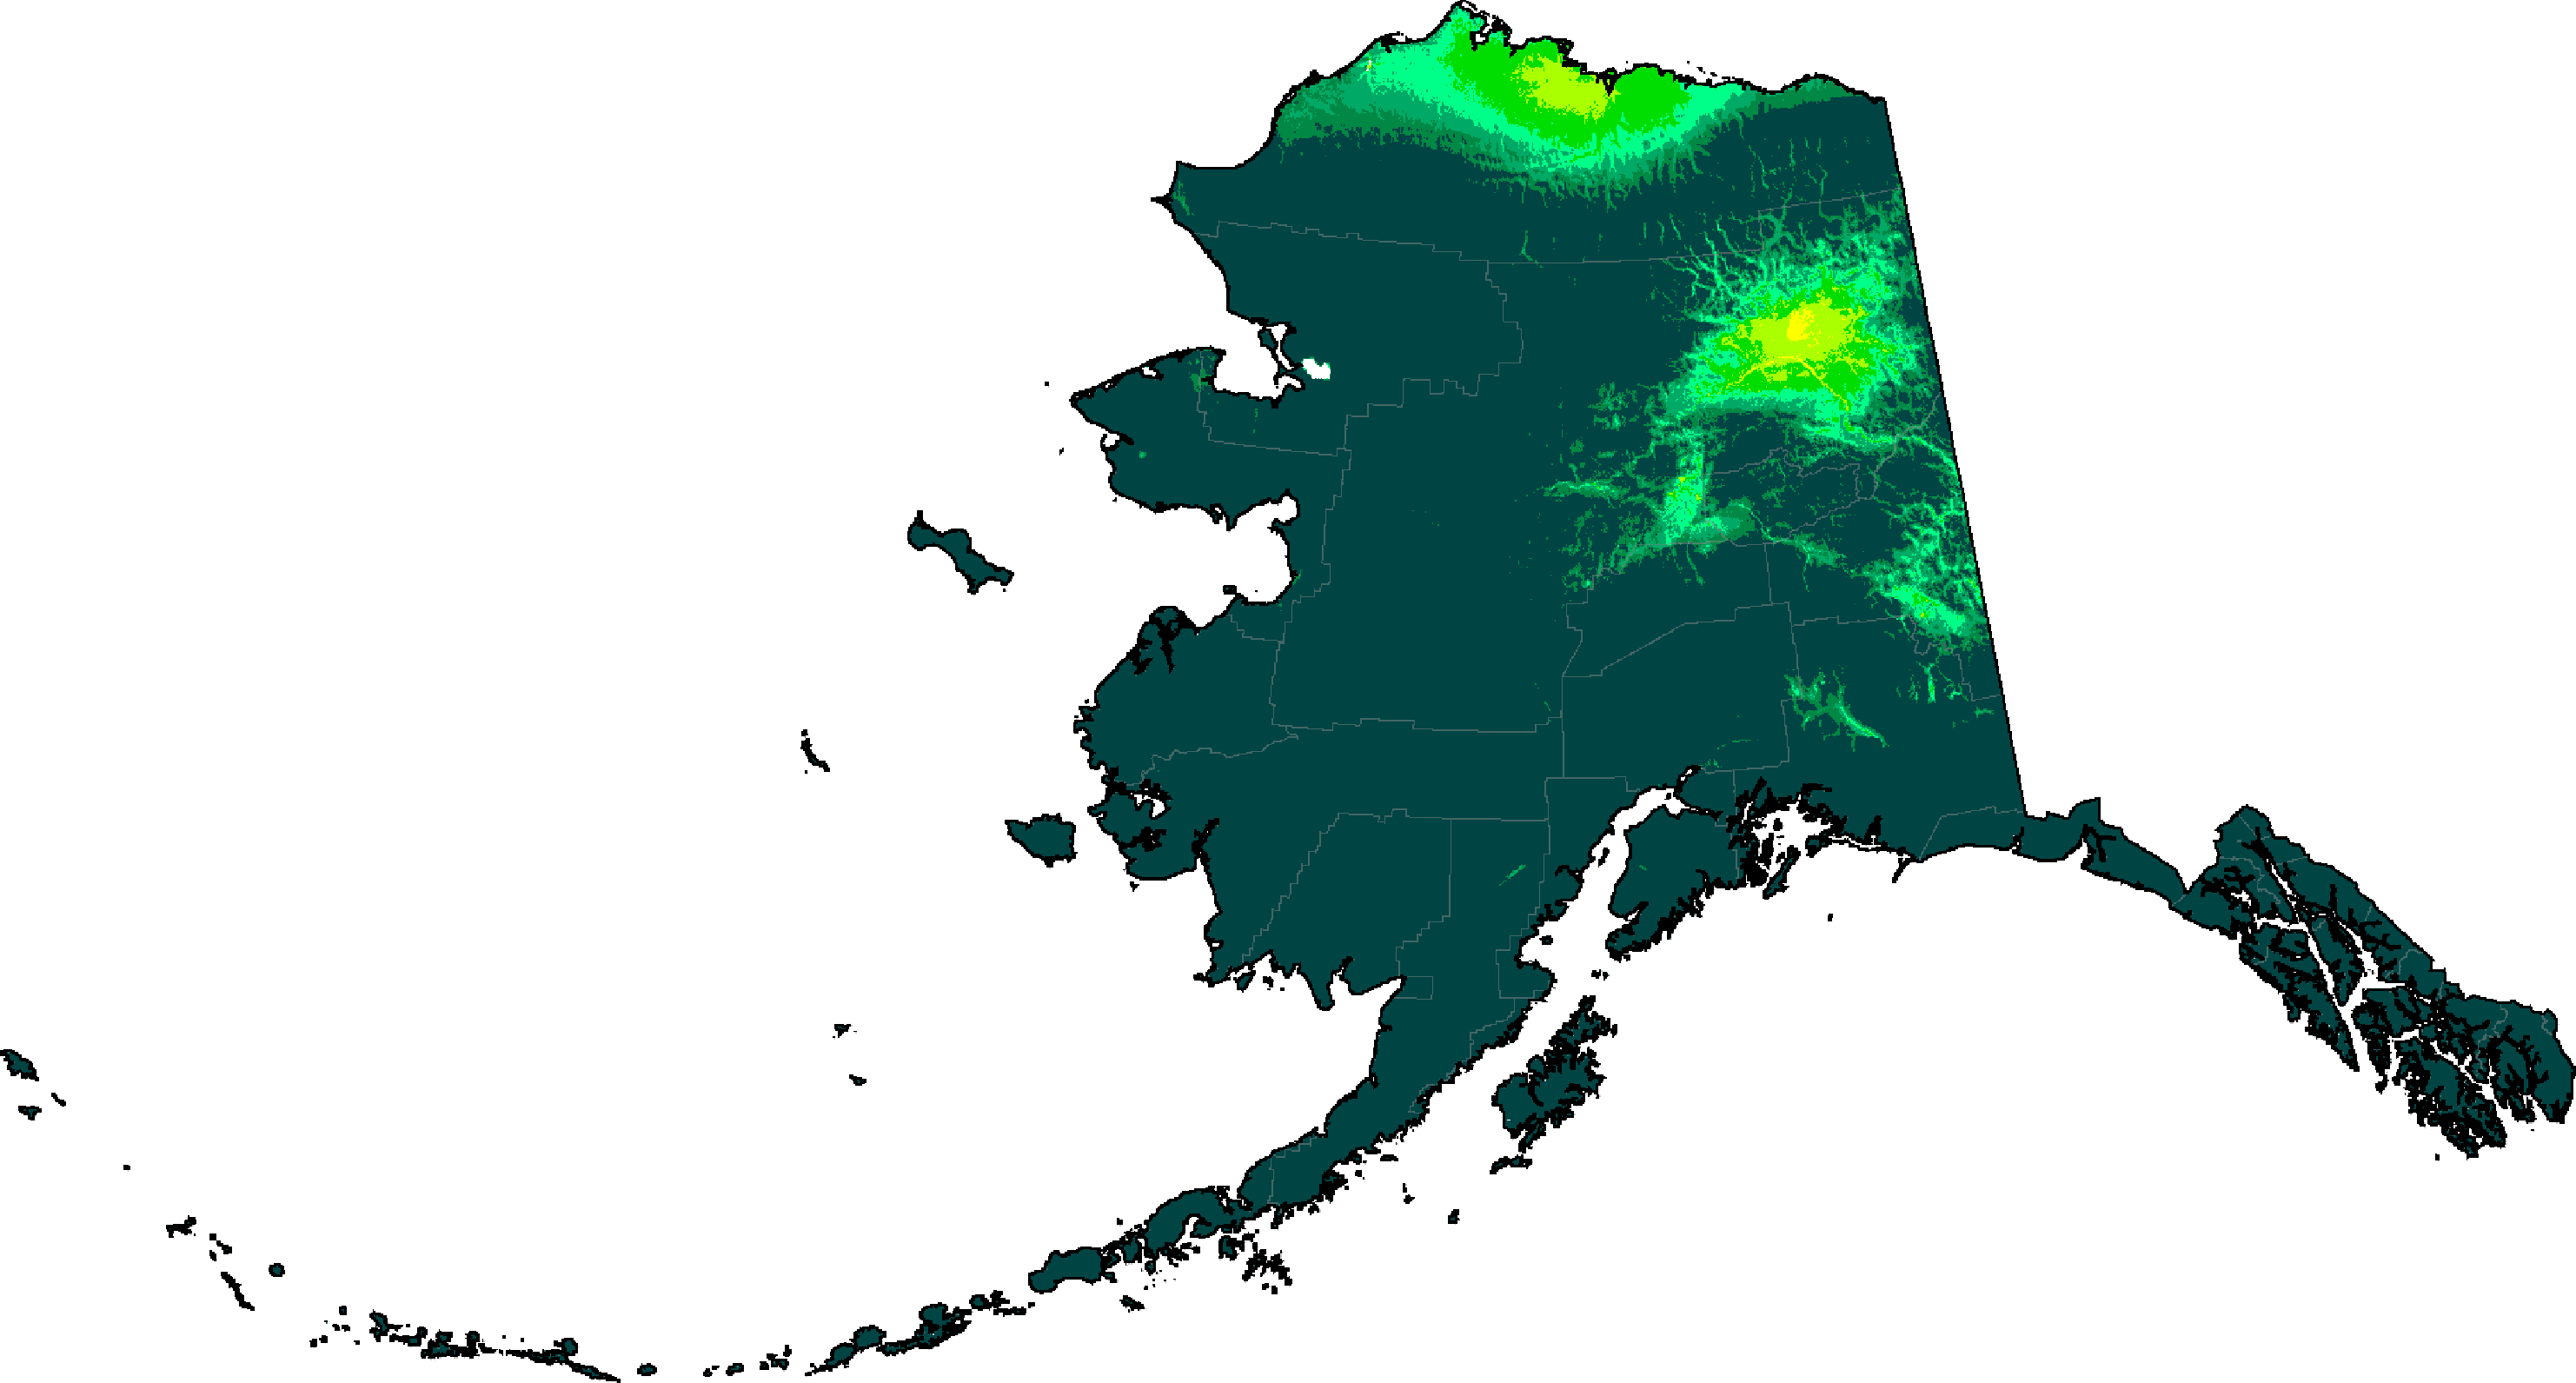
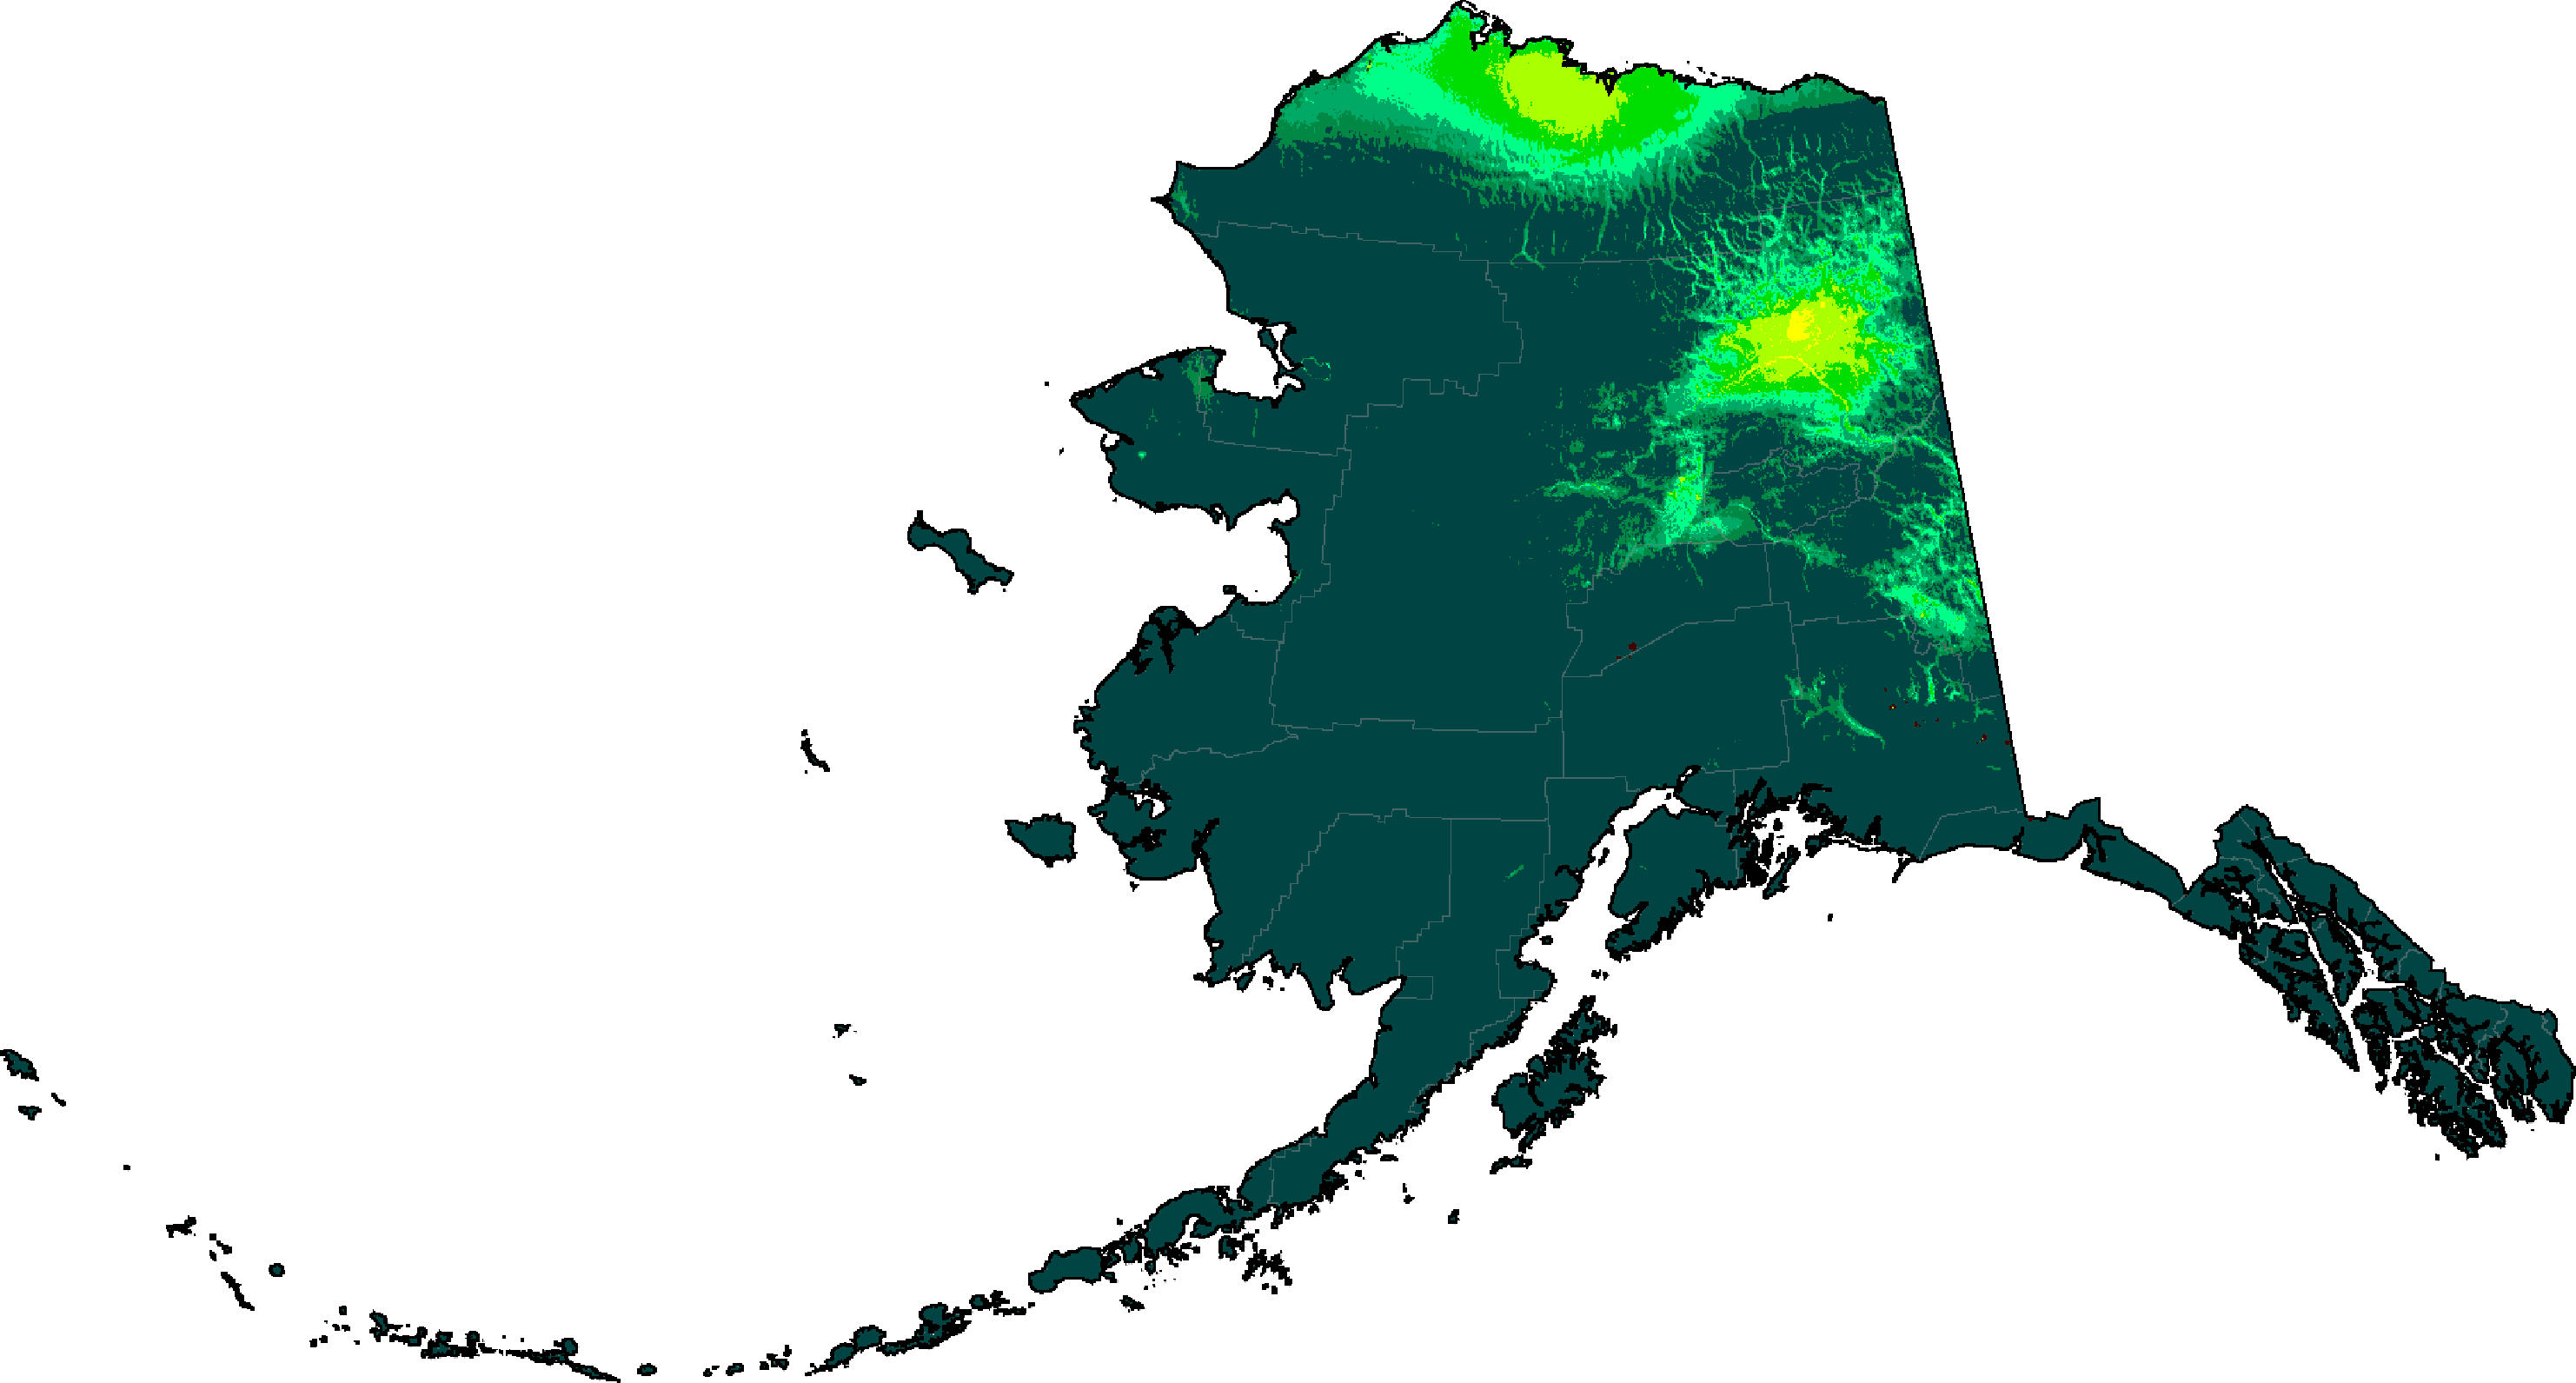
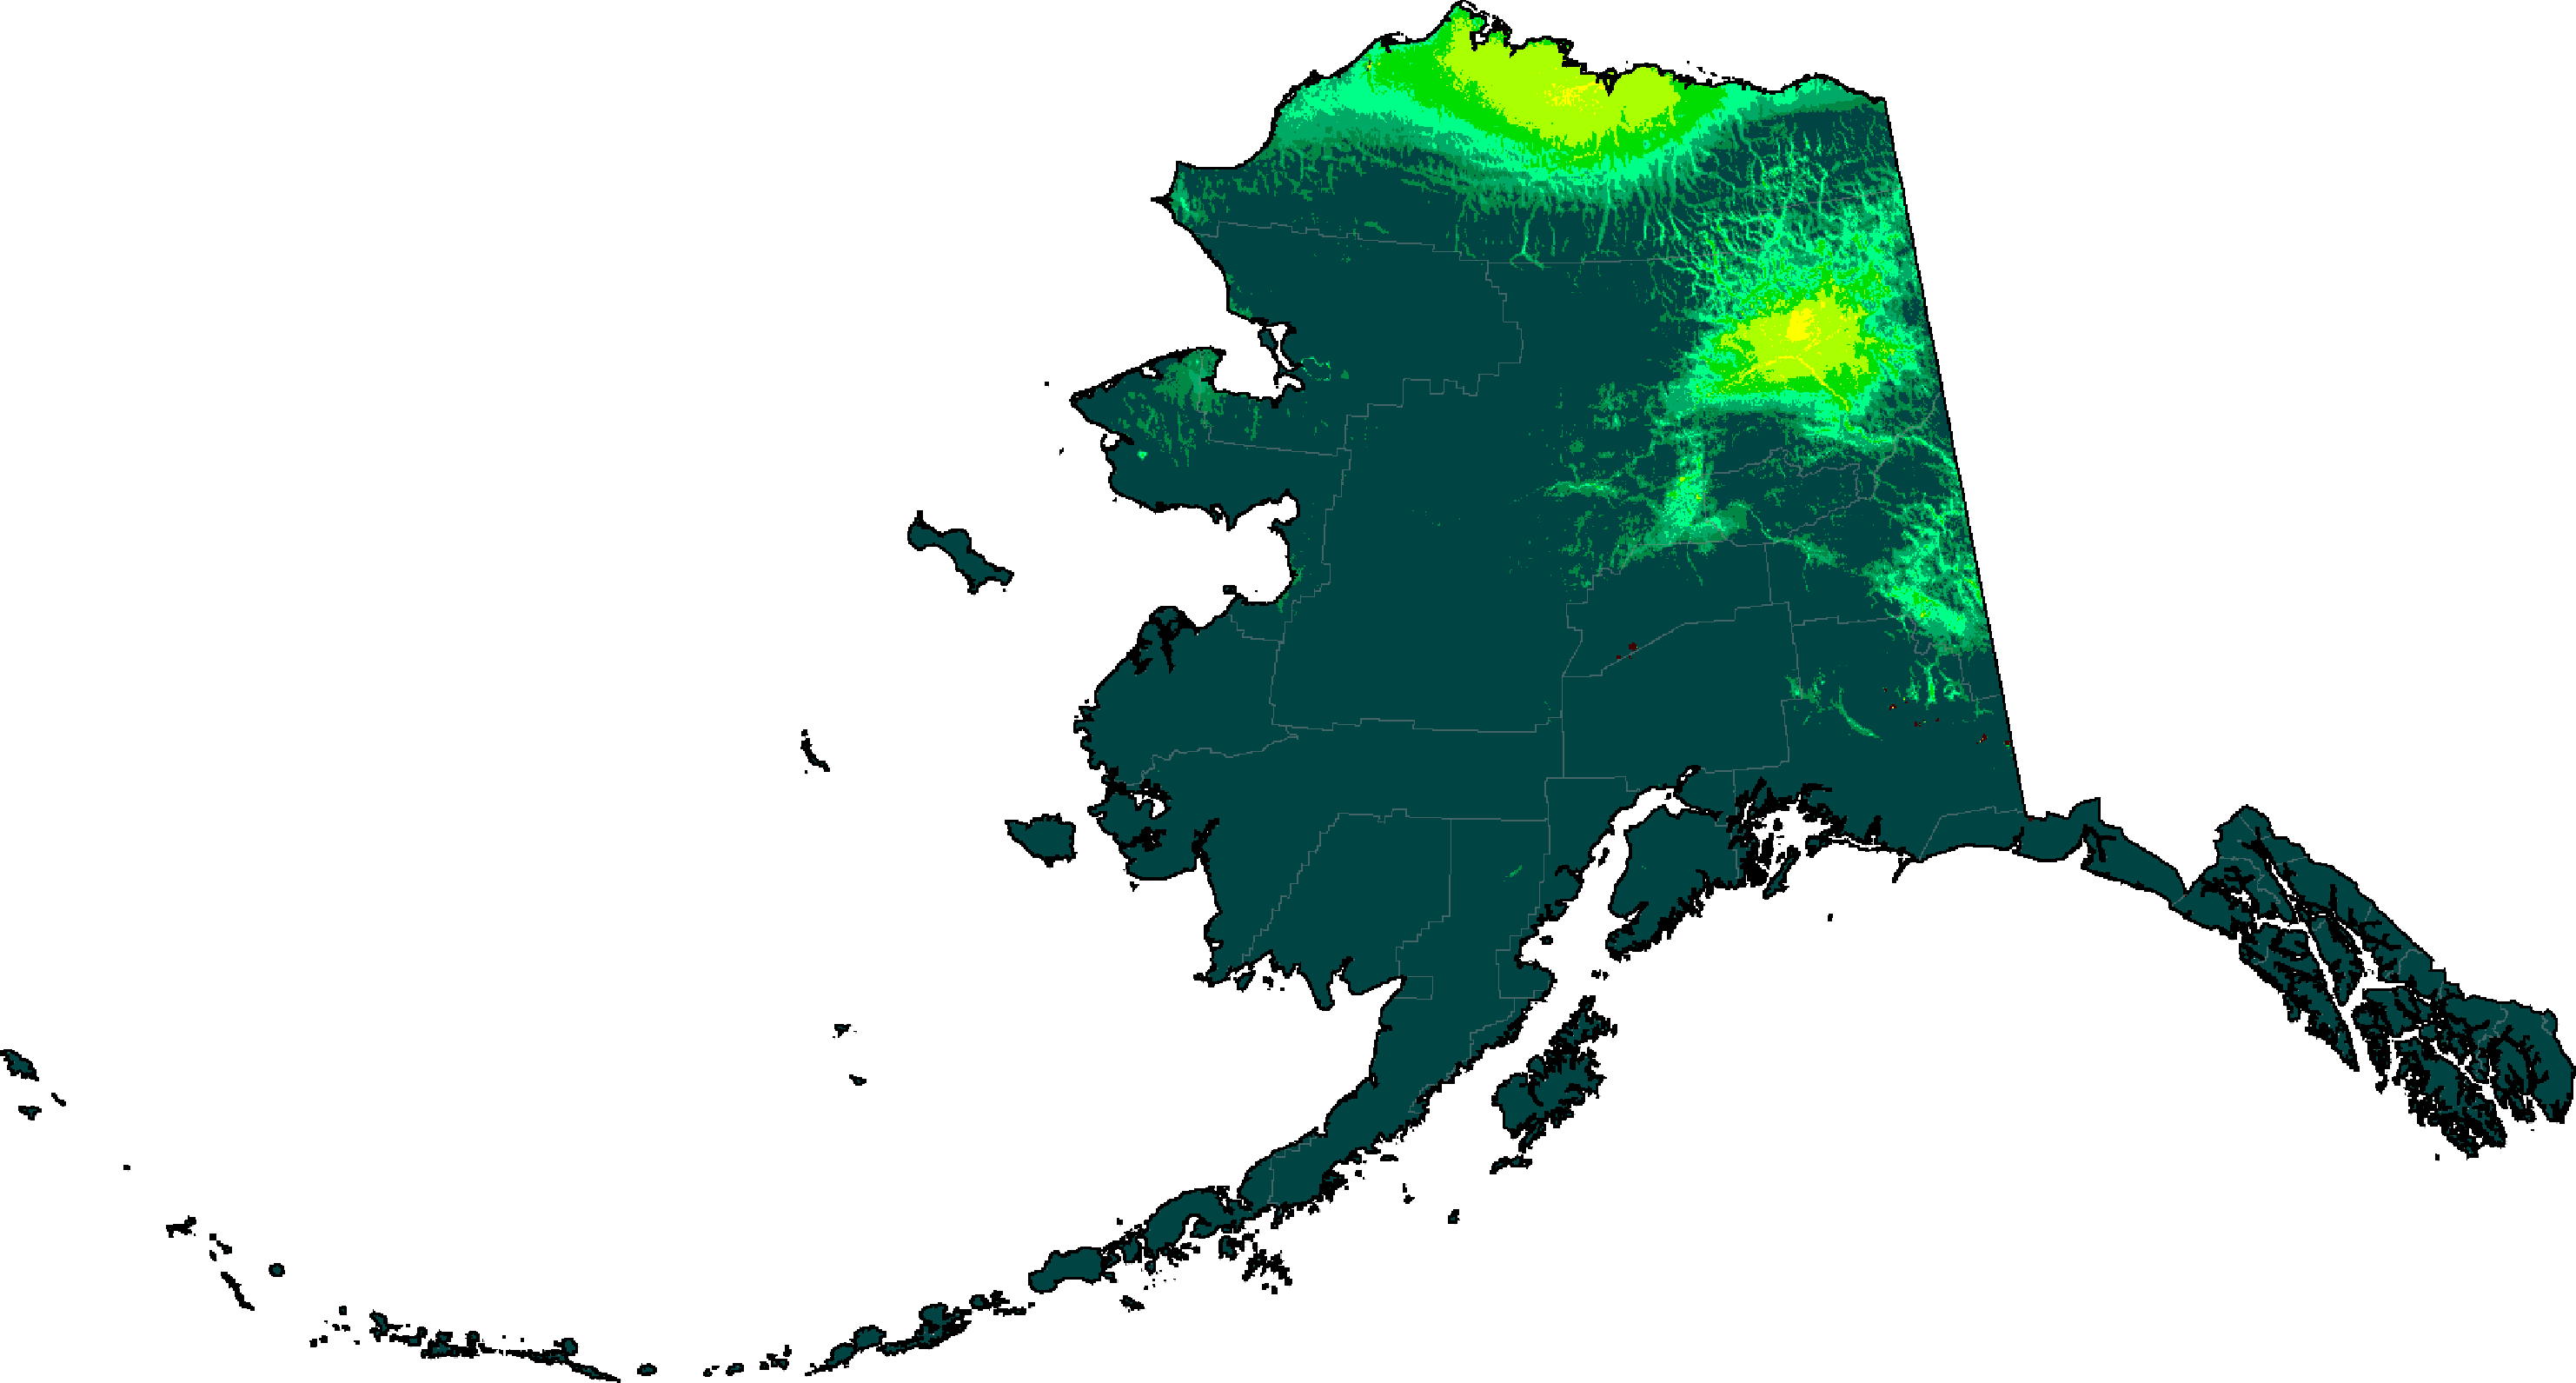
Alaska distribution of aridity categories (projections are SSP5-8.5 high emissions normals)
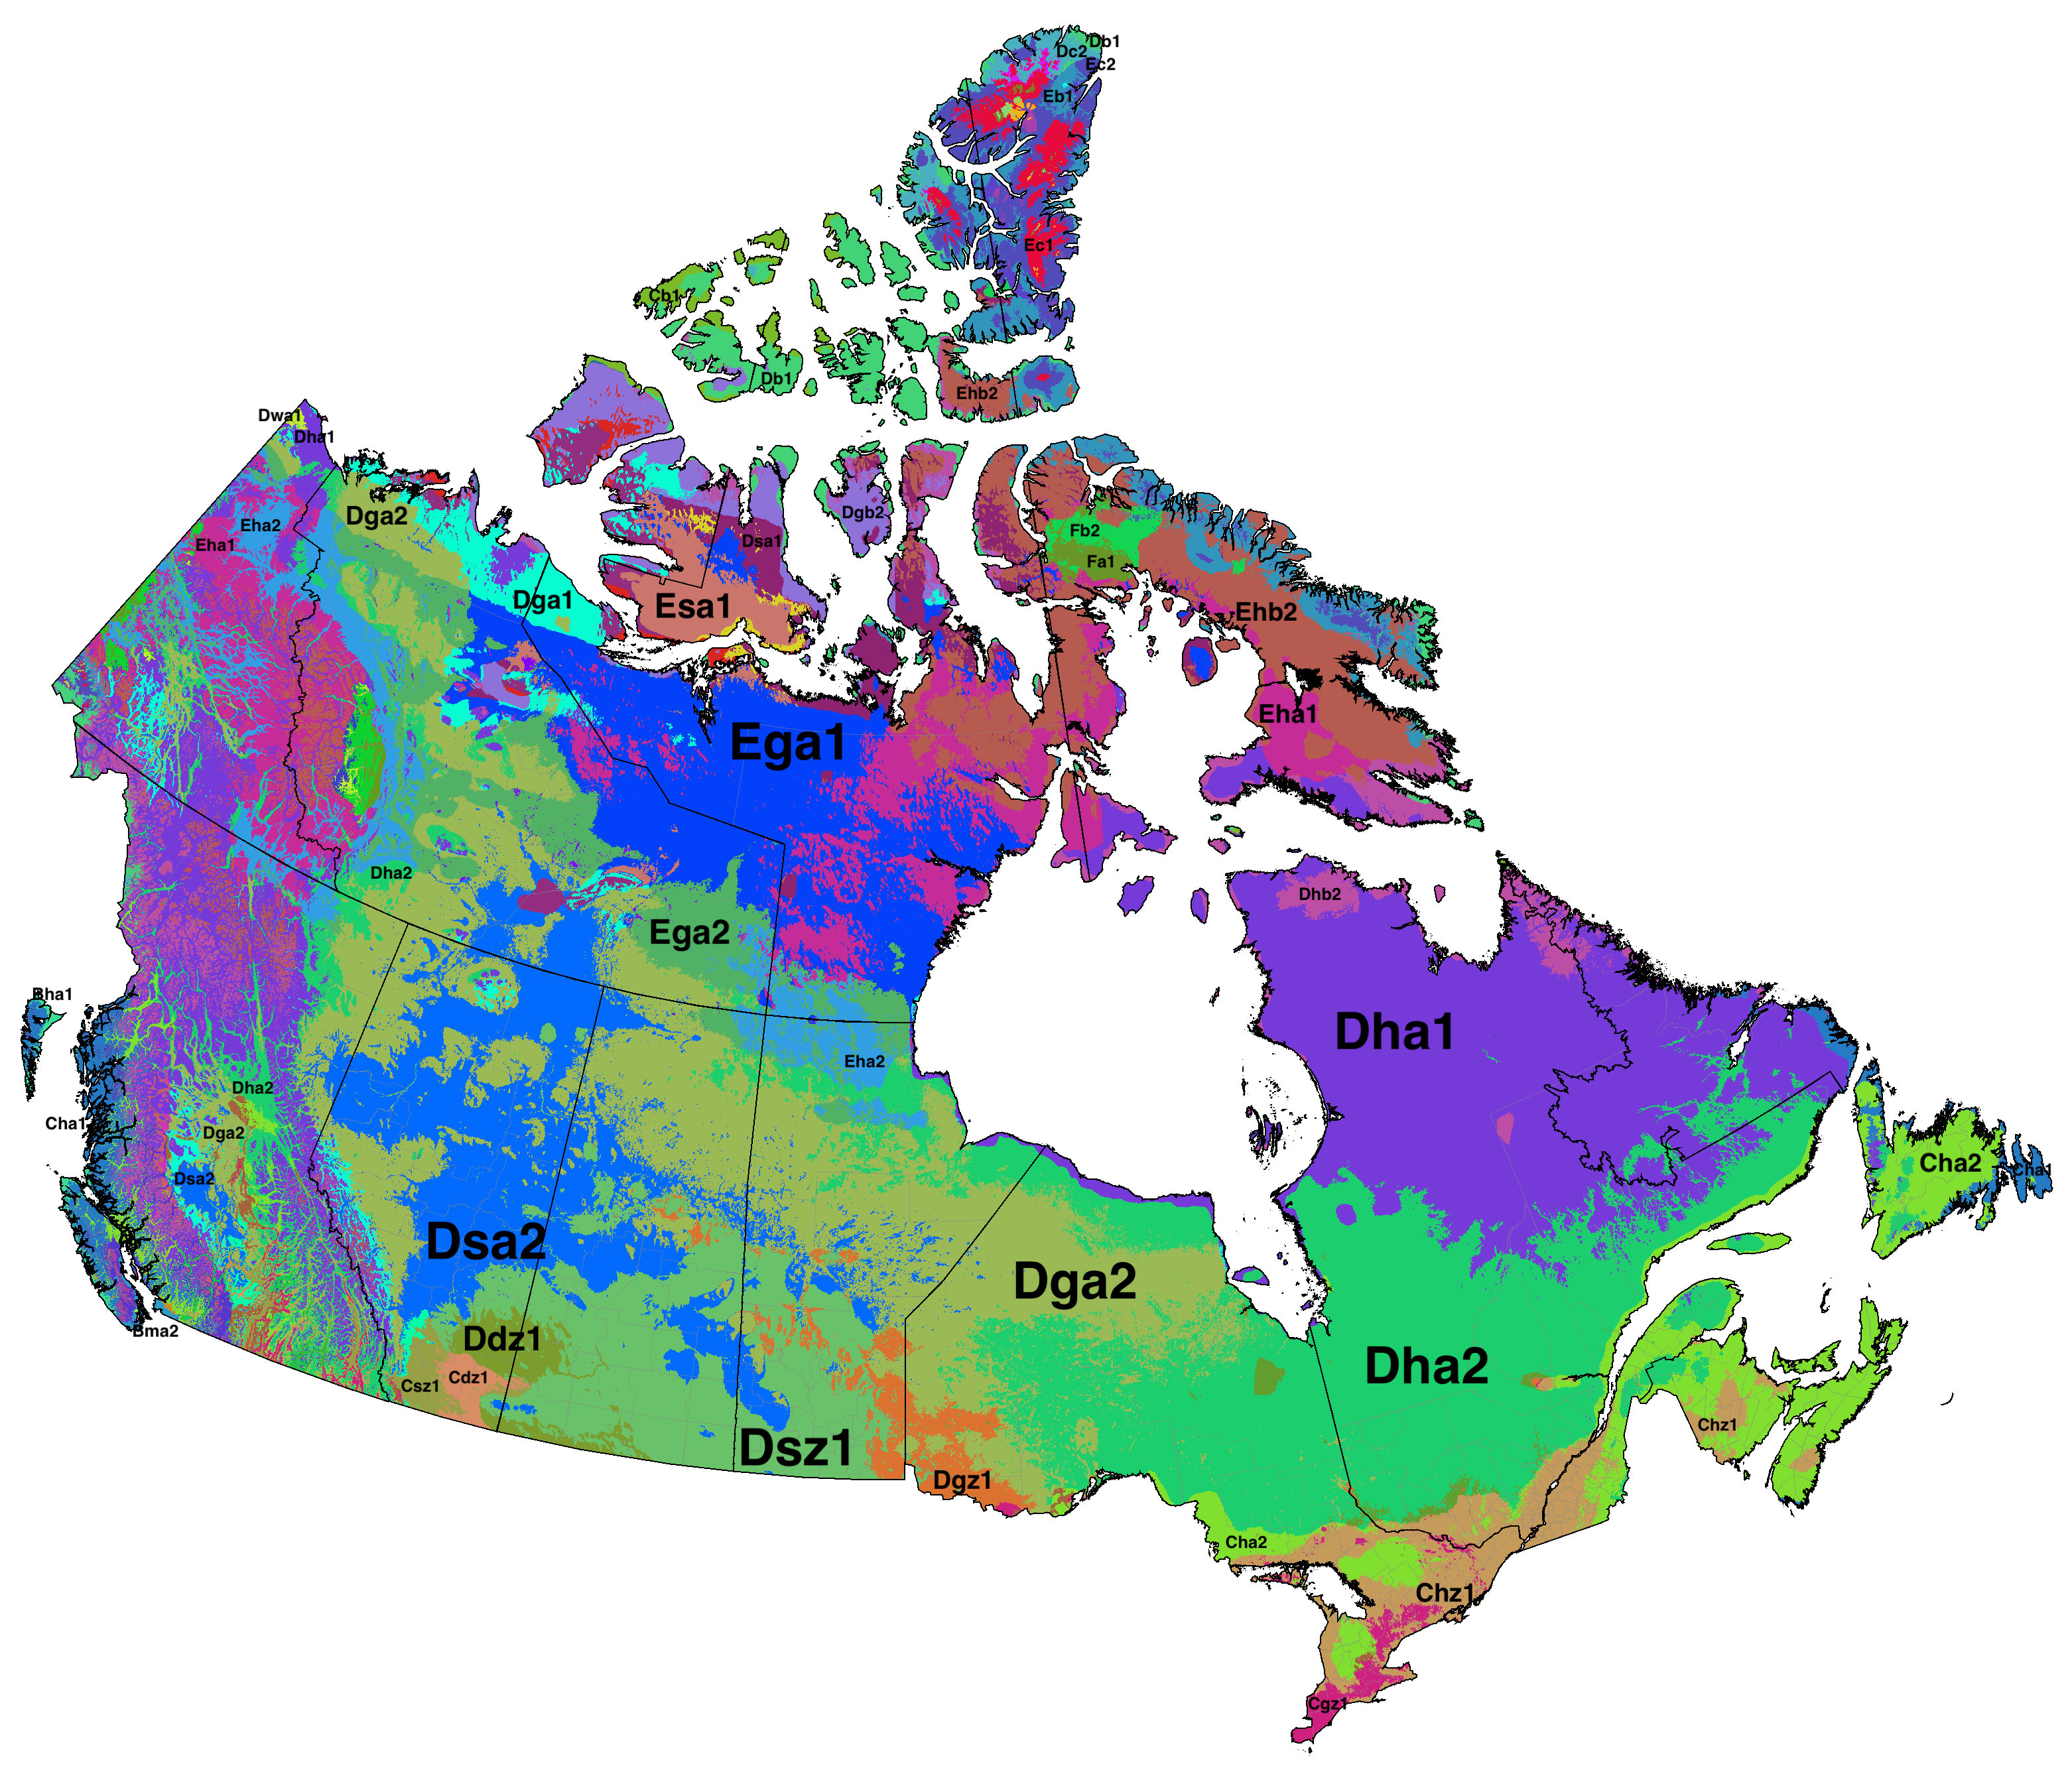
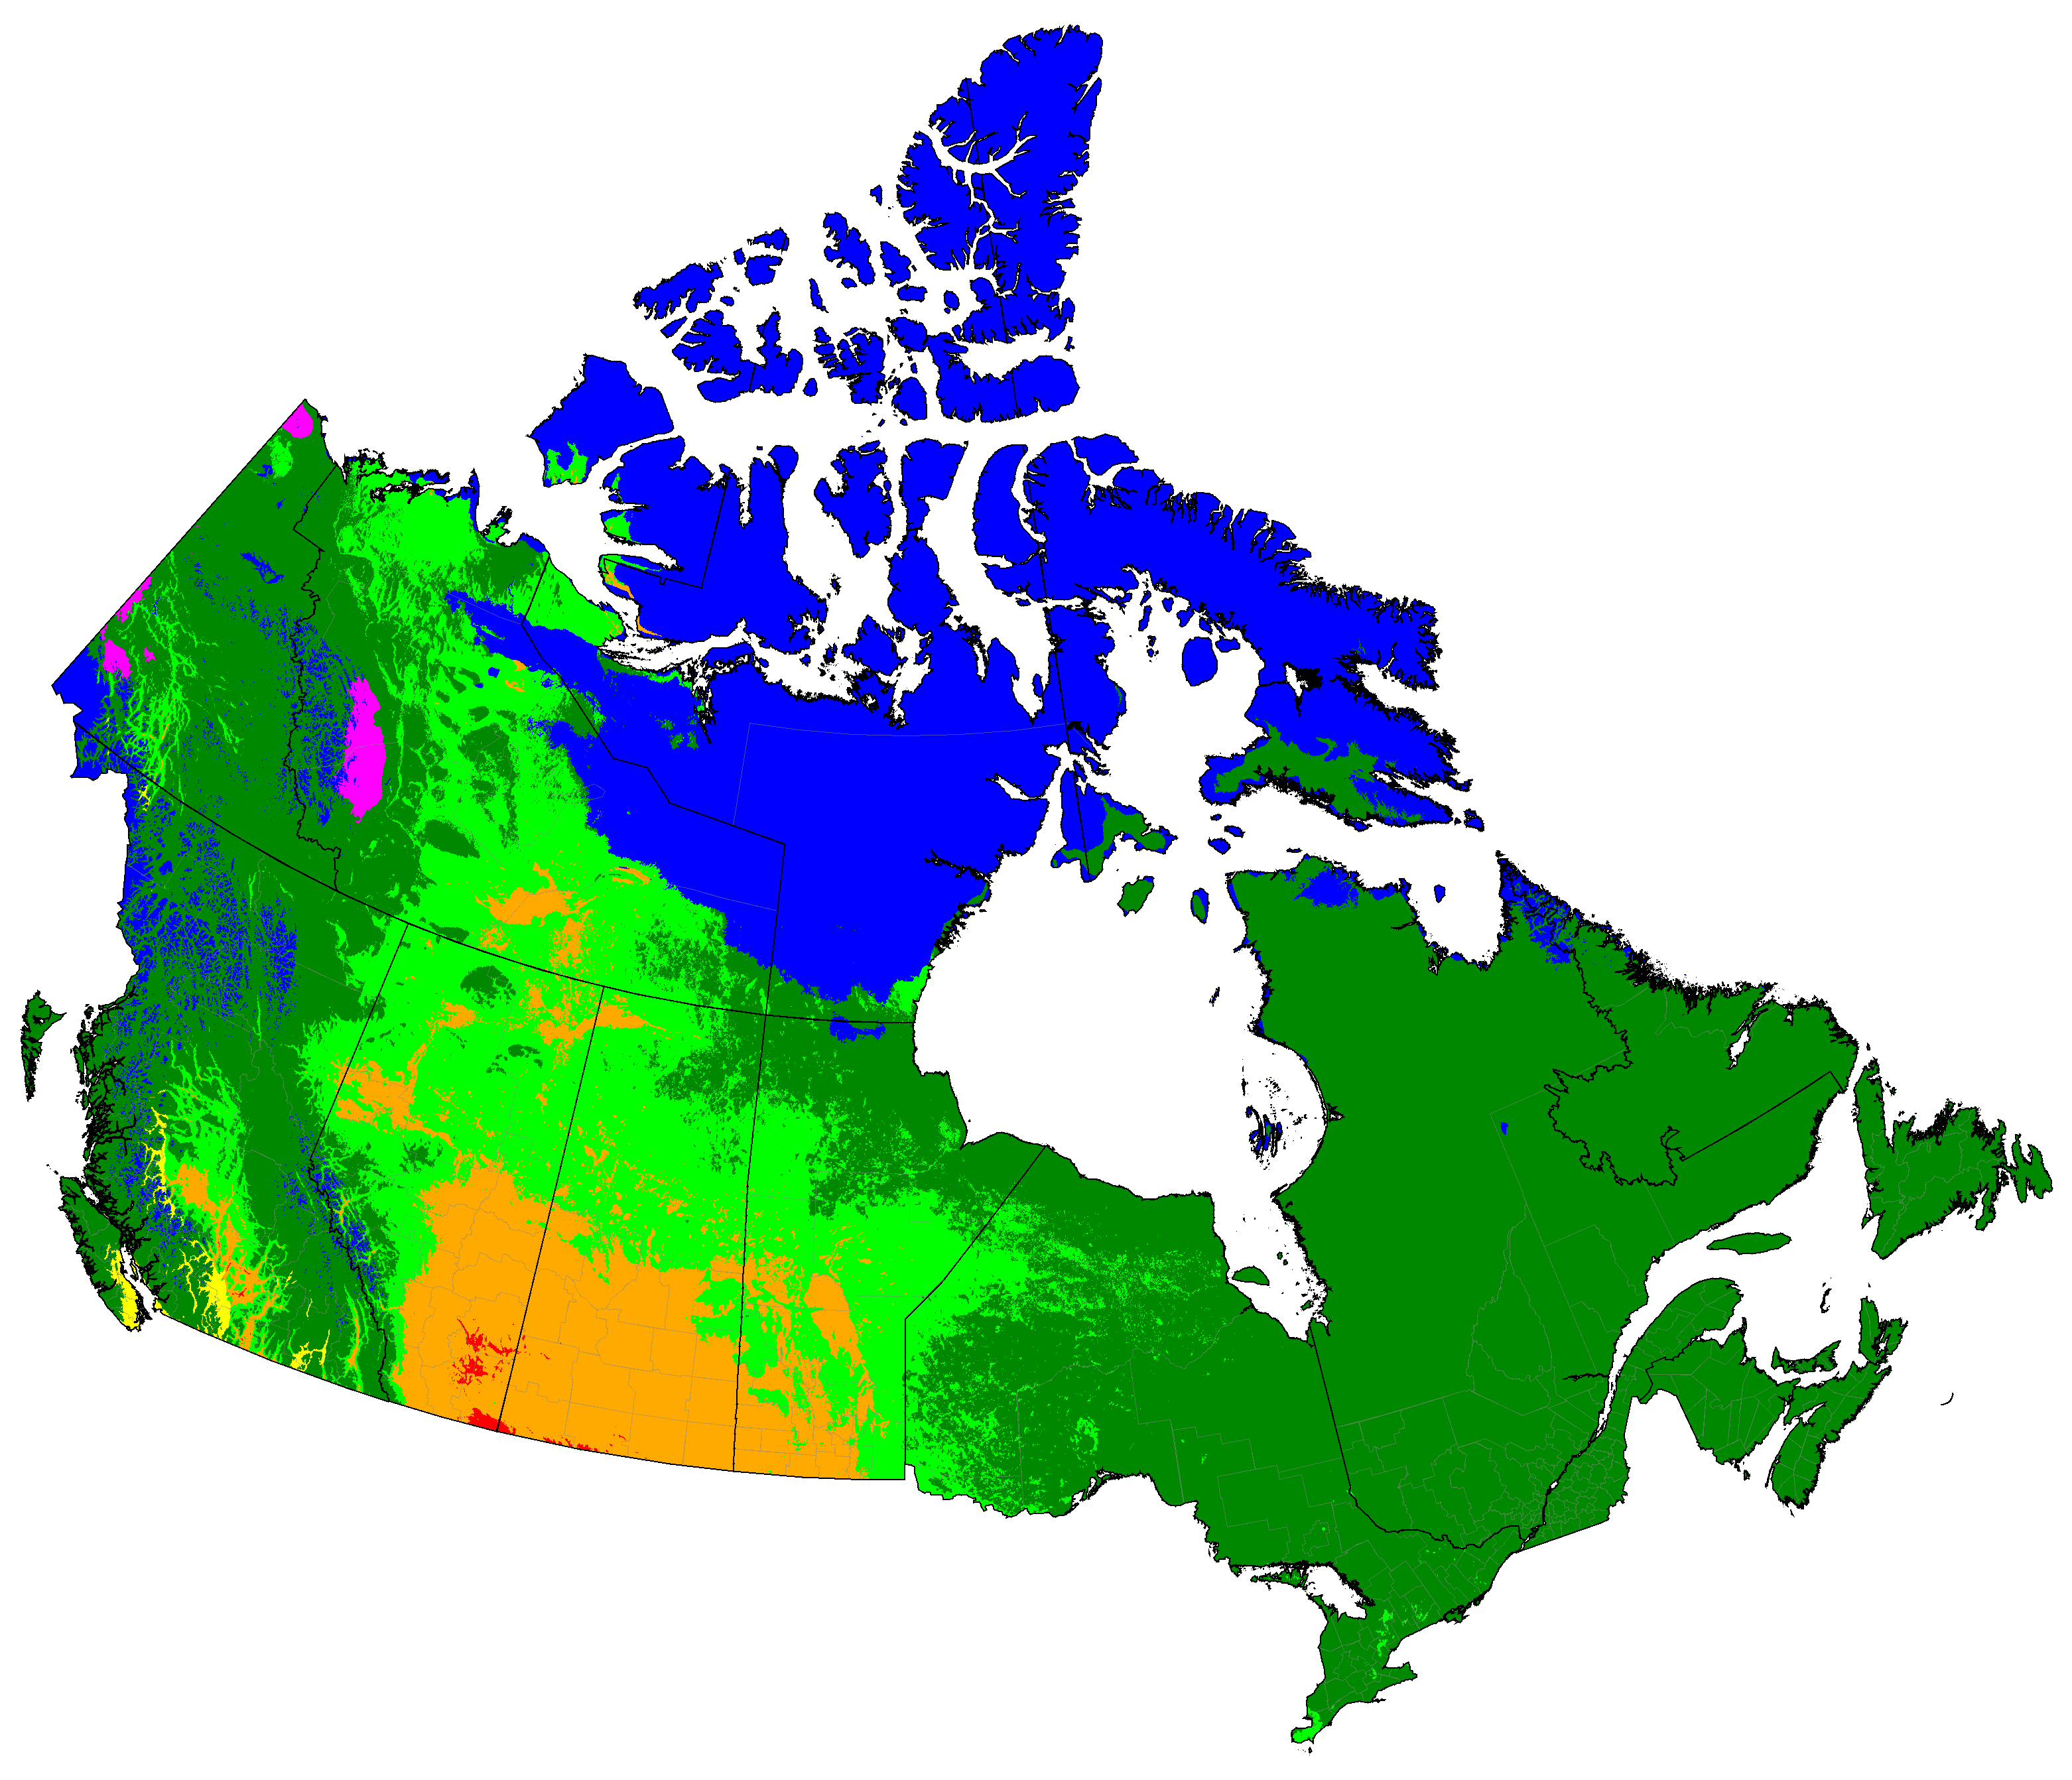
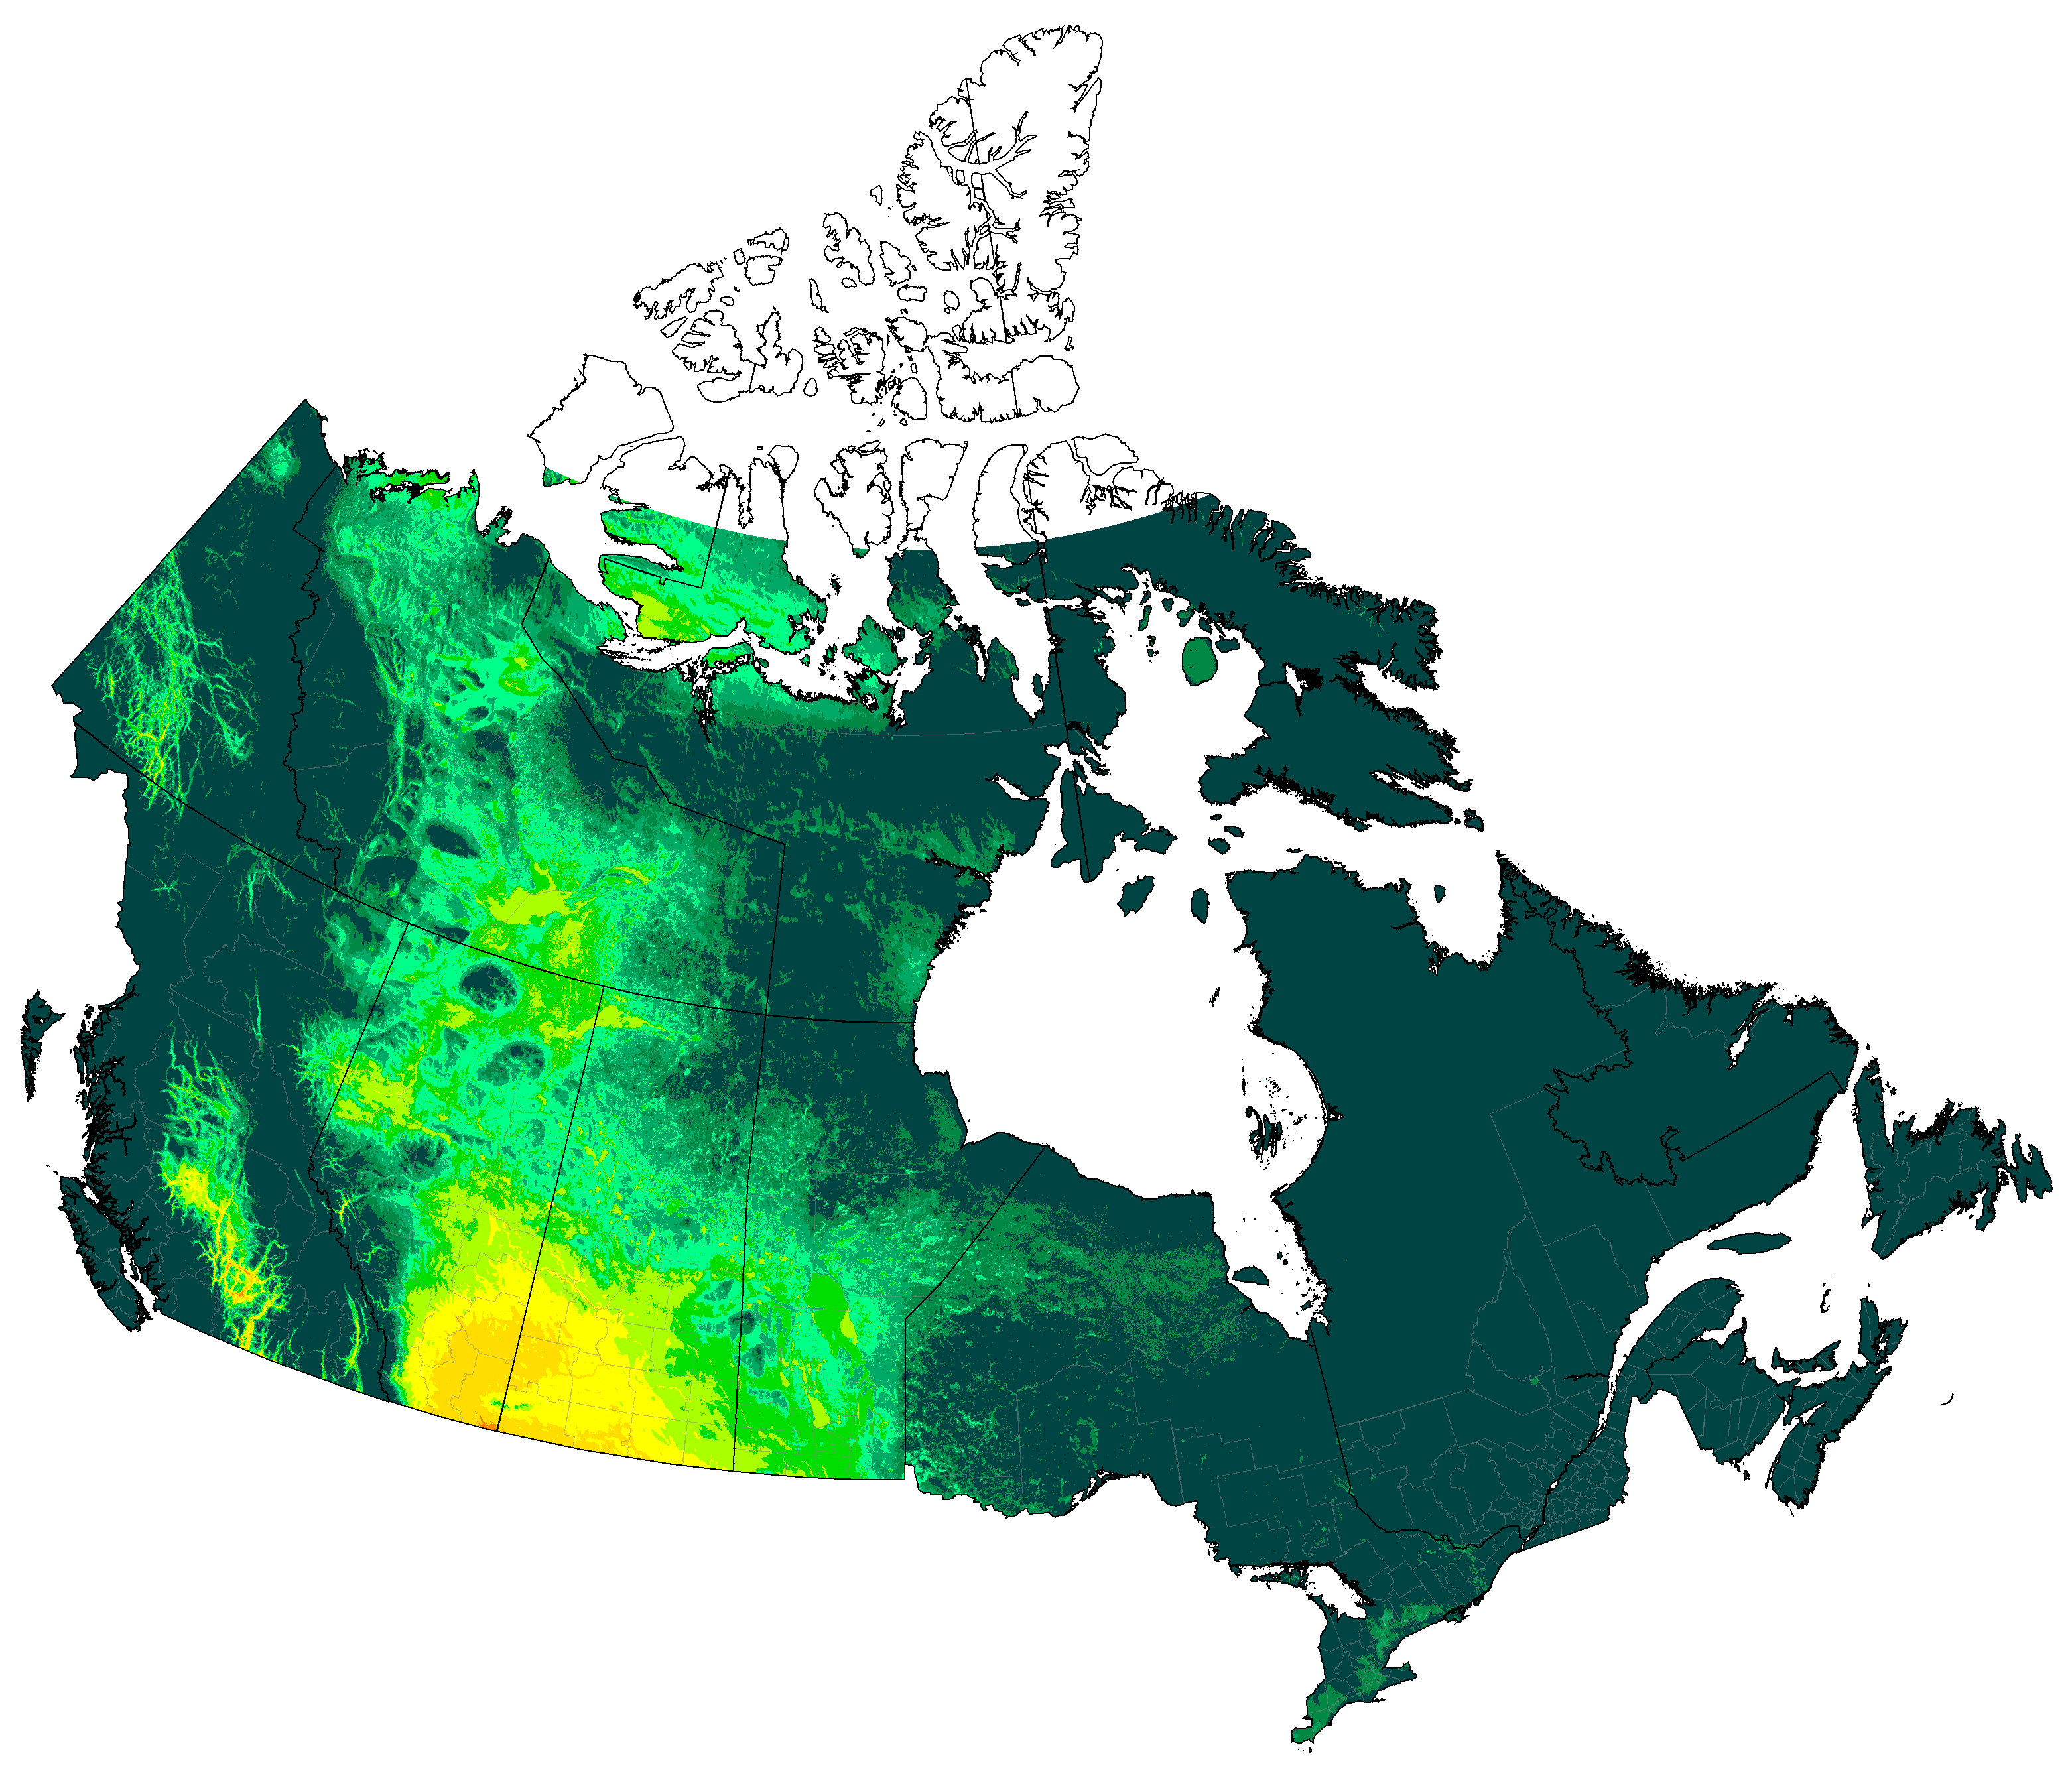
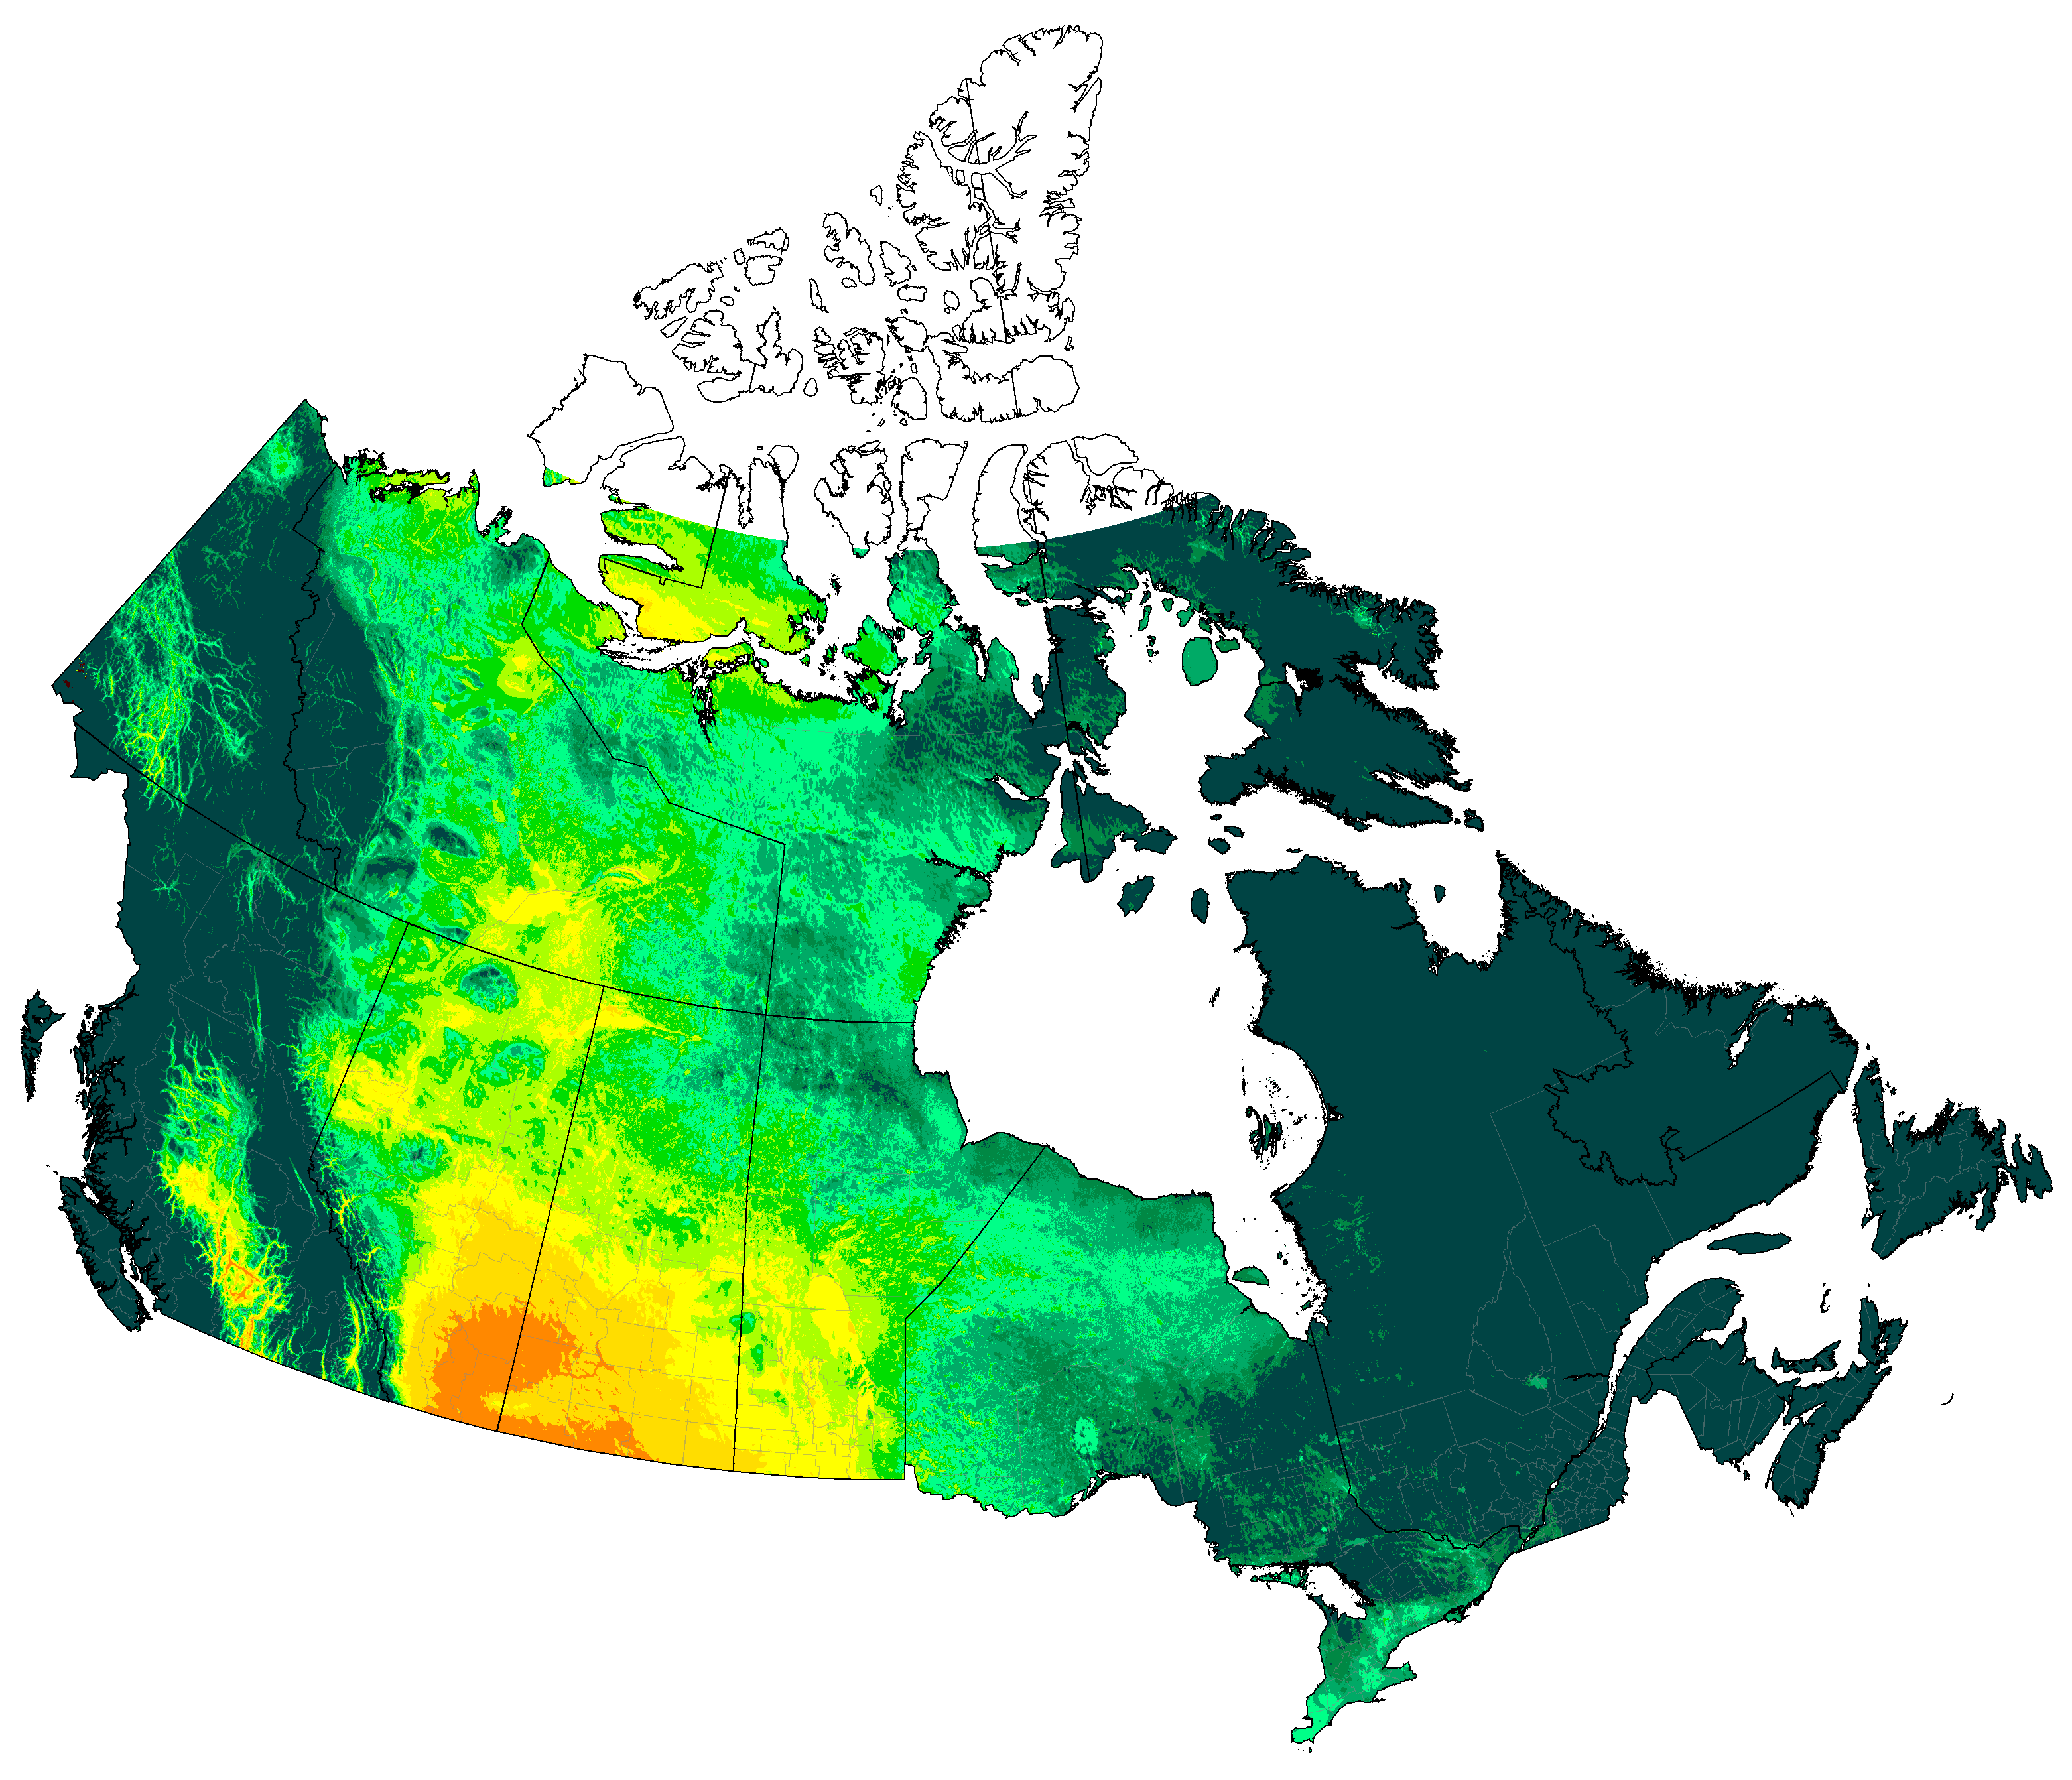
Canada distribution of aridity categories (projections are SSP5-8.5 high emissions normals)
Note: The vertical line in the middle of Nunavut is a cartographic artifact, not a political boundary.
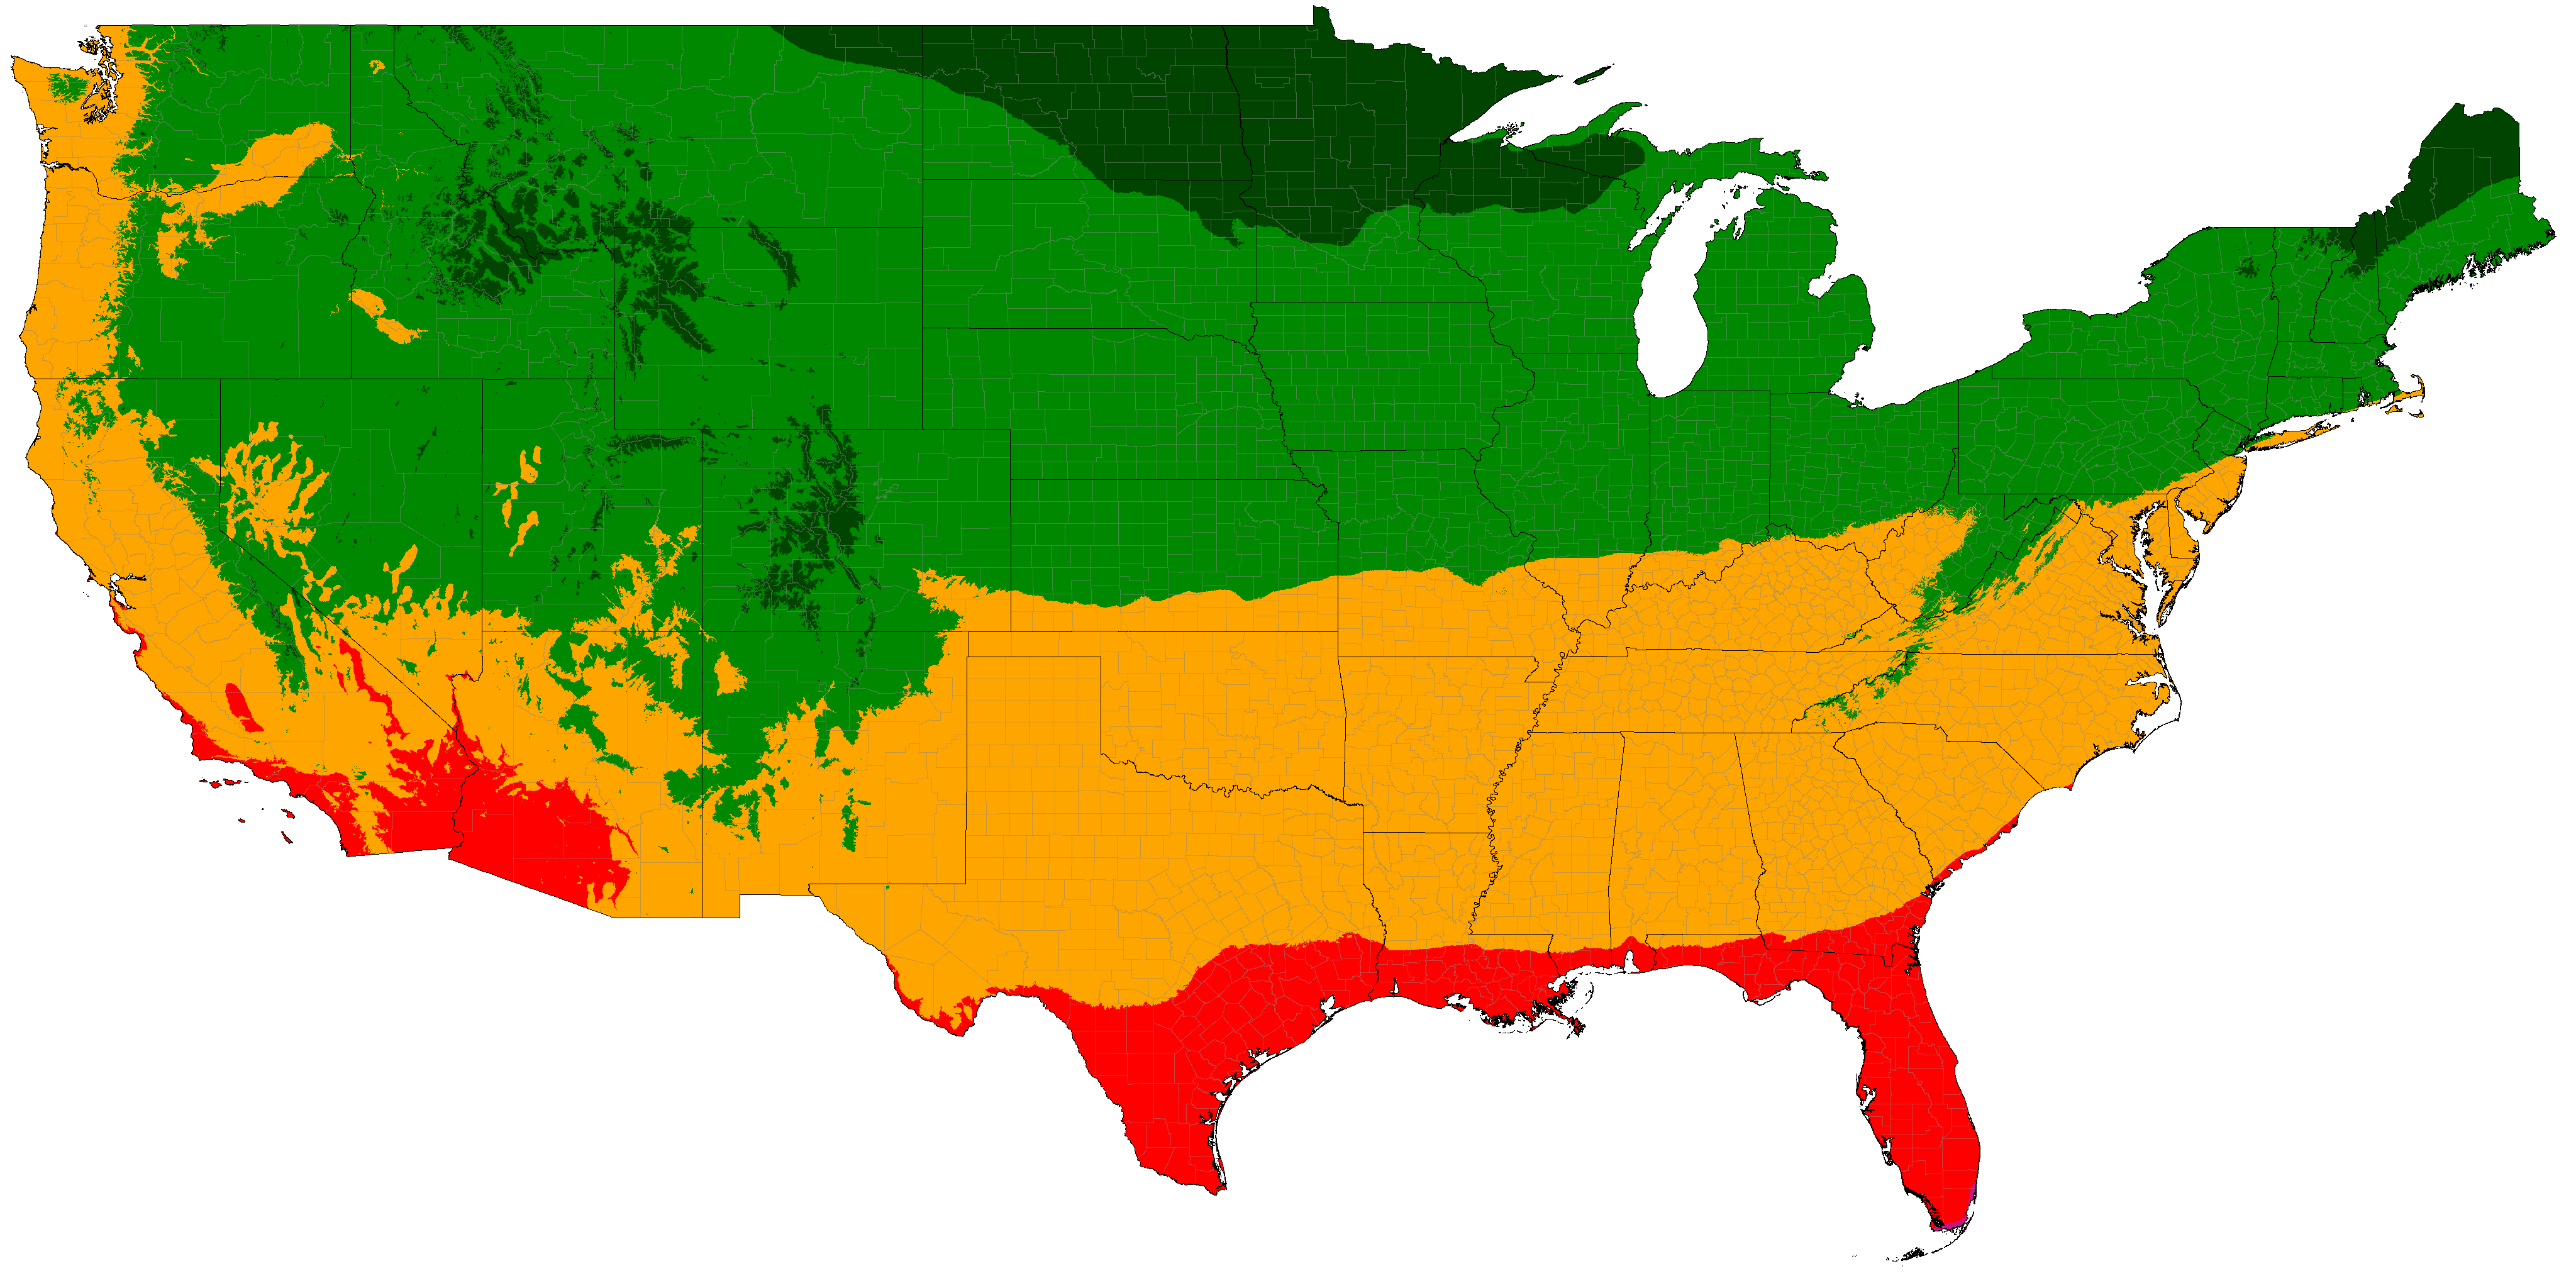
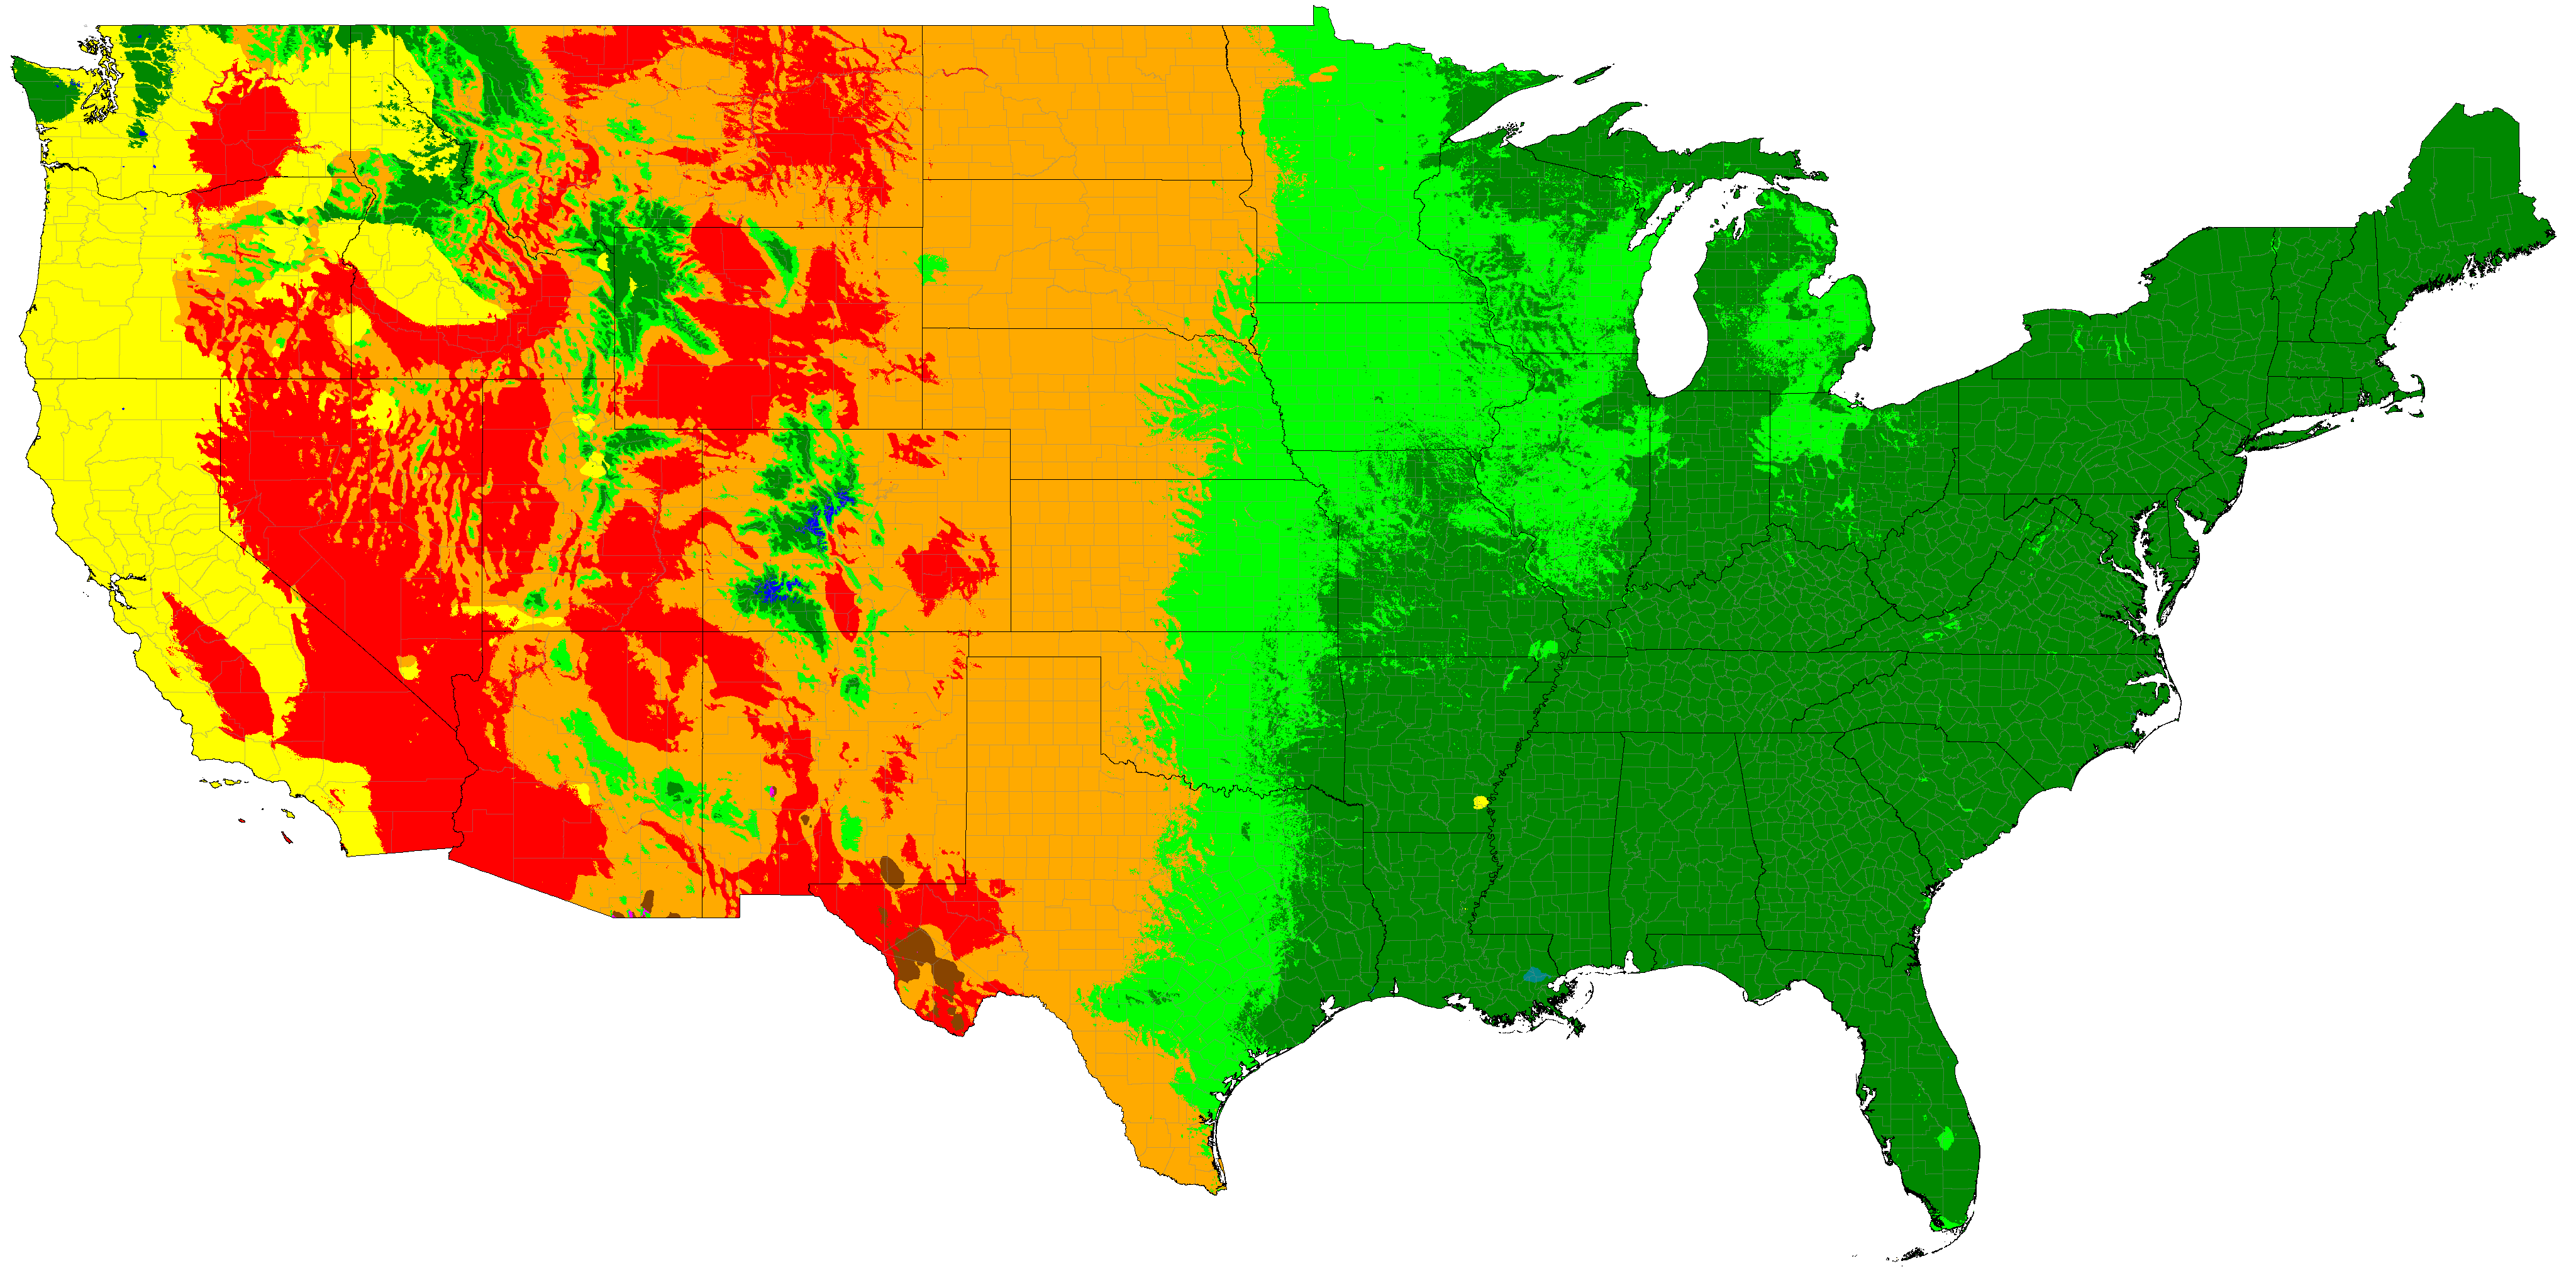
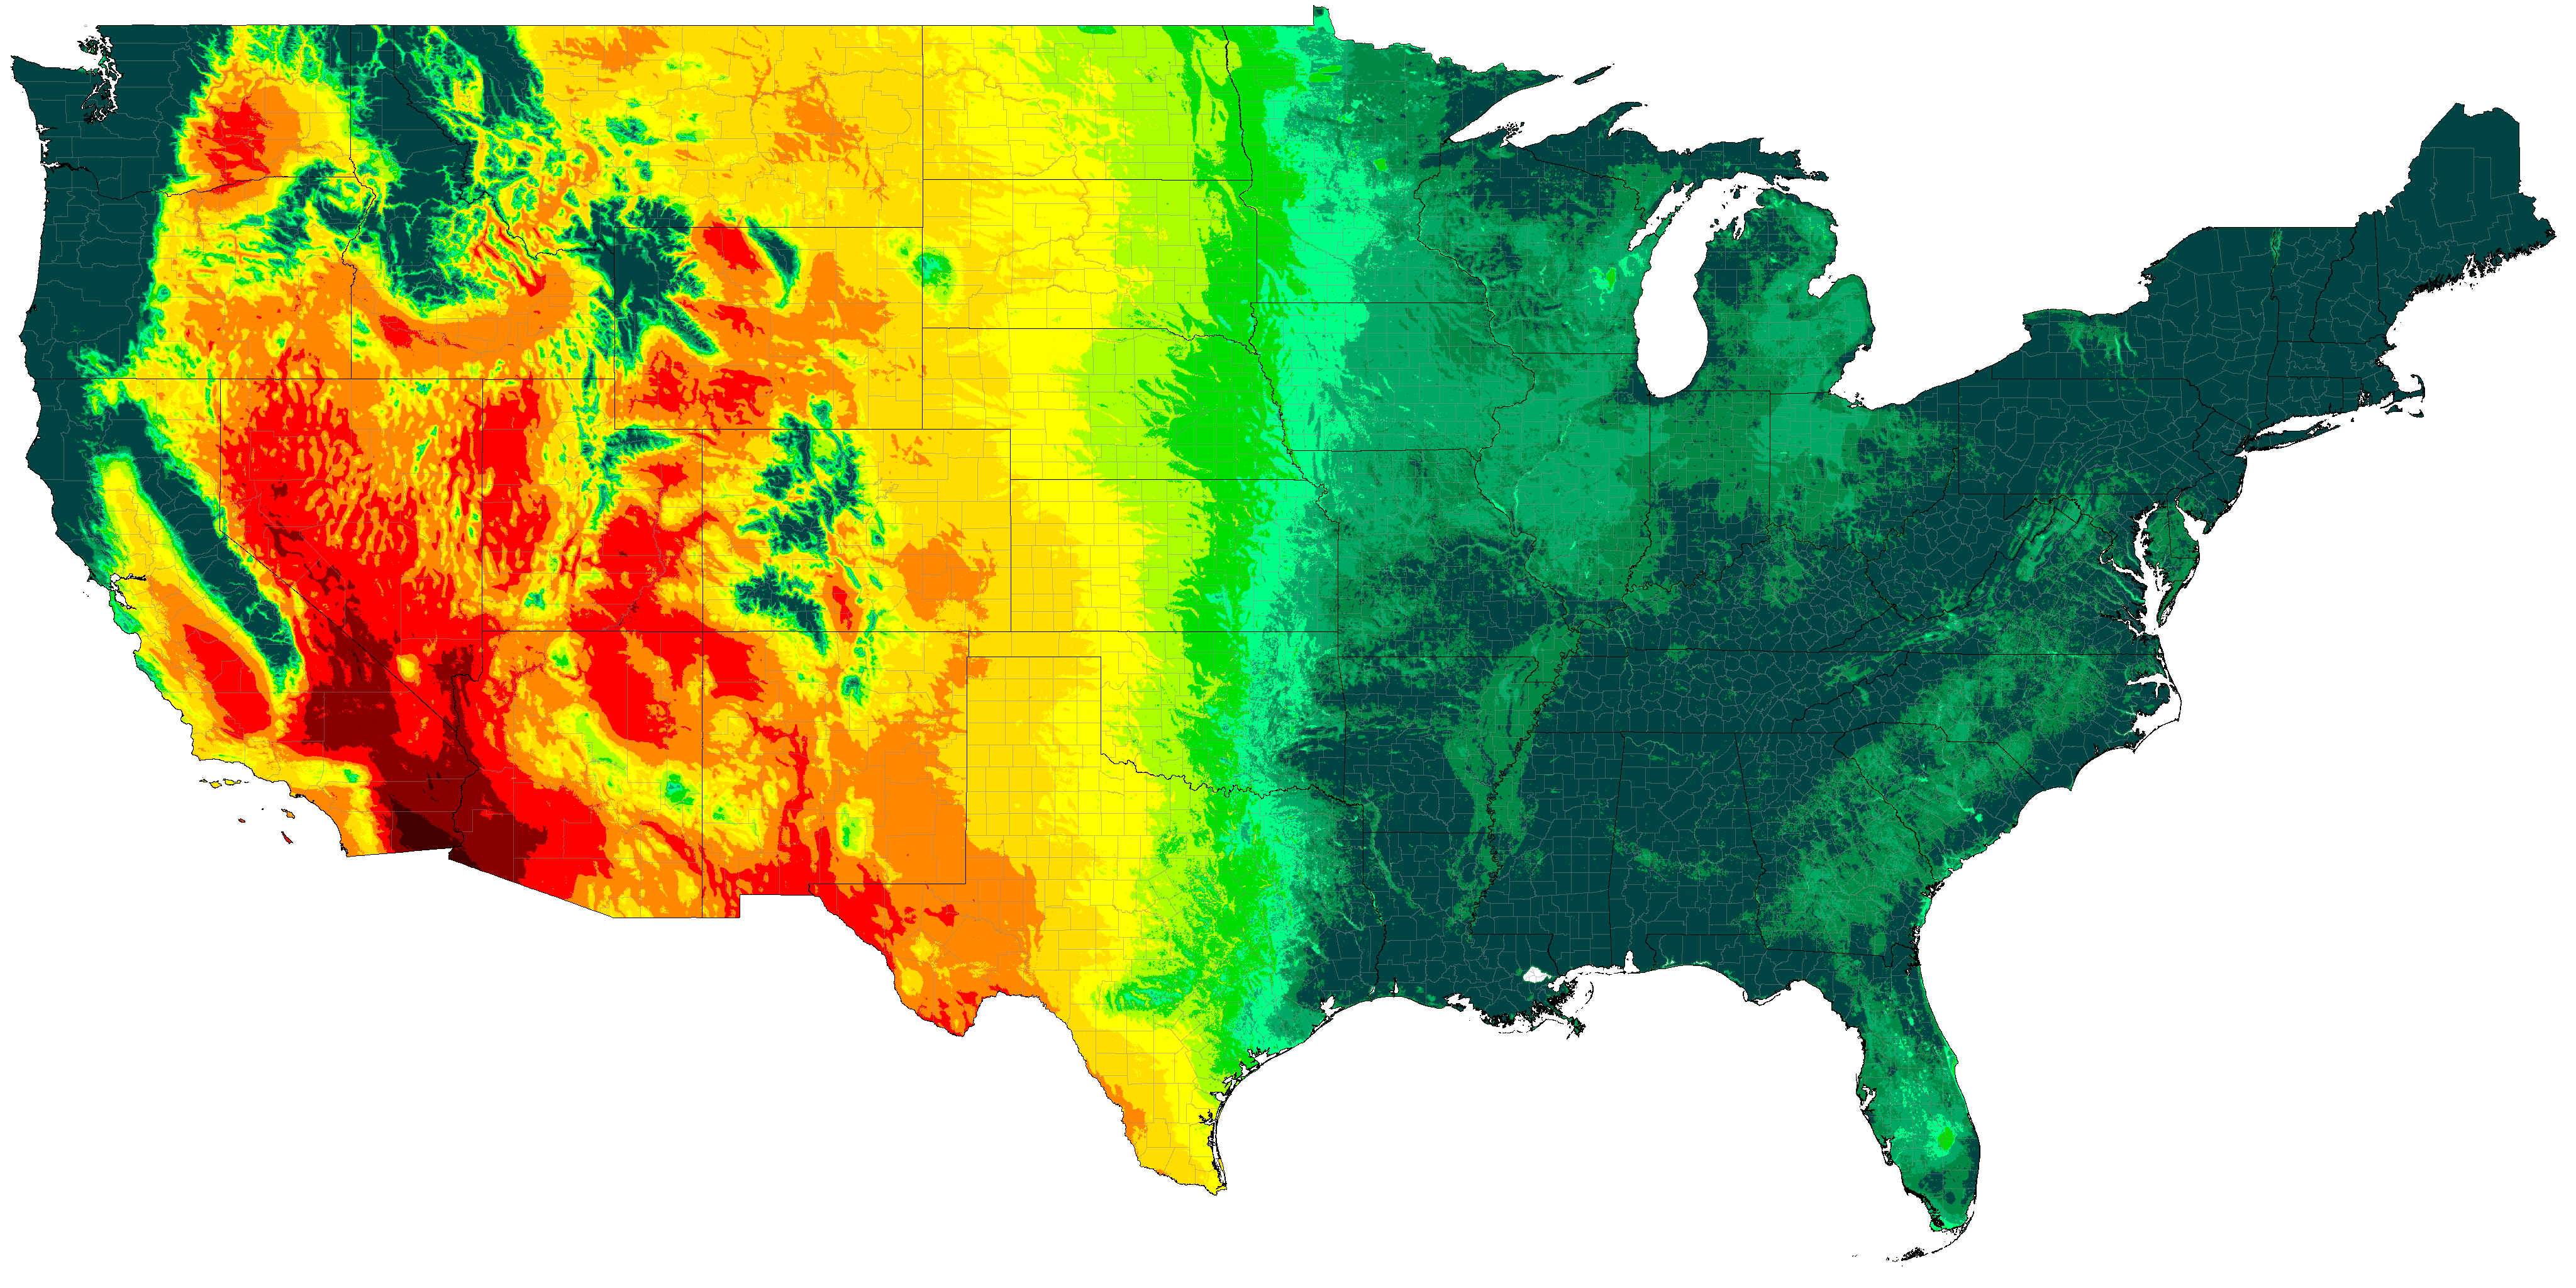
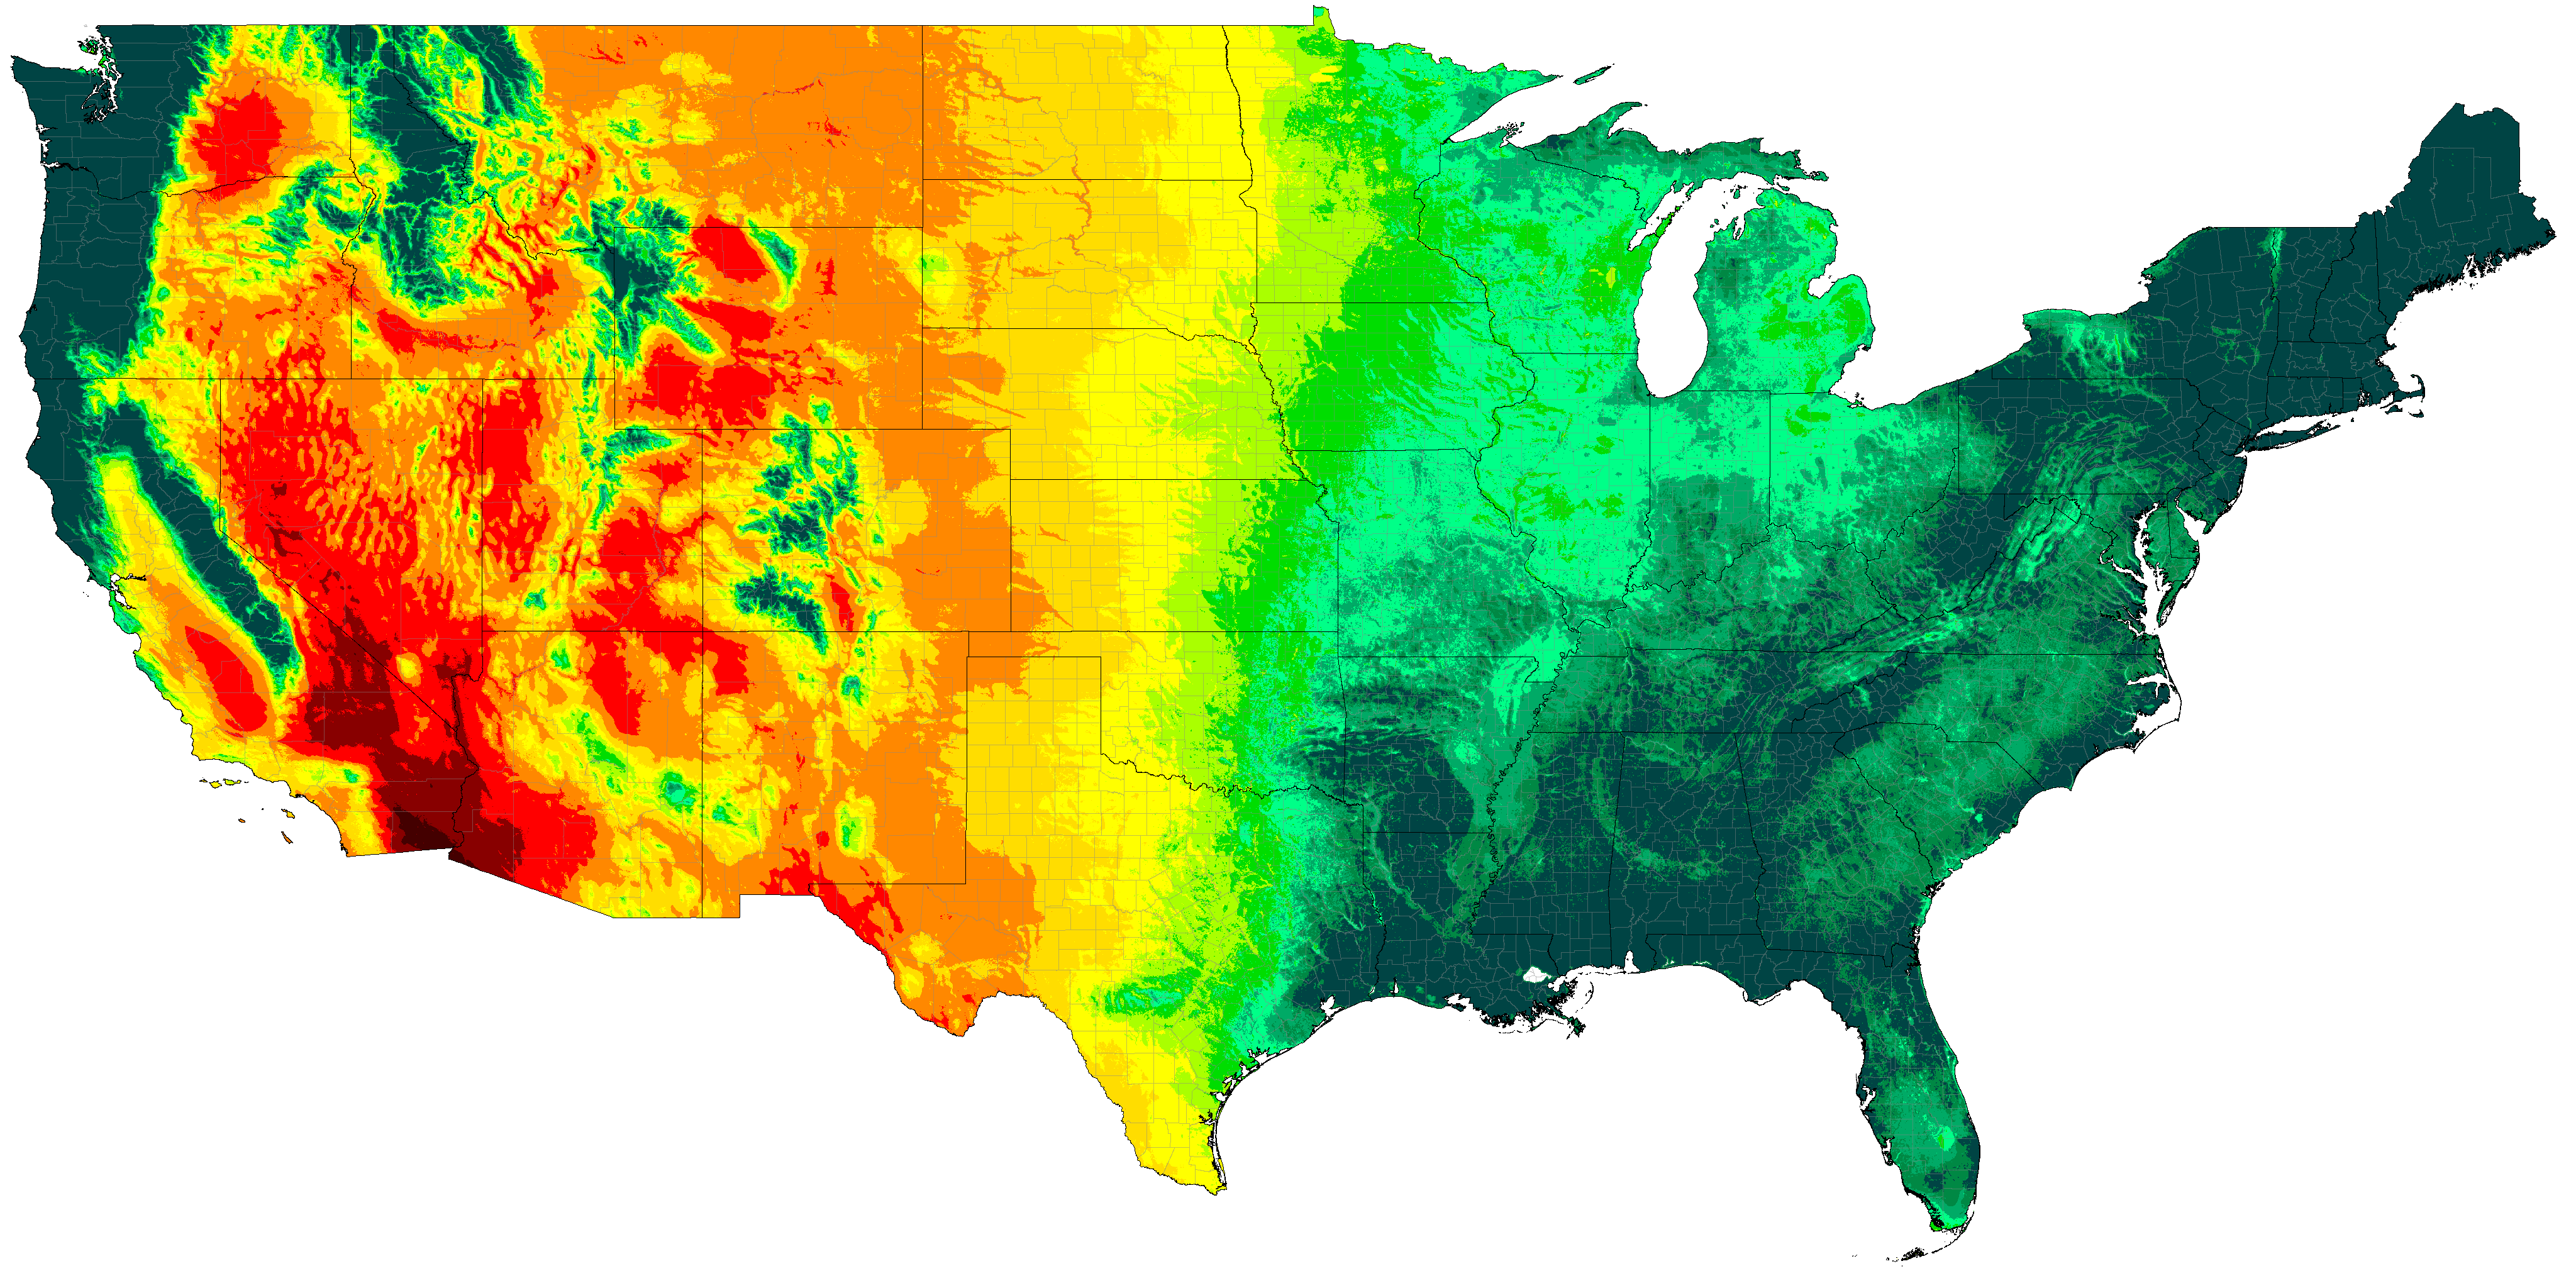
Contiguous United States distribution of aridity categories (projections are SSP5-8.5 high emissions normals)
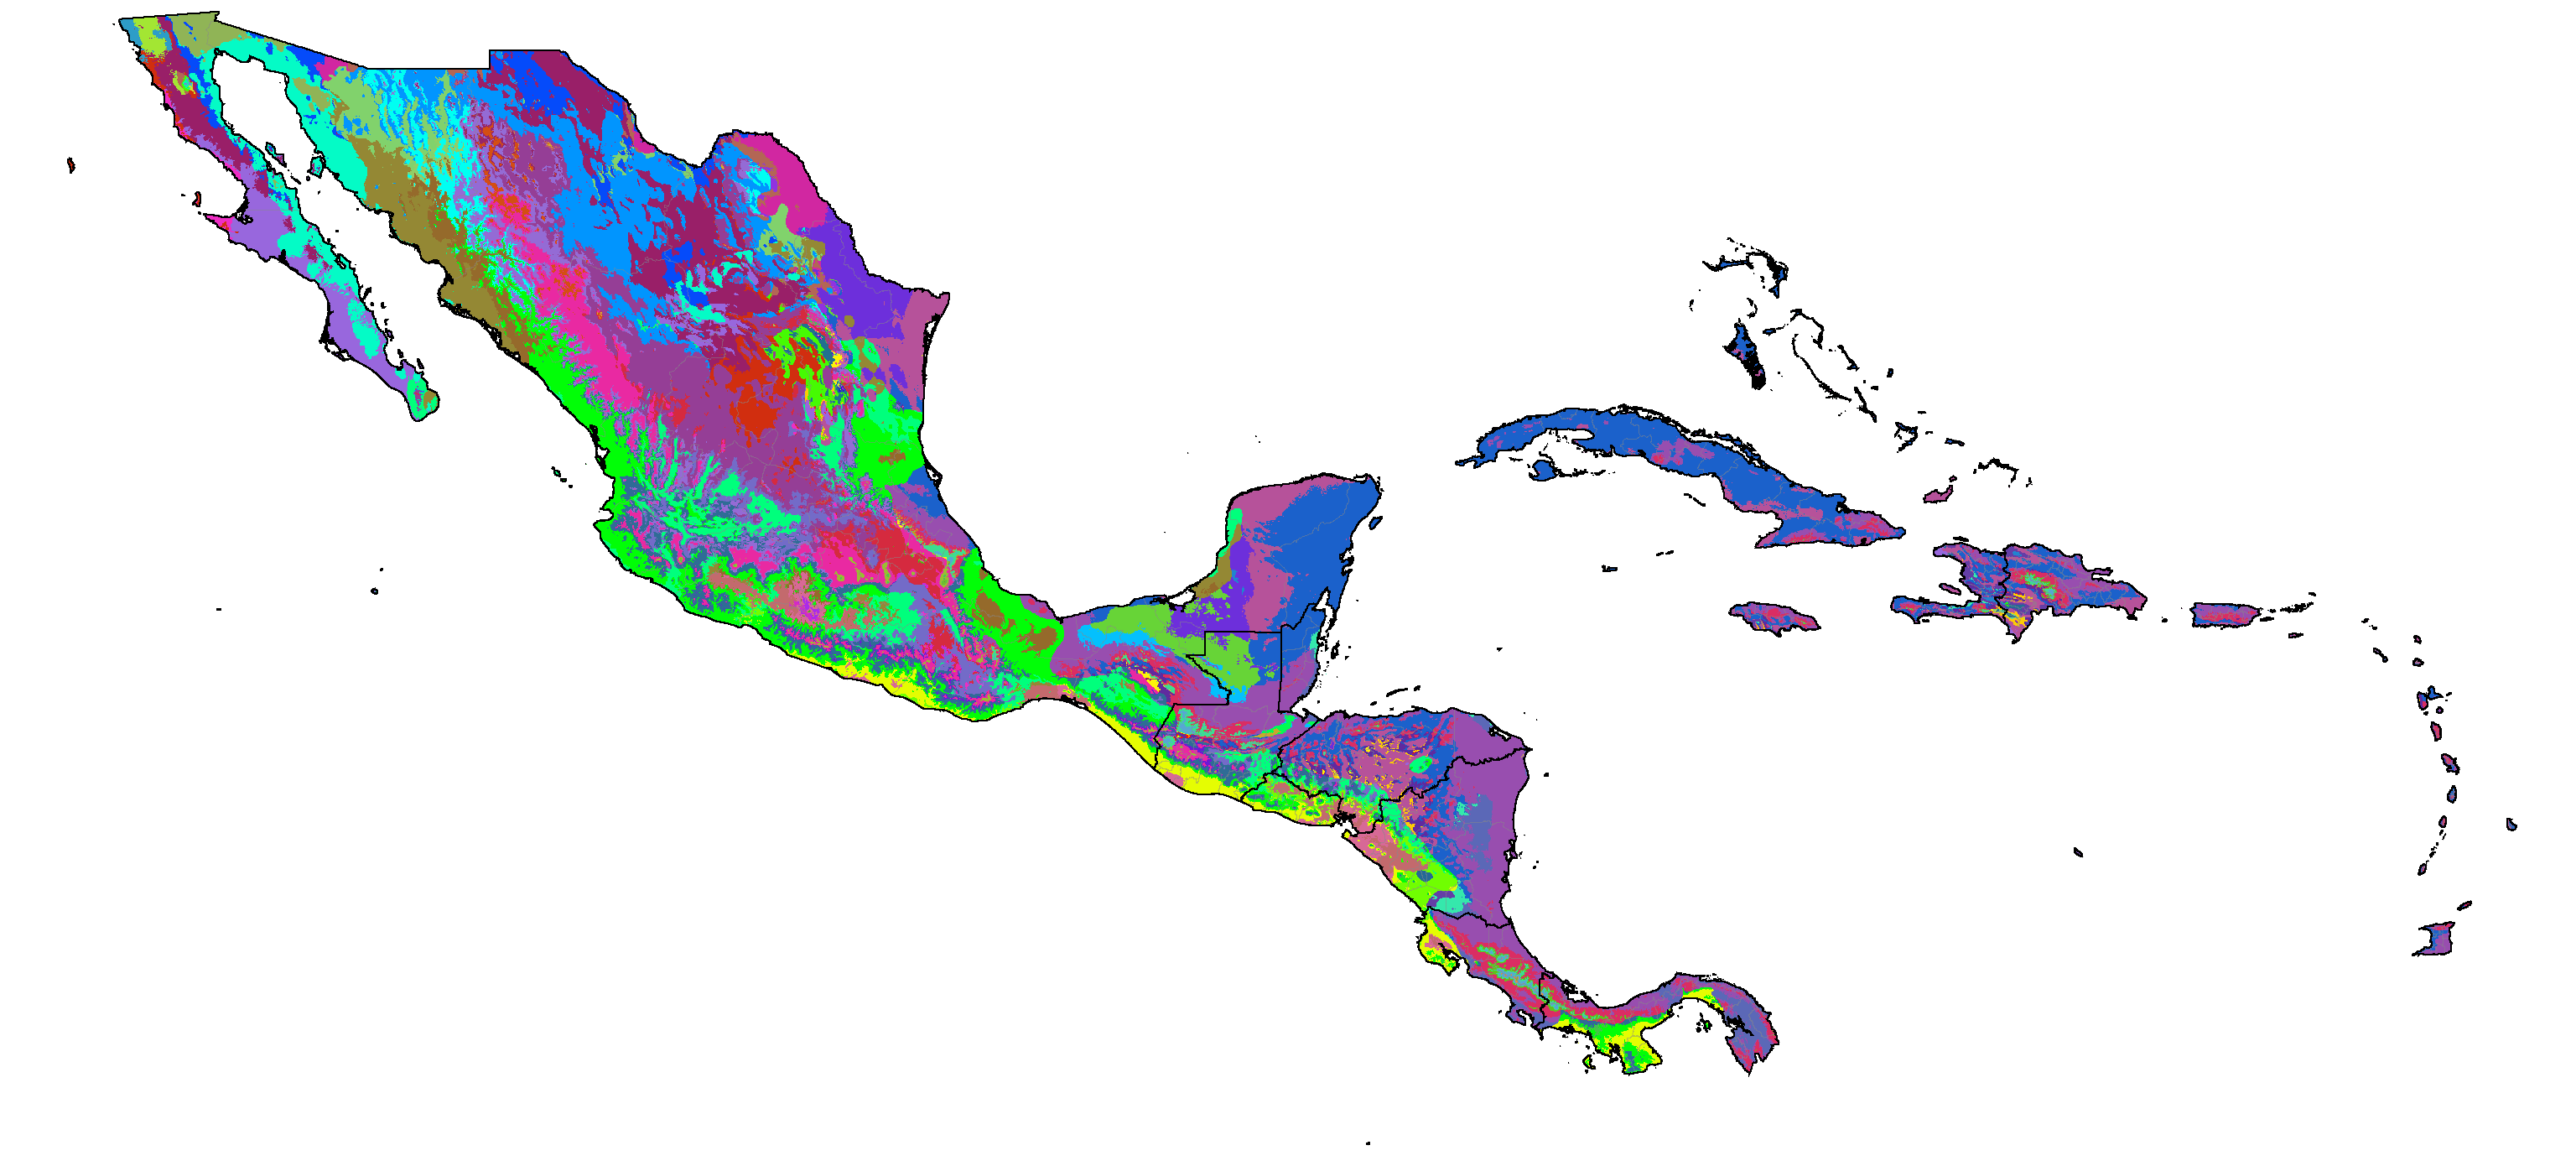
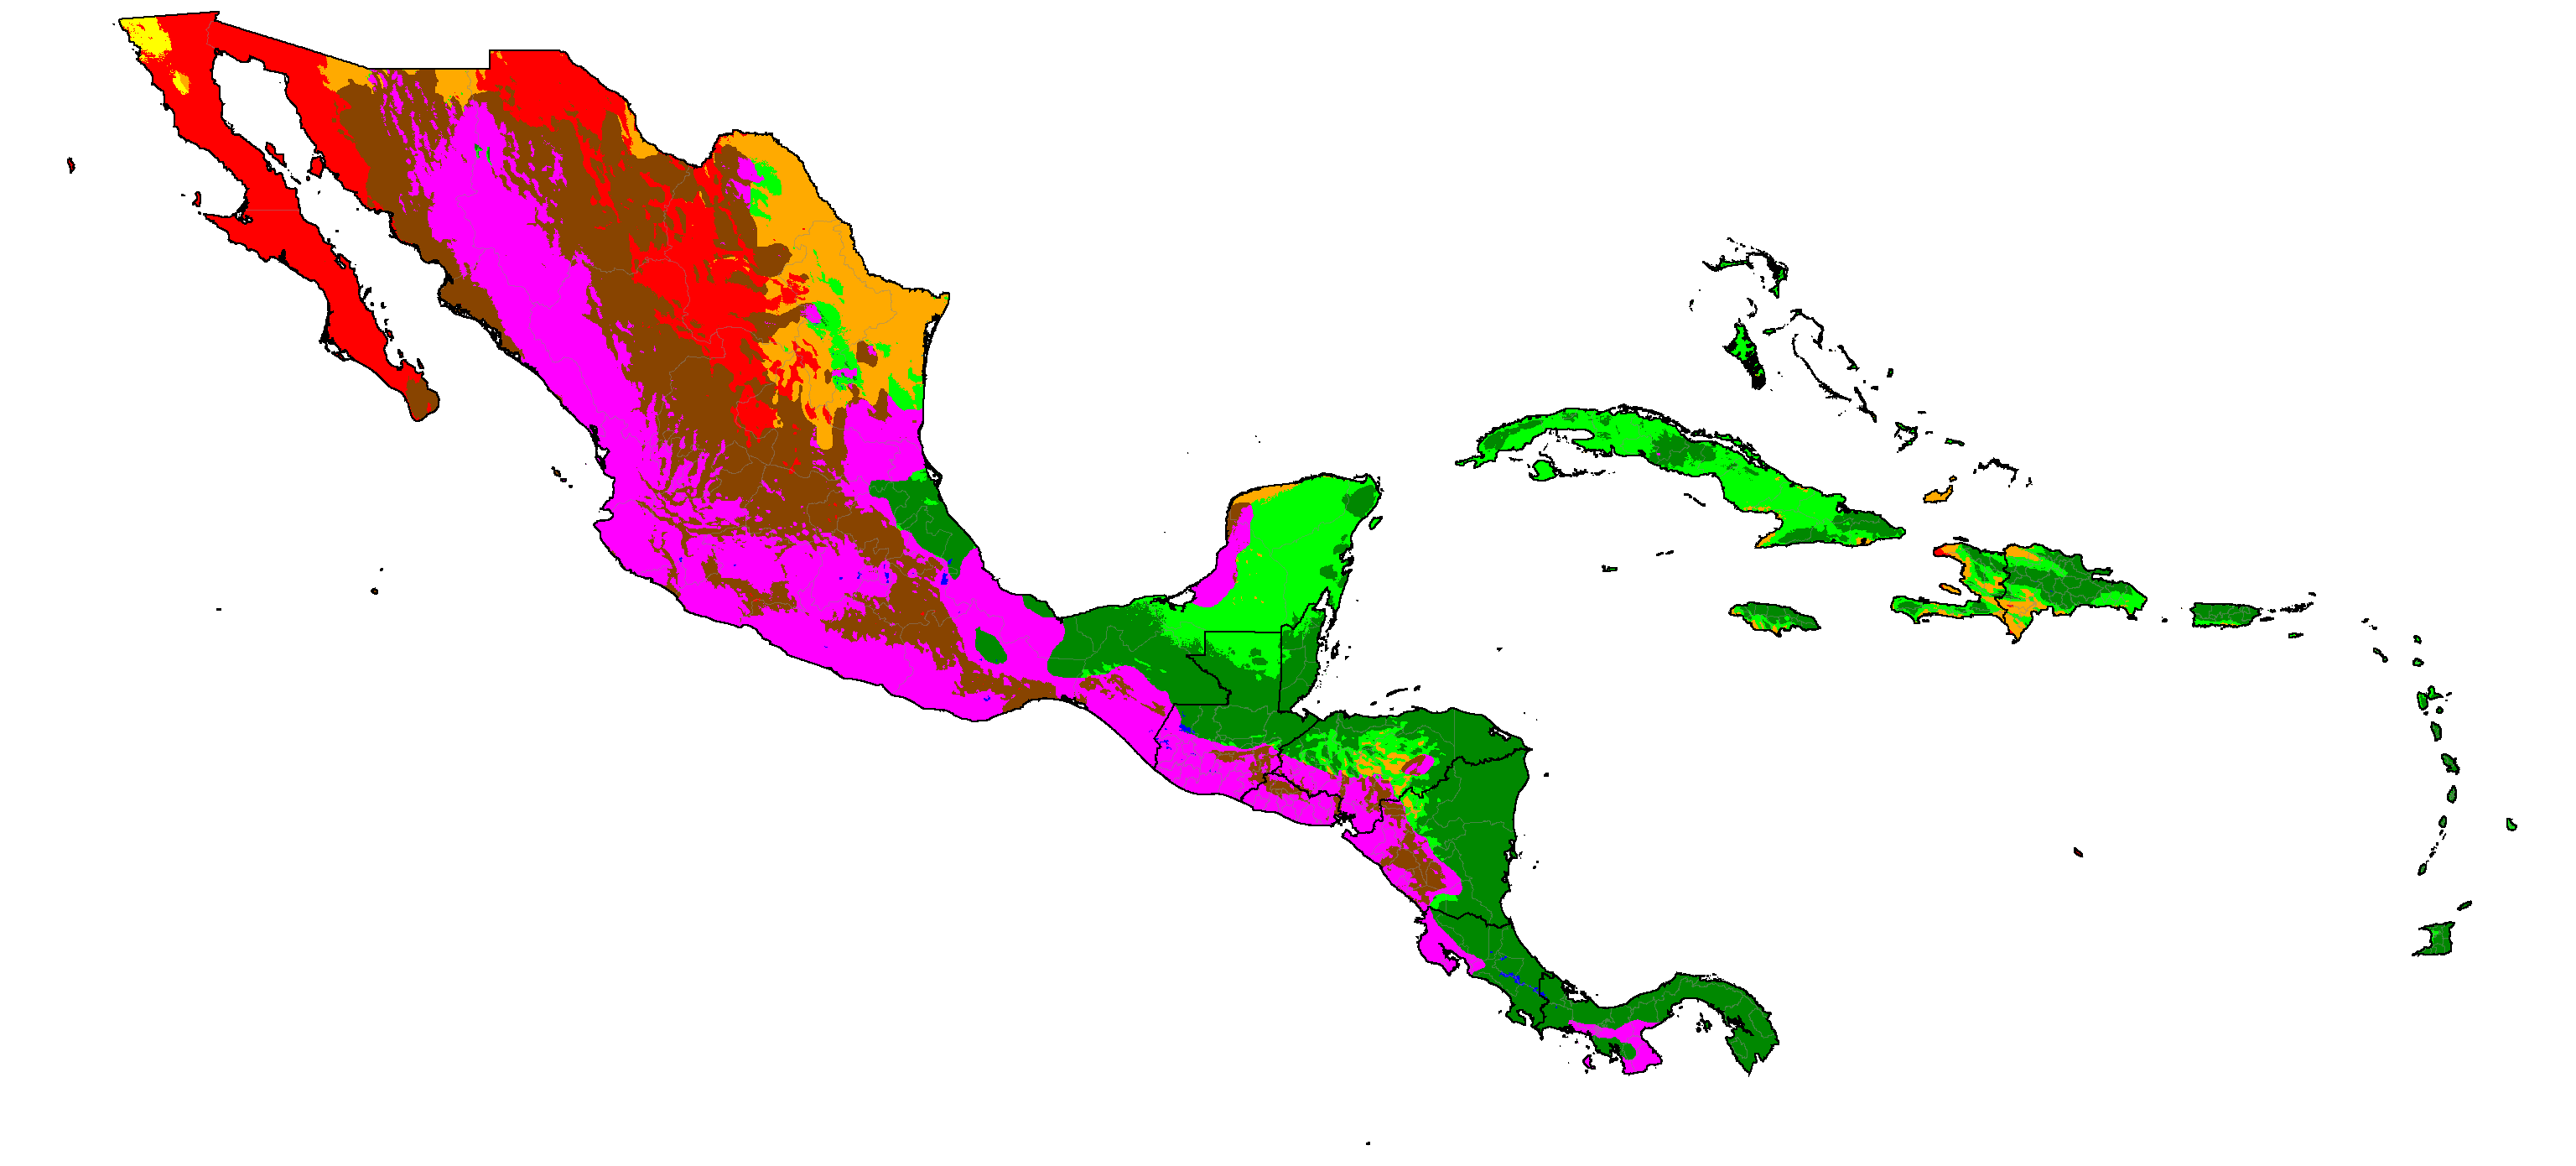
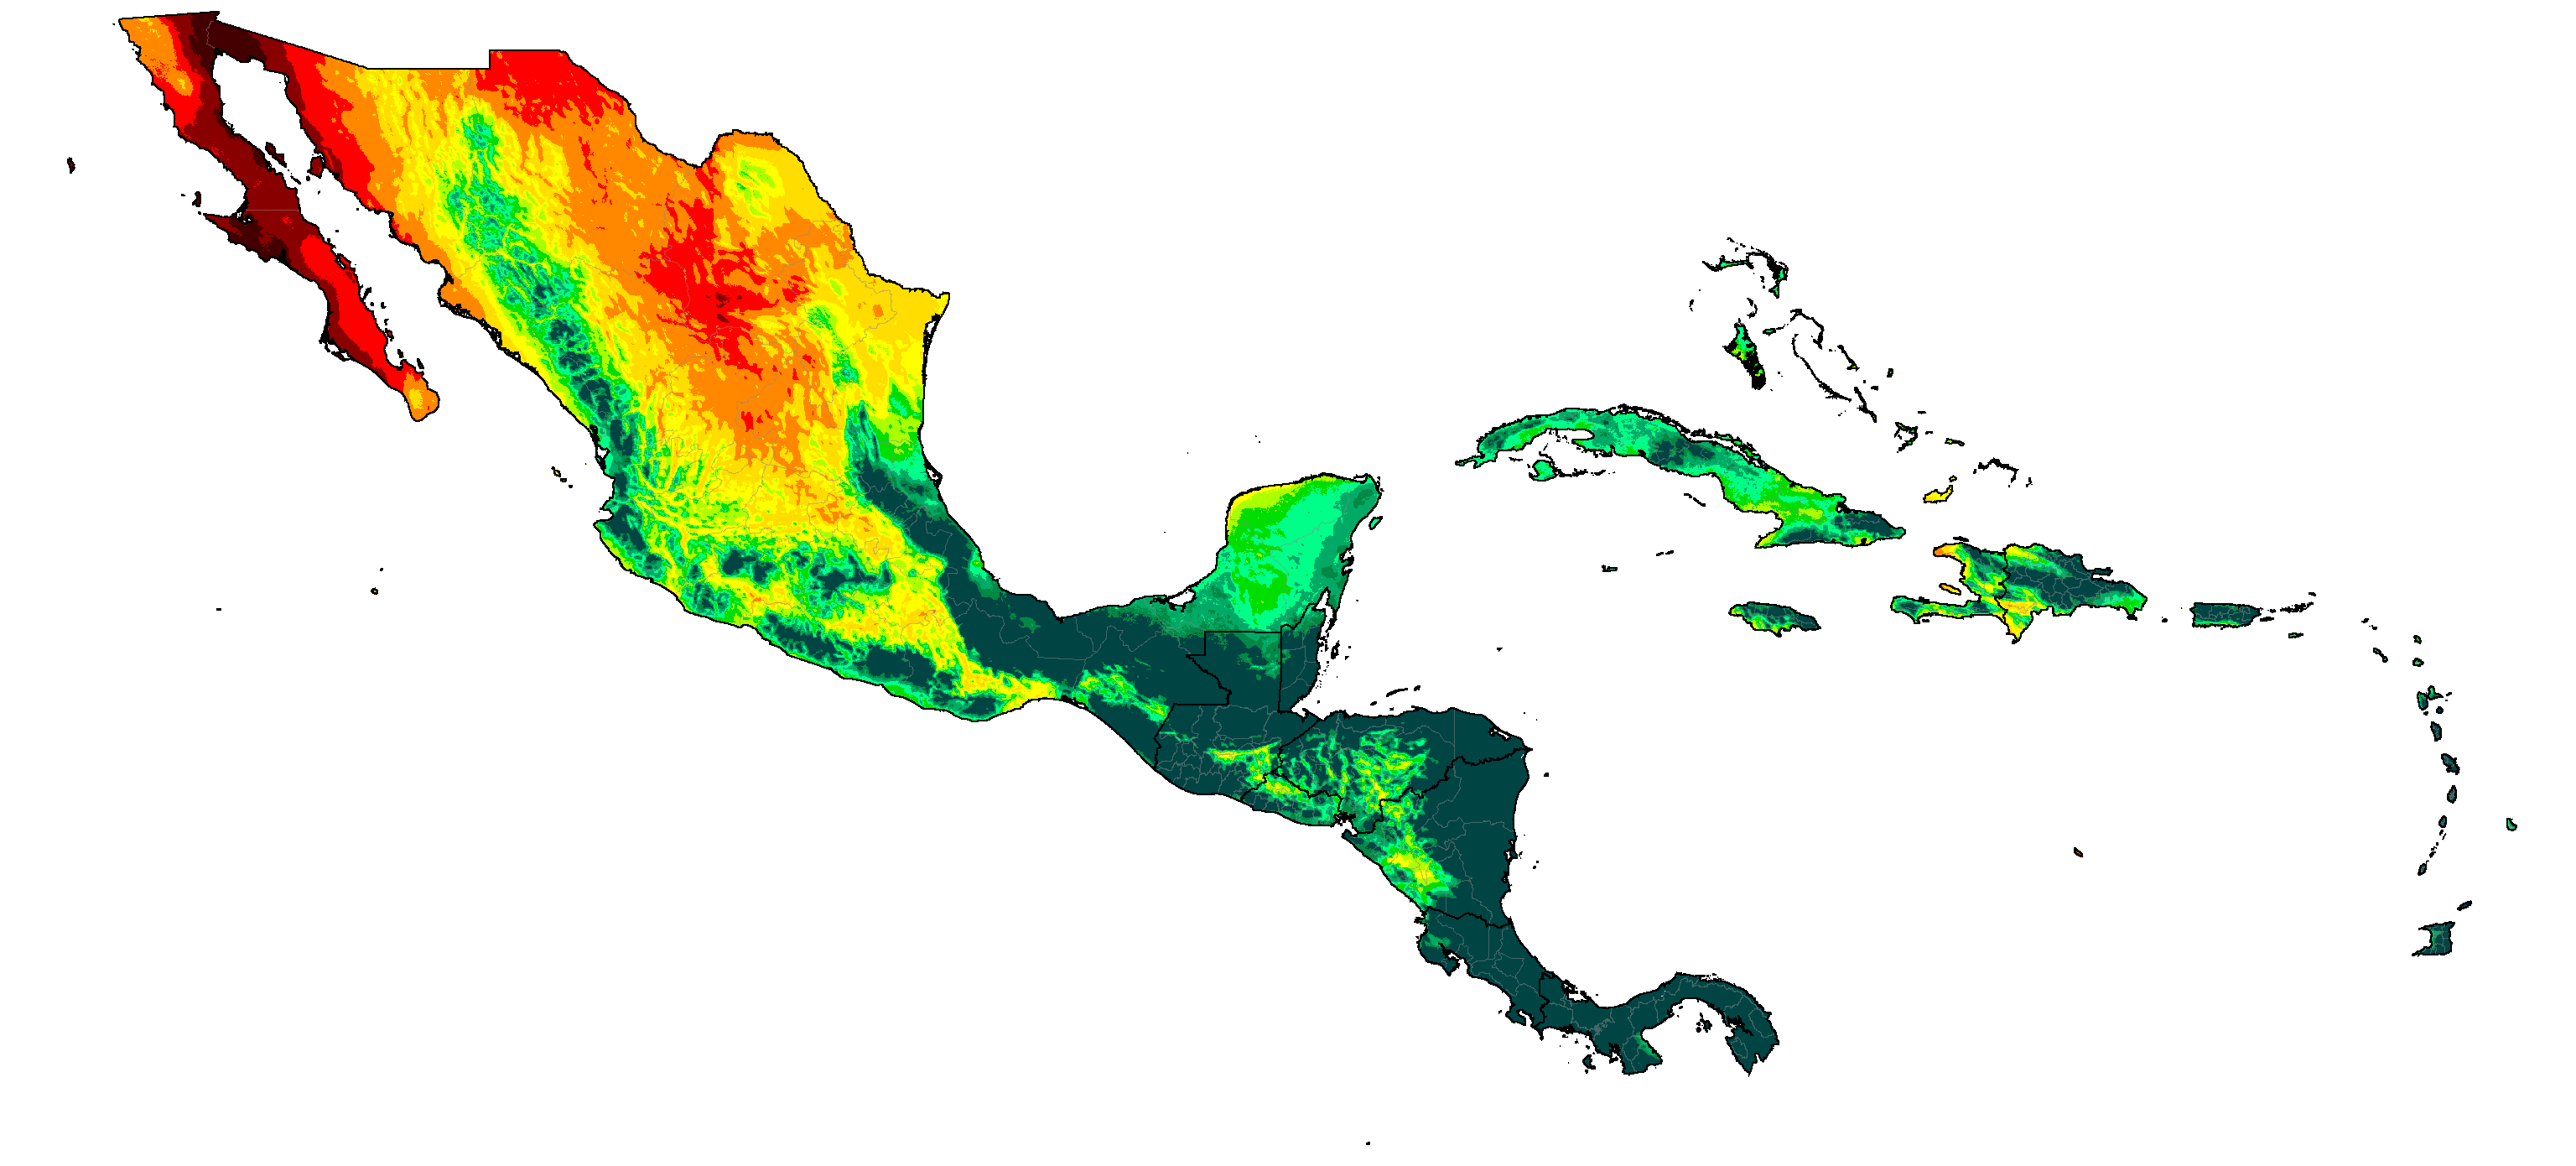
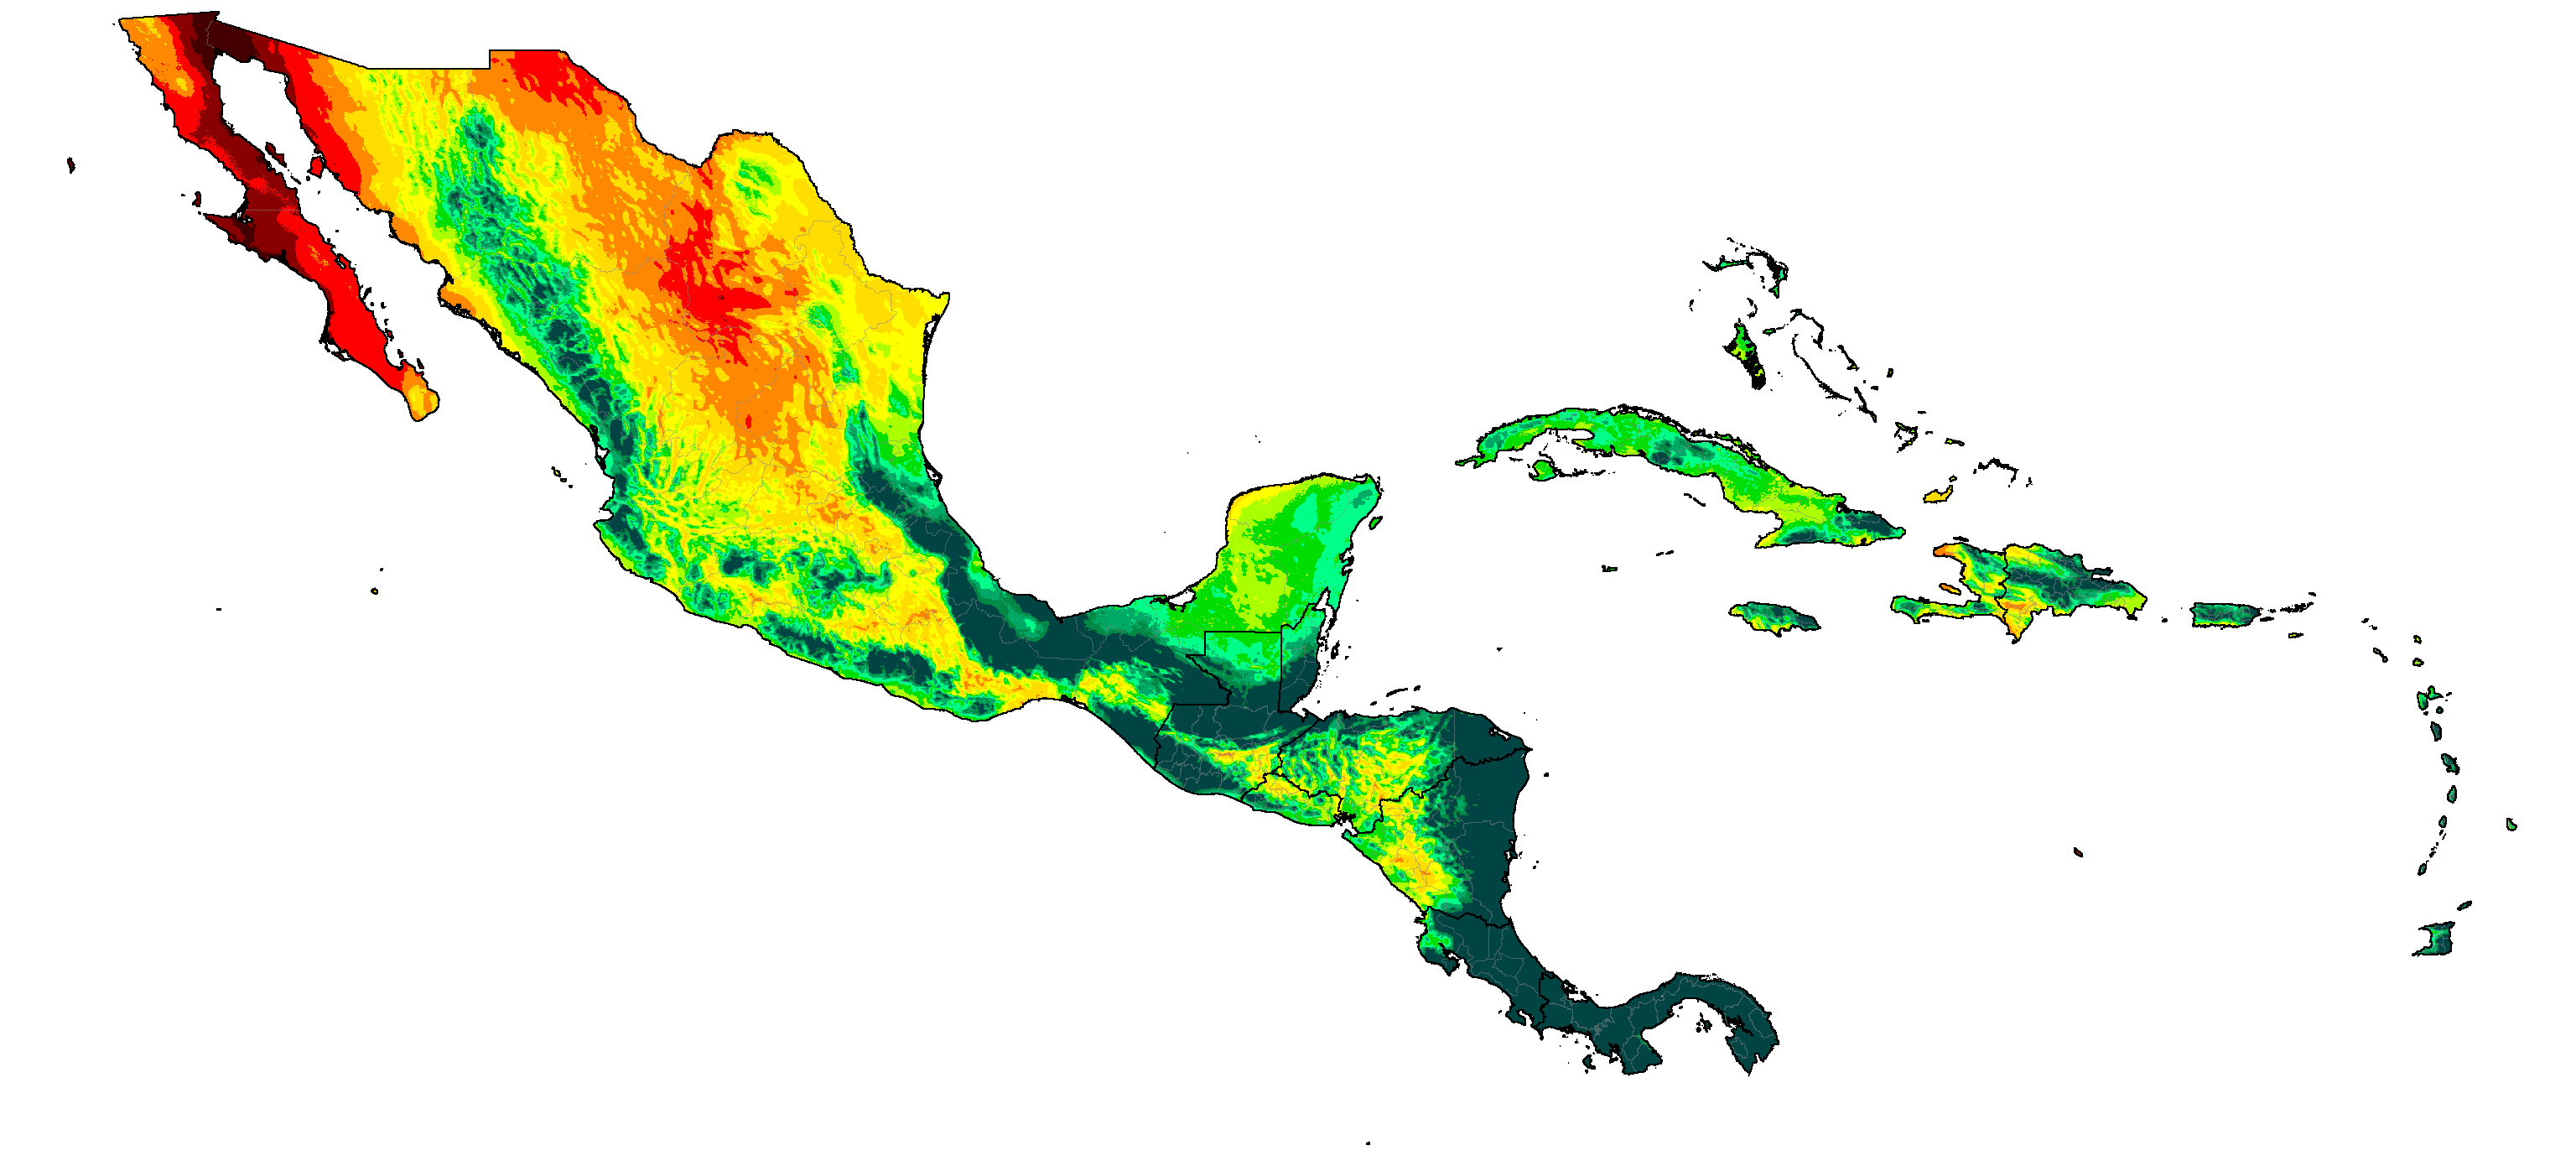
Mexico, Central America & the Carribean distribution of aridity categories (projections are SSP5-8.5 high emissions normals)
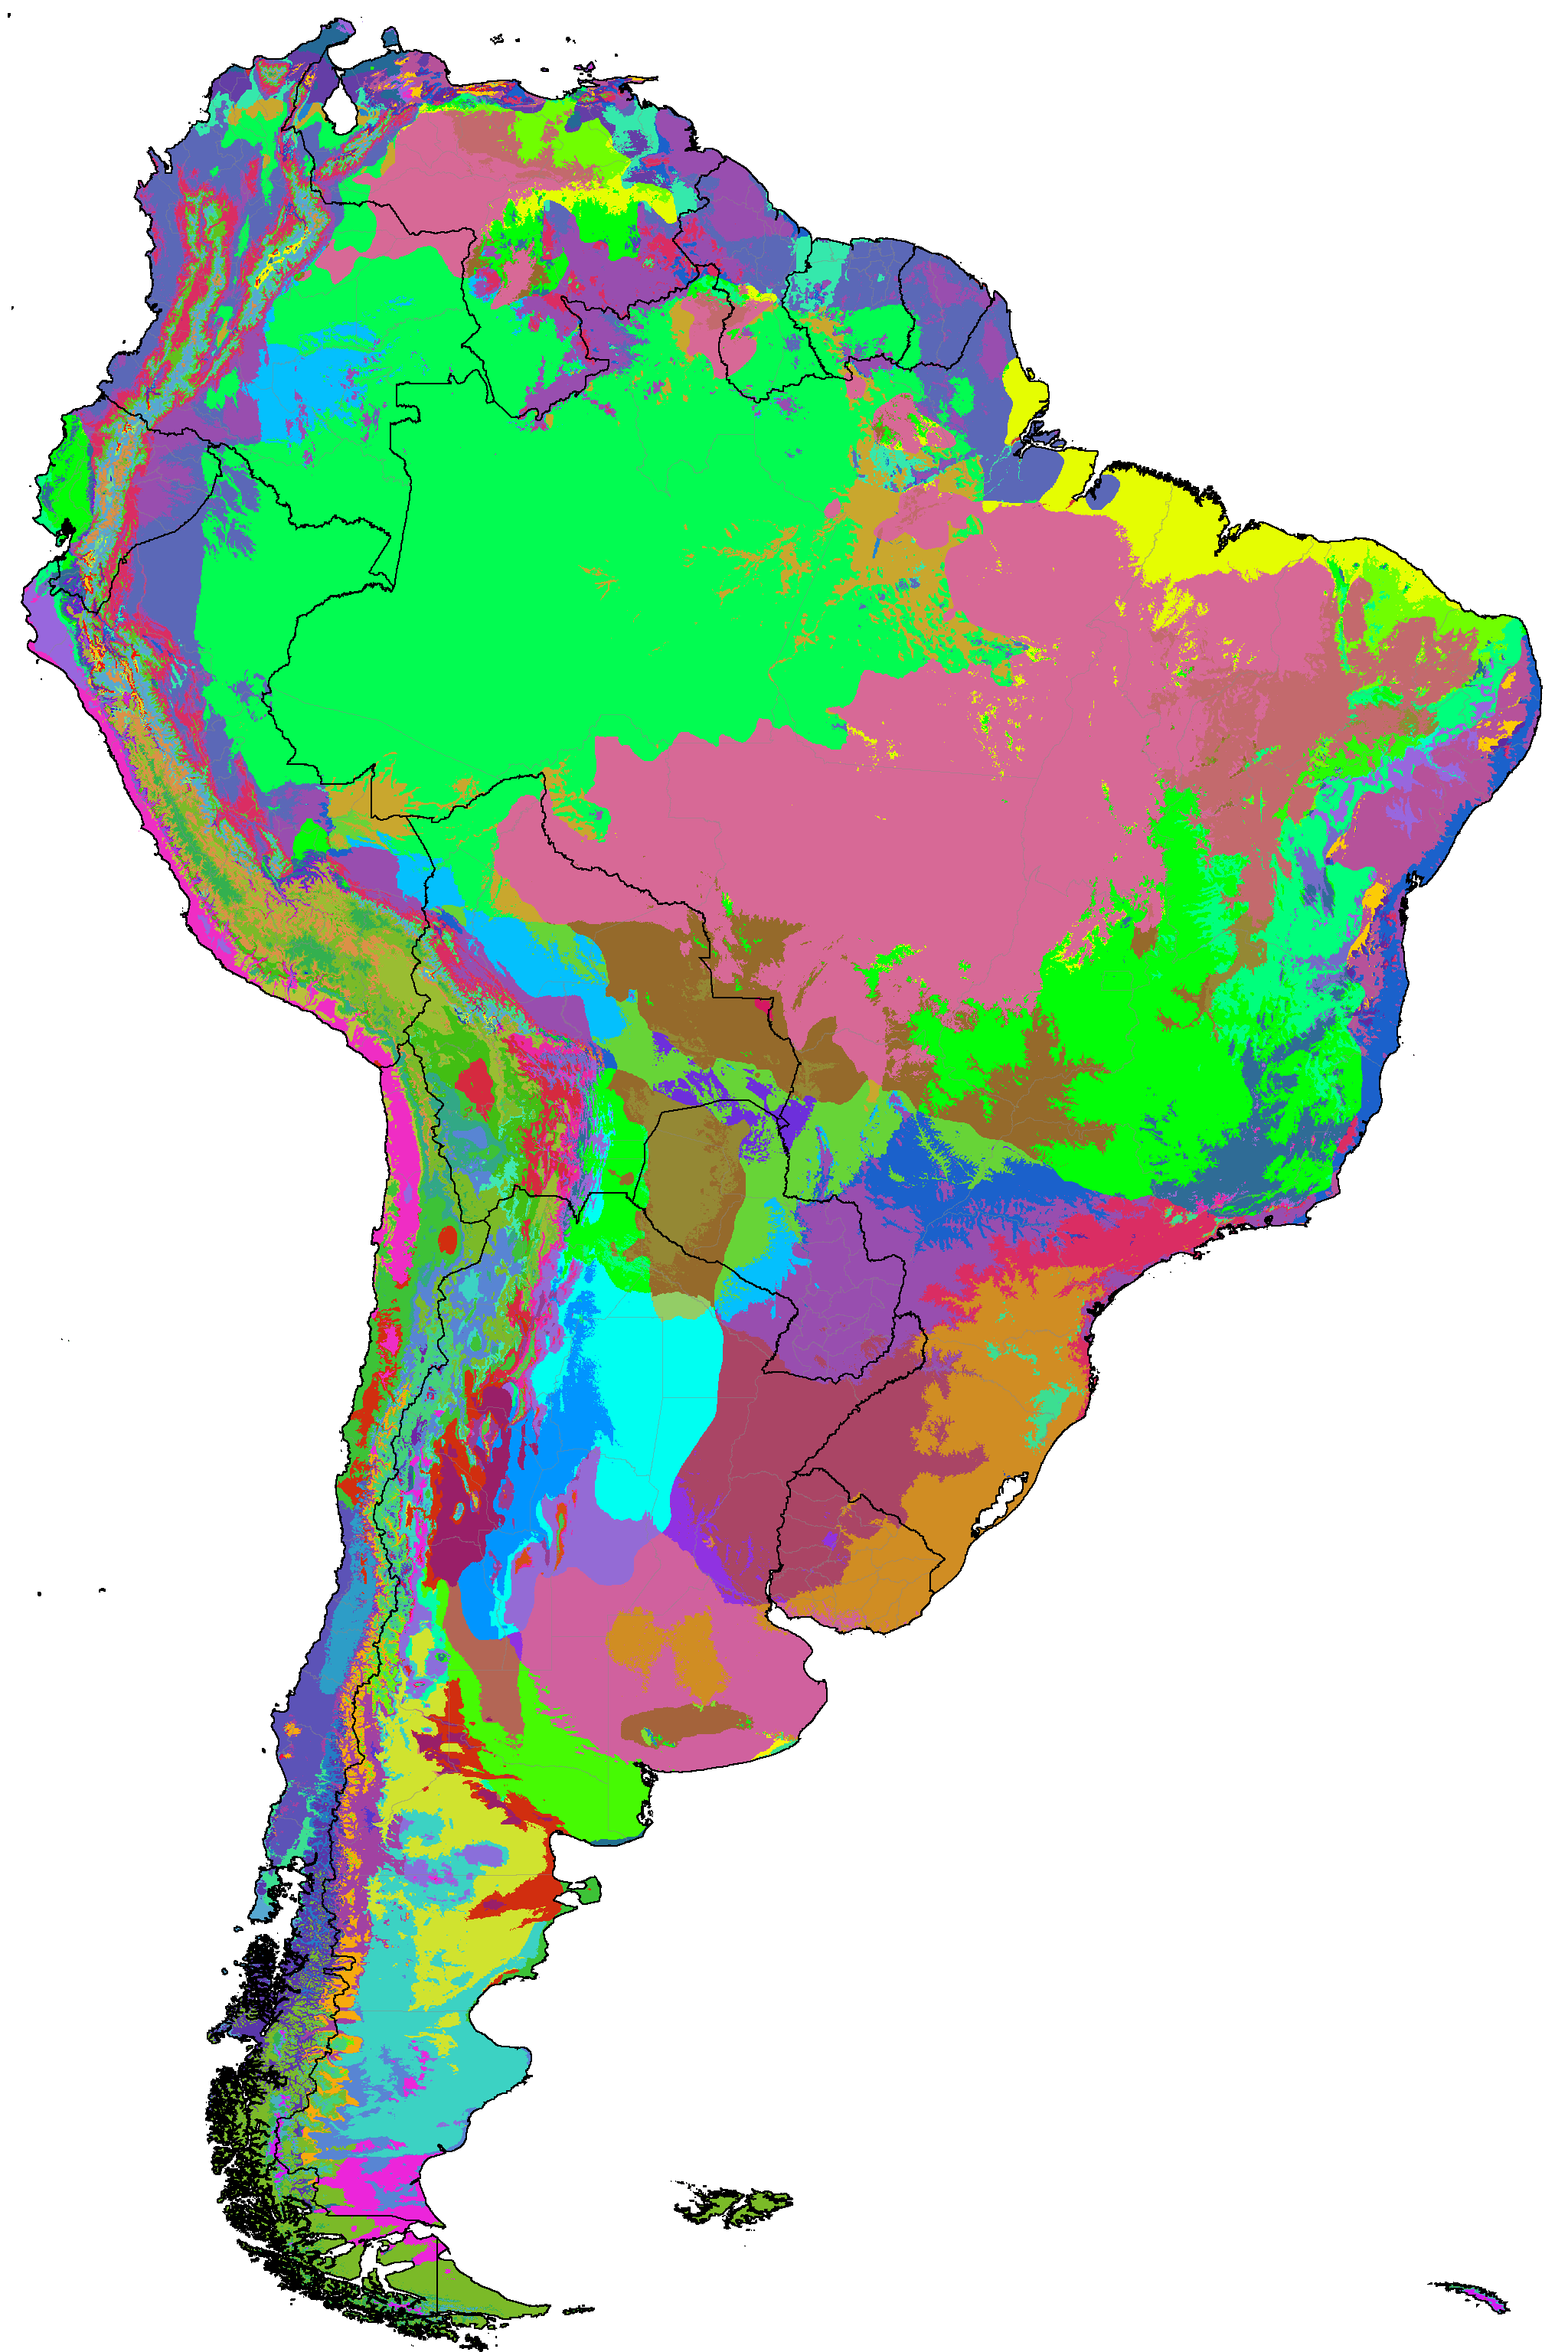
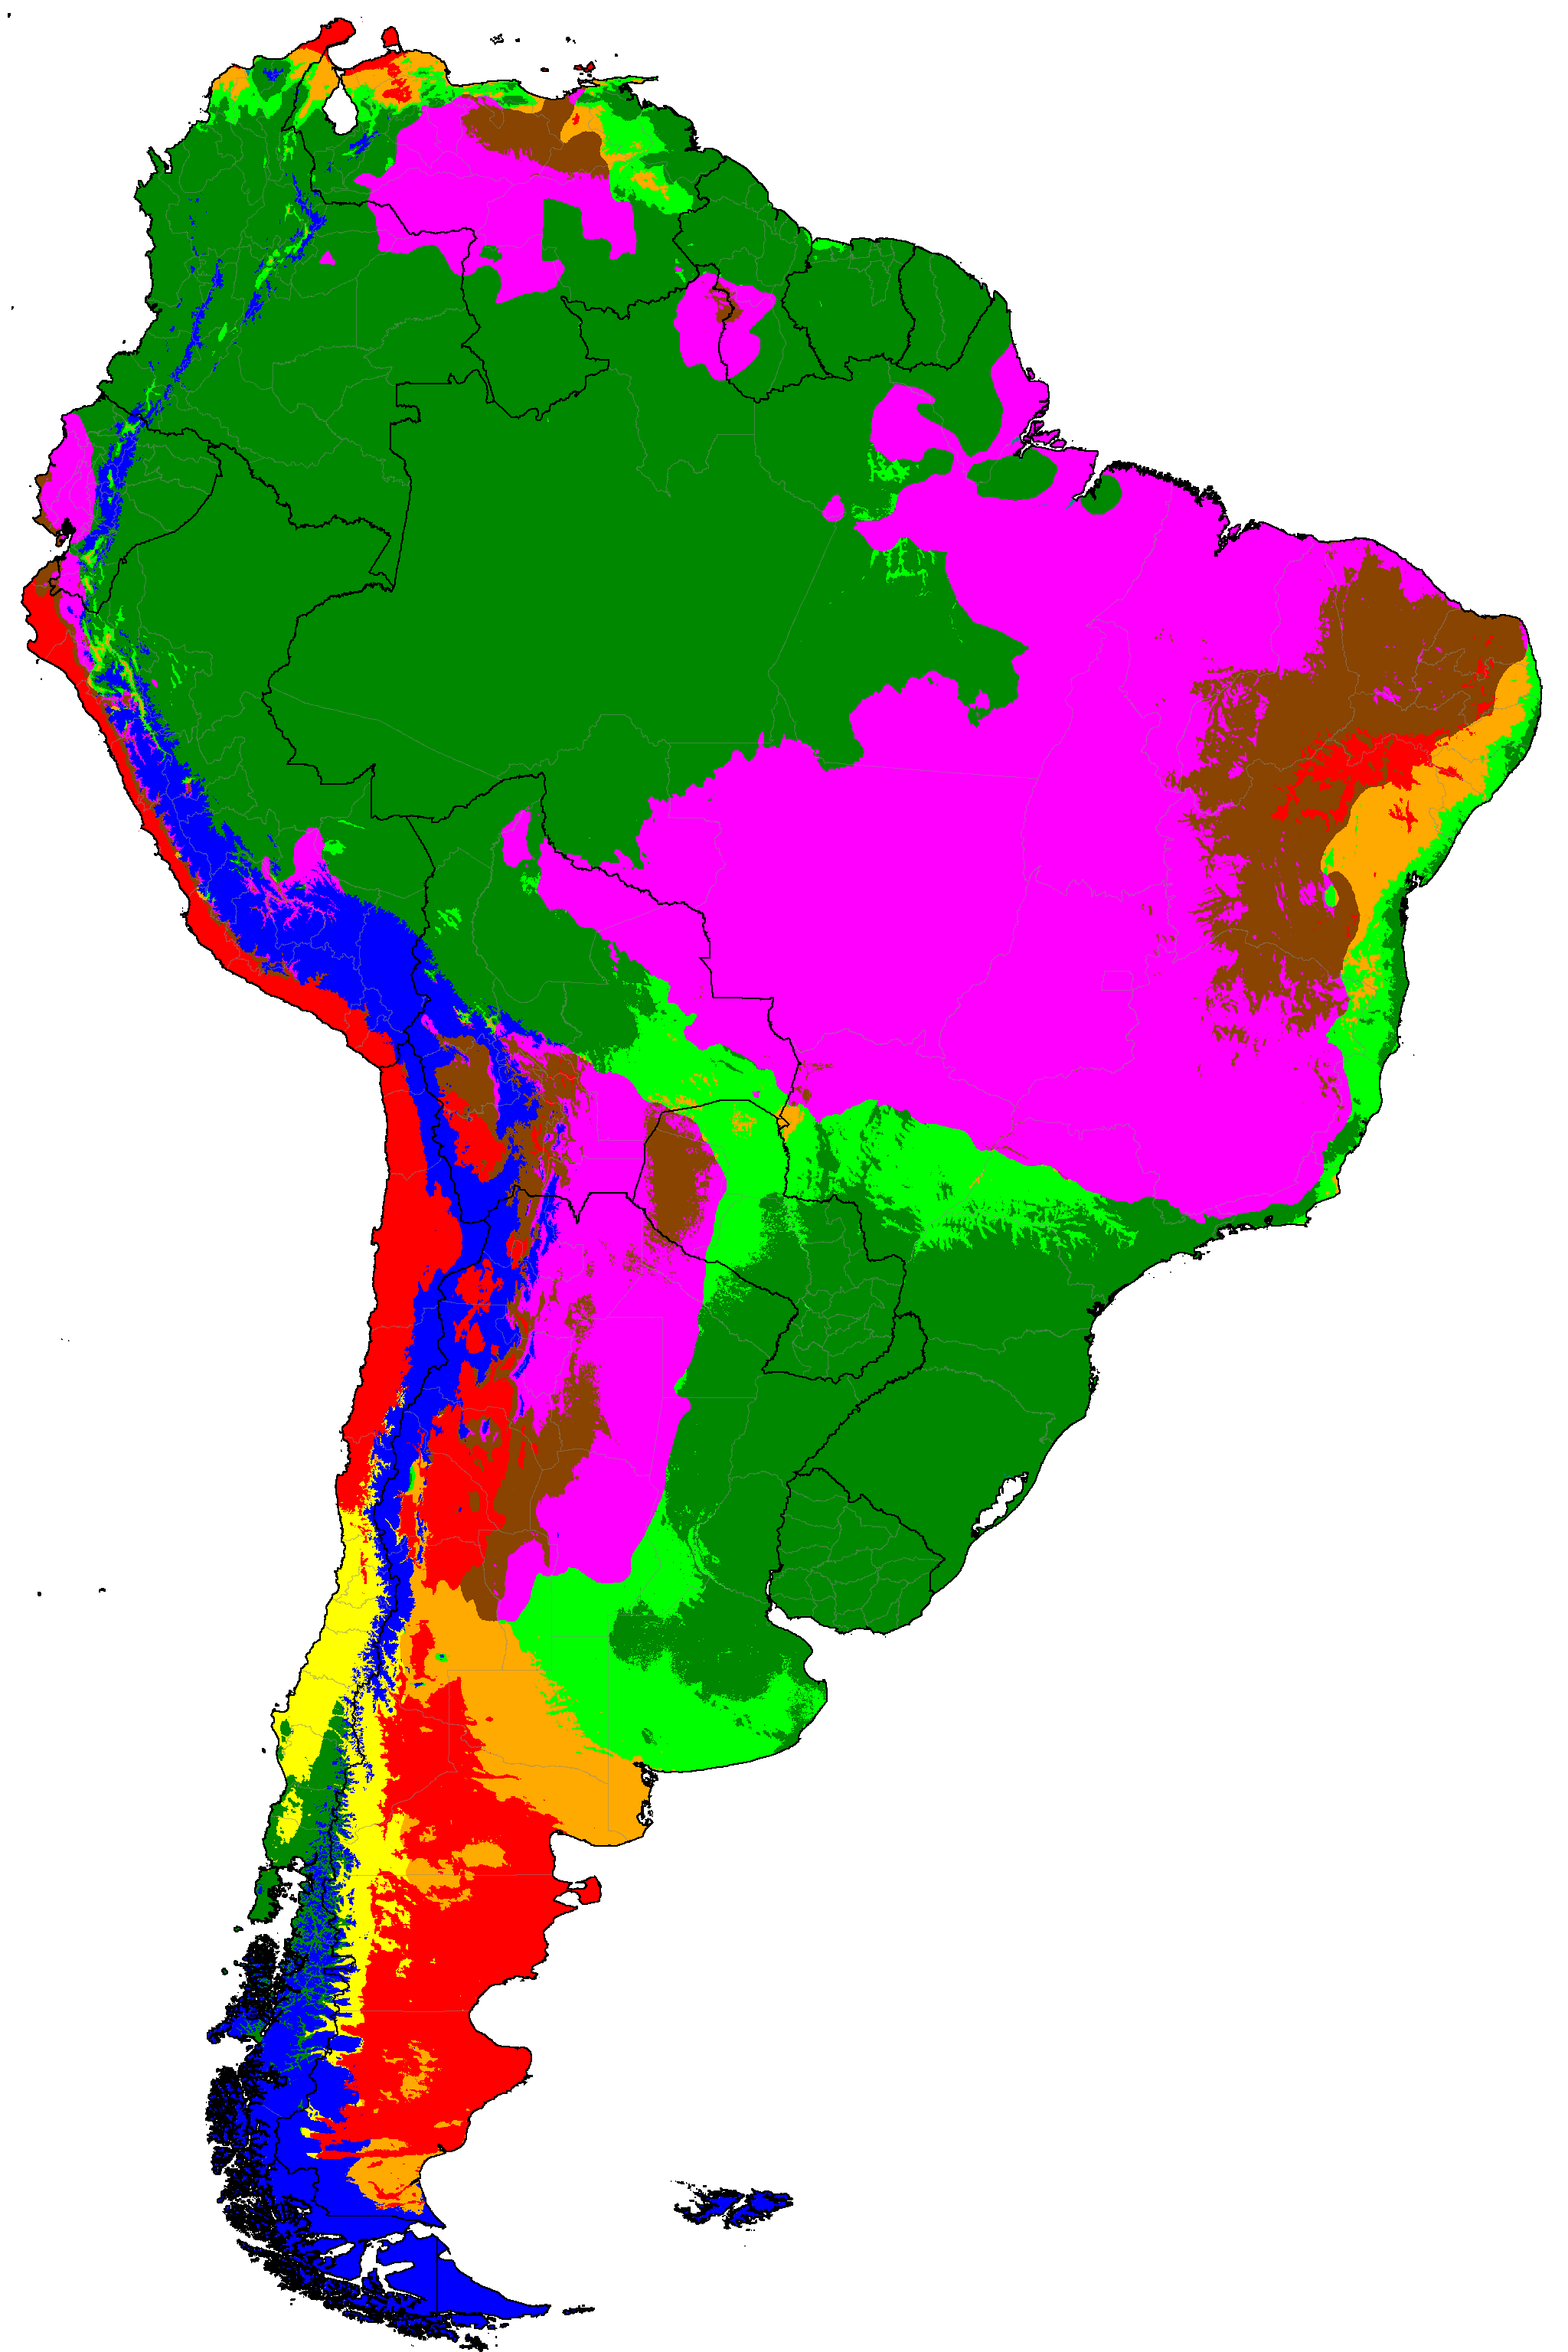
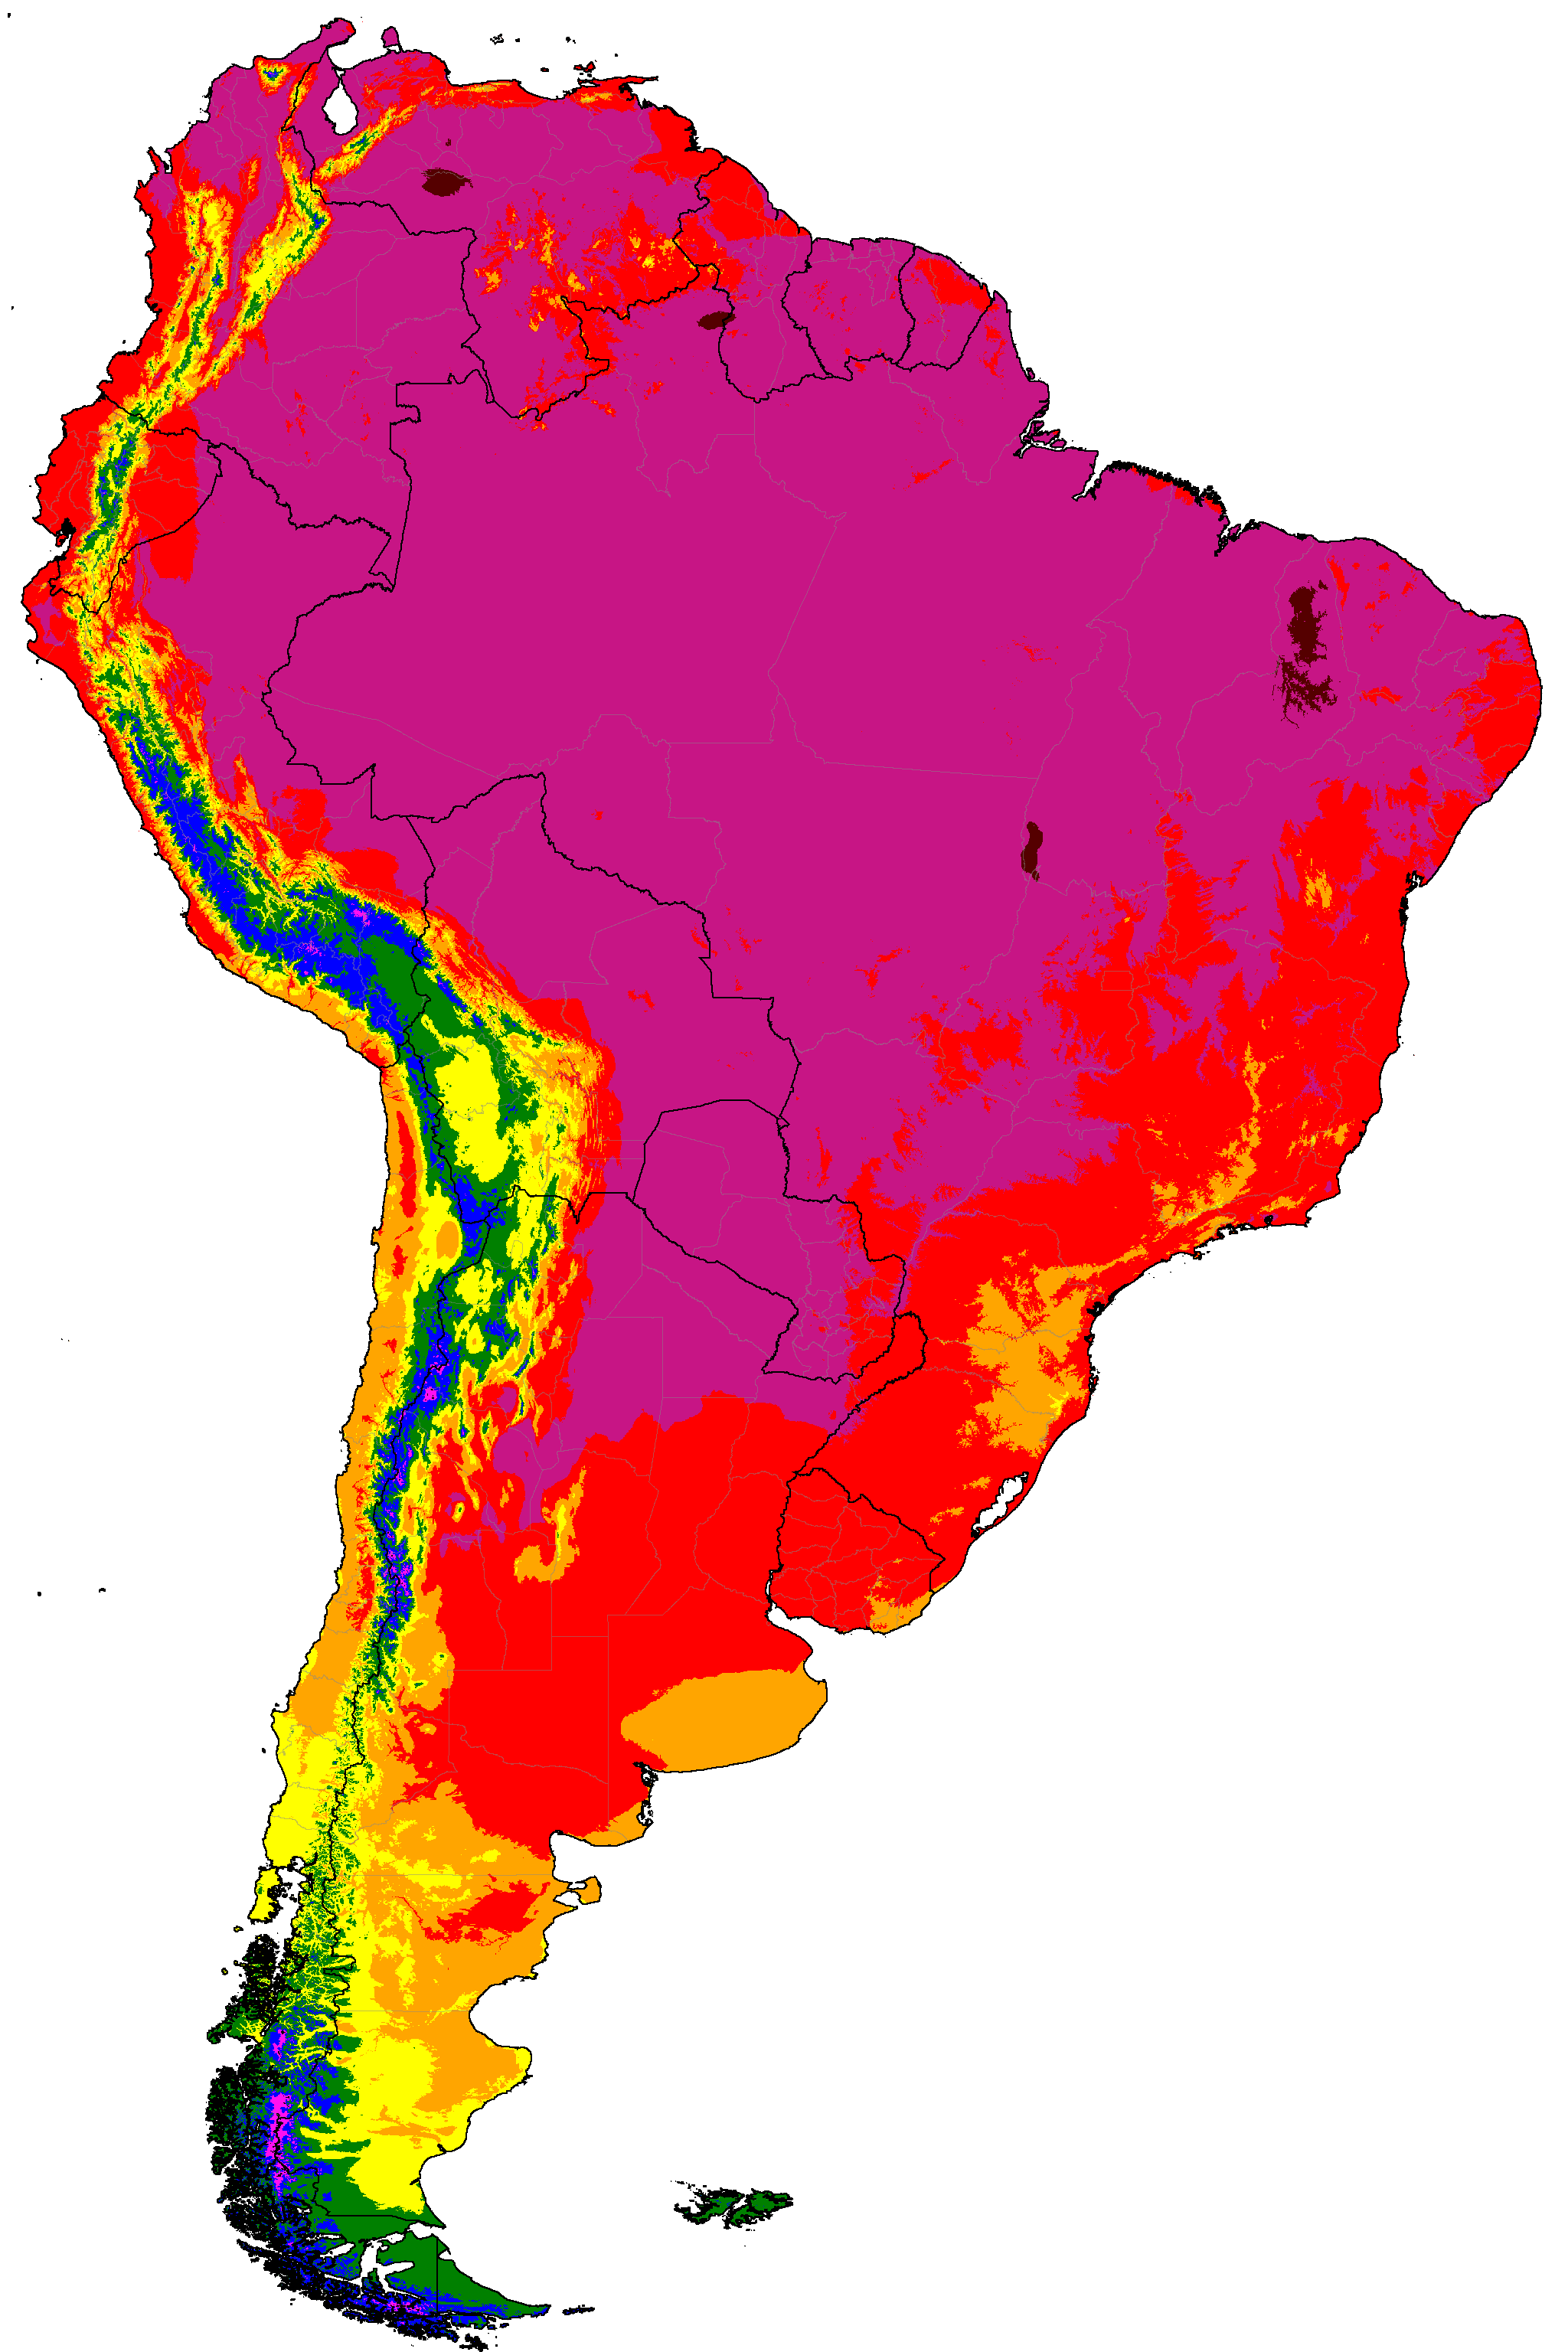
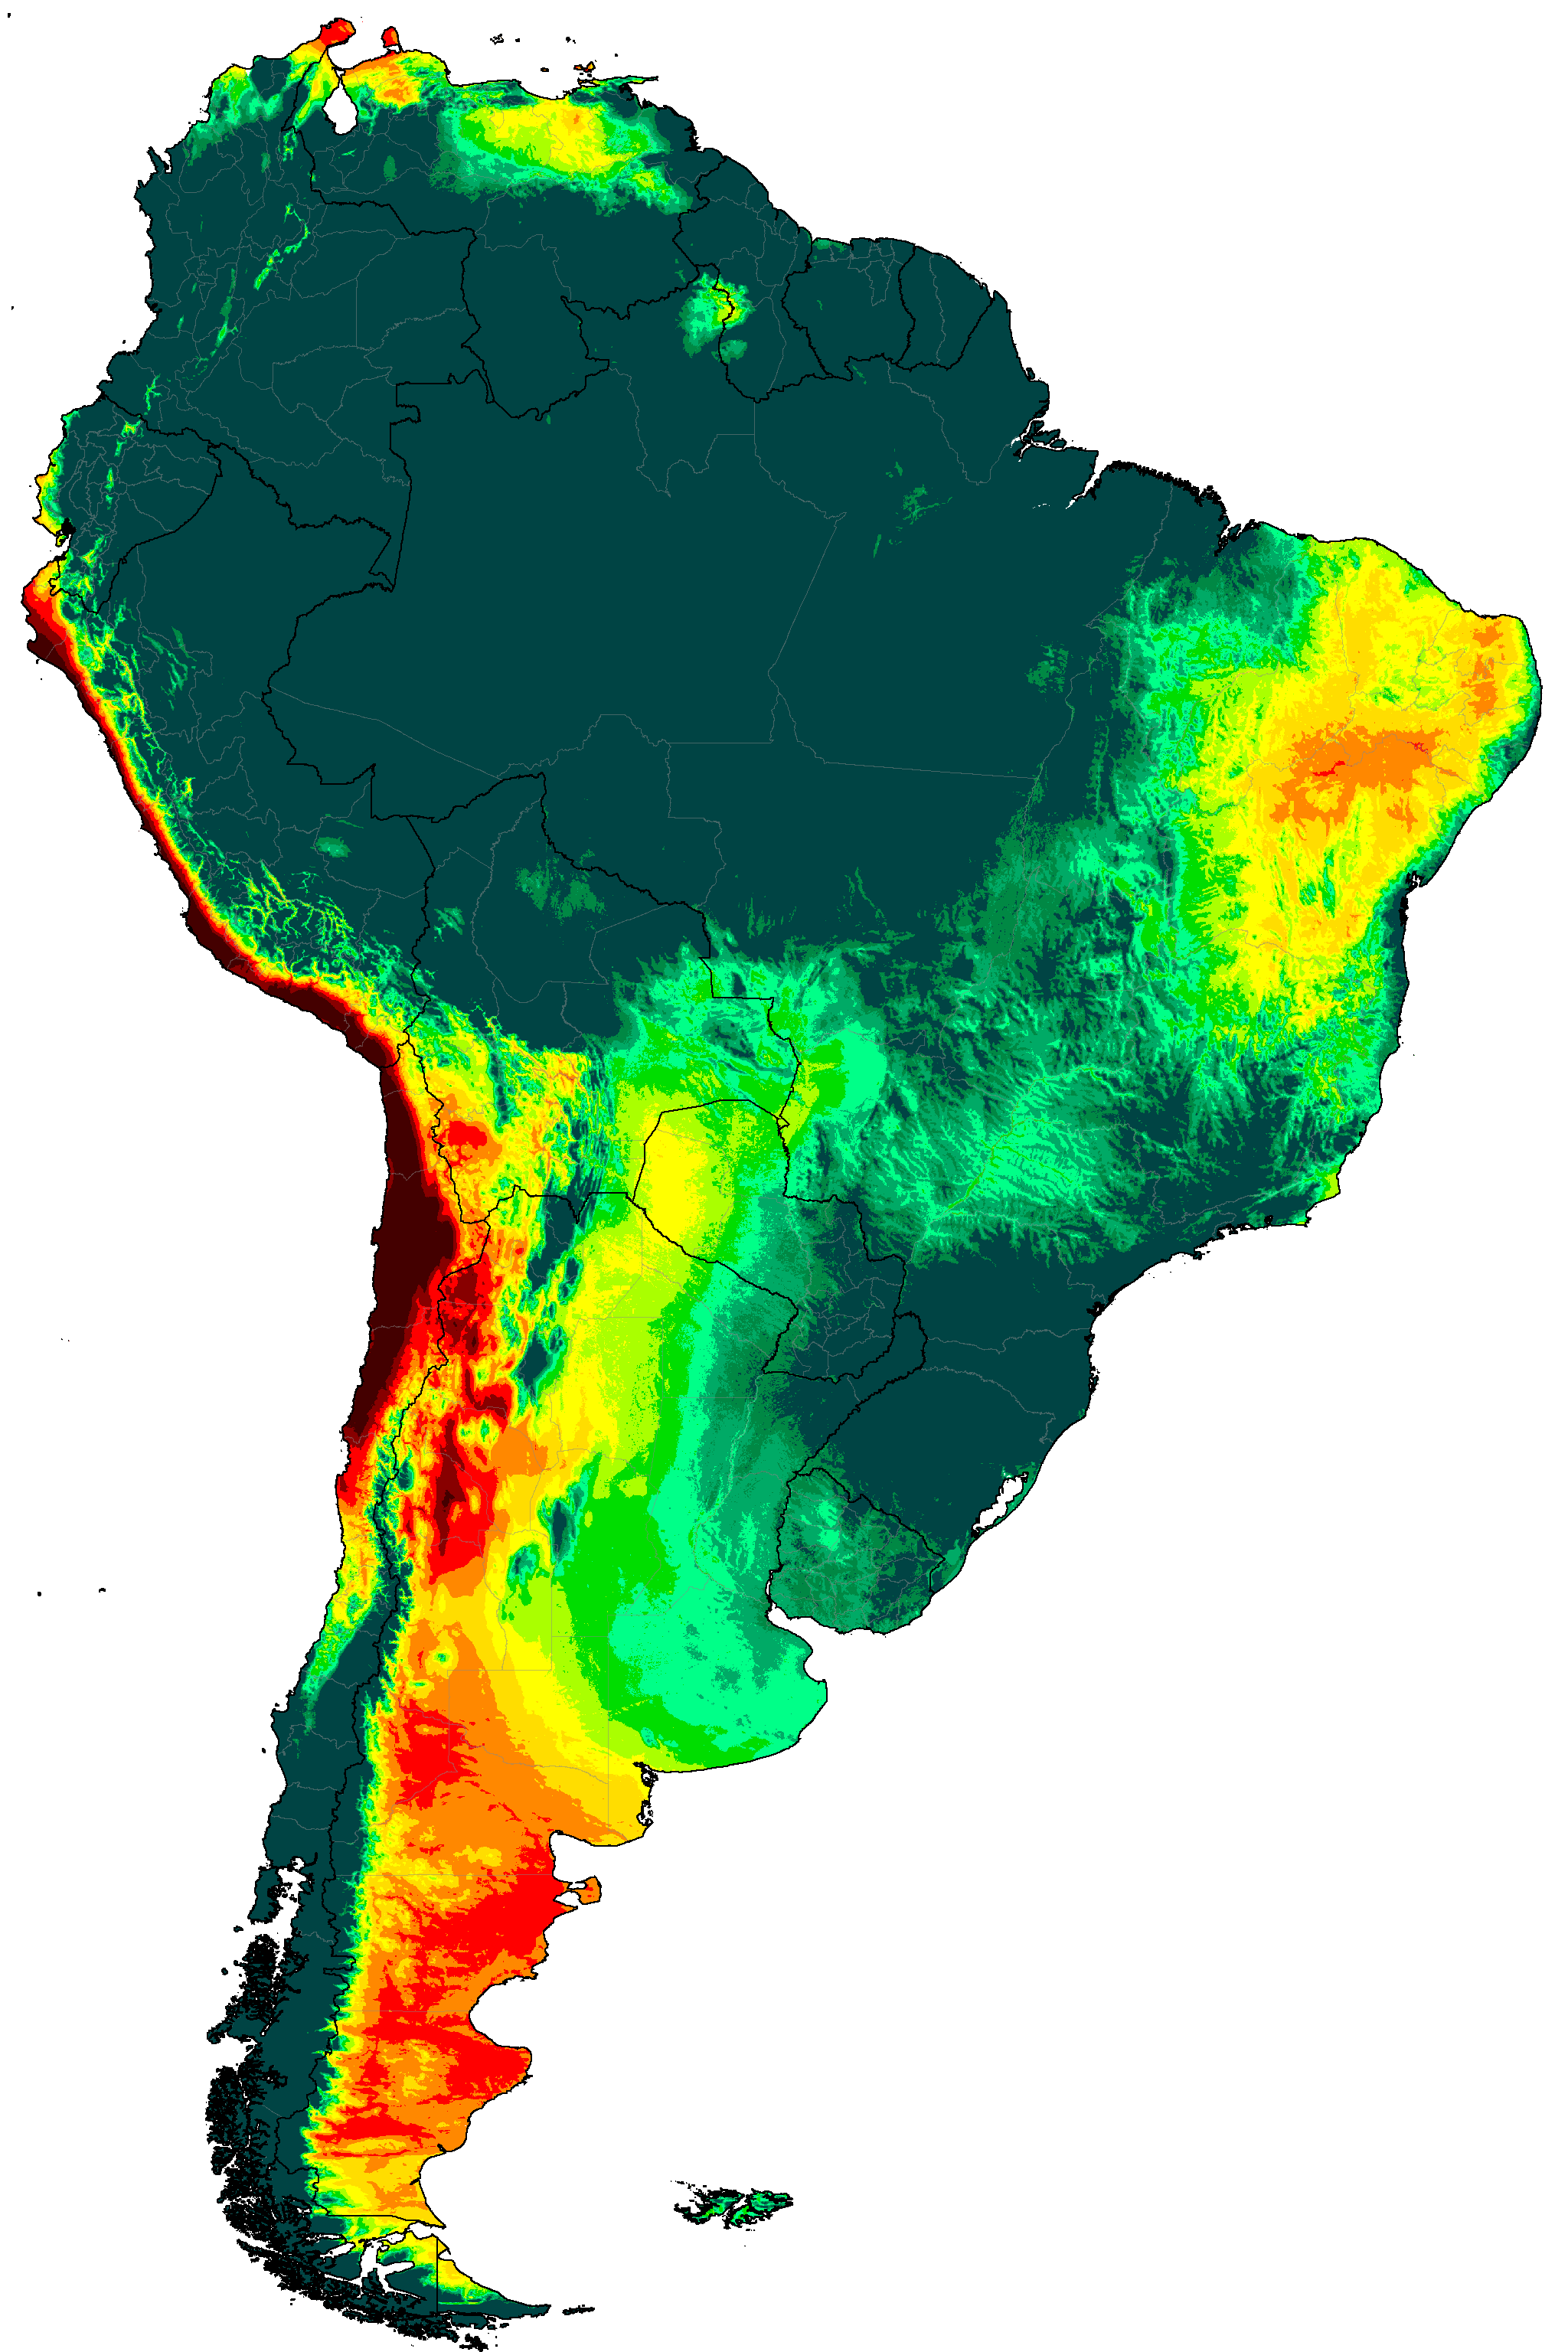
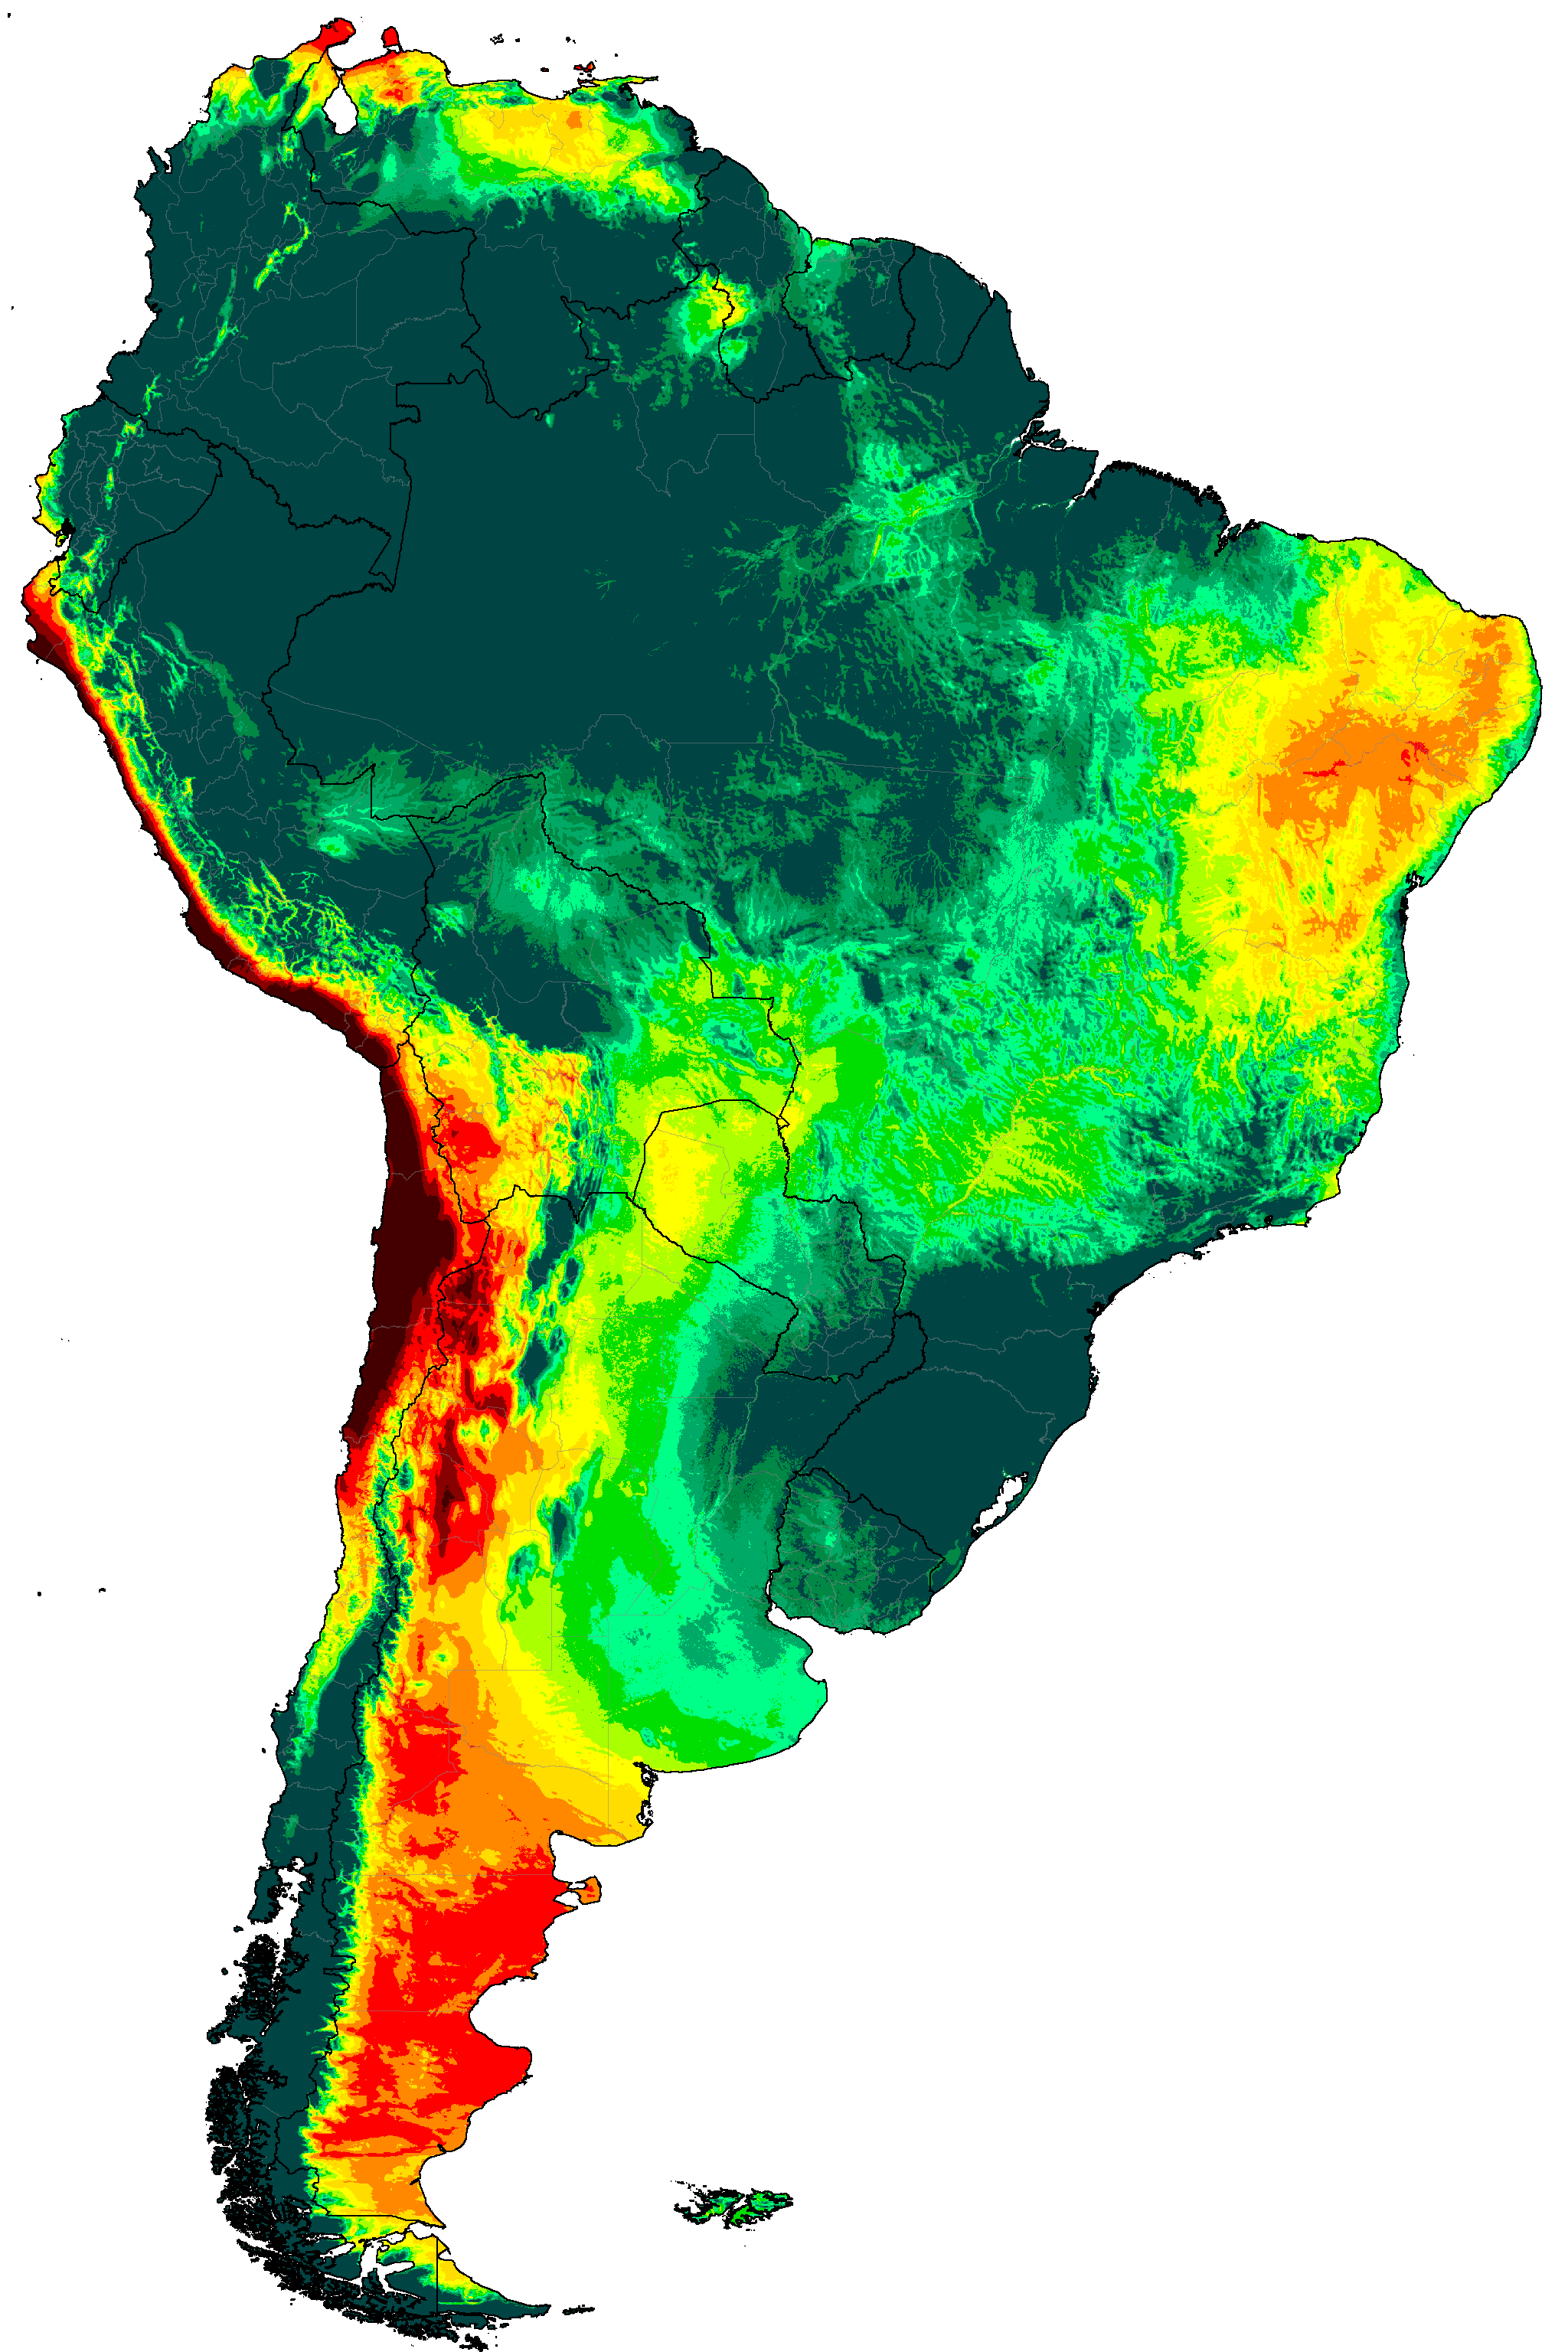
South America distribution of aridity categories (projections are SSP5-8.5 high emissions normals)
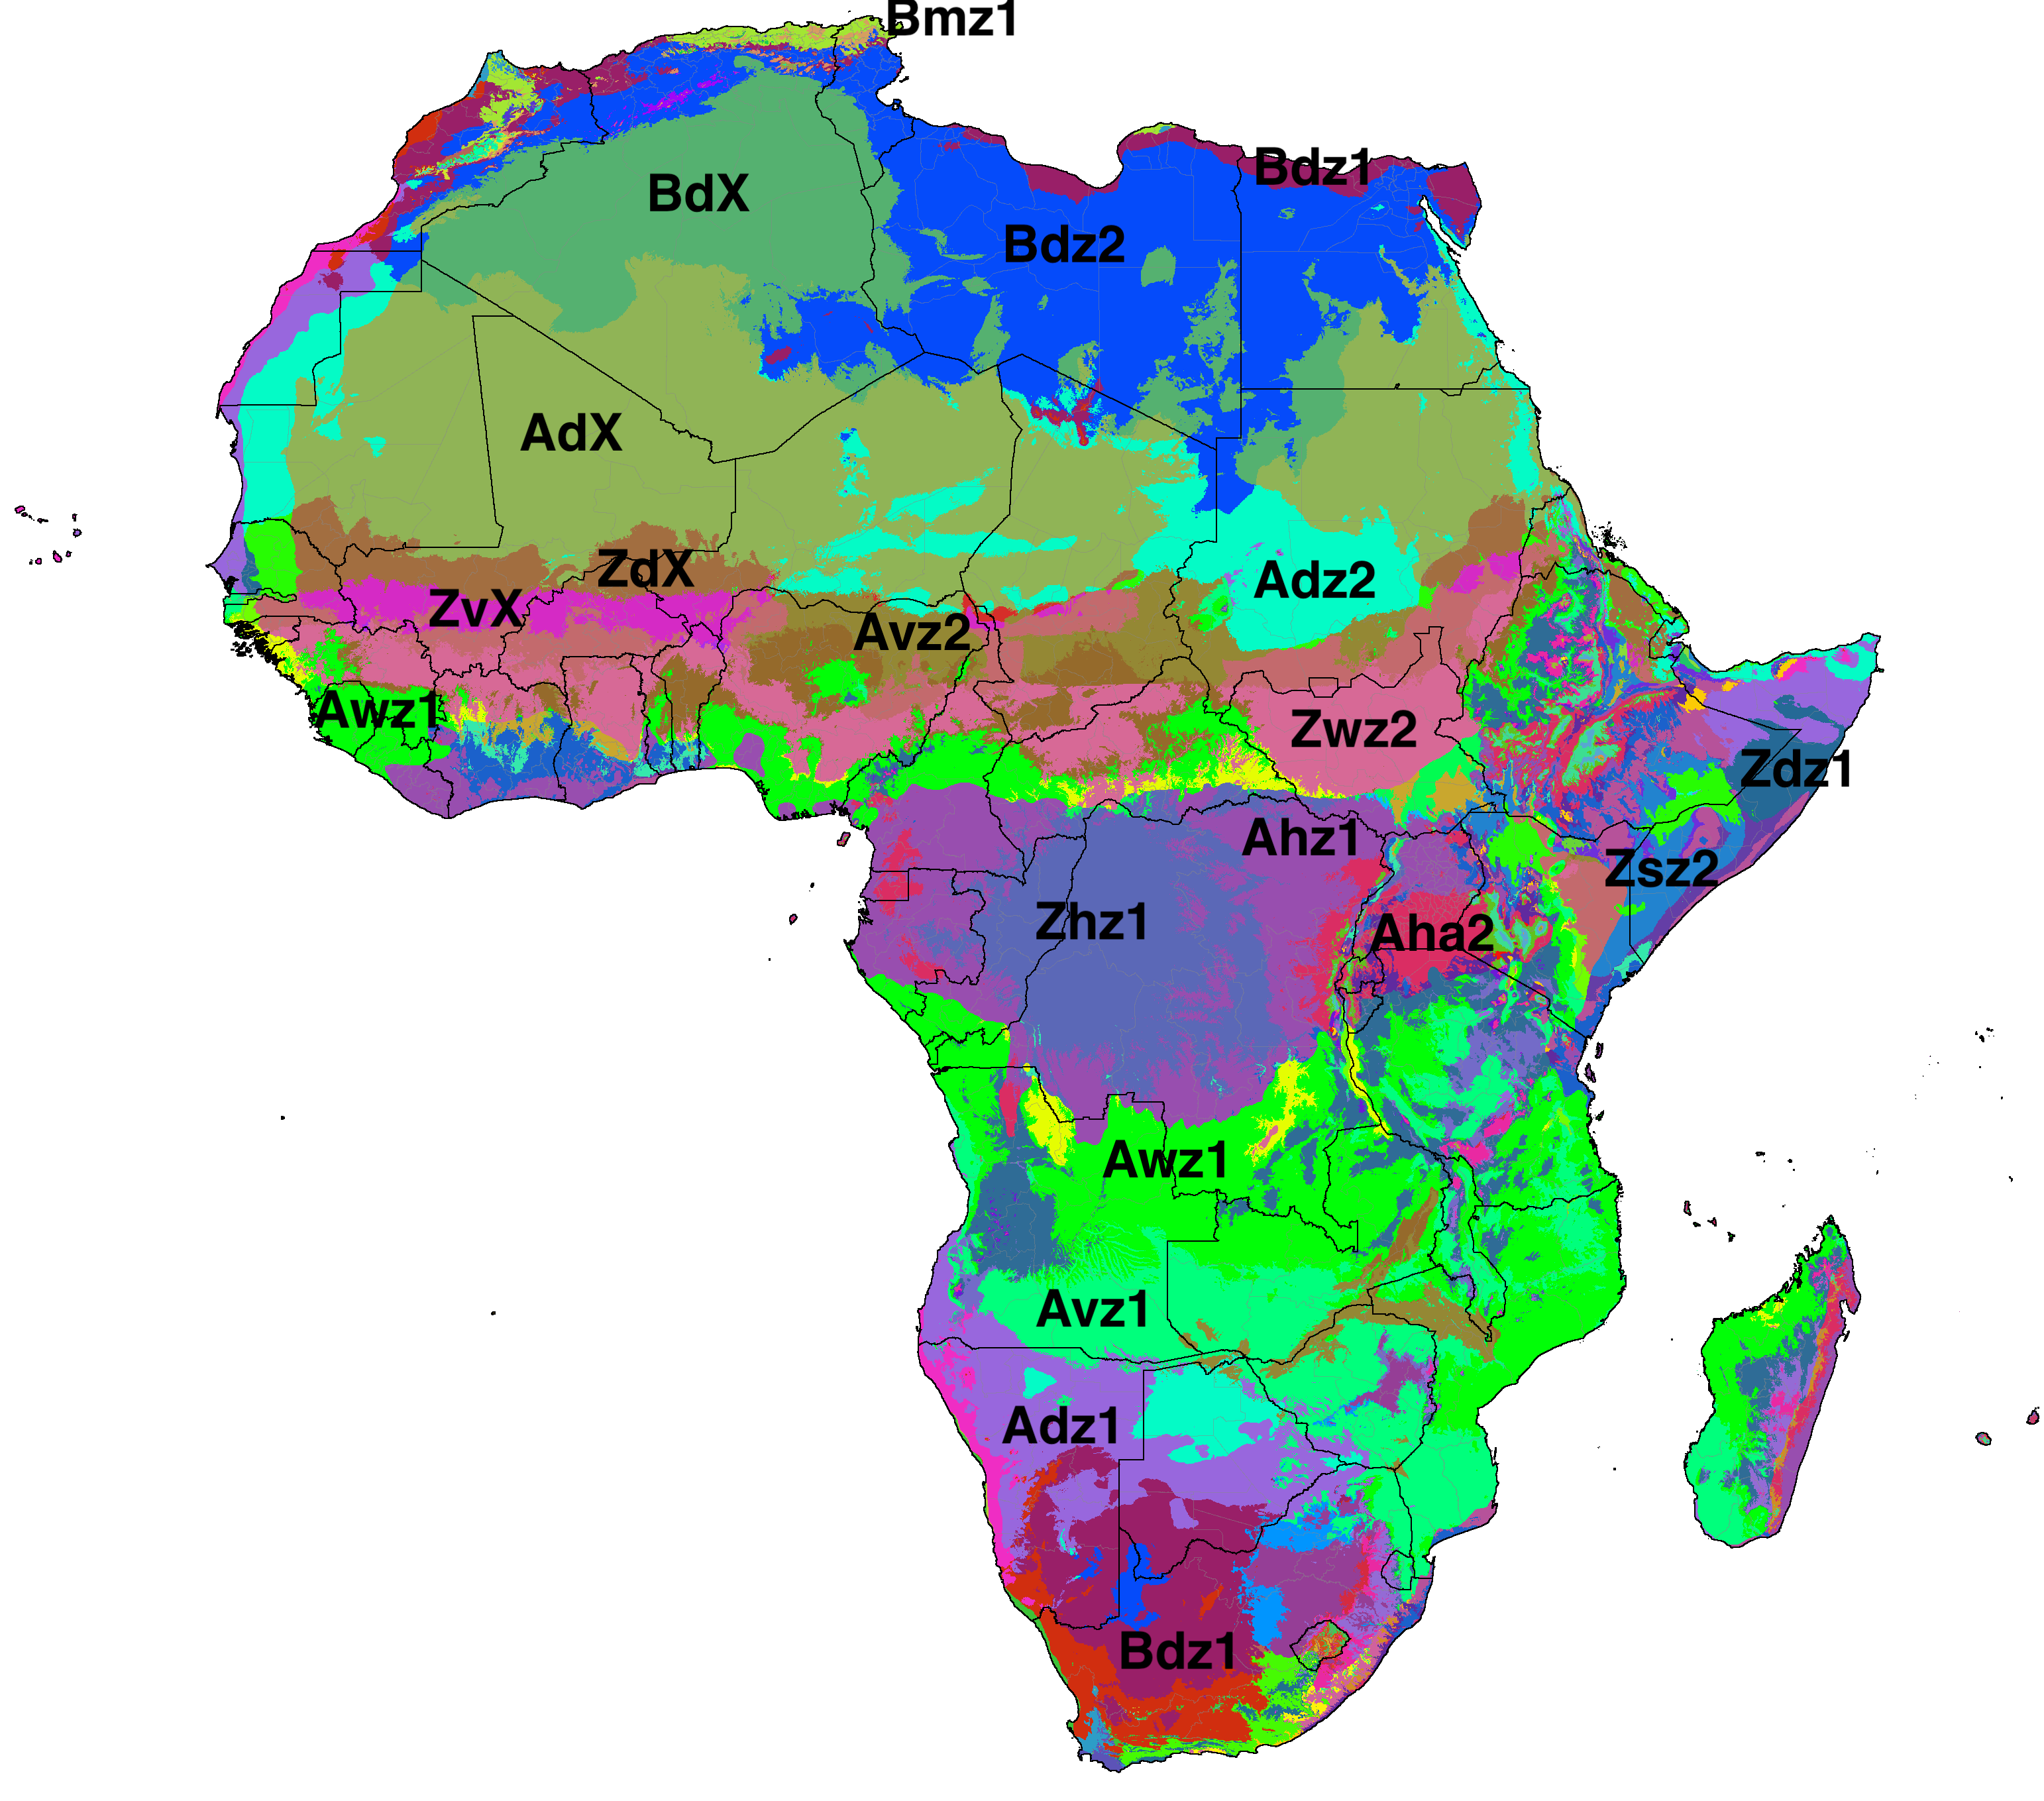
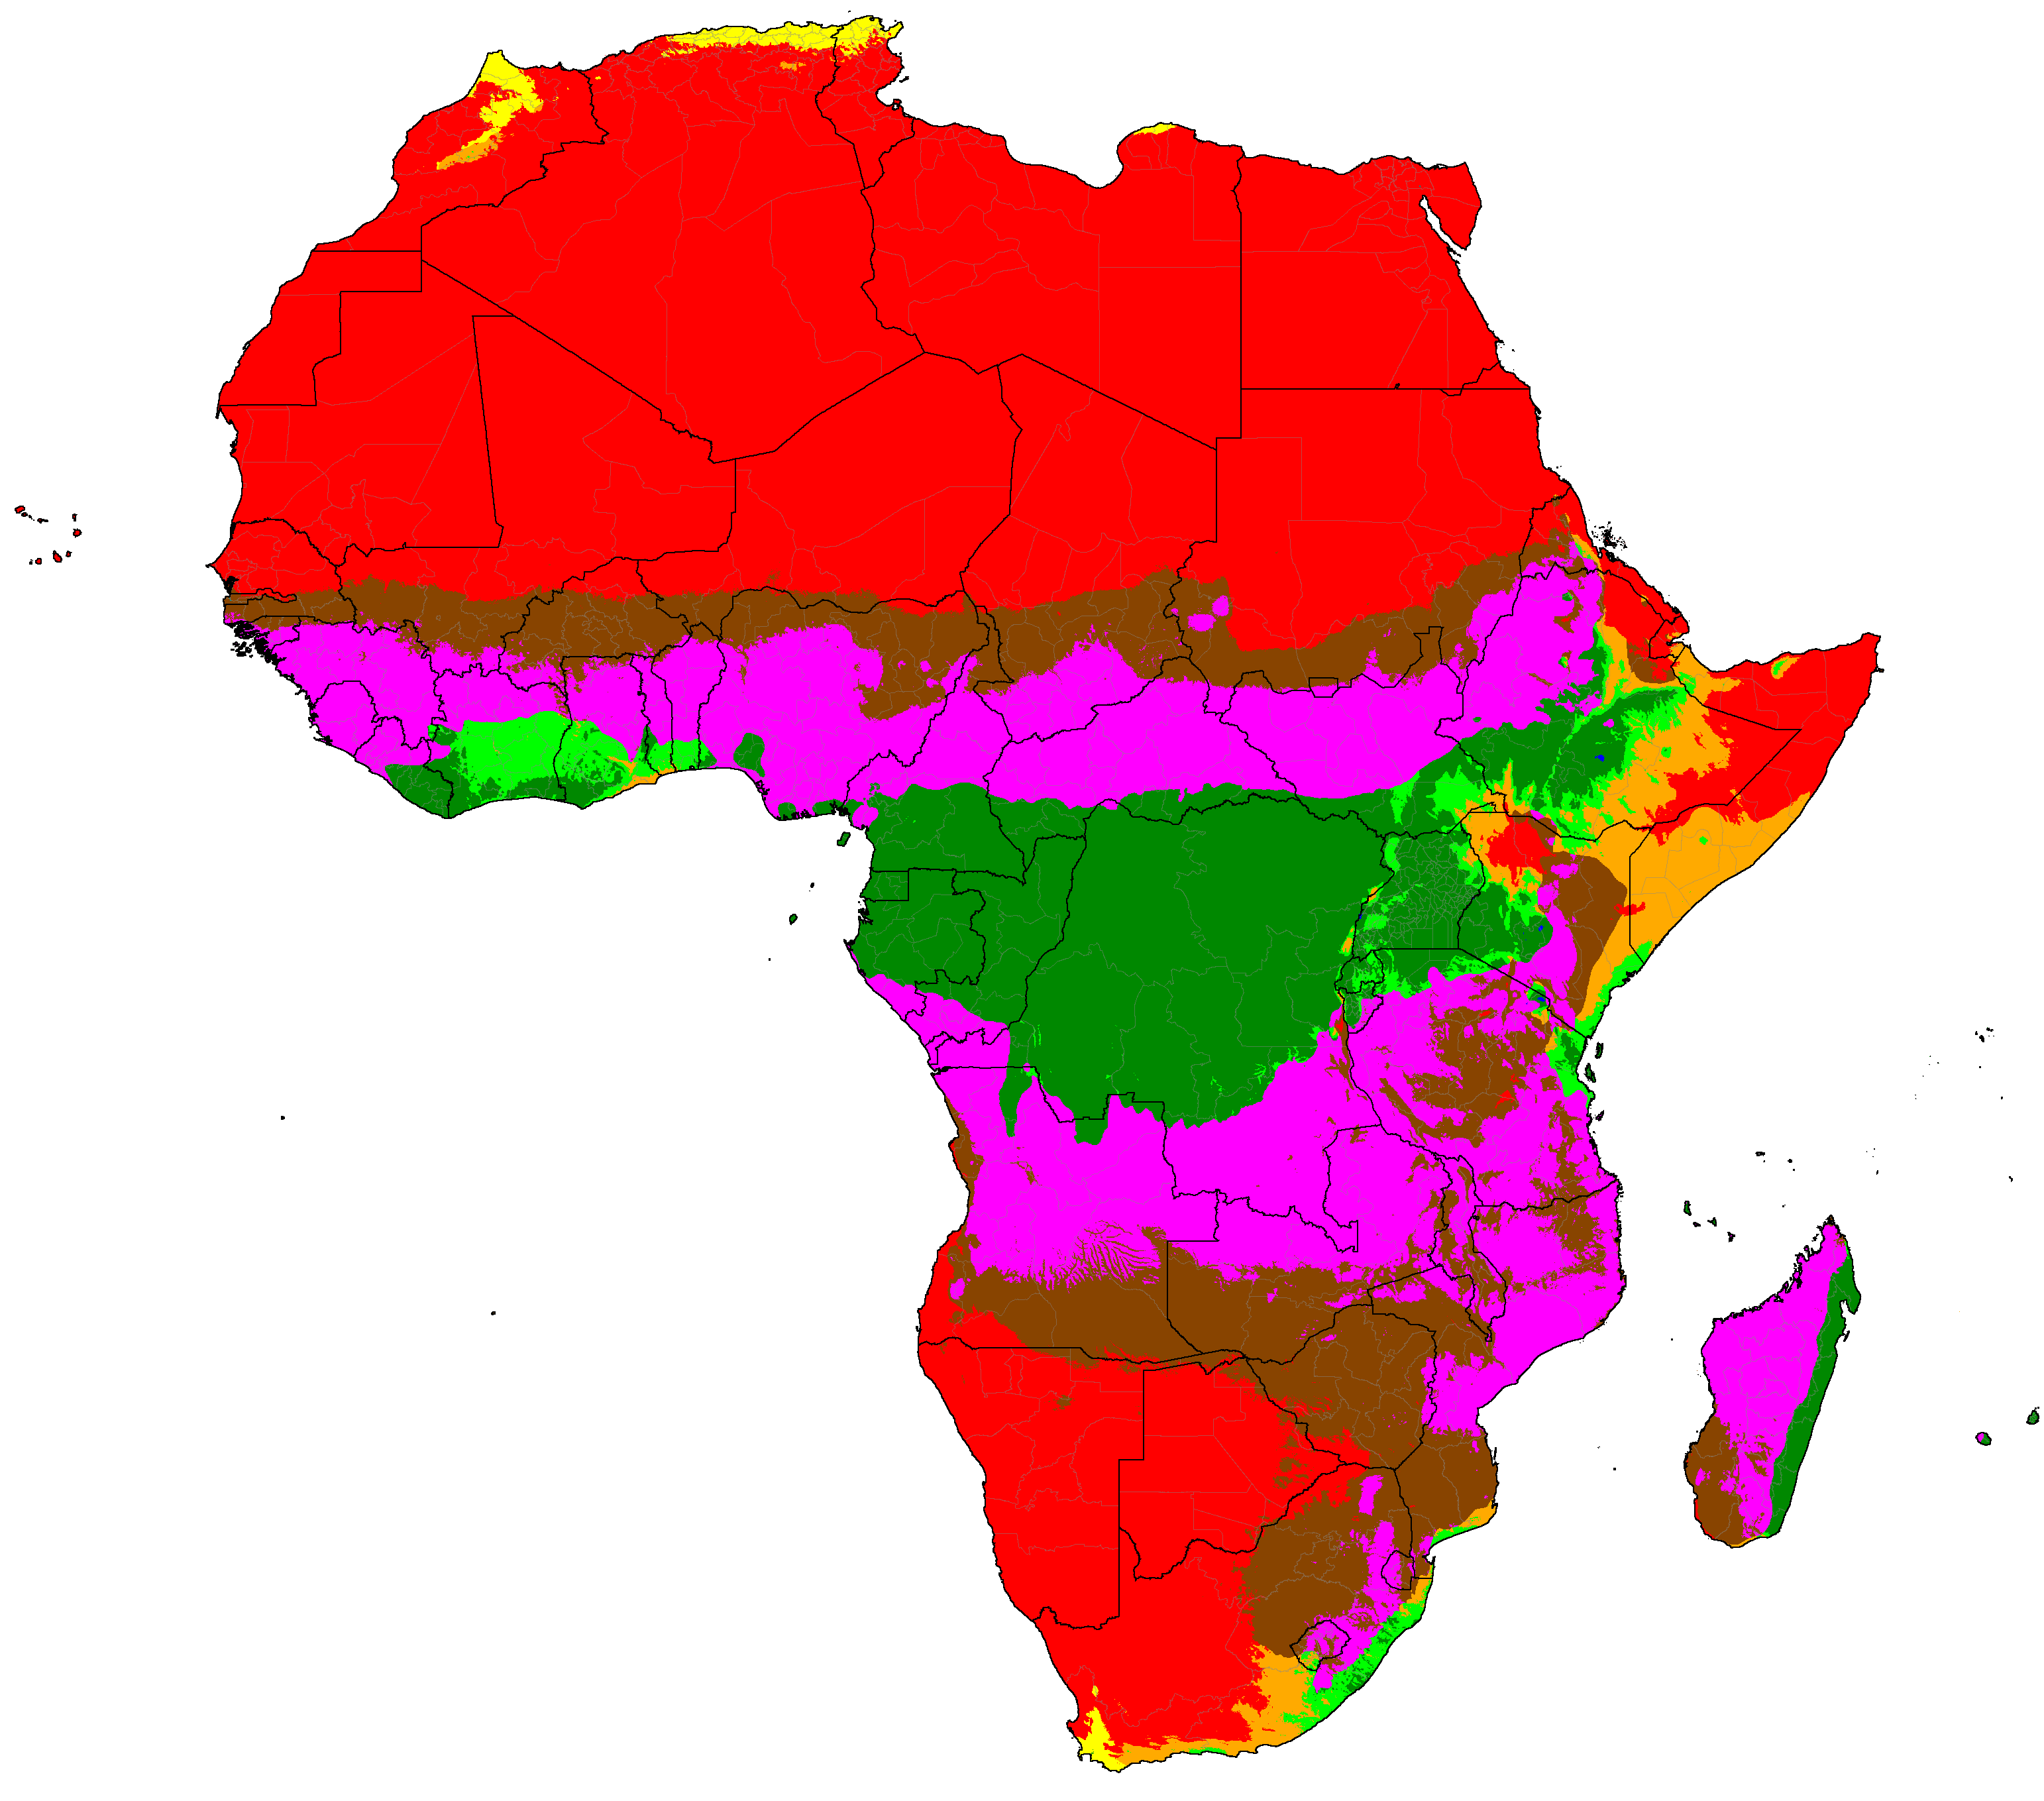
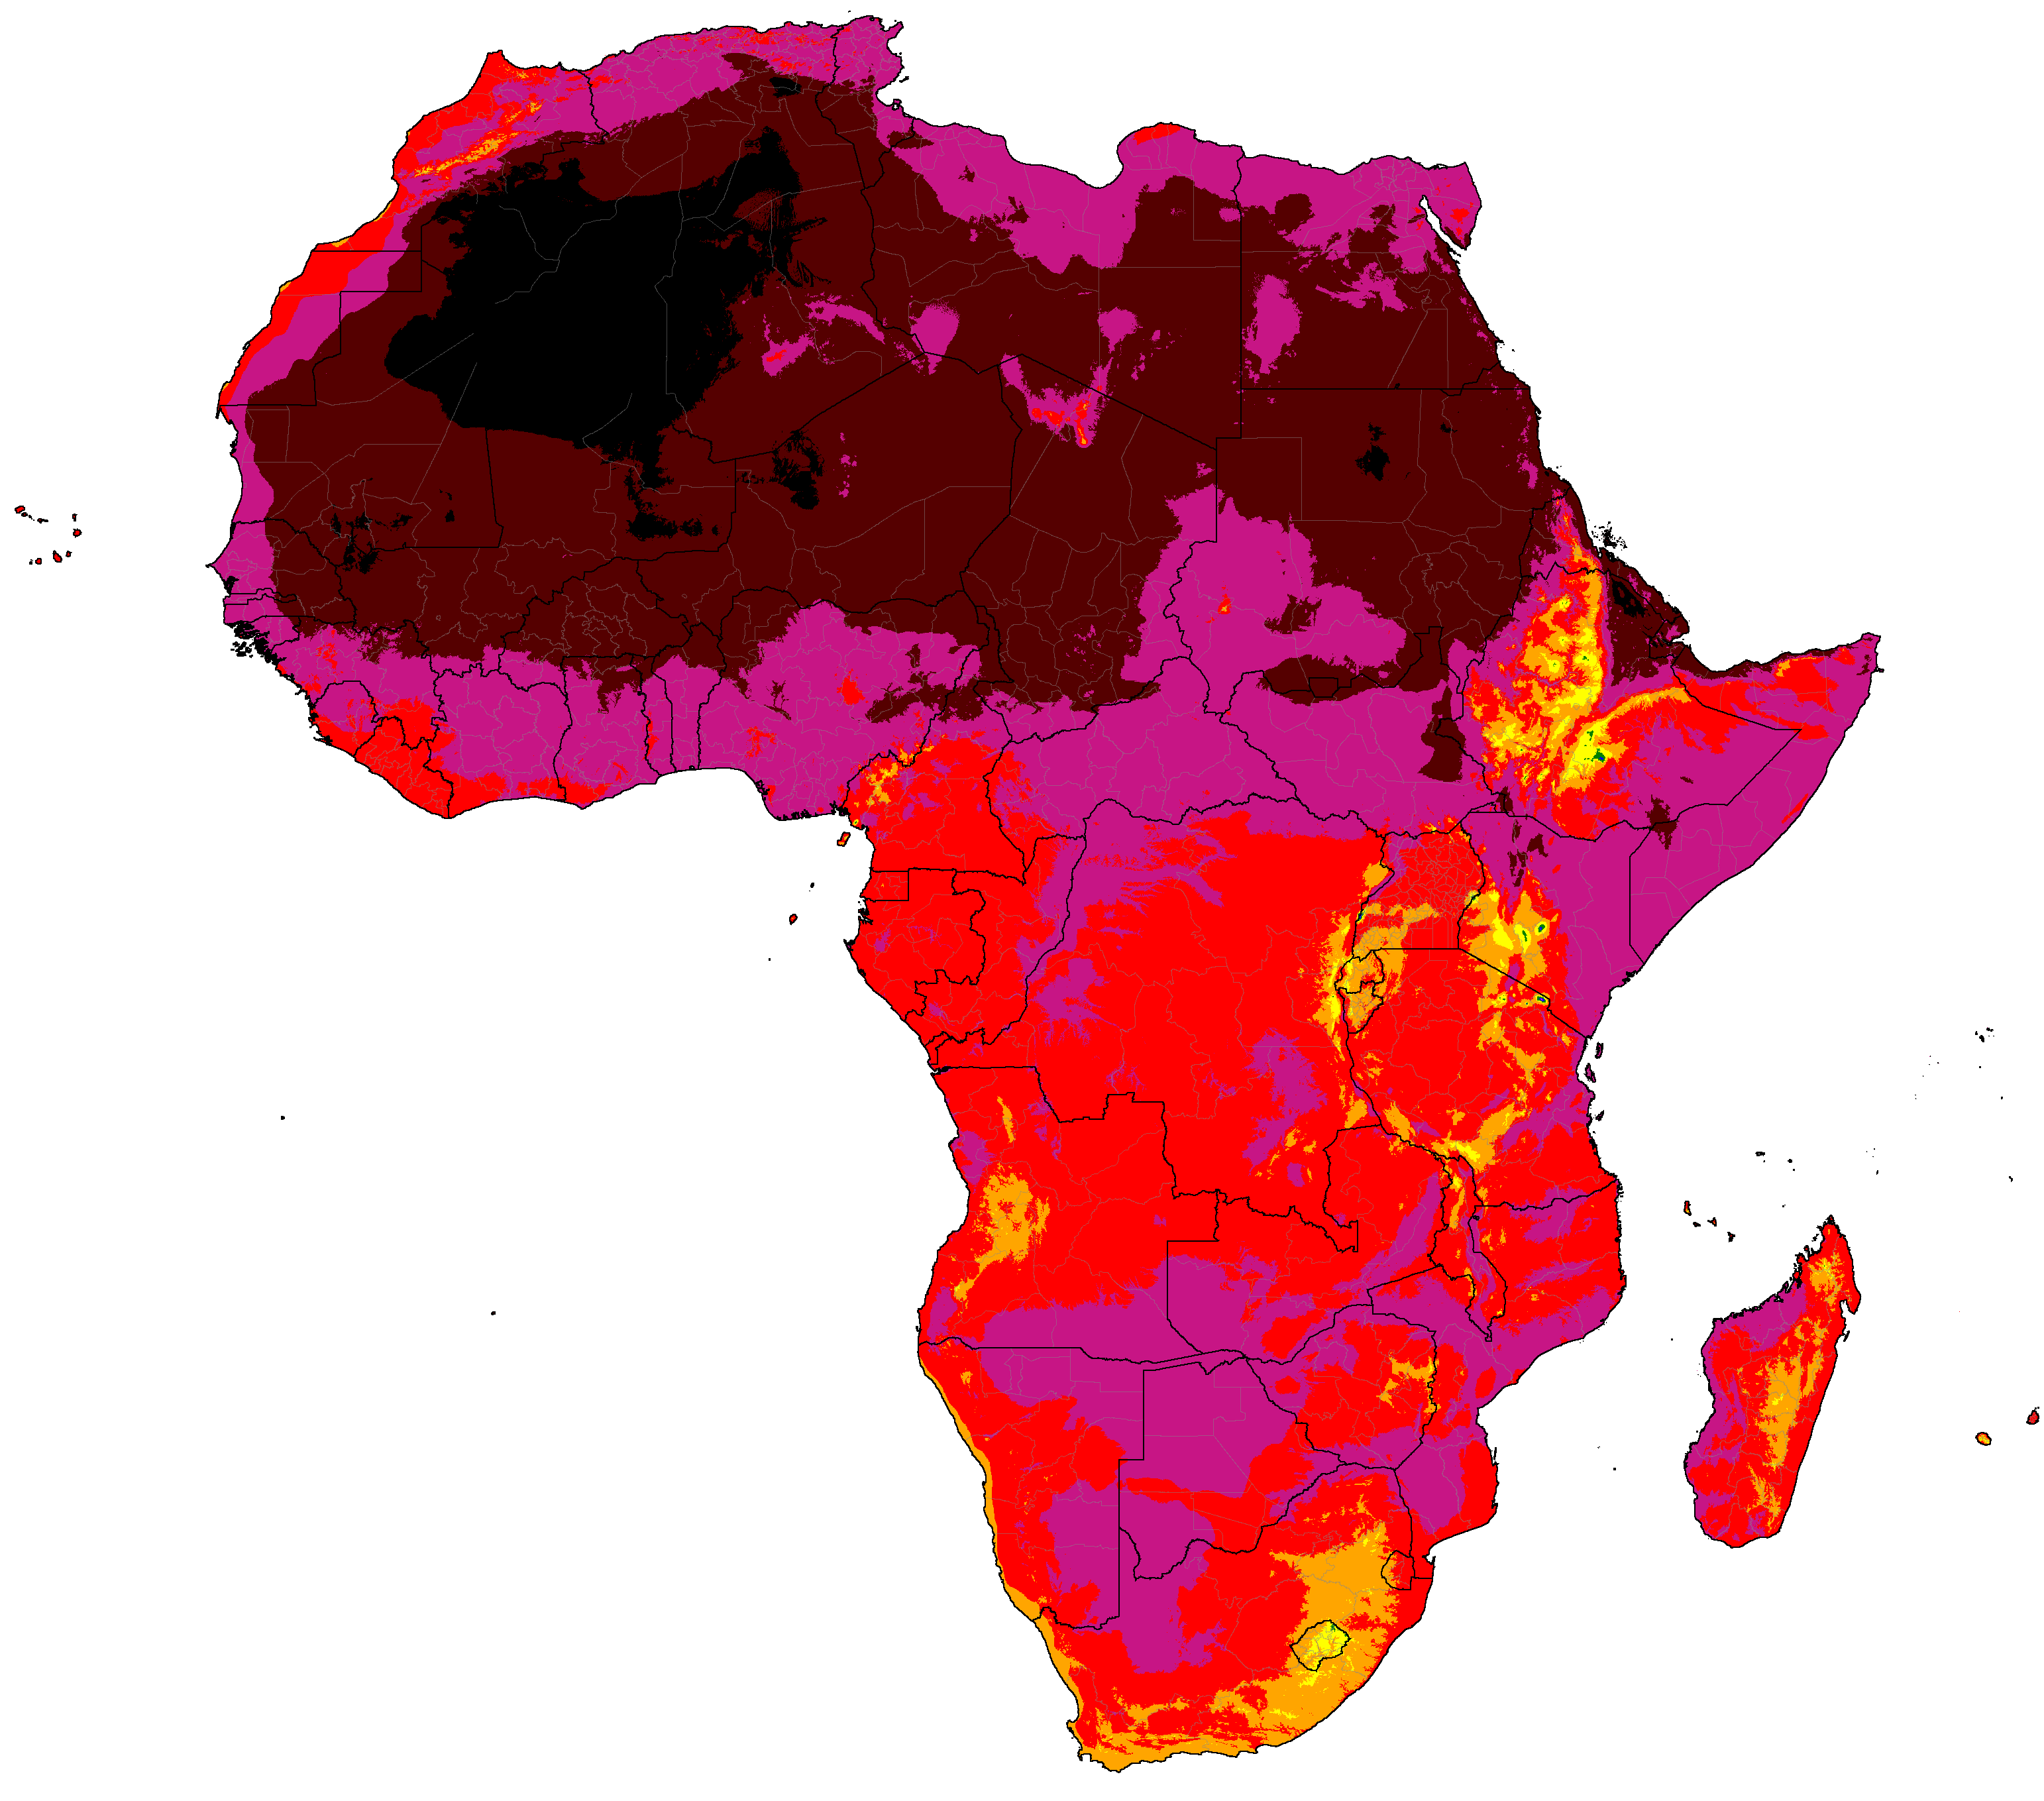
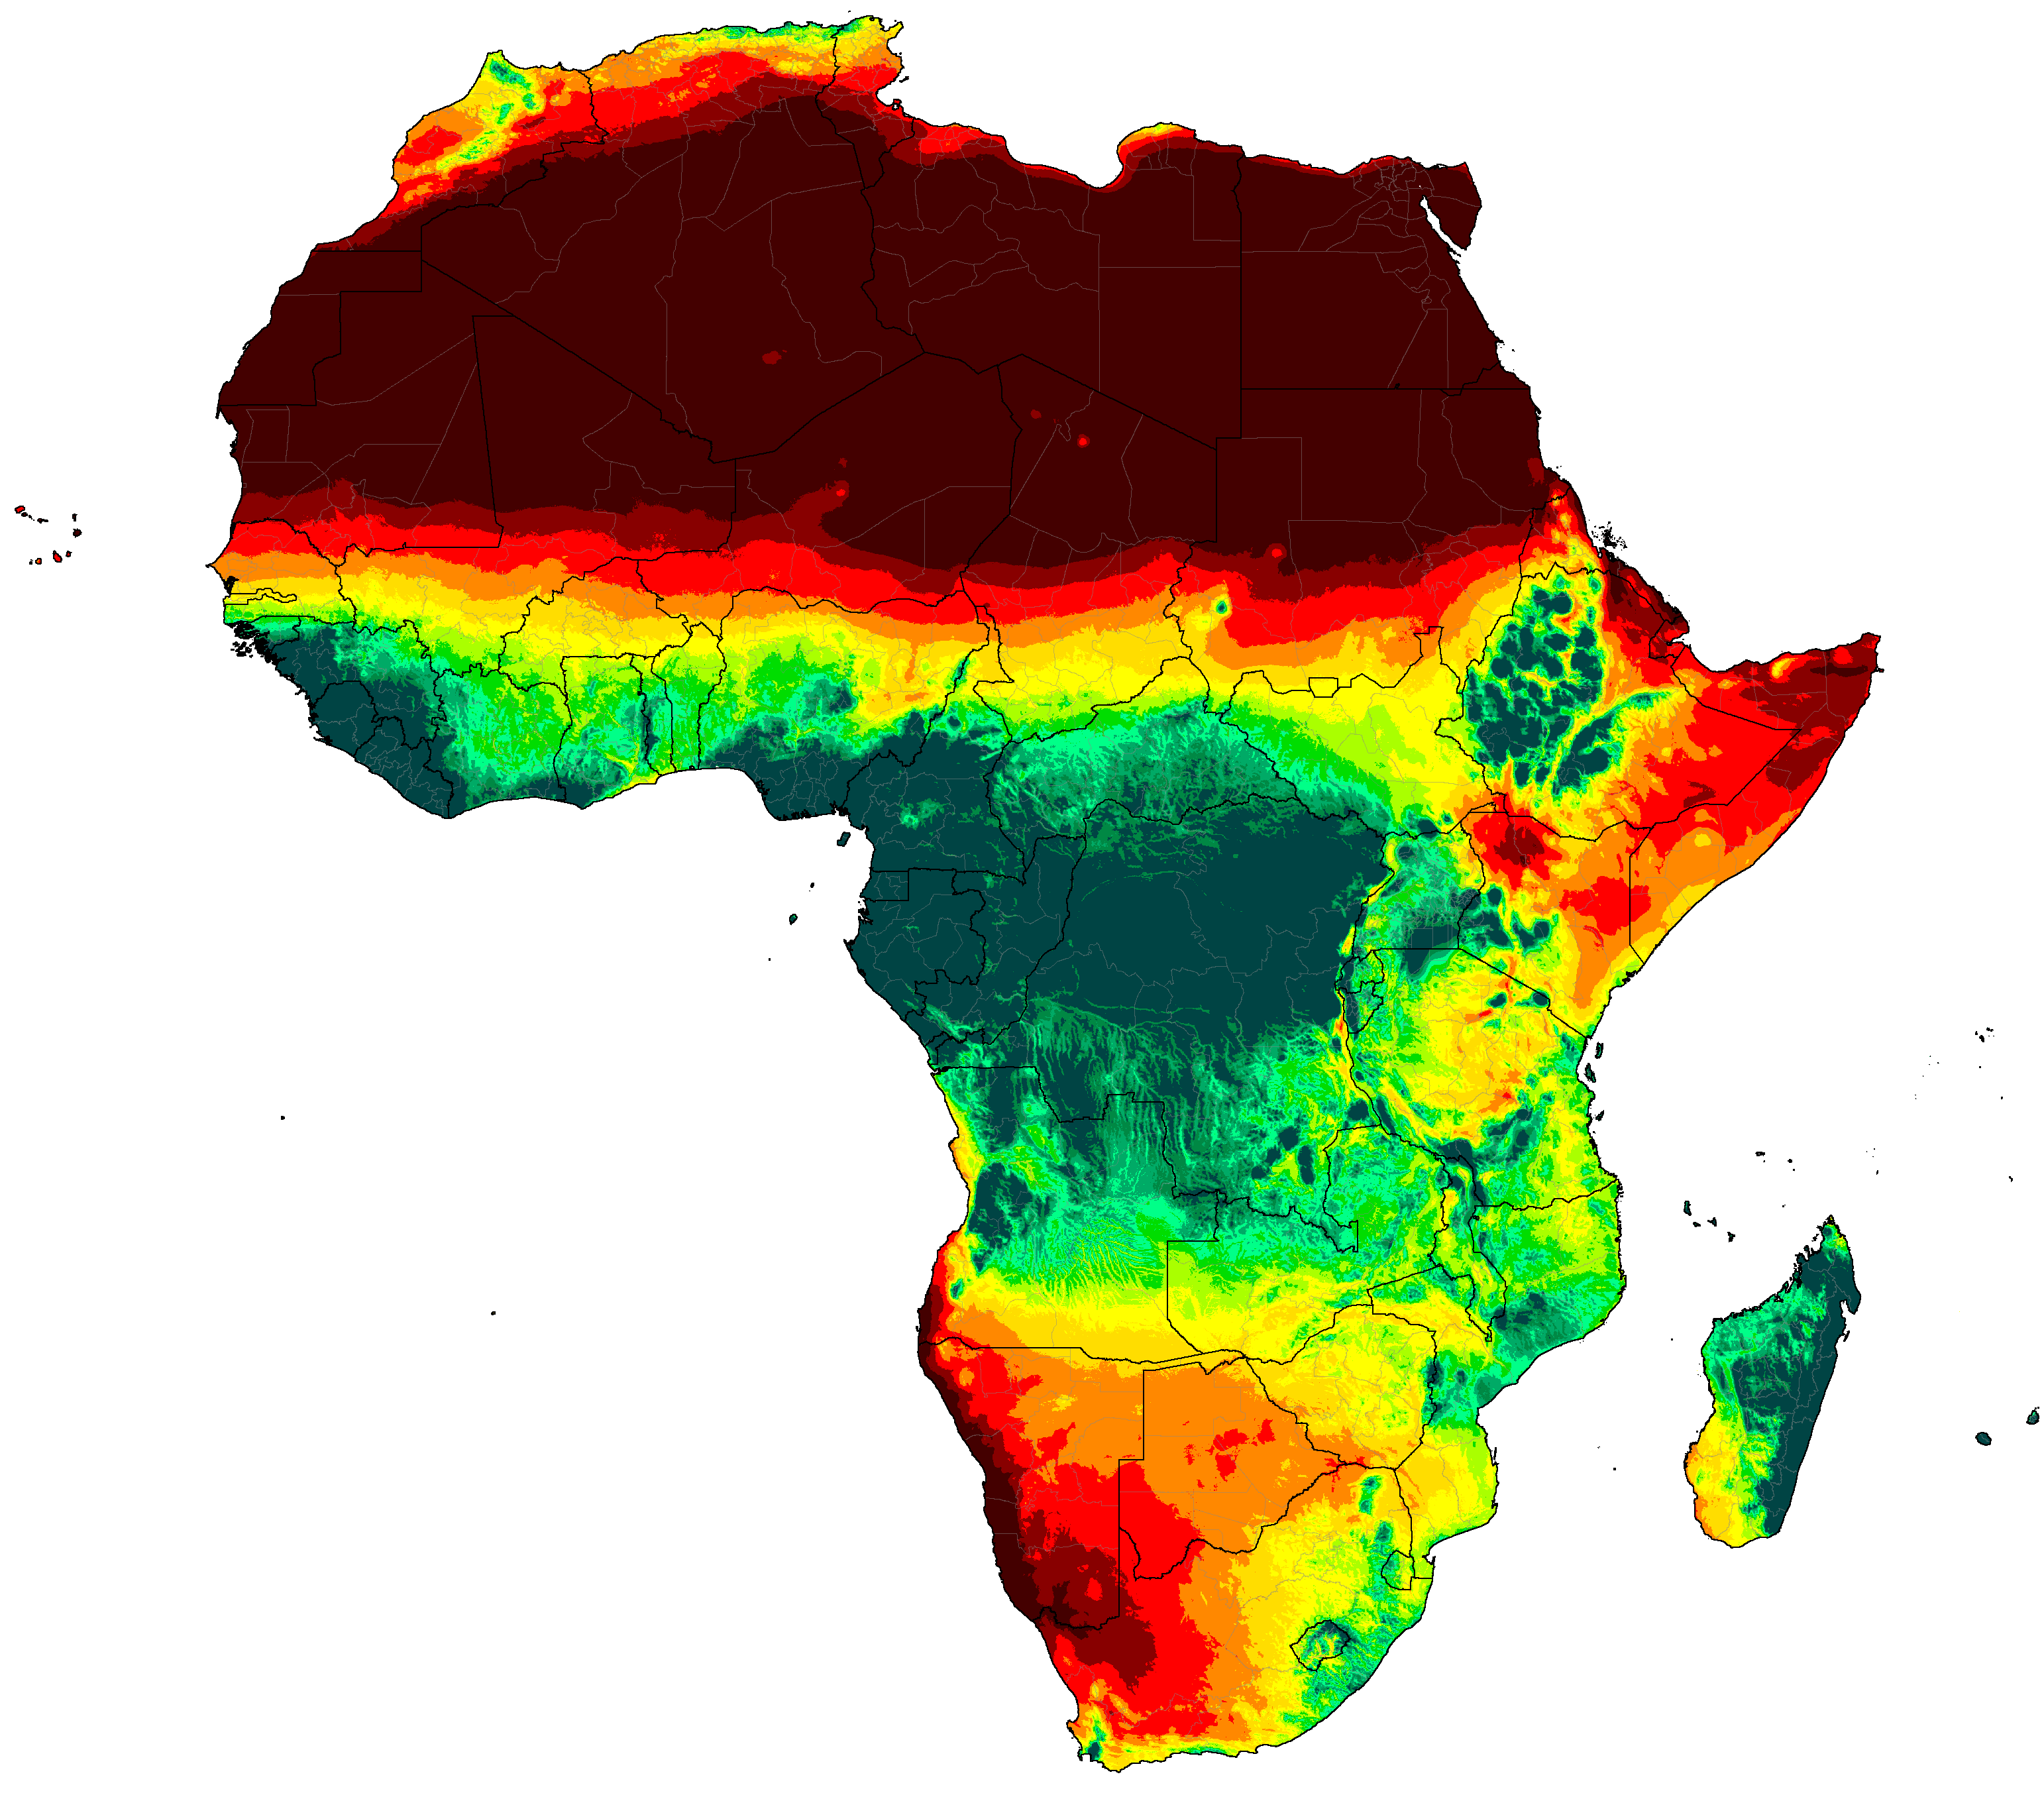
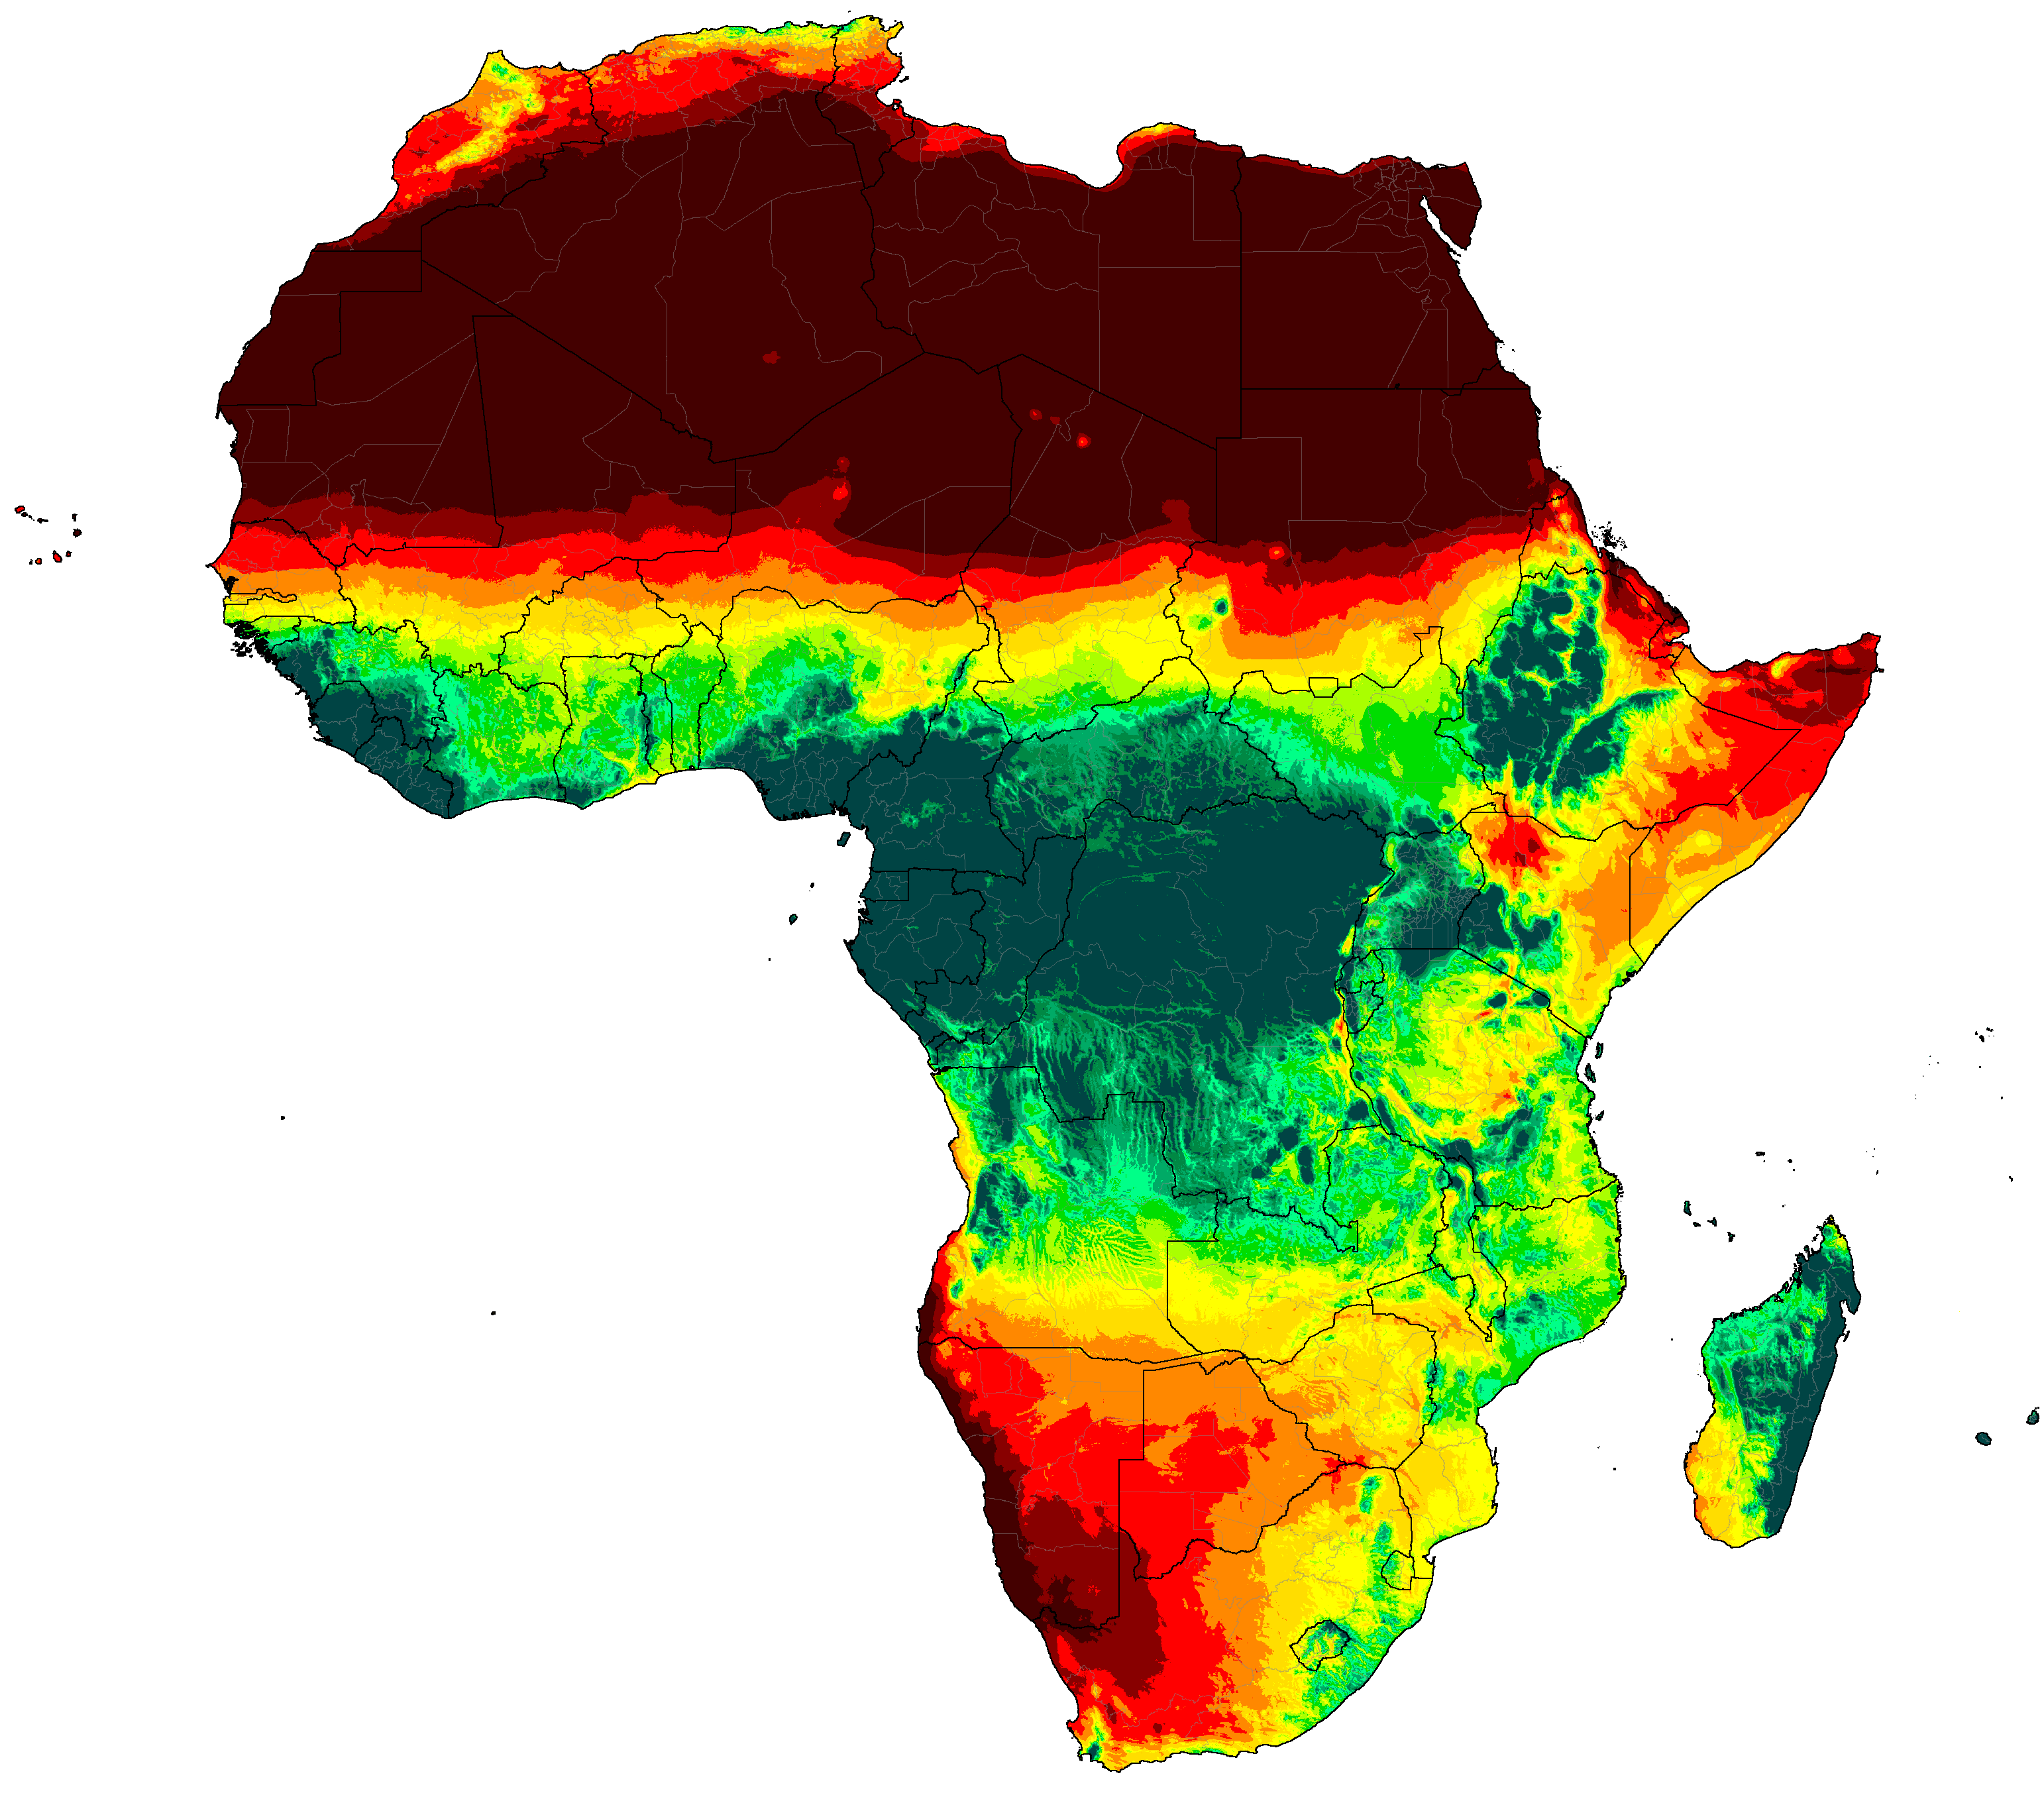
Africa distribution of aridity categories (projections are SSP5-8.5 high emissions normals)

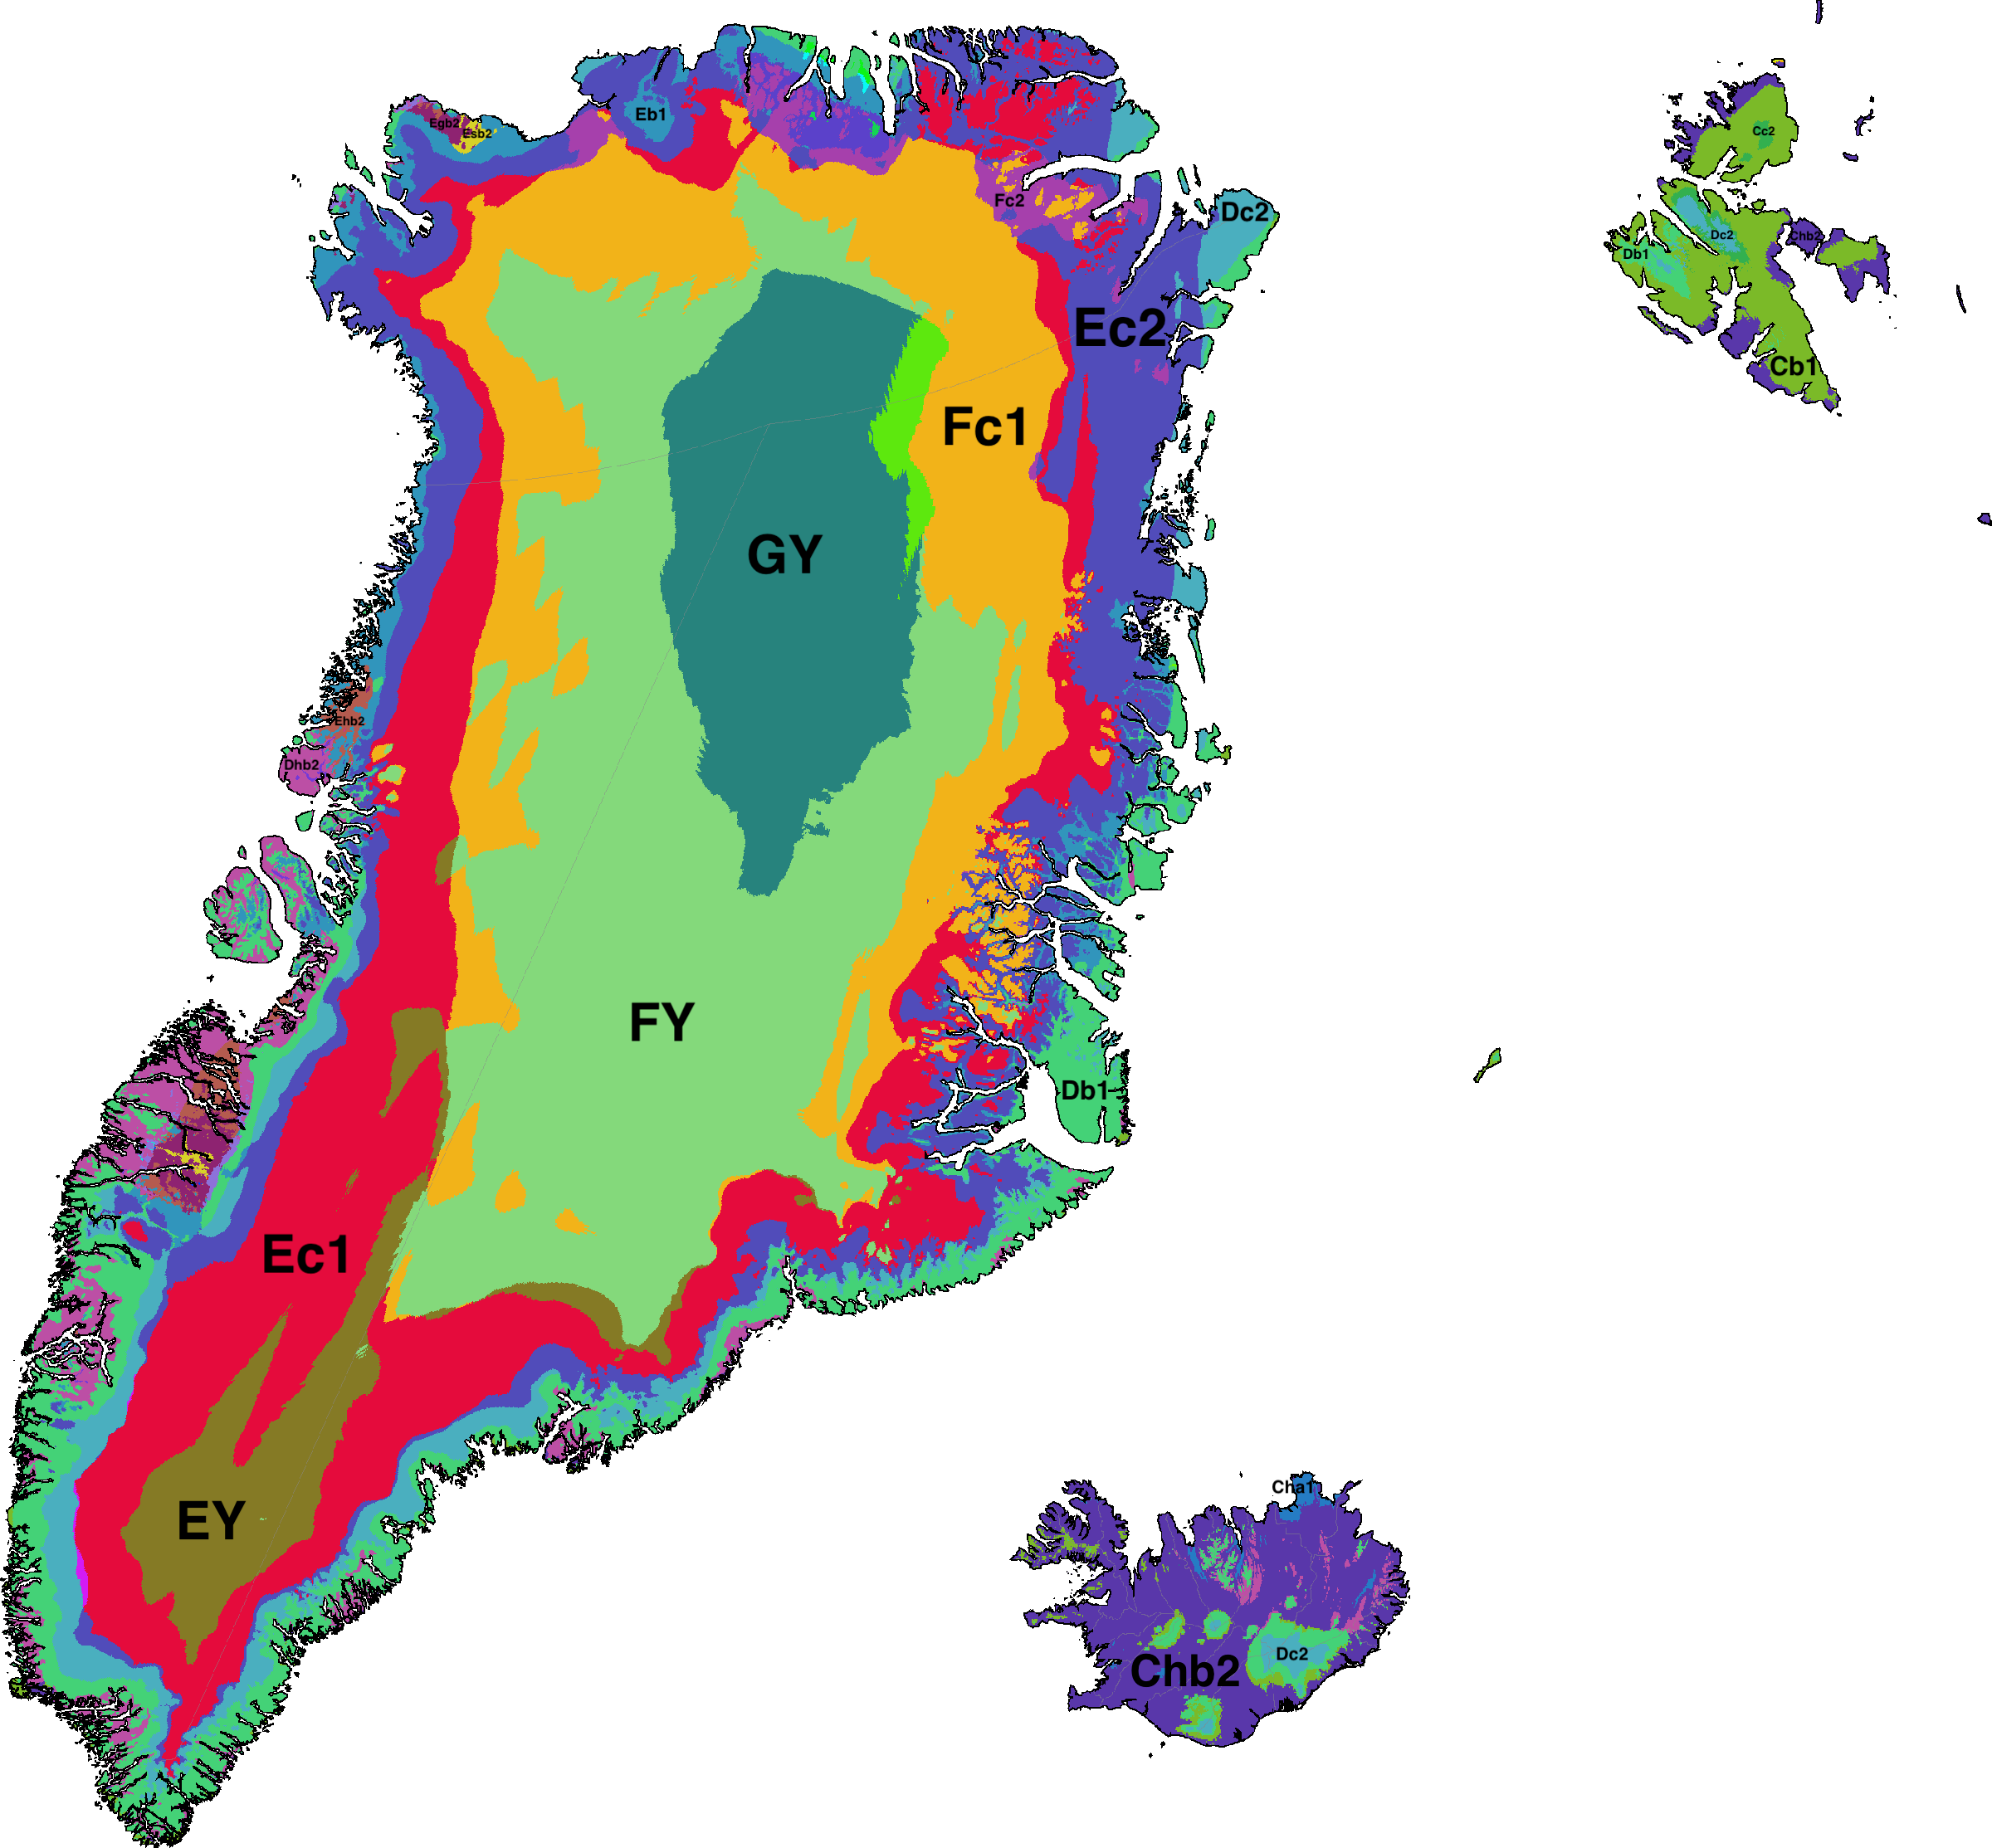
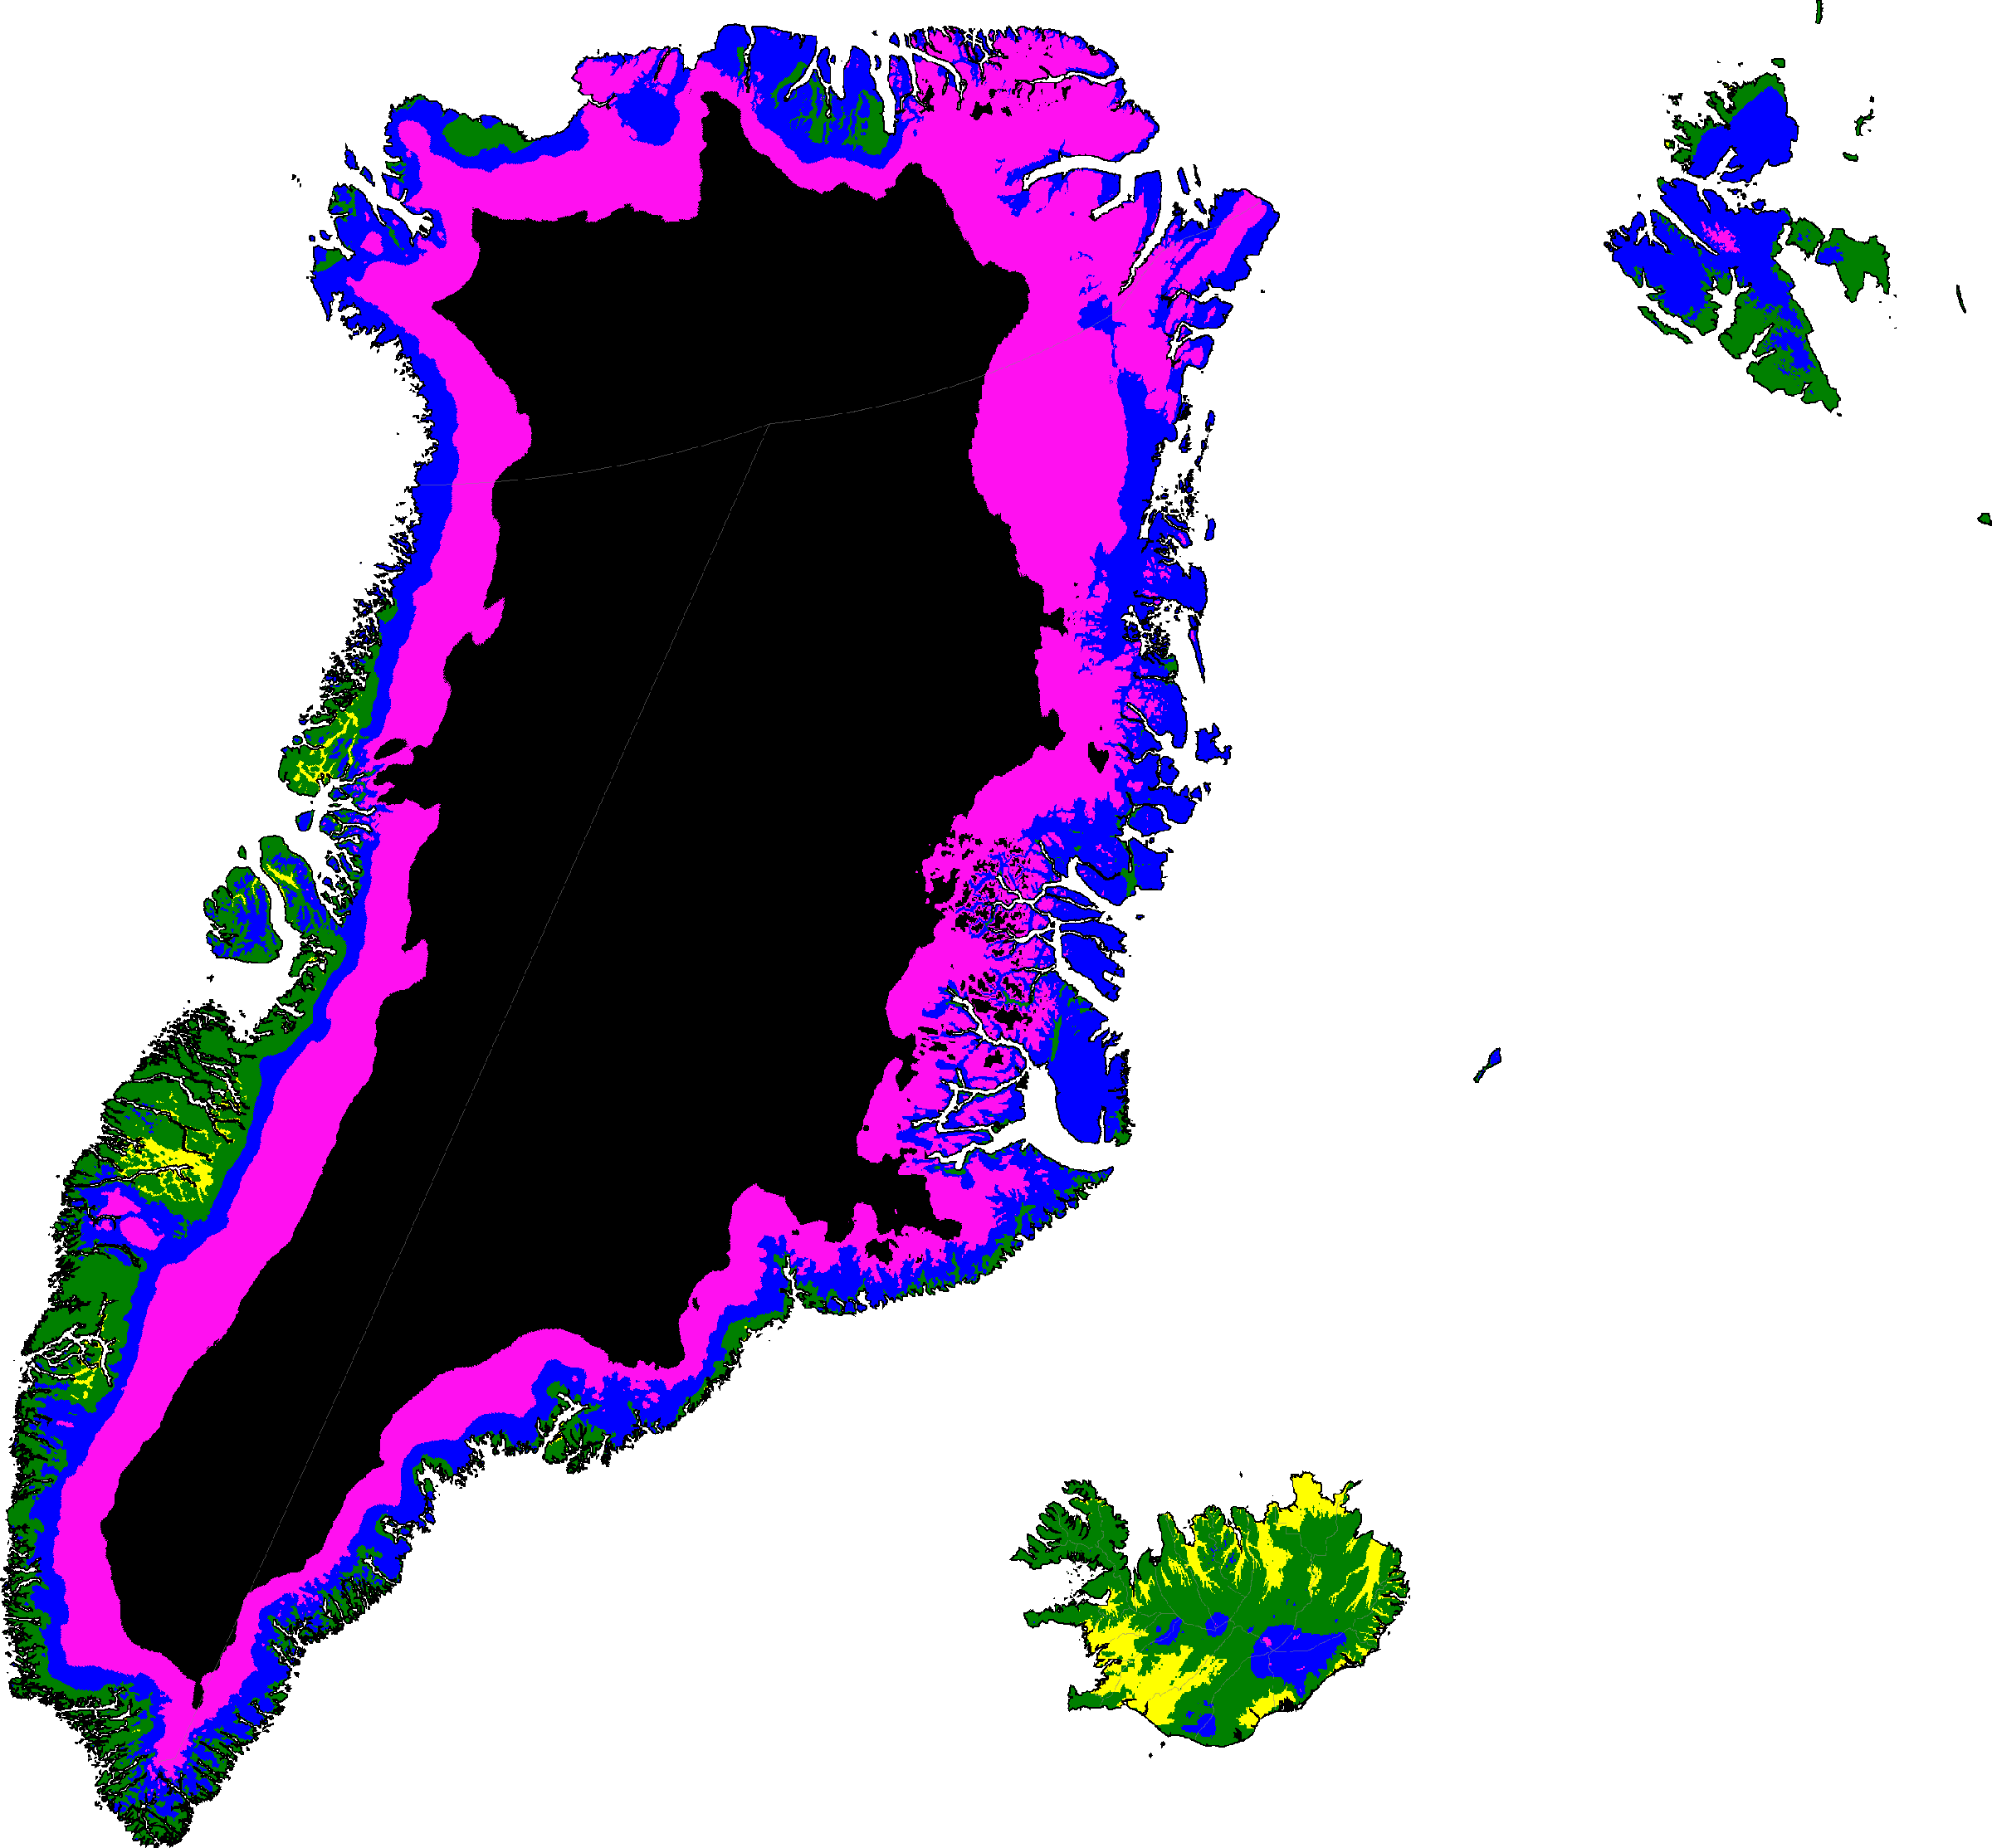
Greenland and Iceland distribution of aridity categories (projections are SSP5-8.5 high emissions normals)


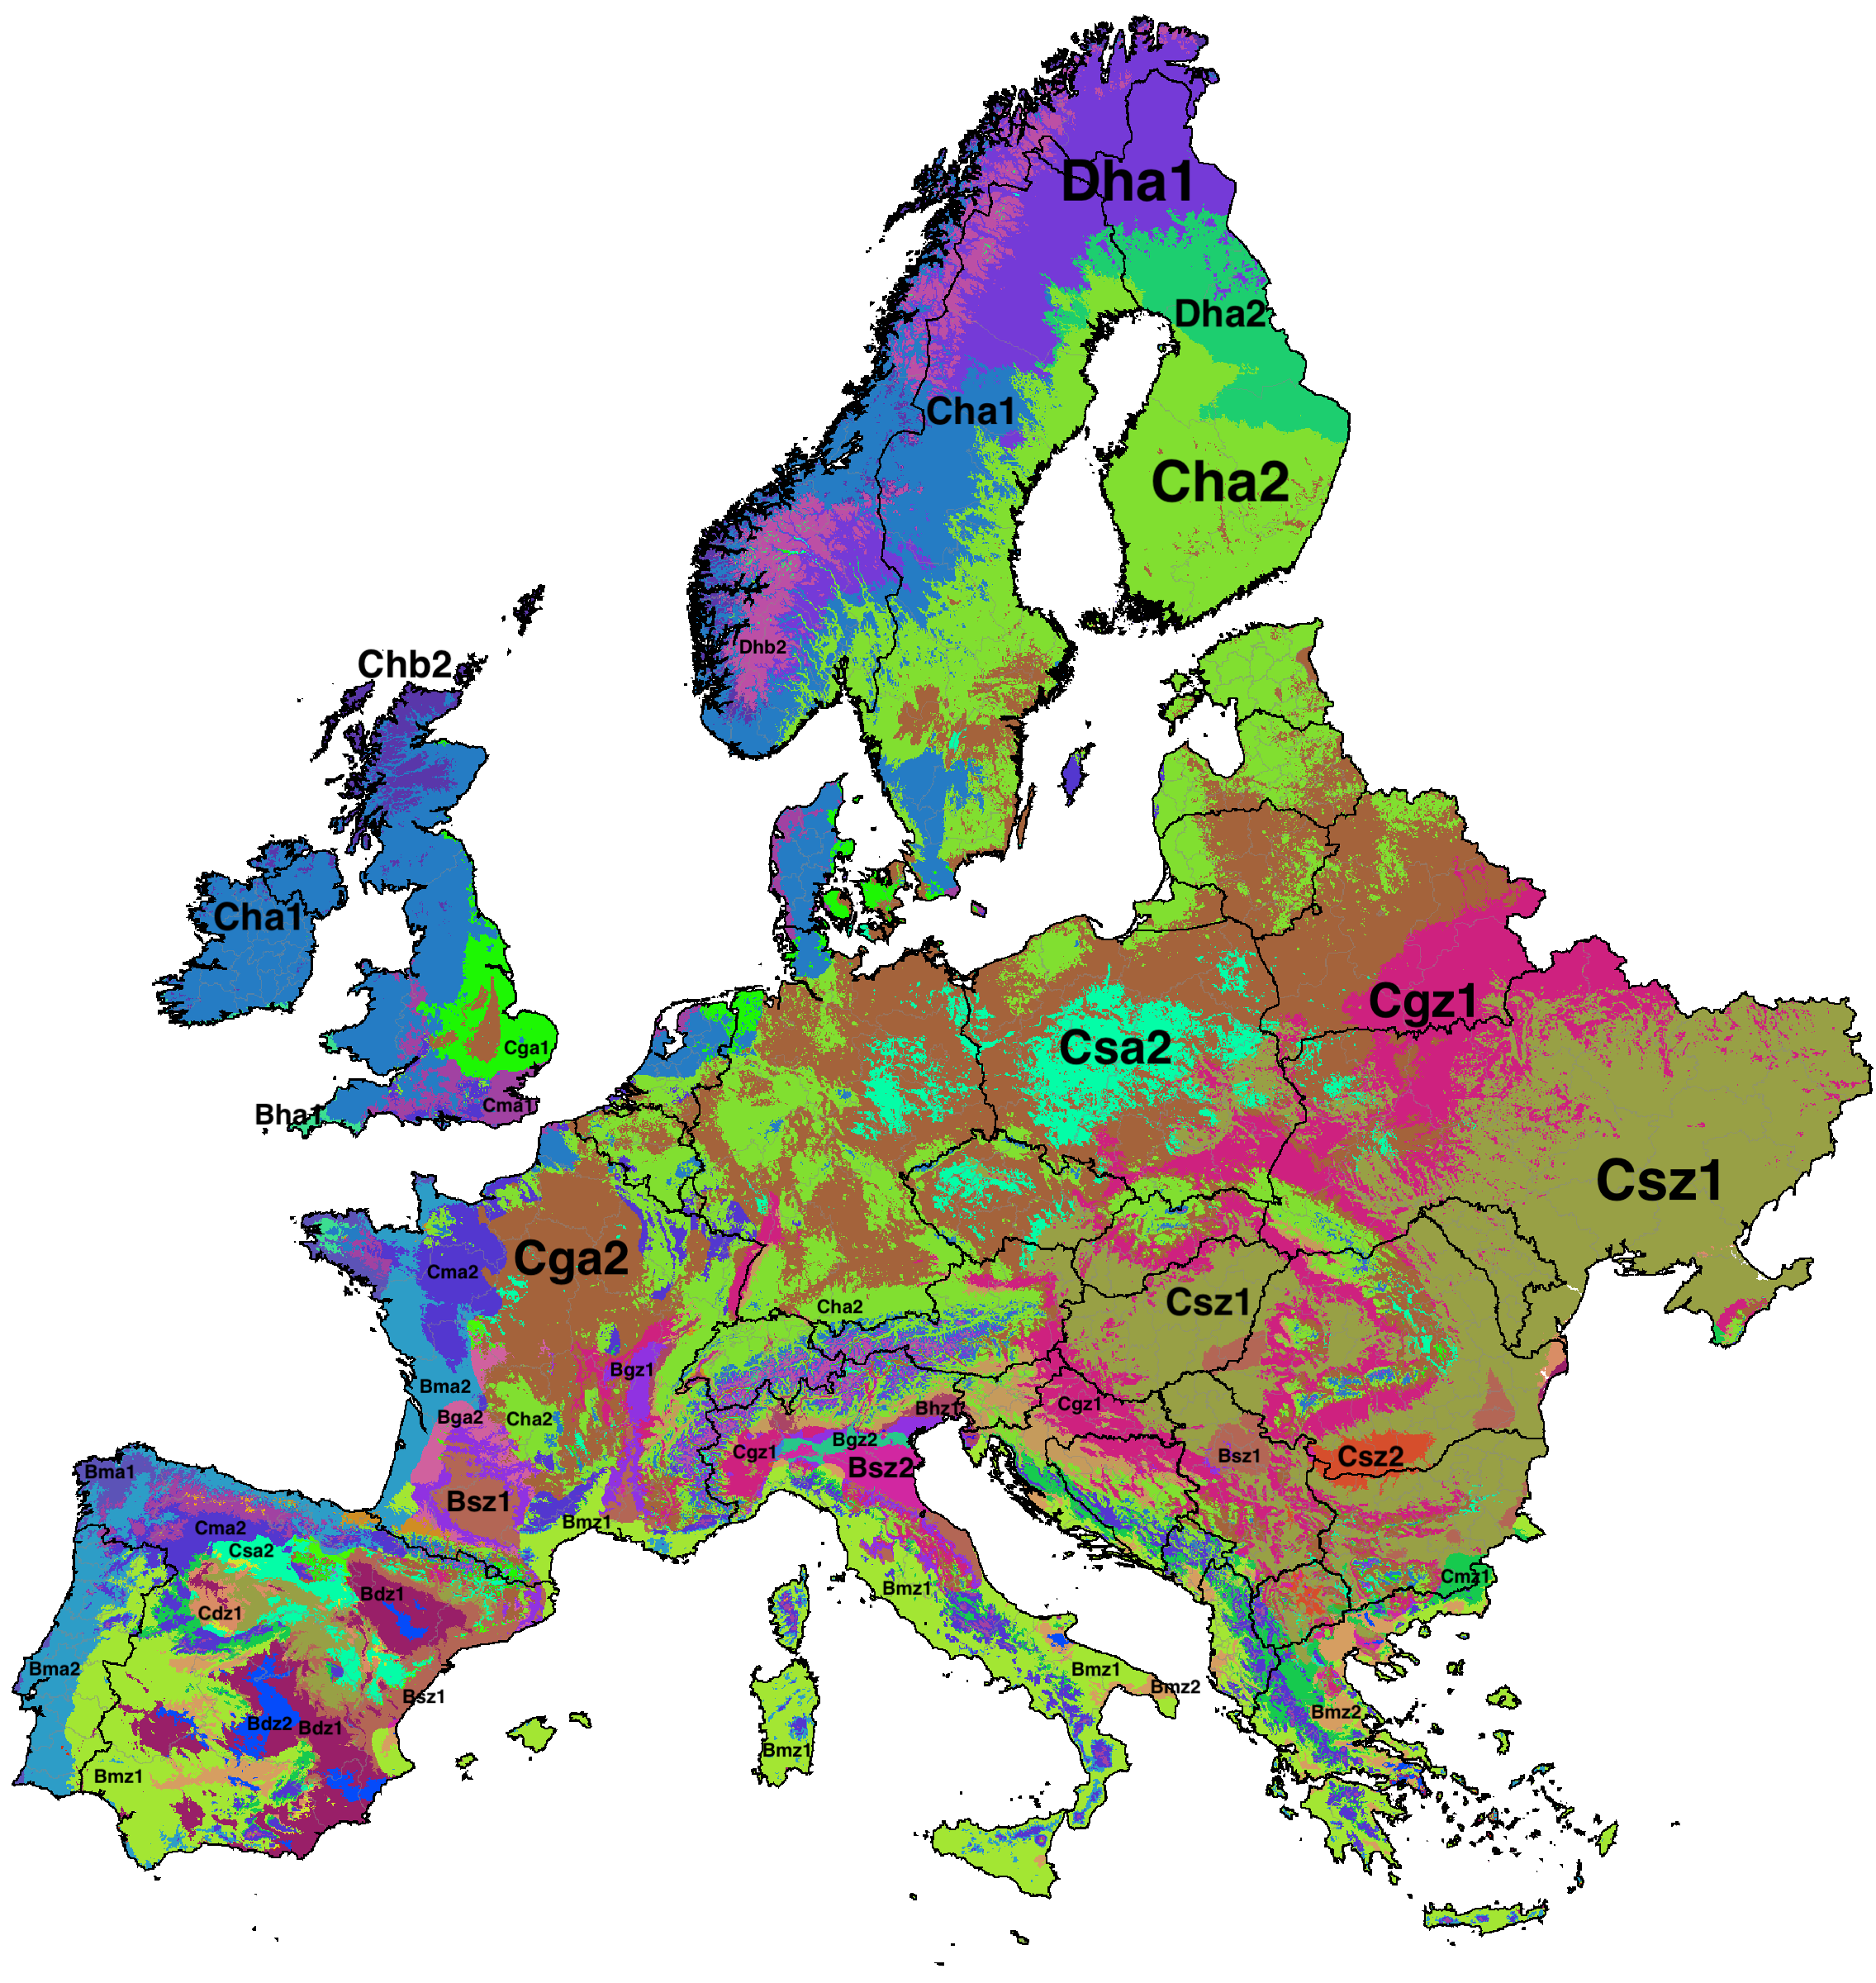
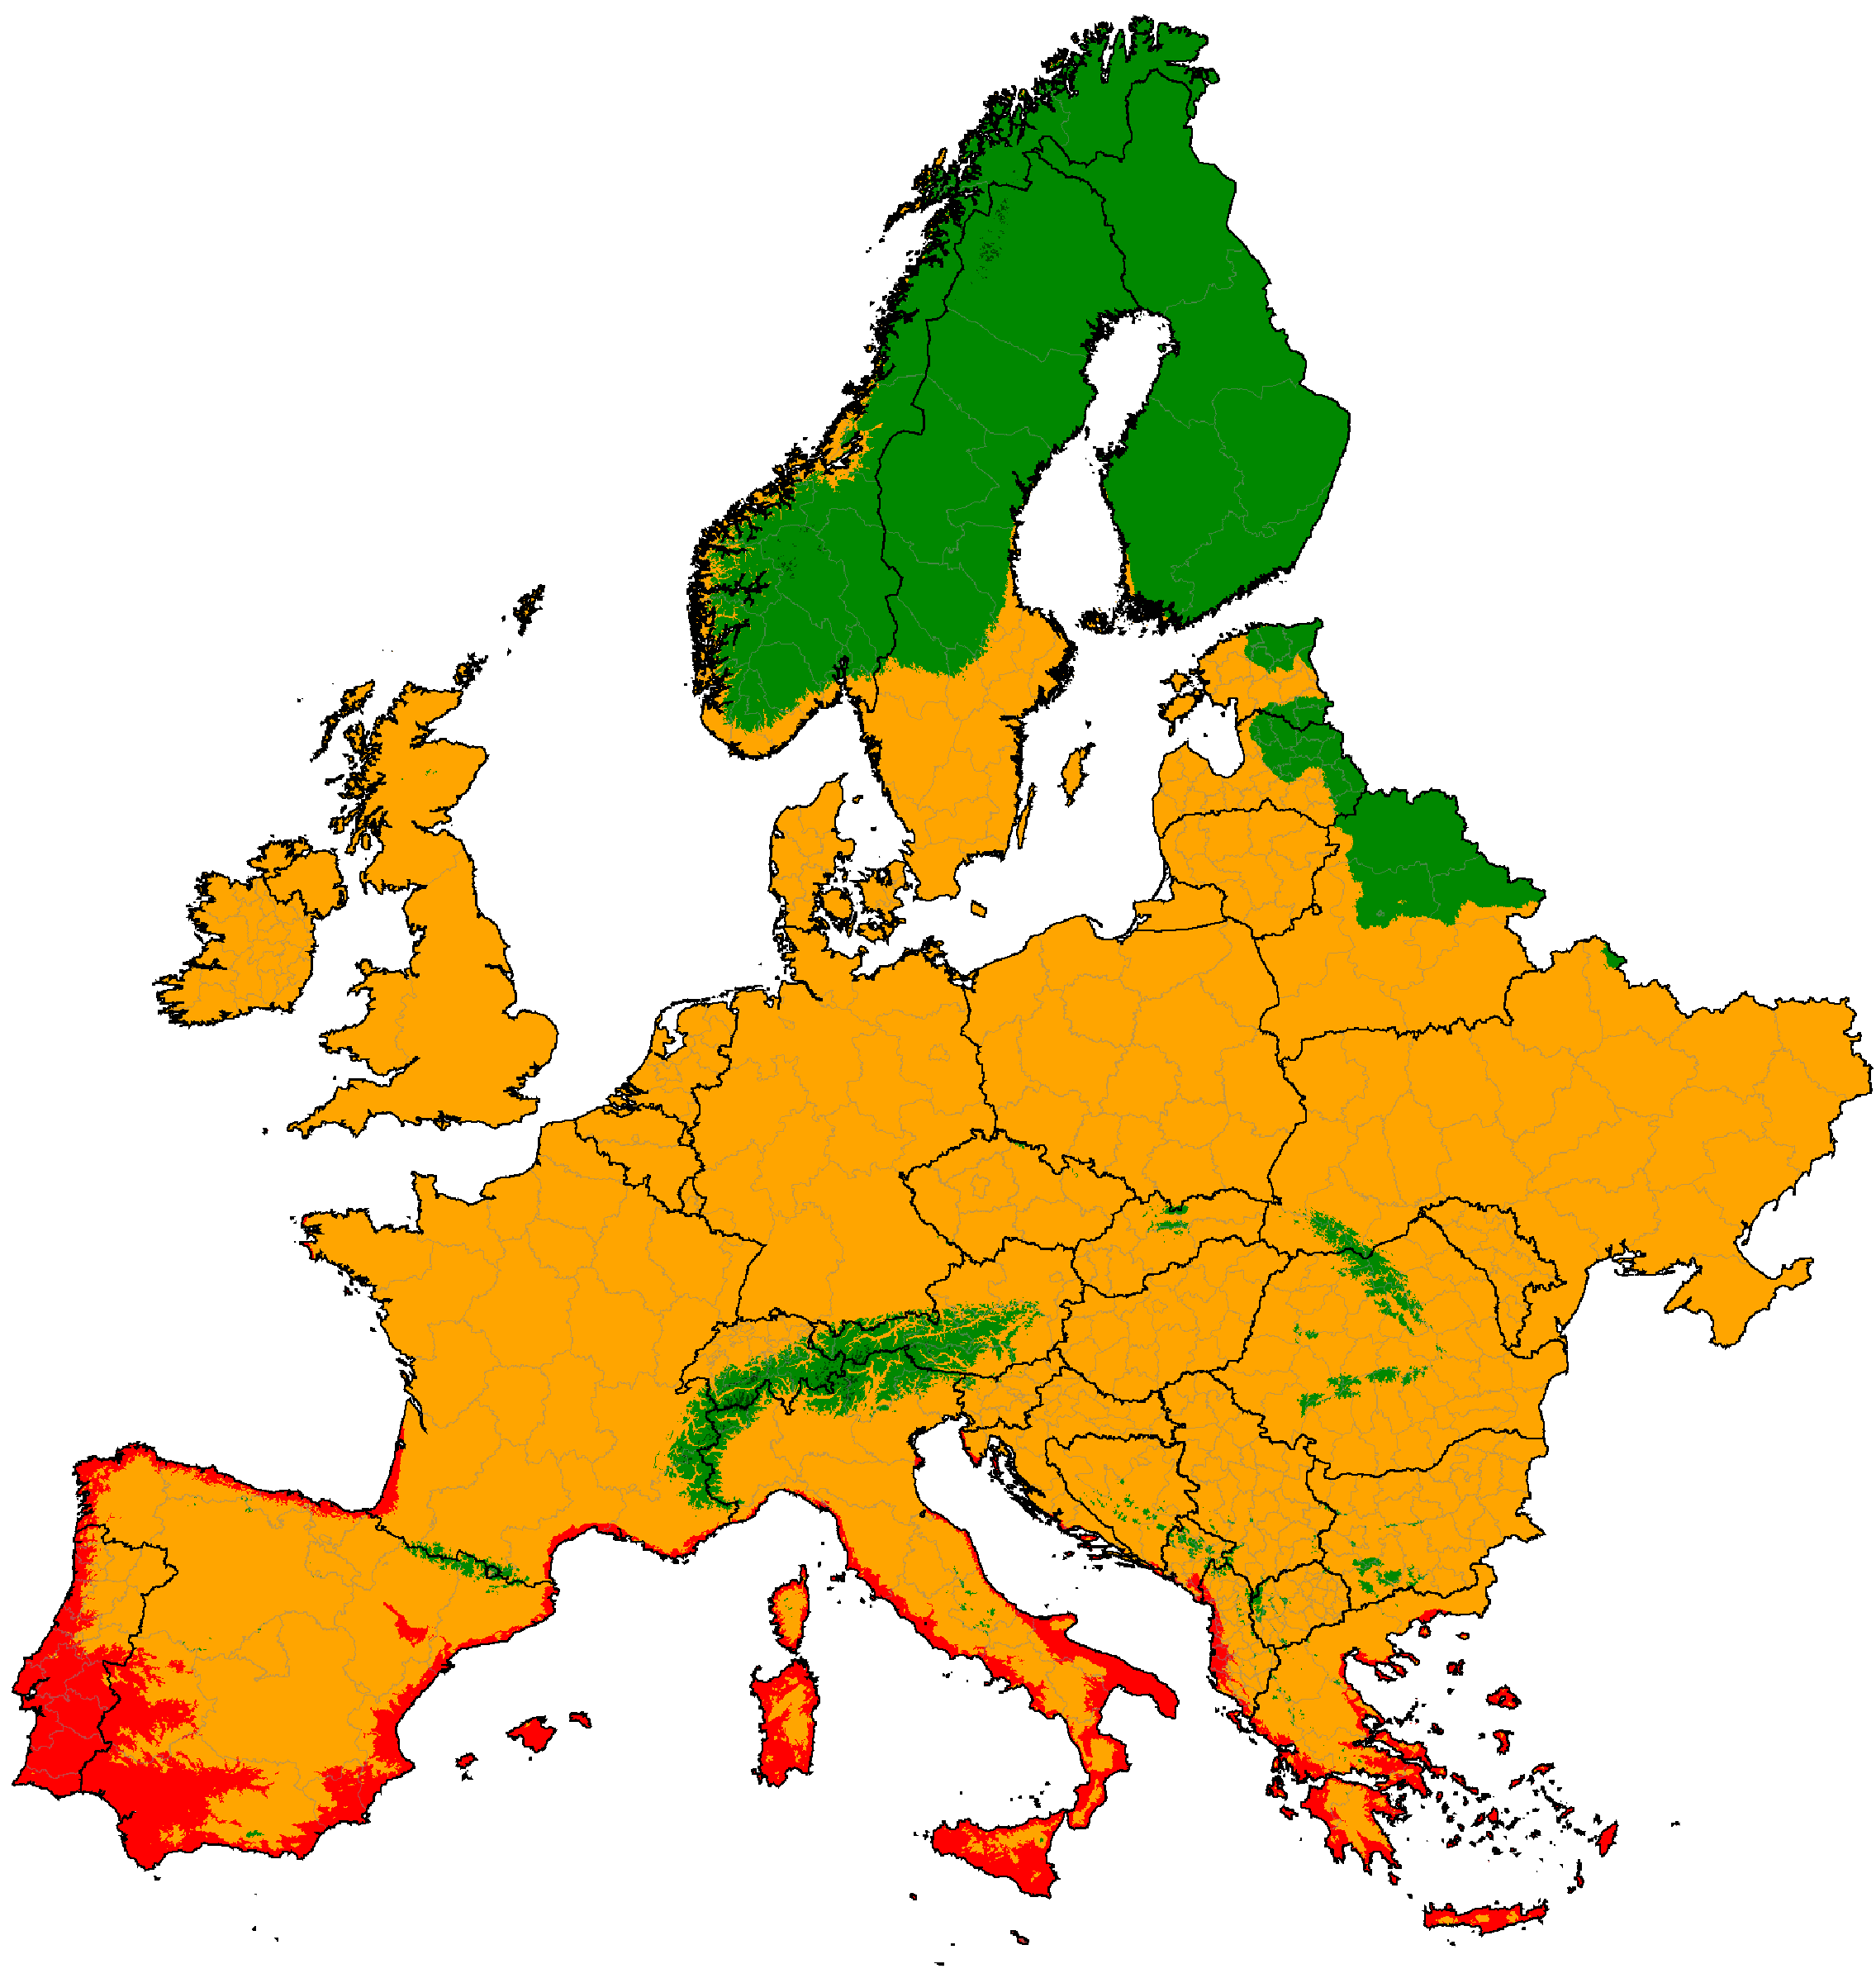
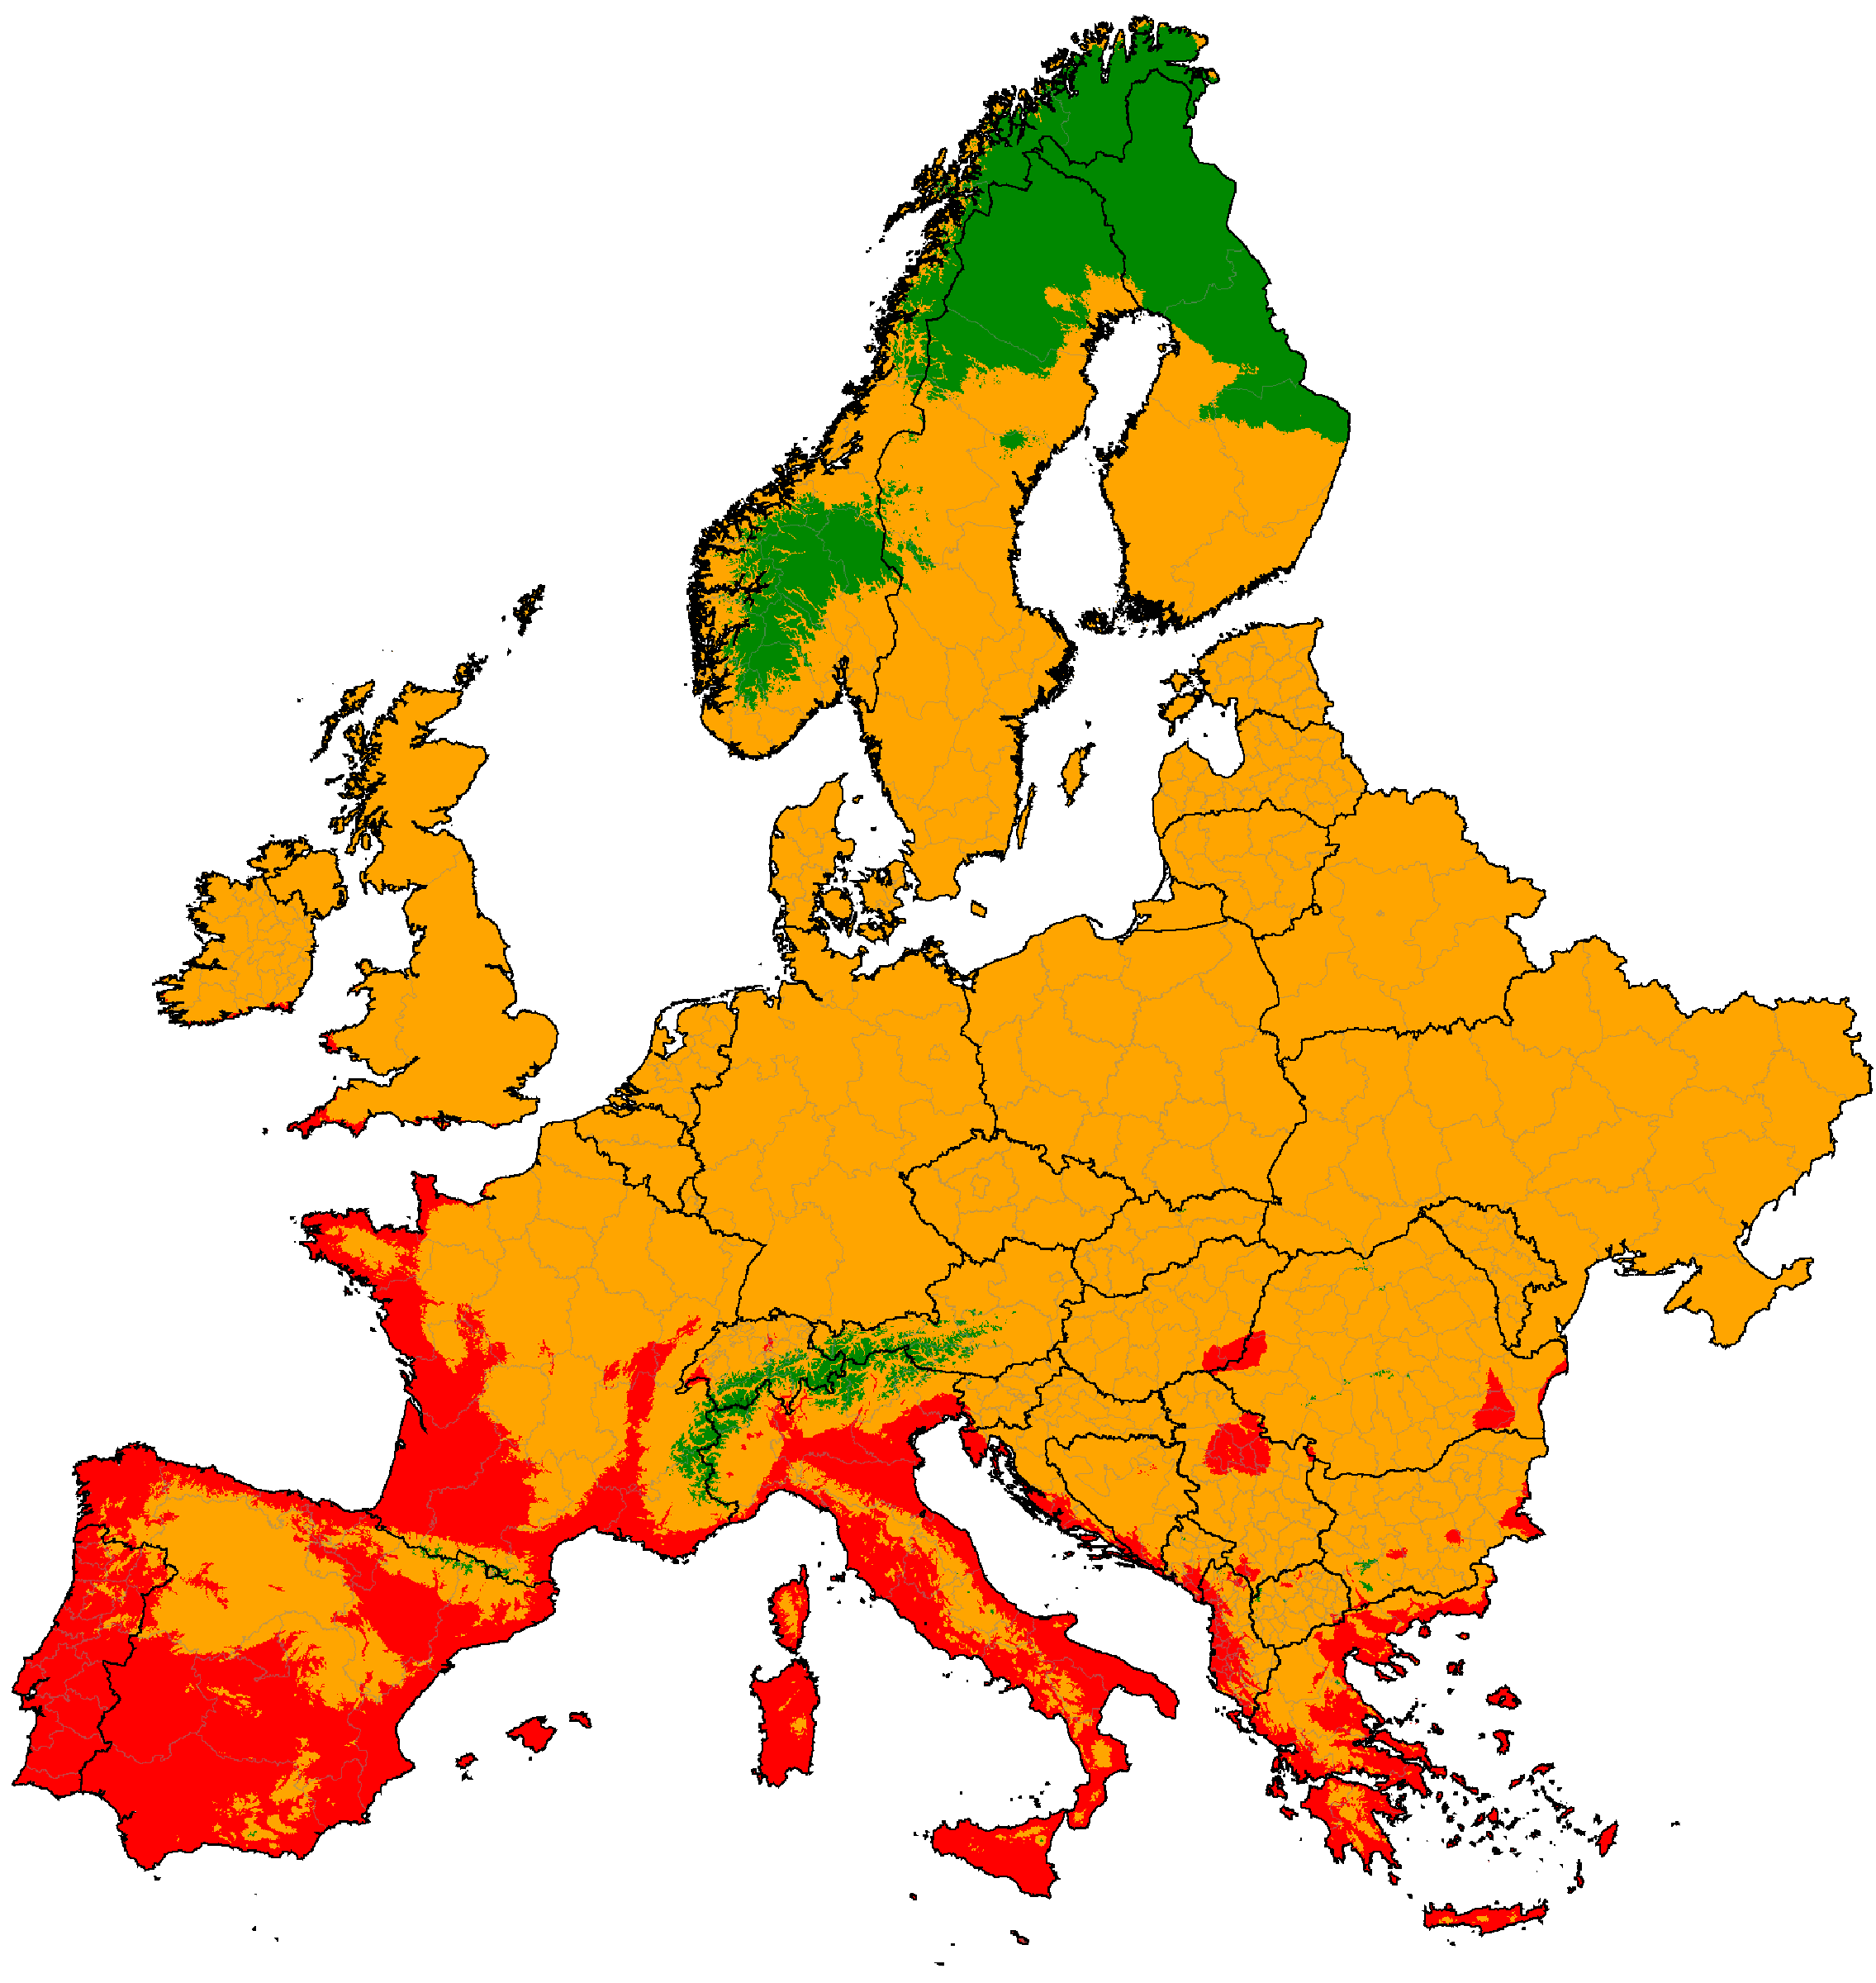
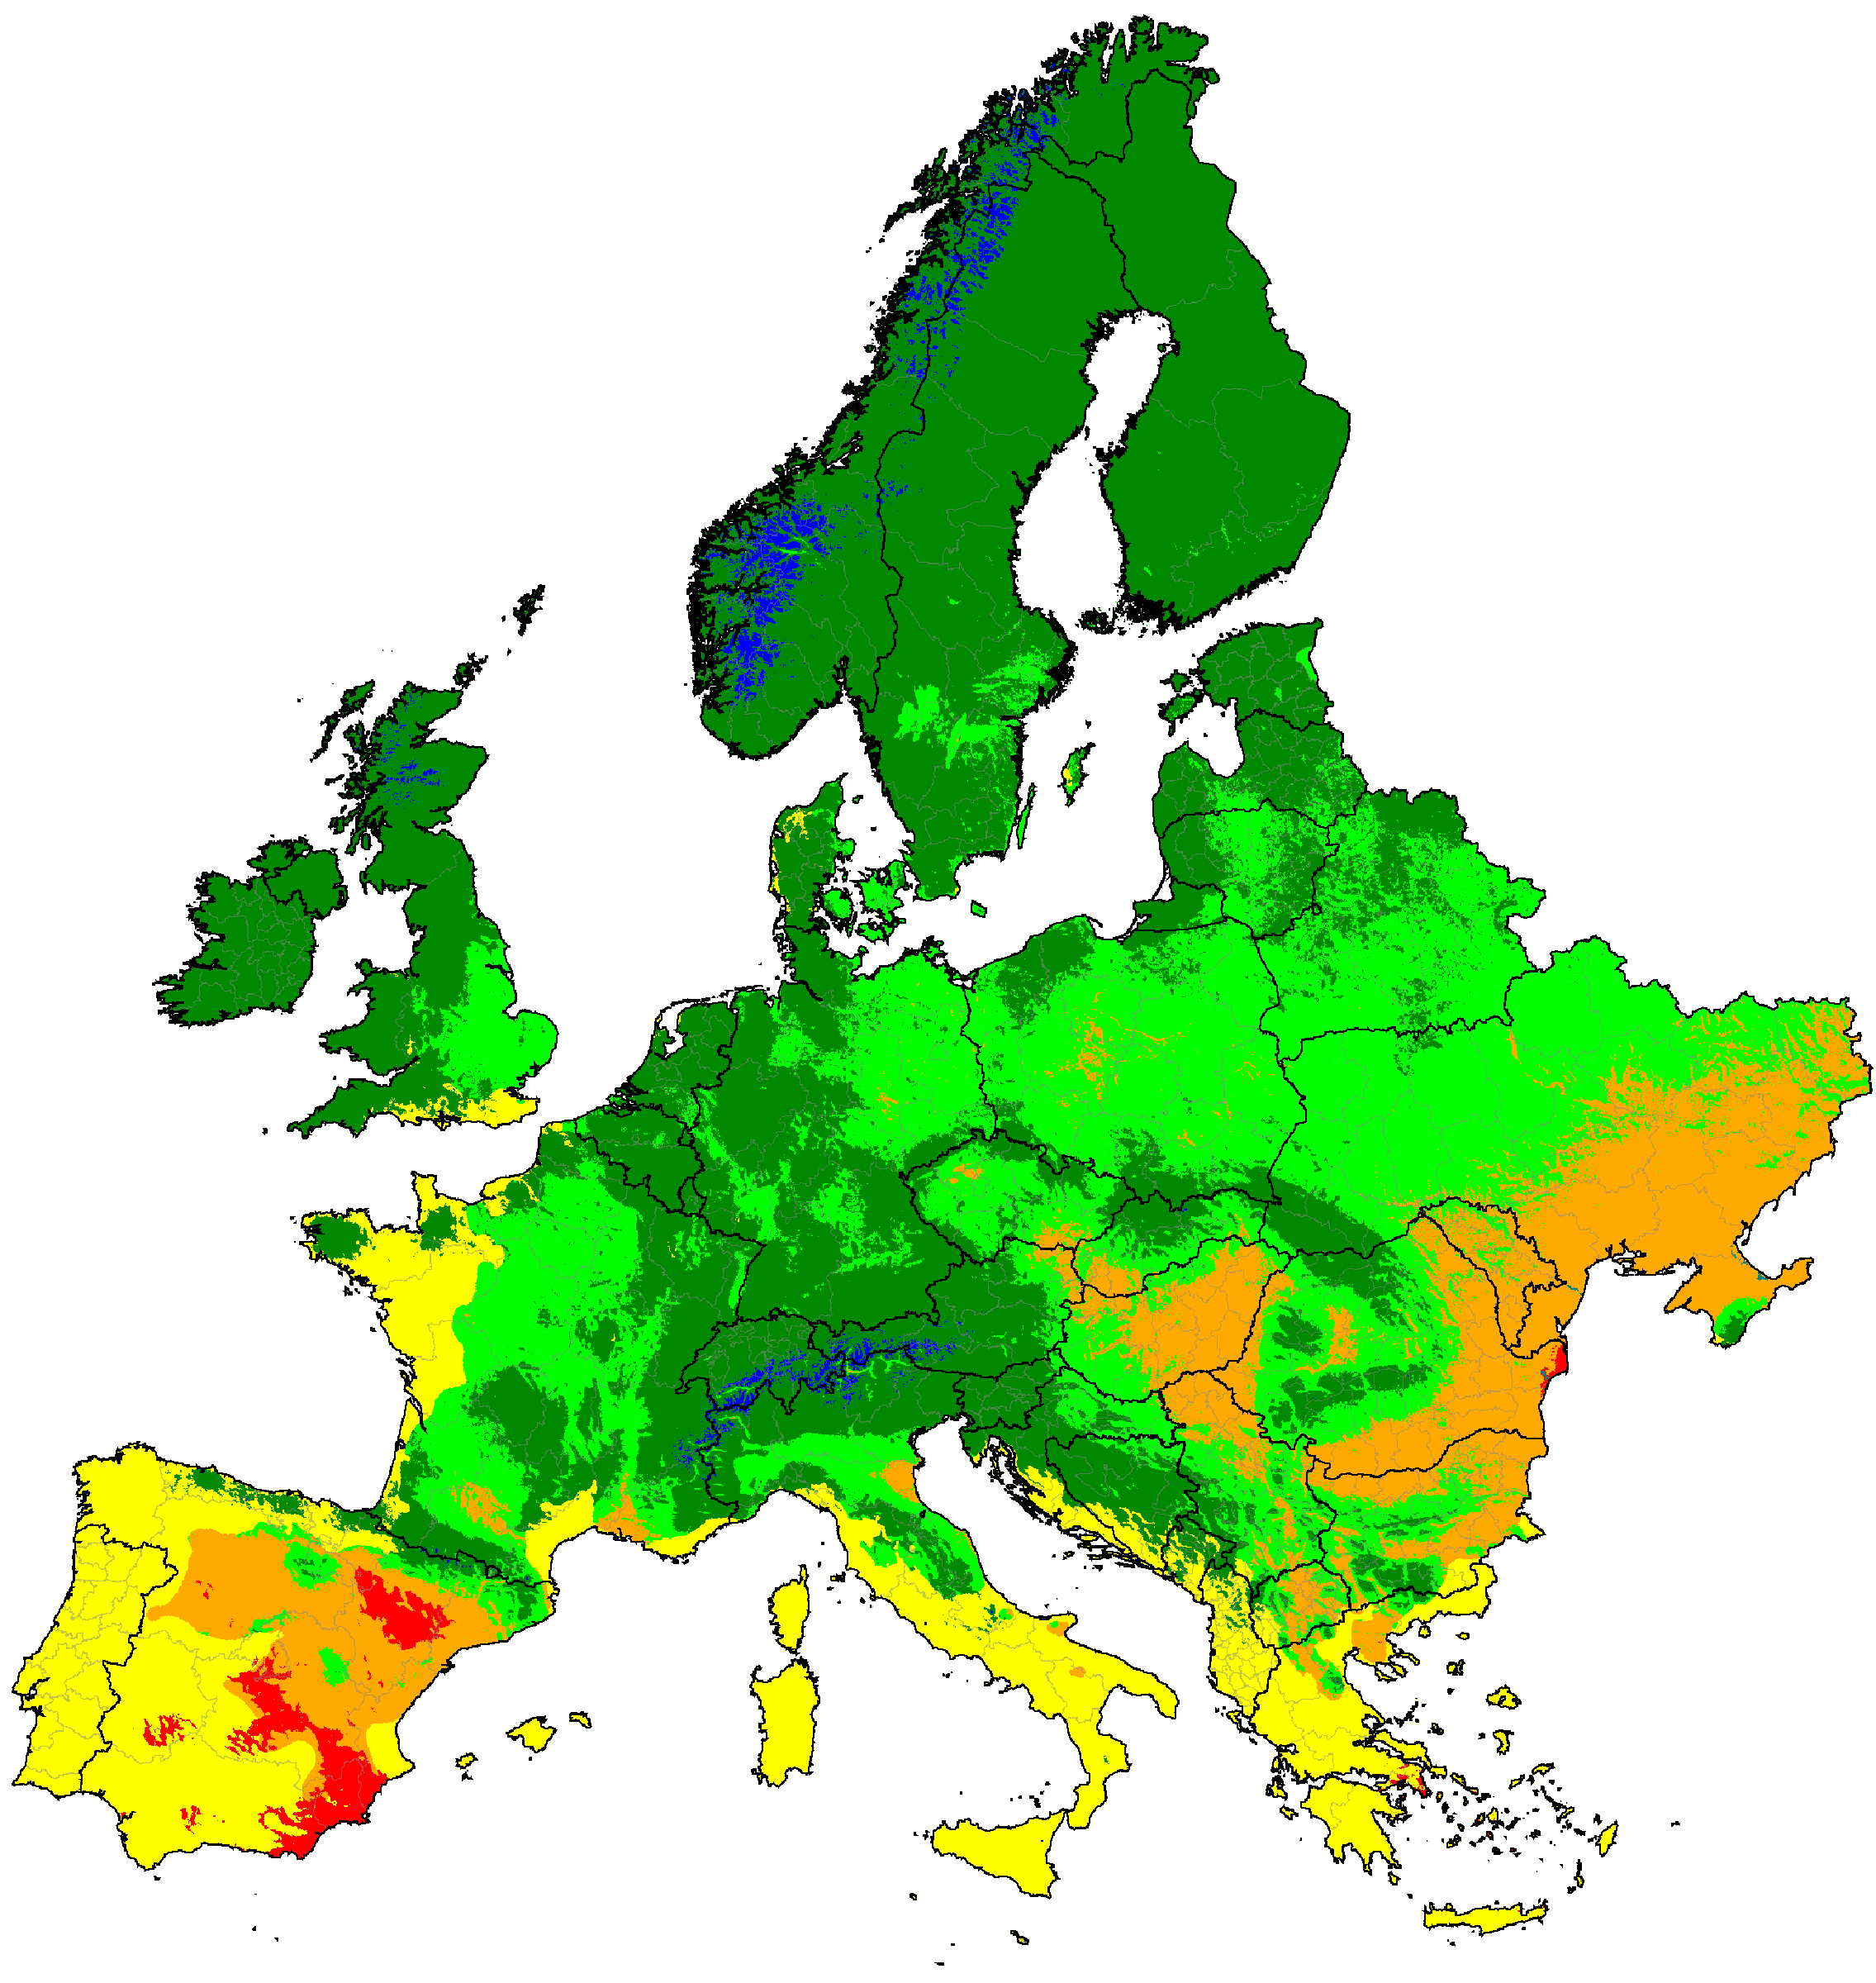
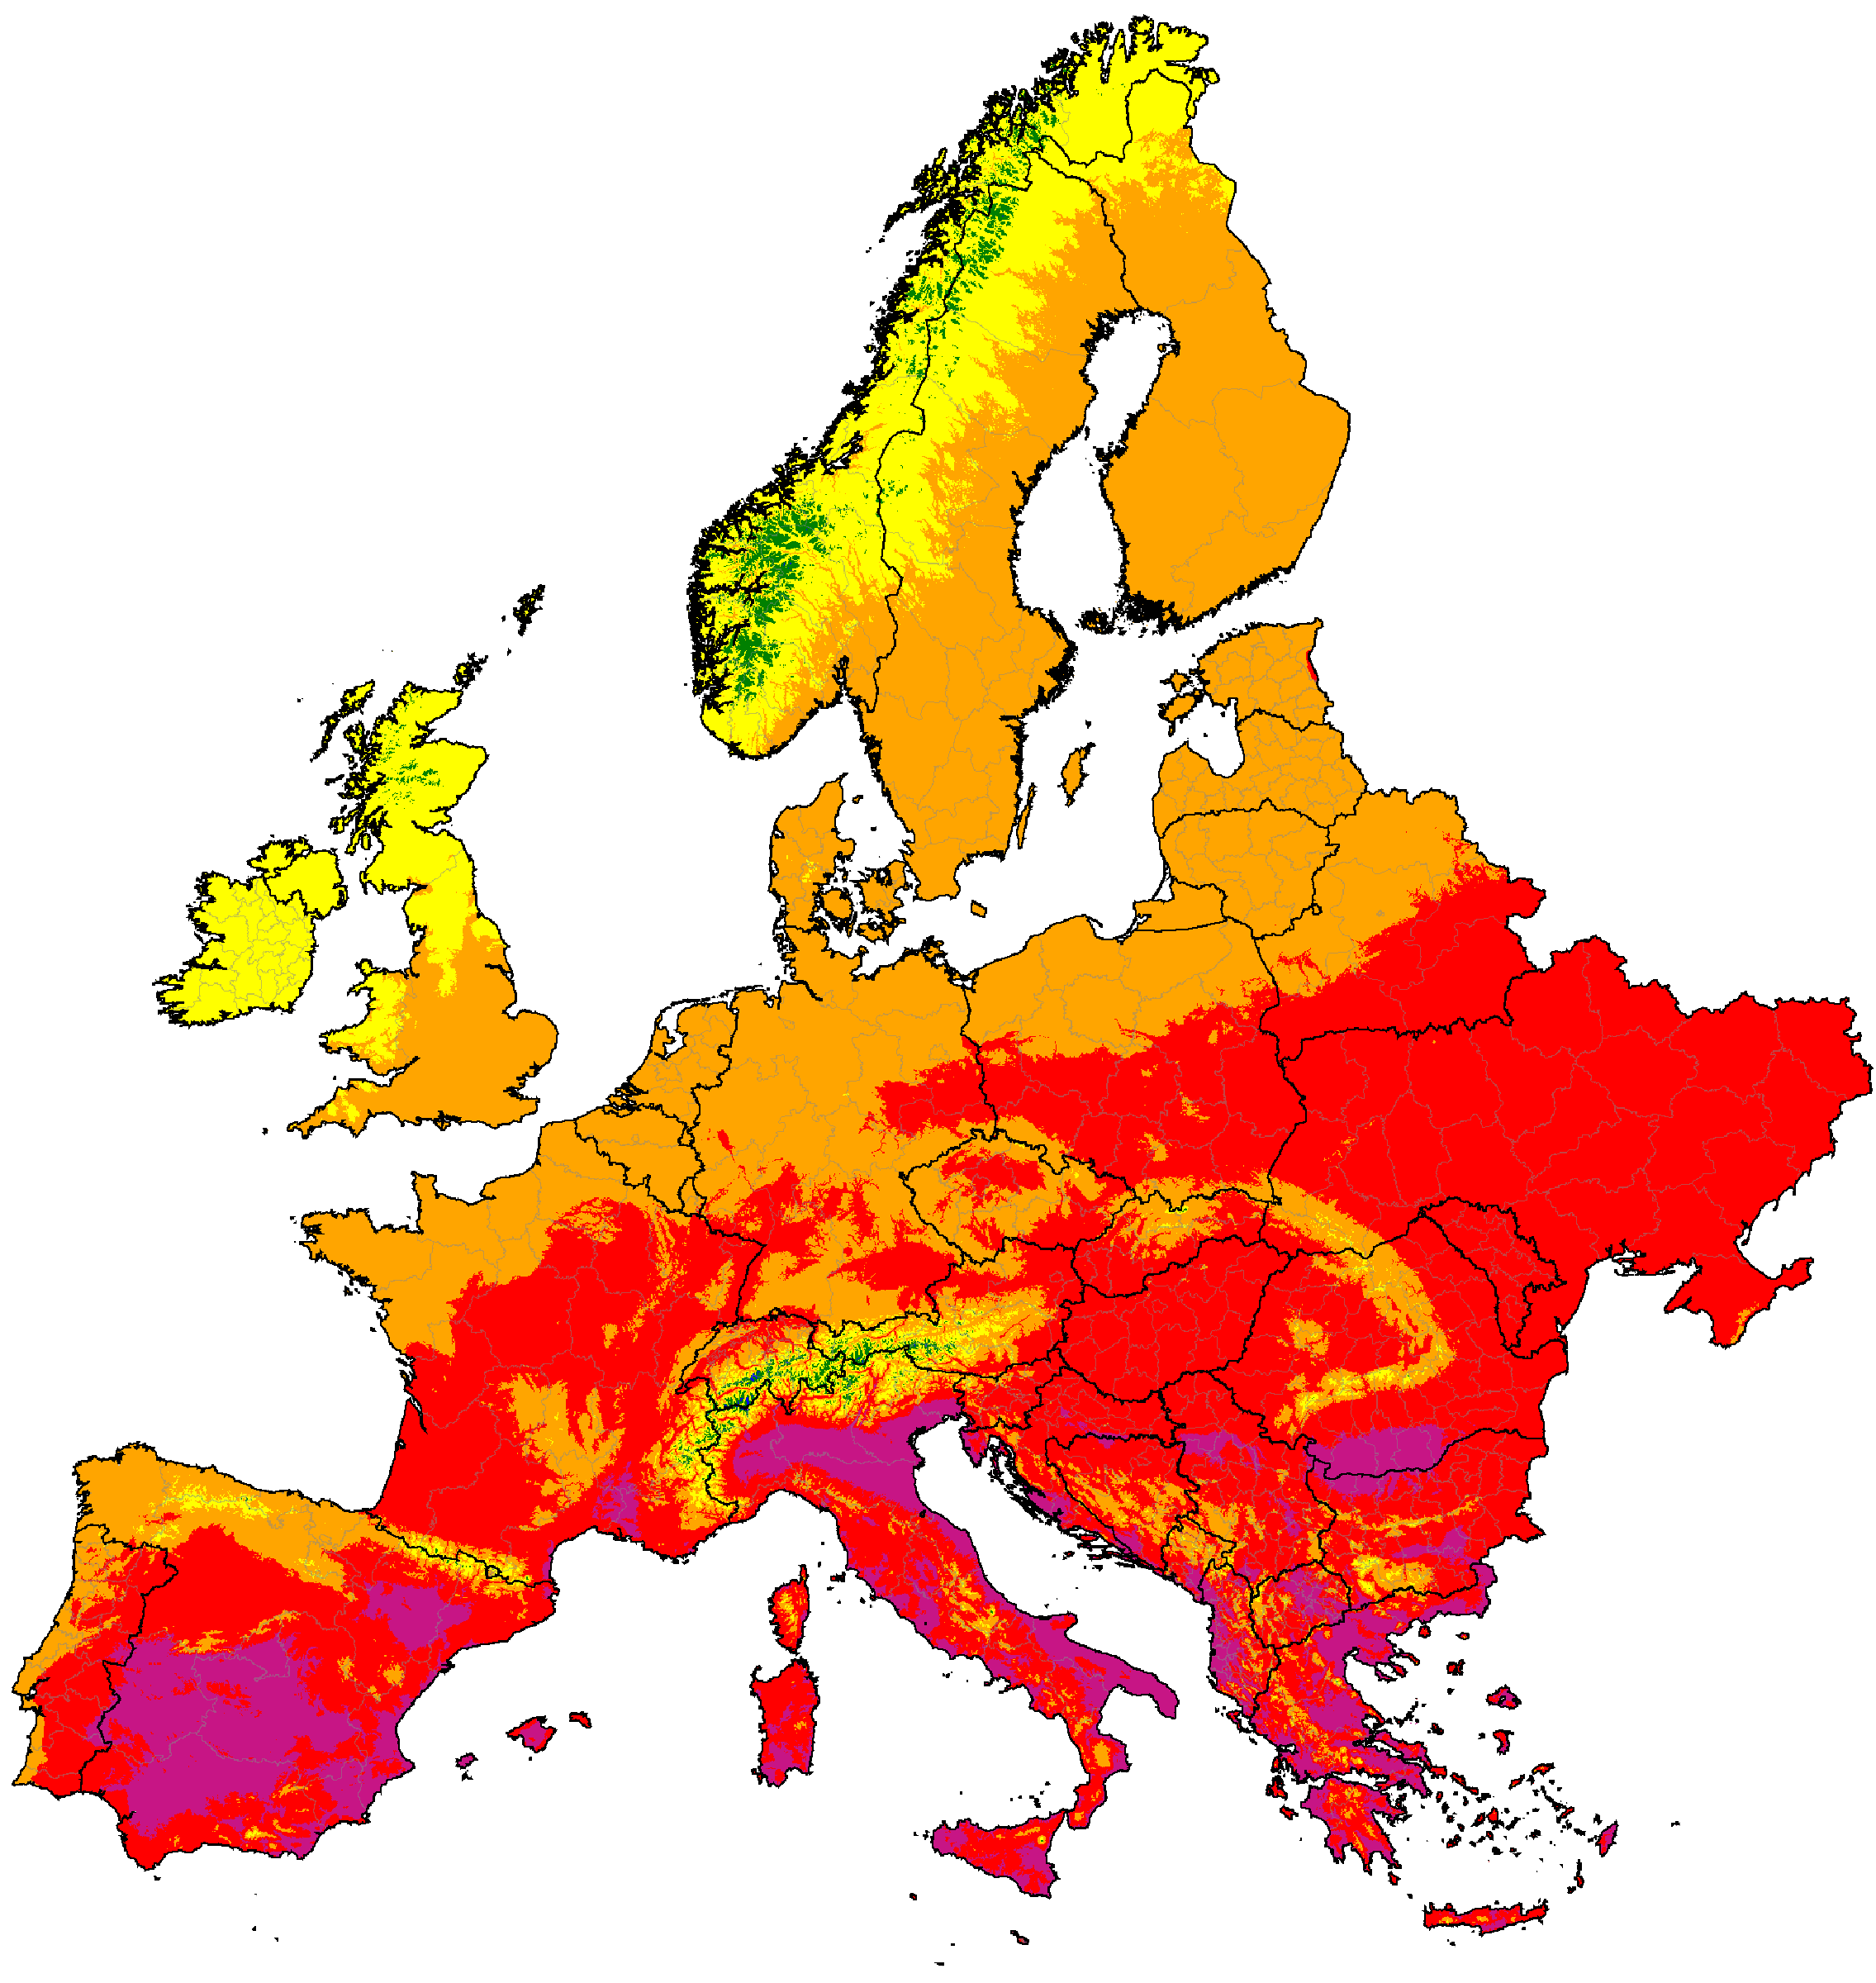
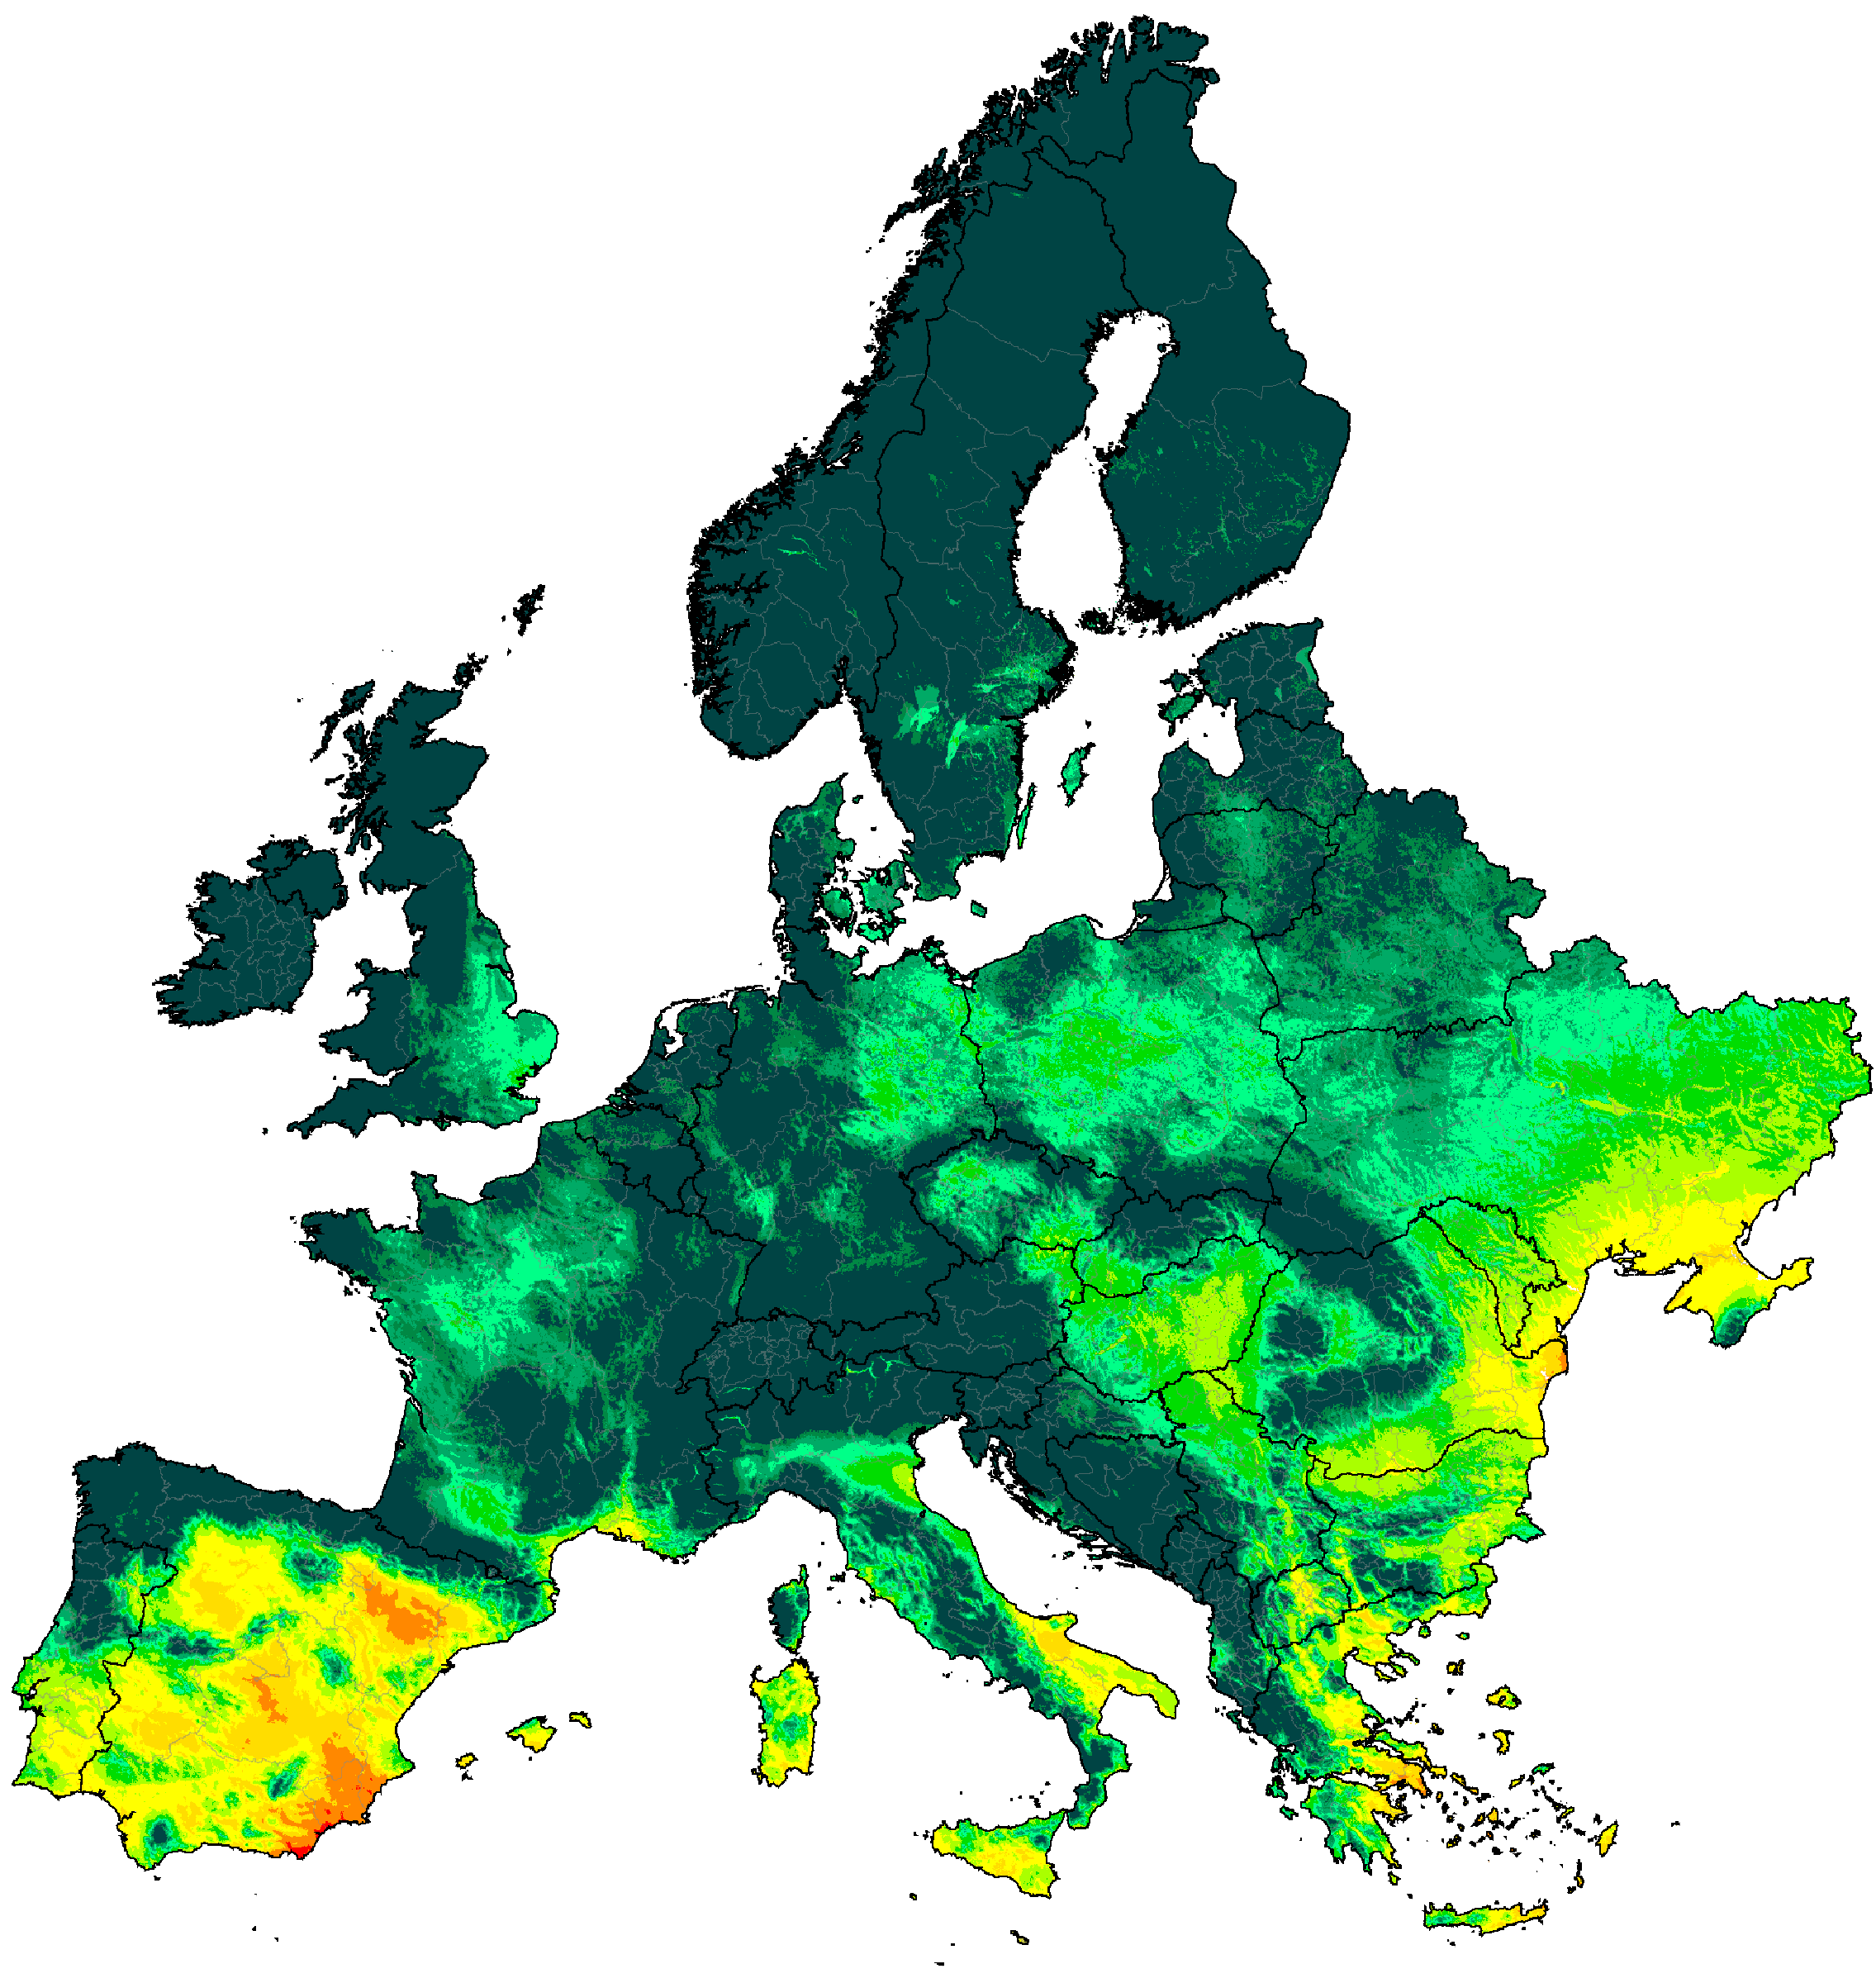
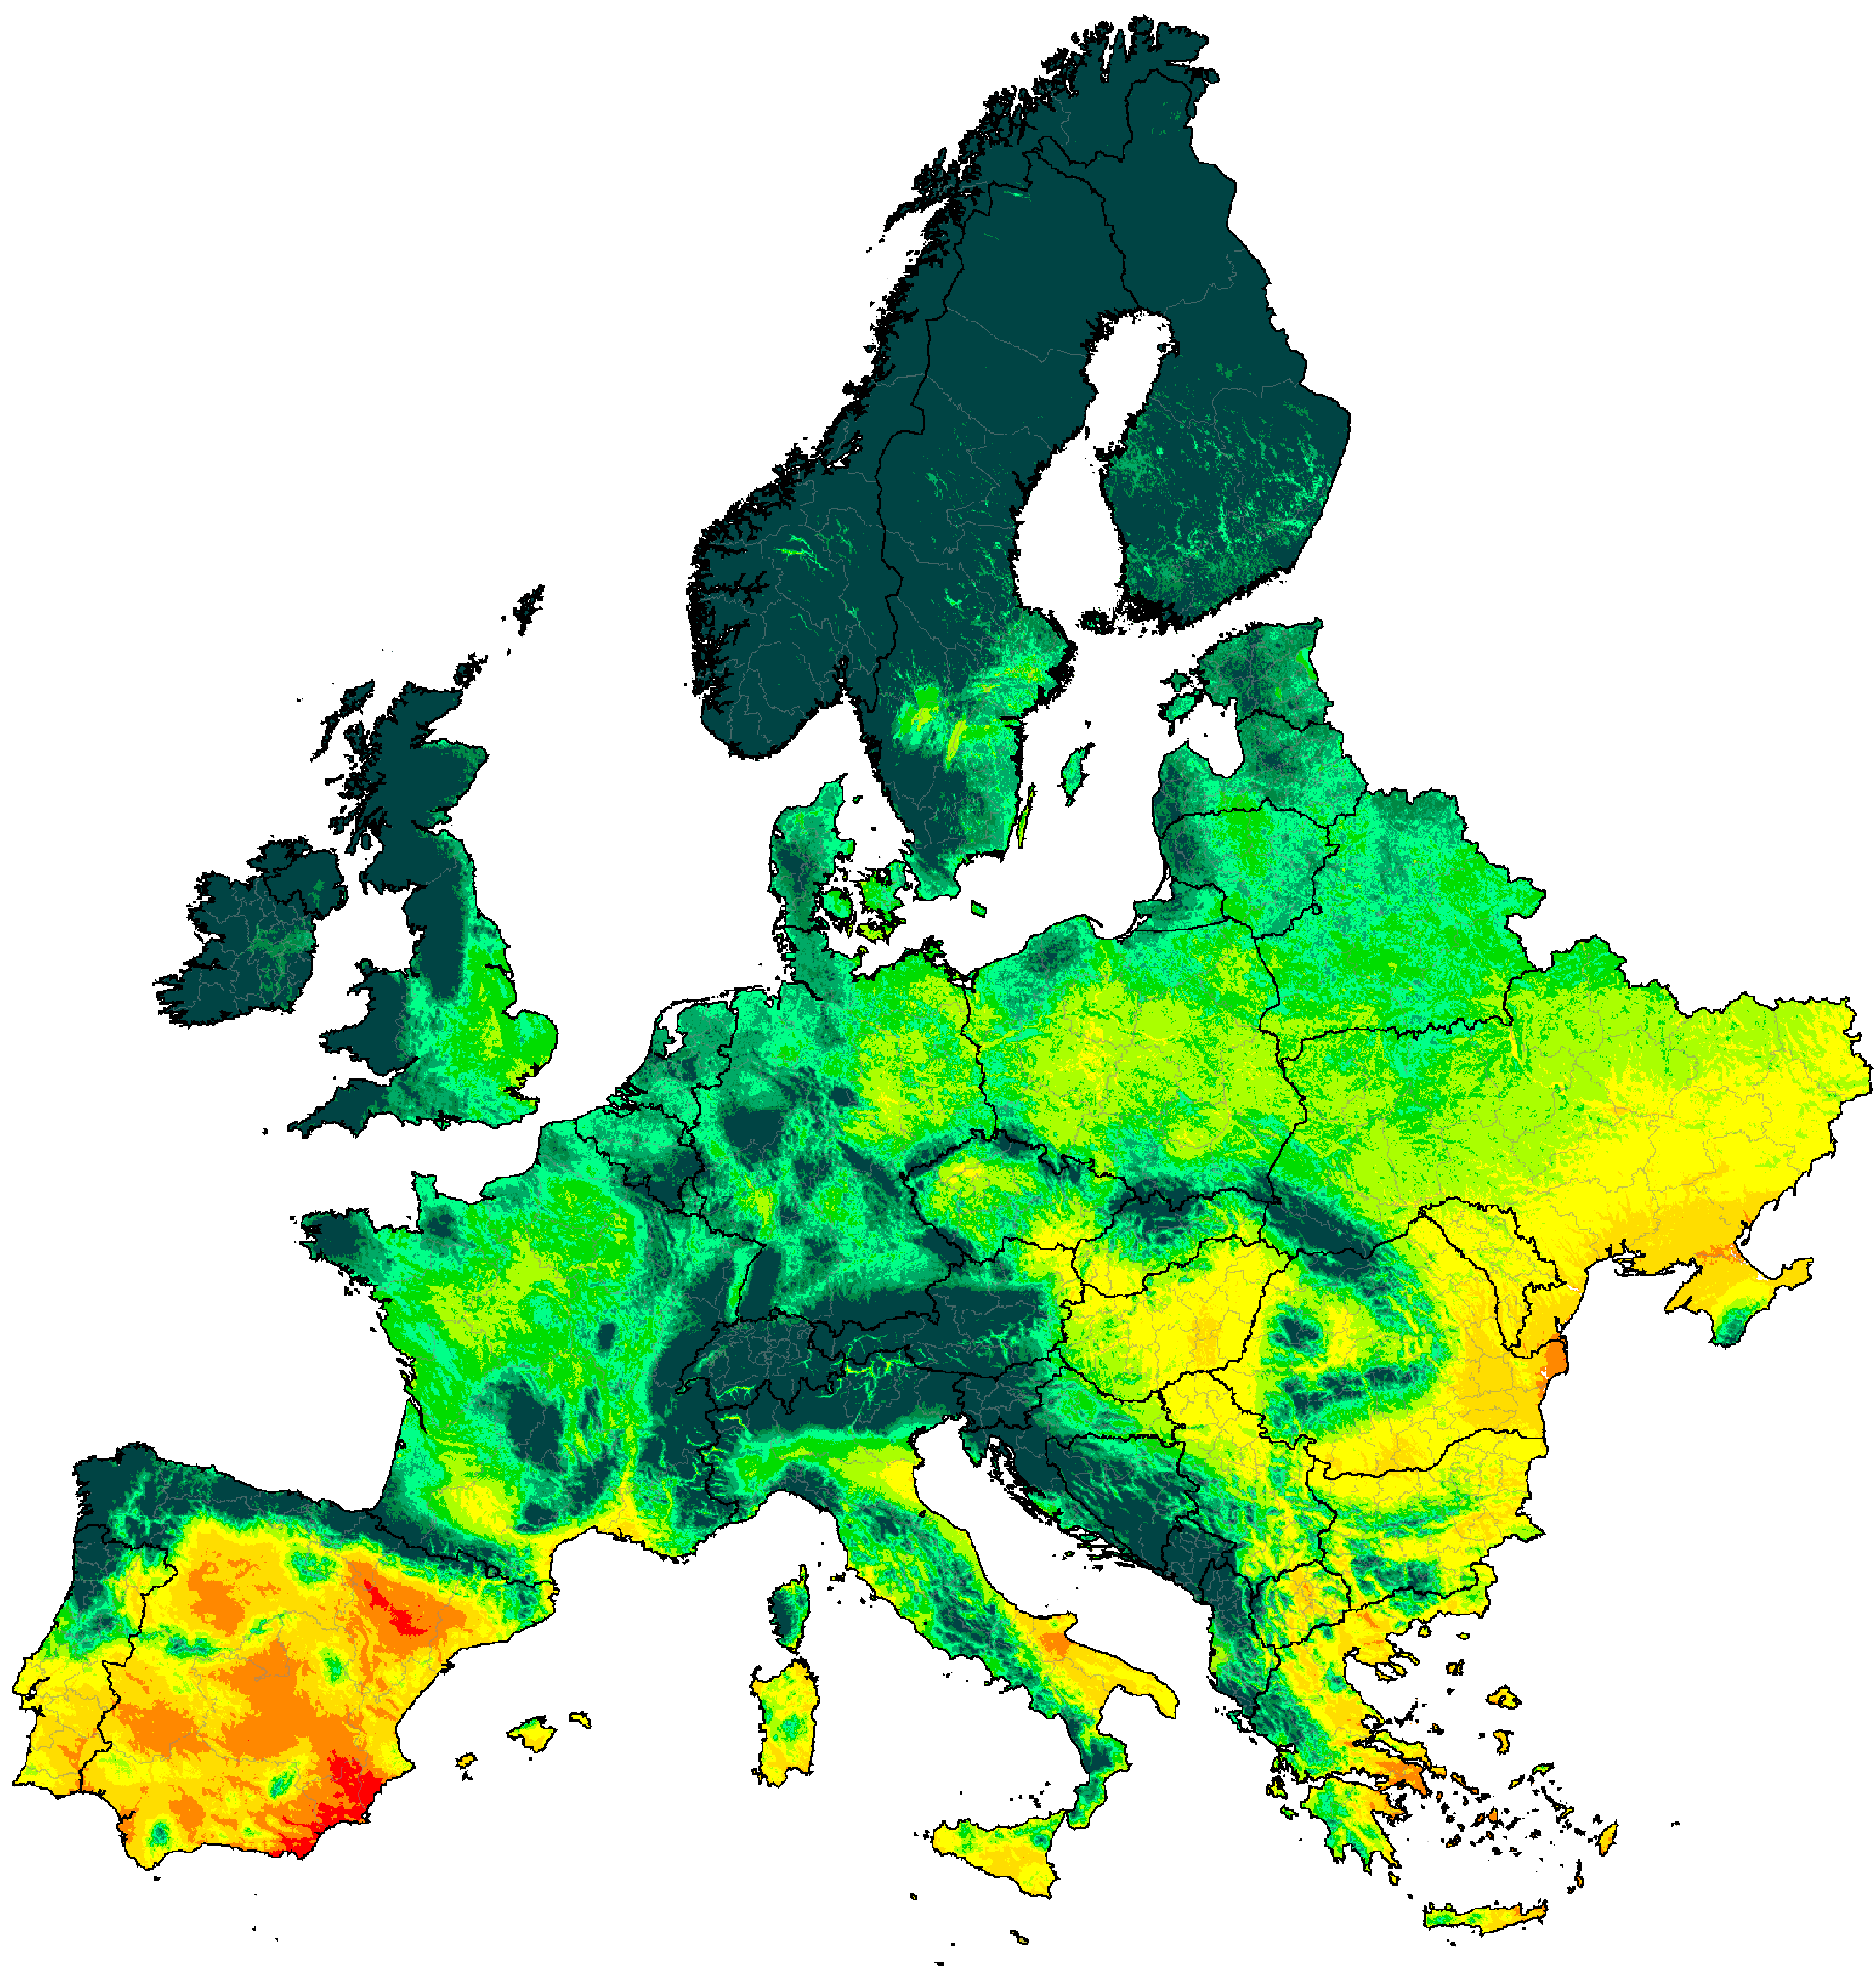
Europe distribution of aridity categories (projections are SSP5-8.5 high emissions normals)
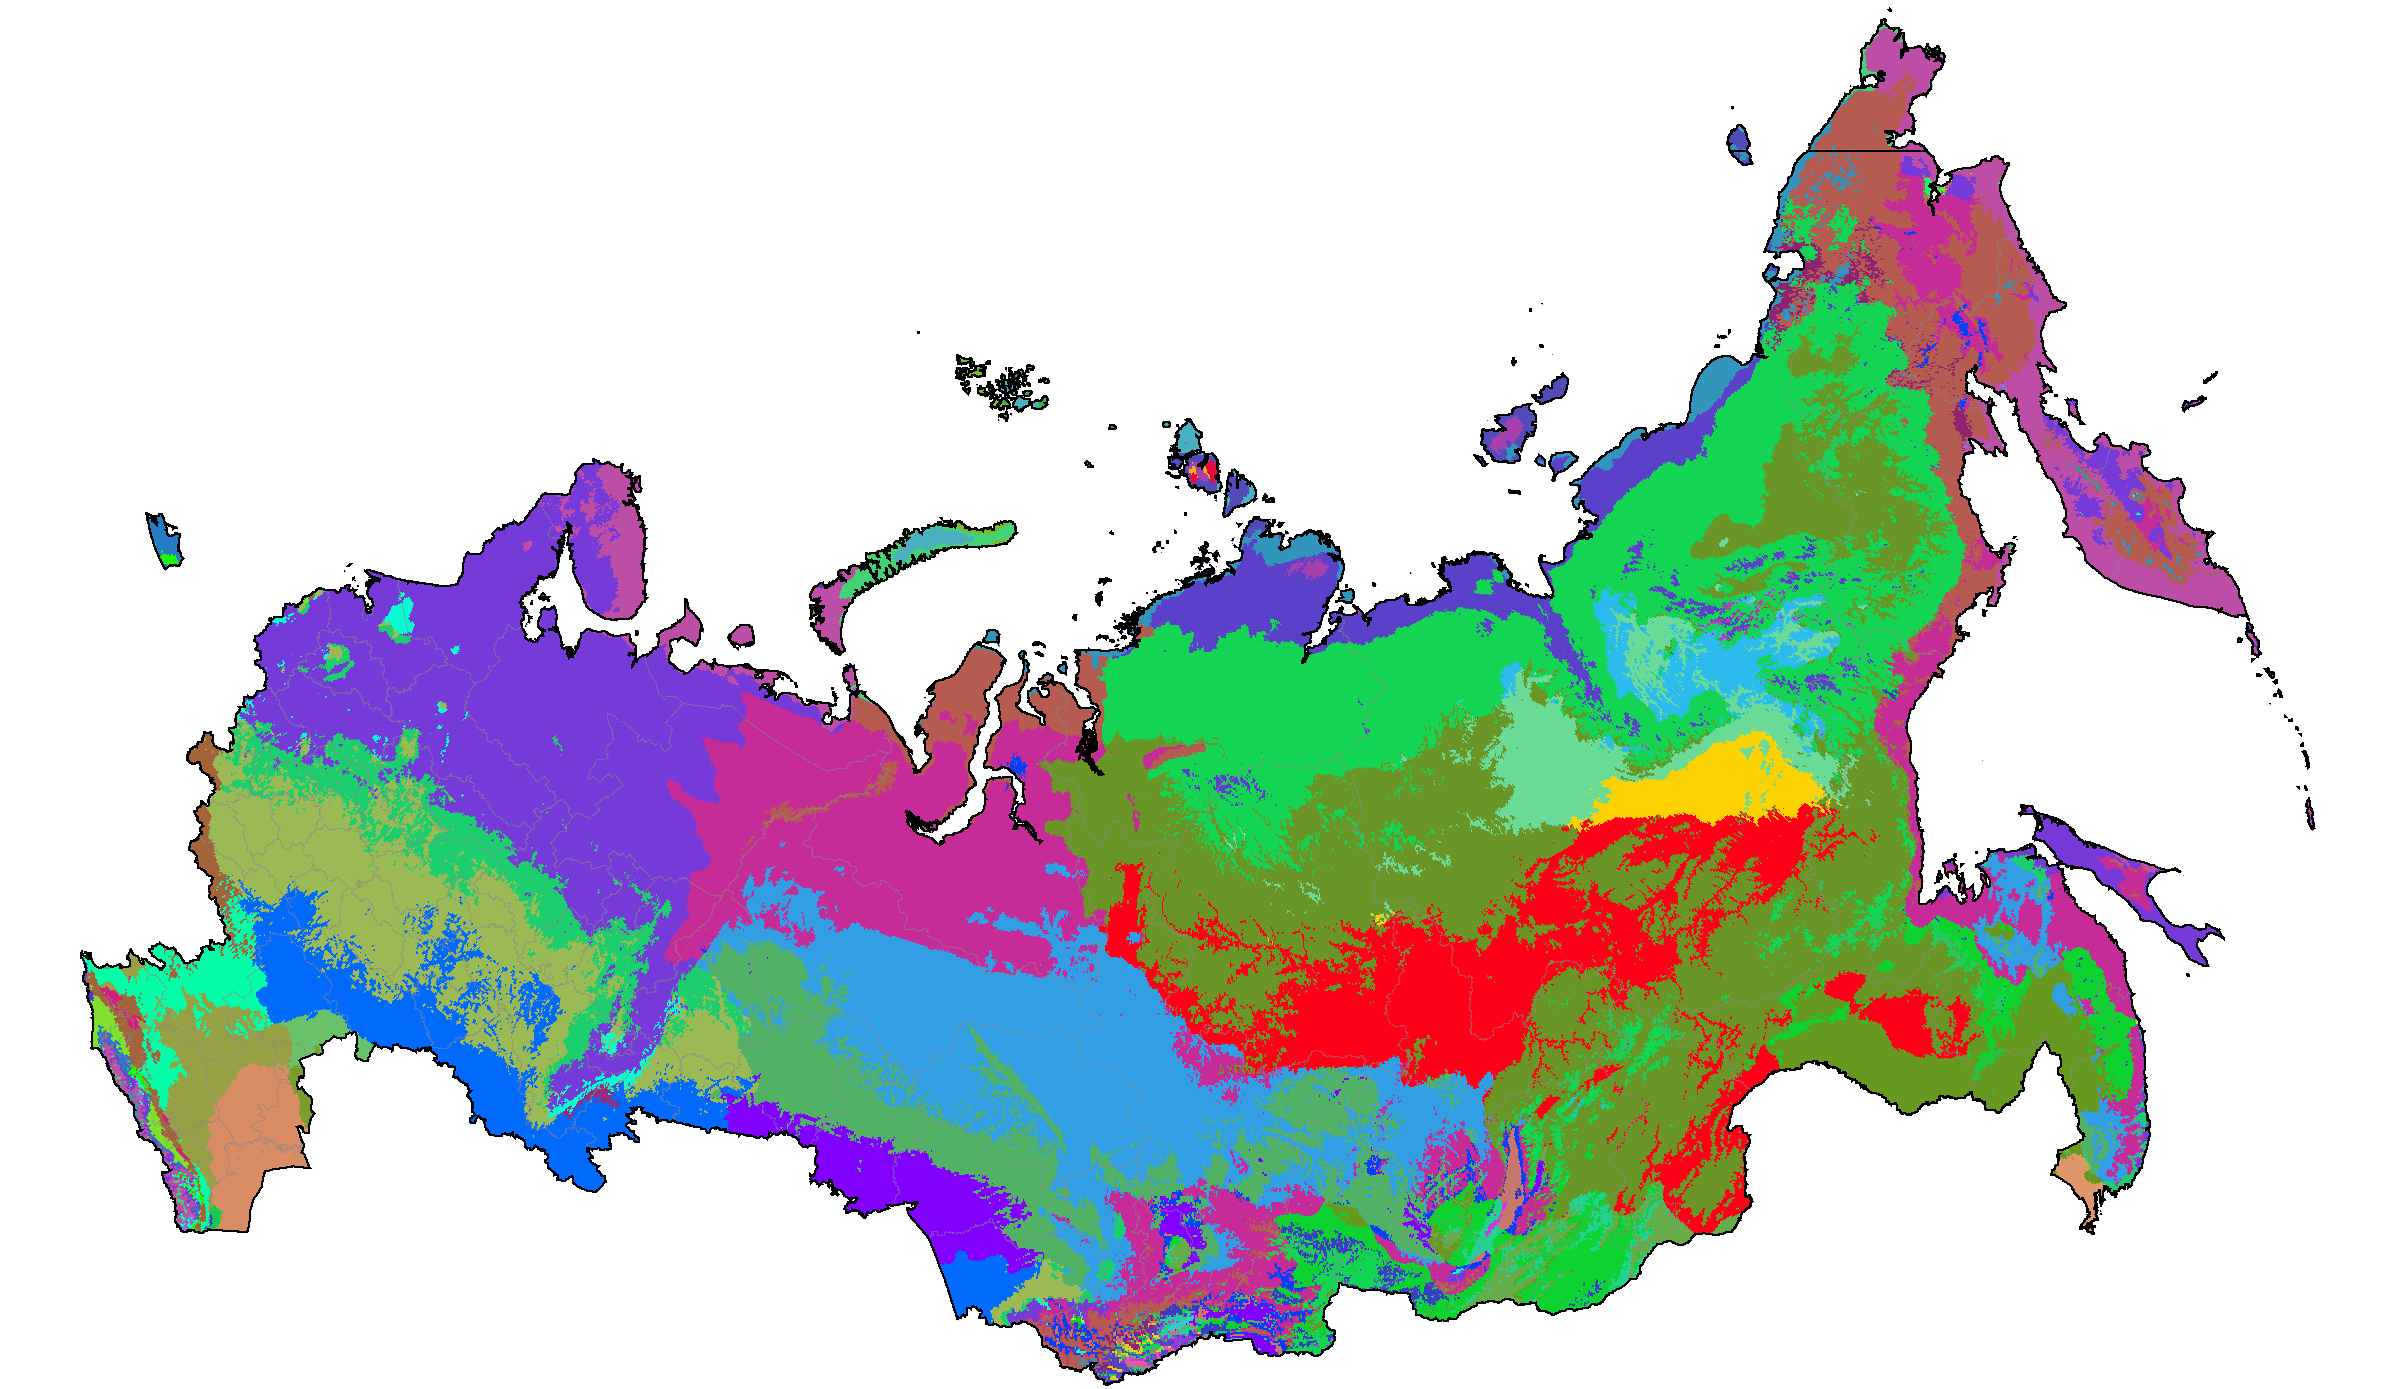
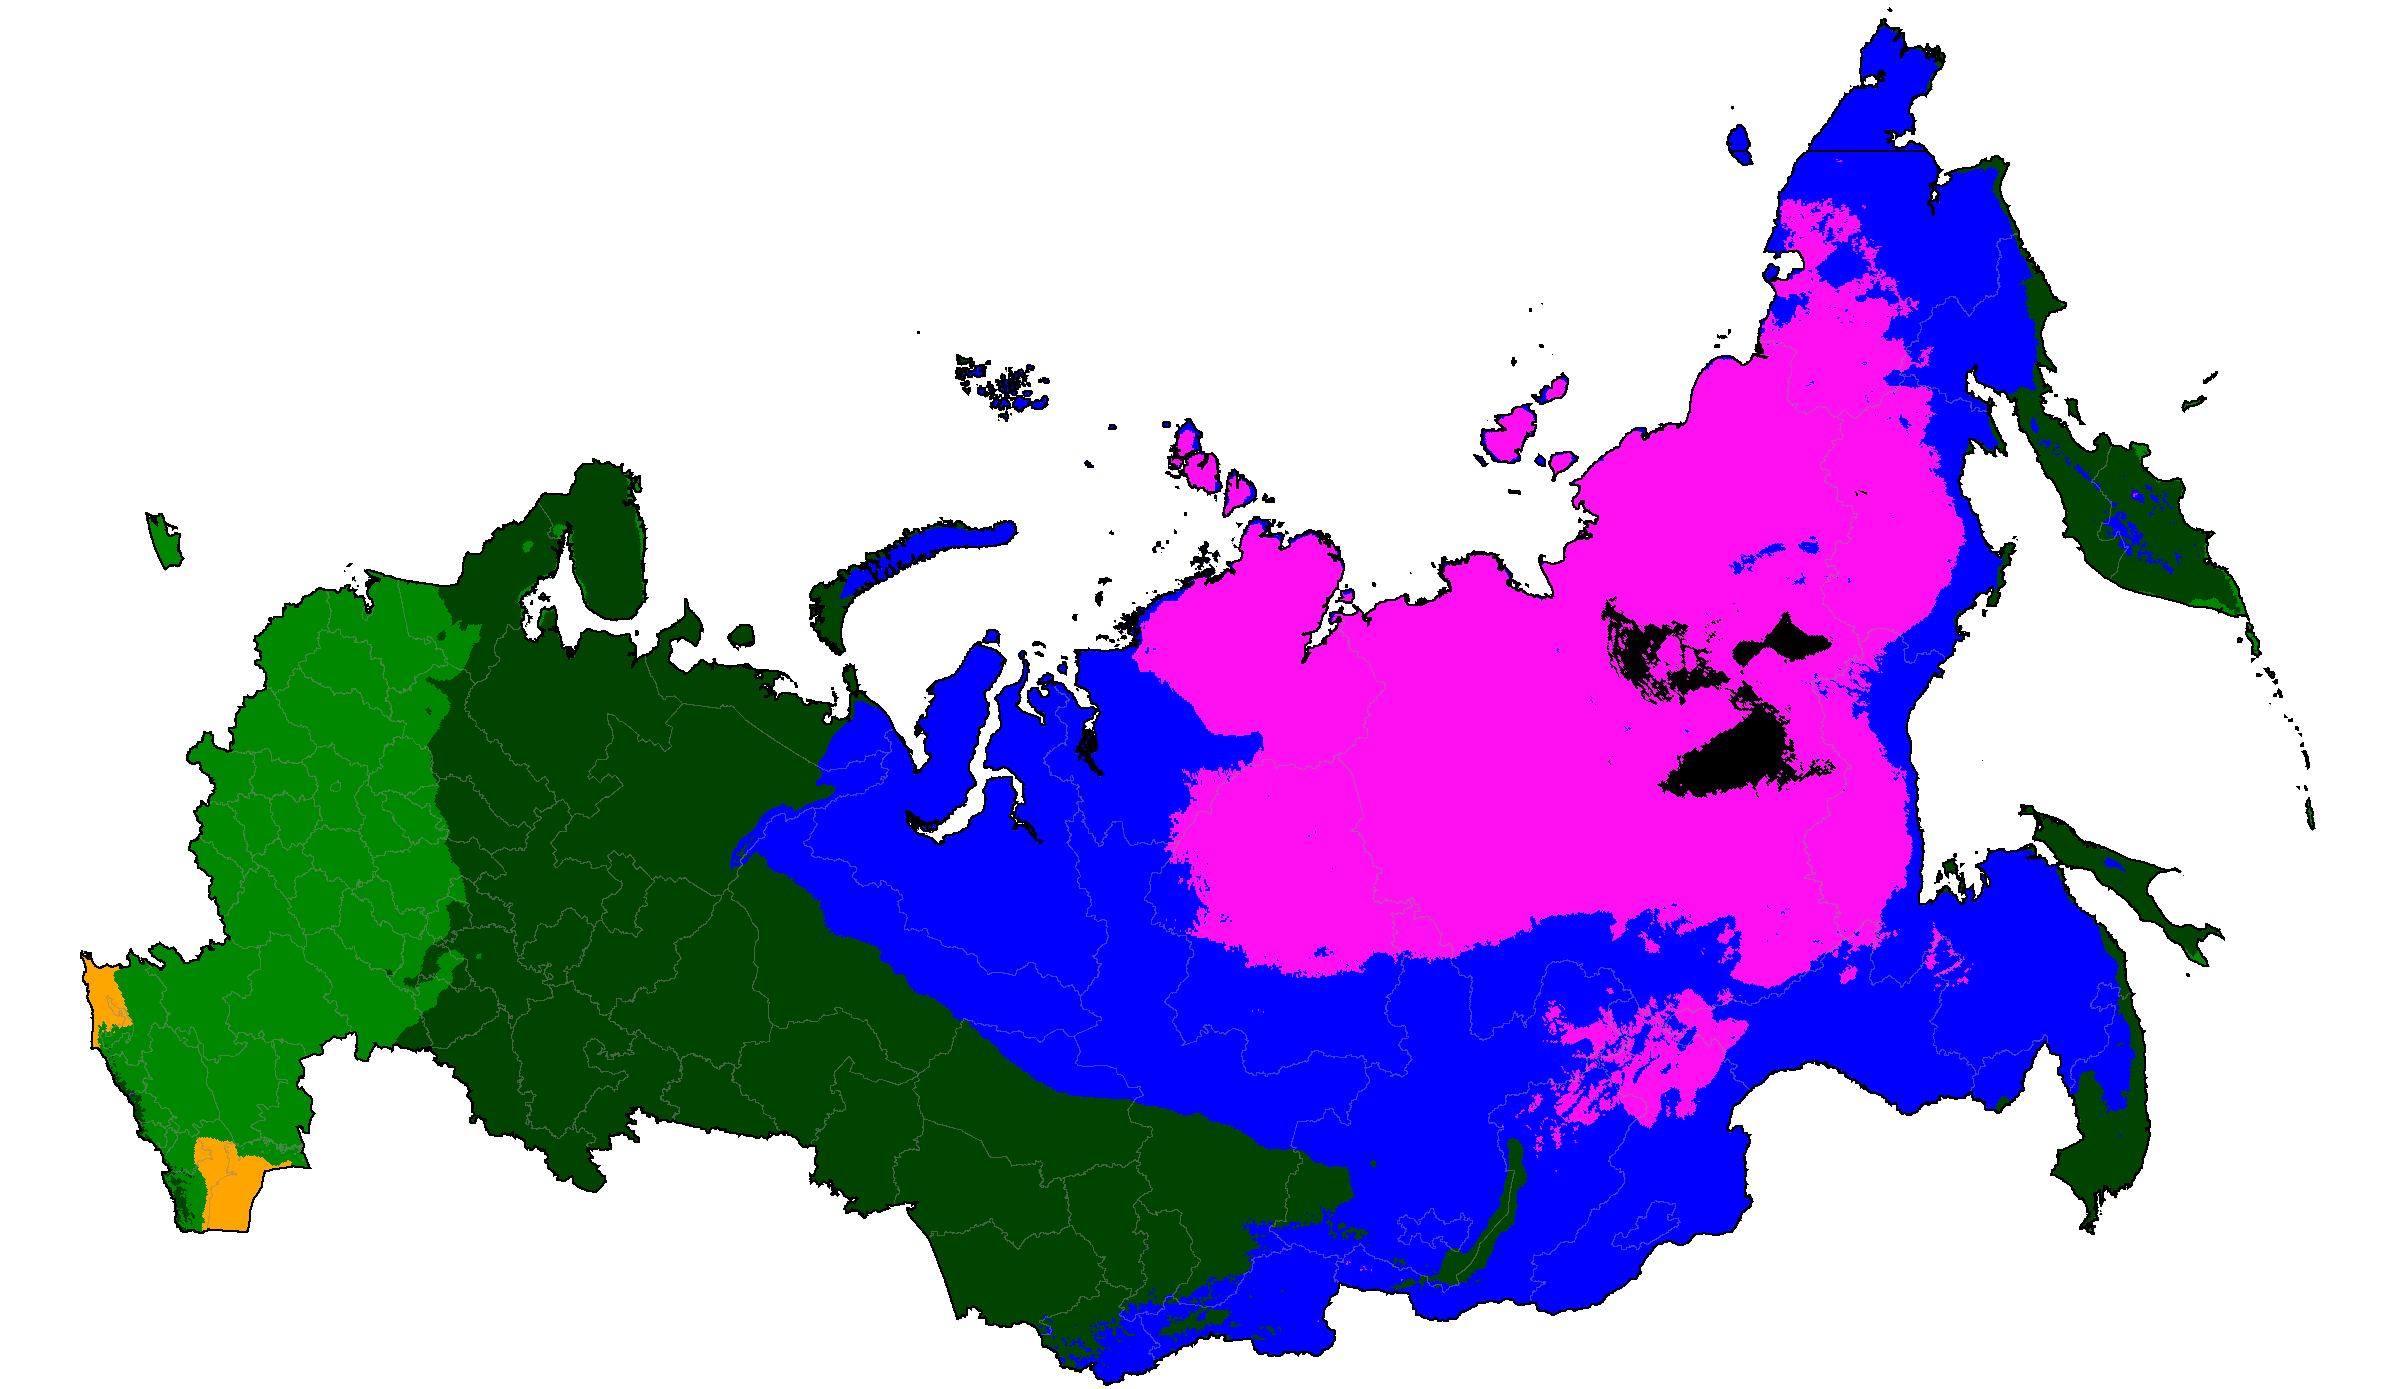
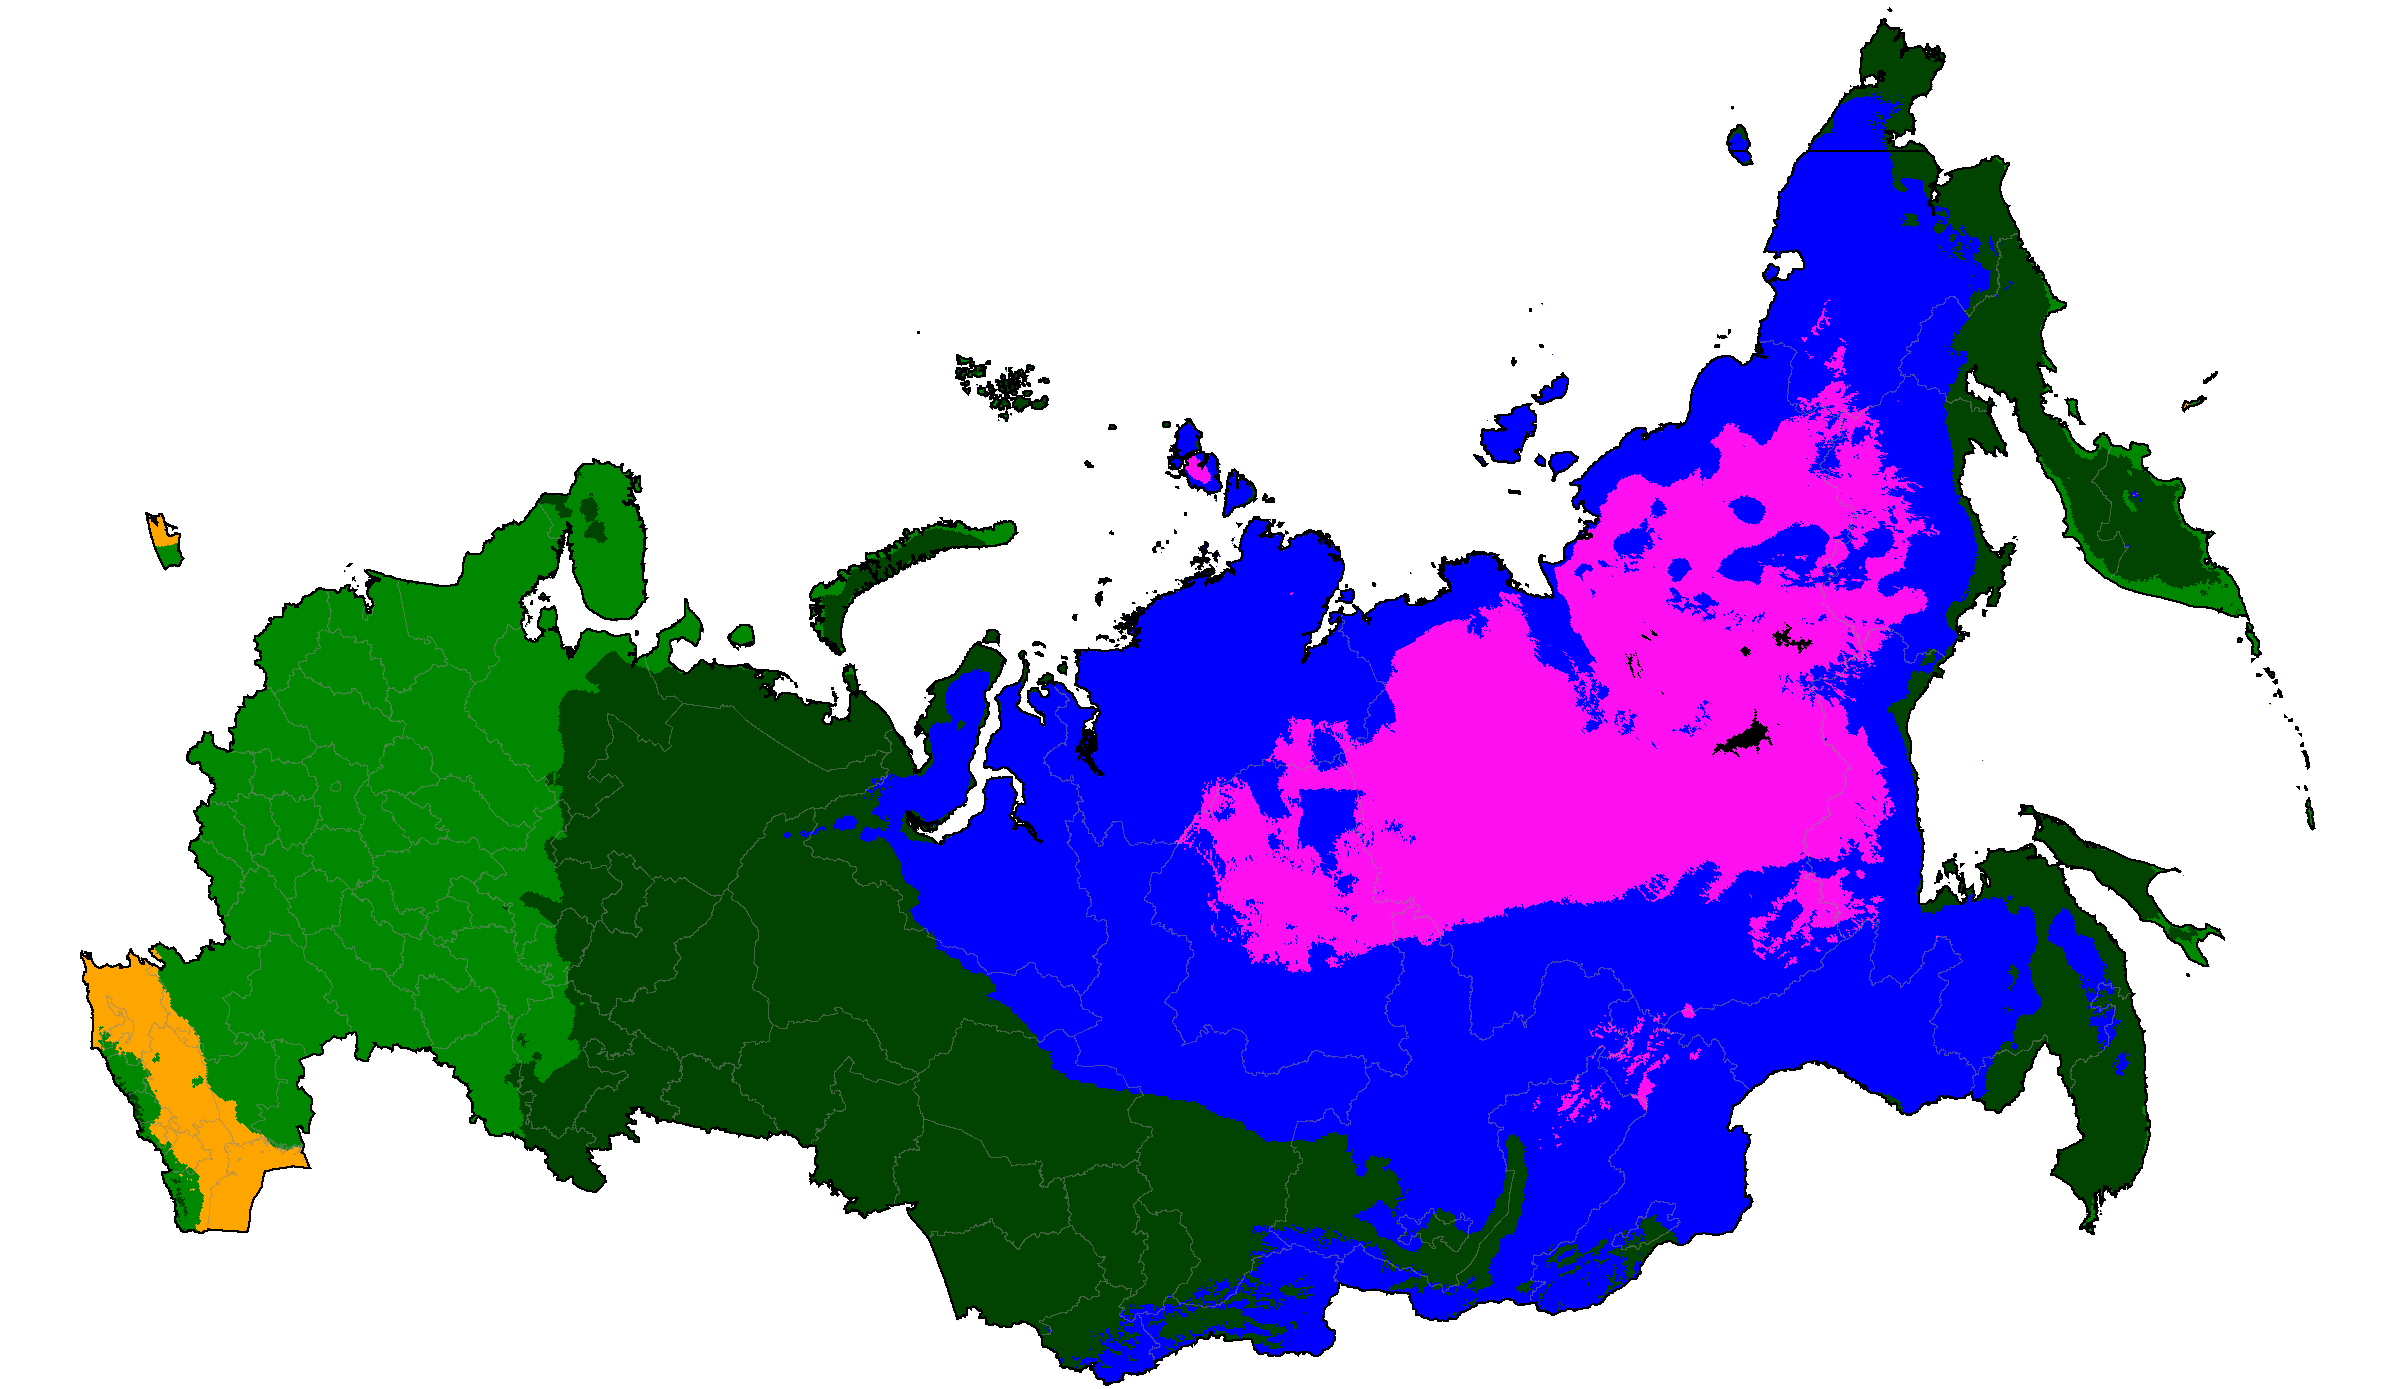
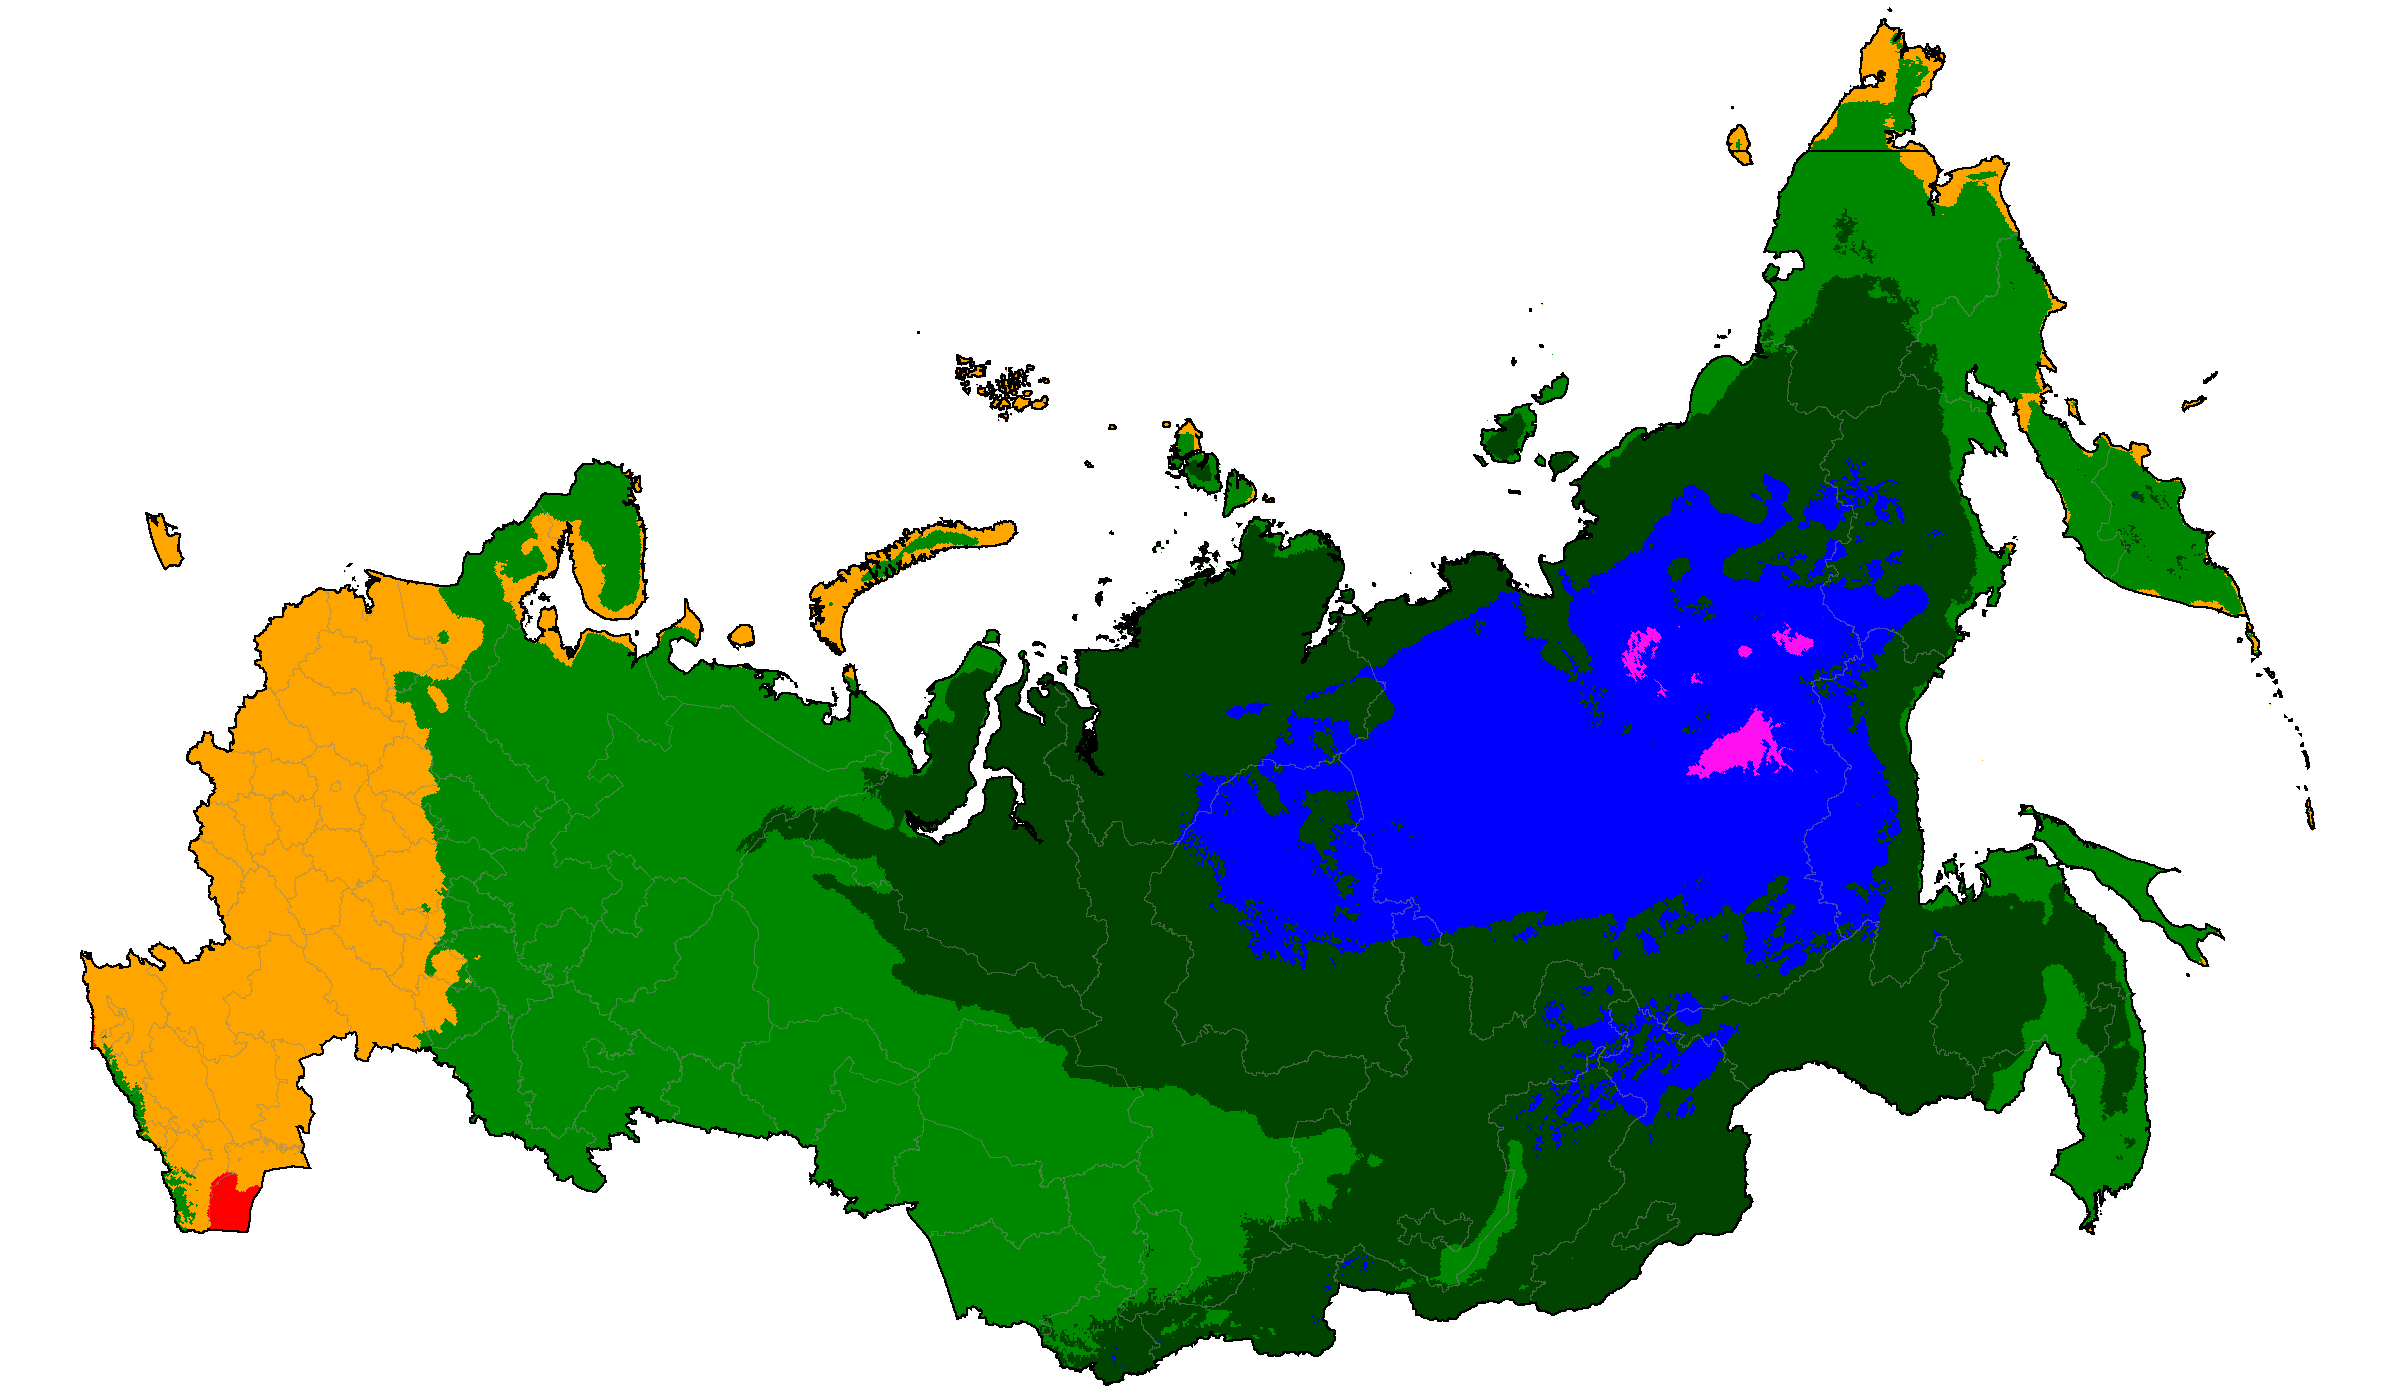
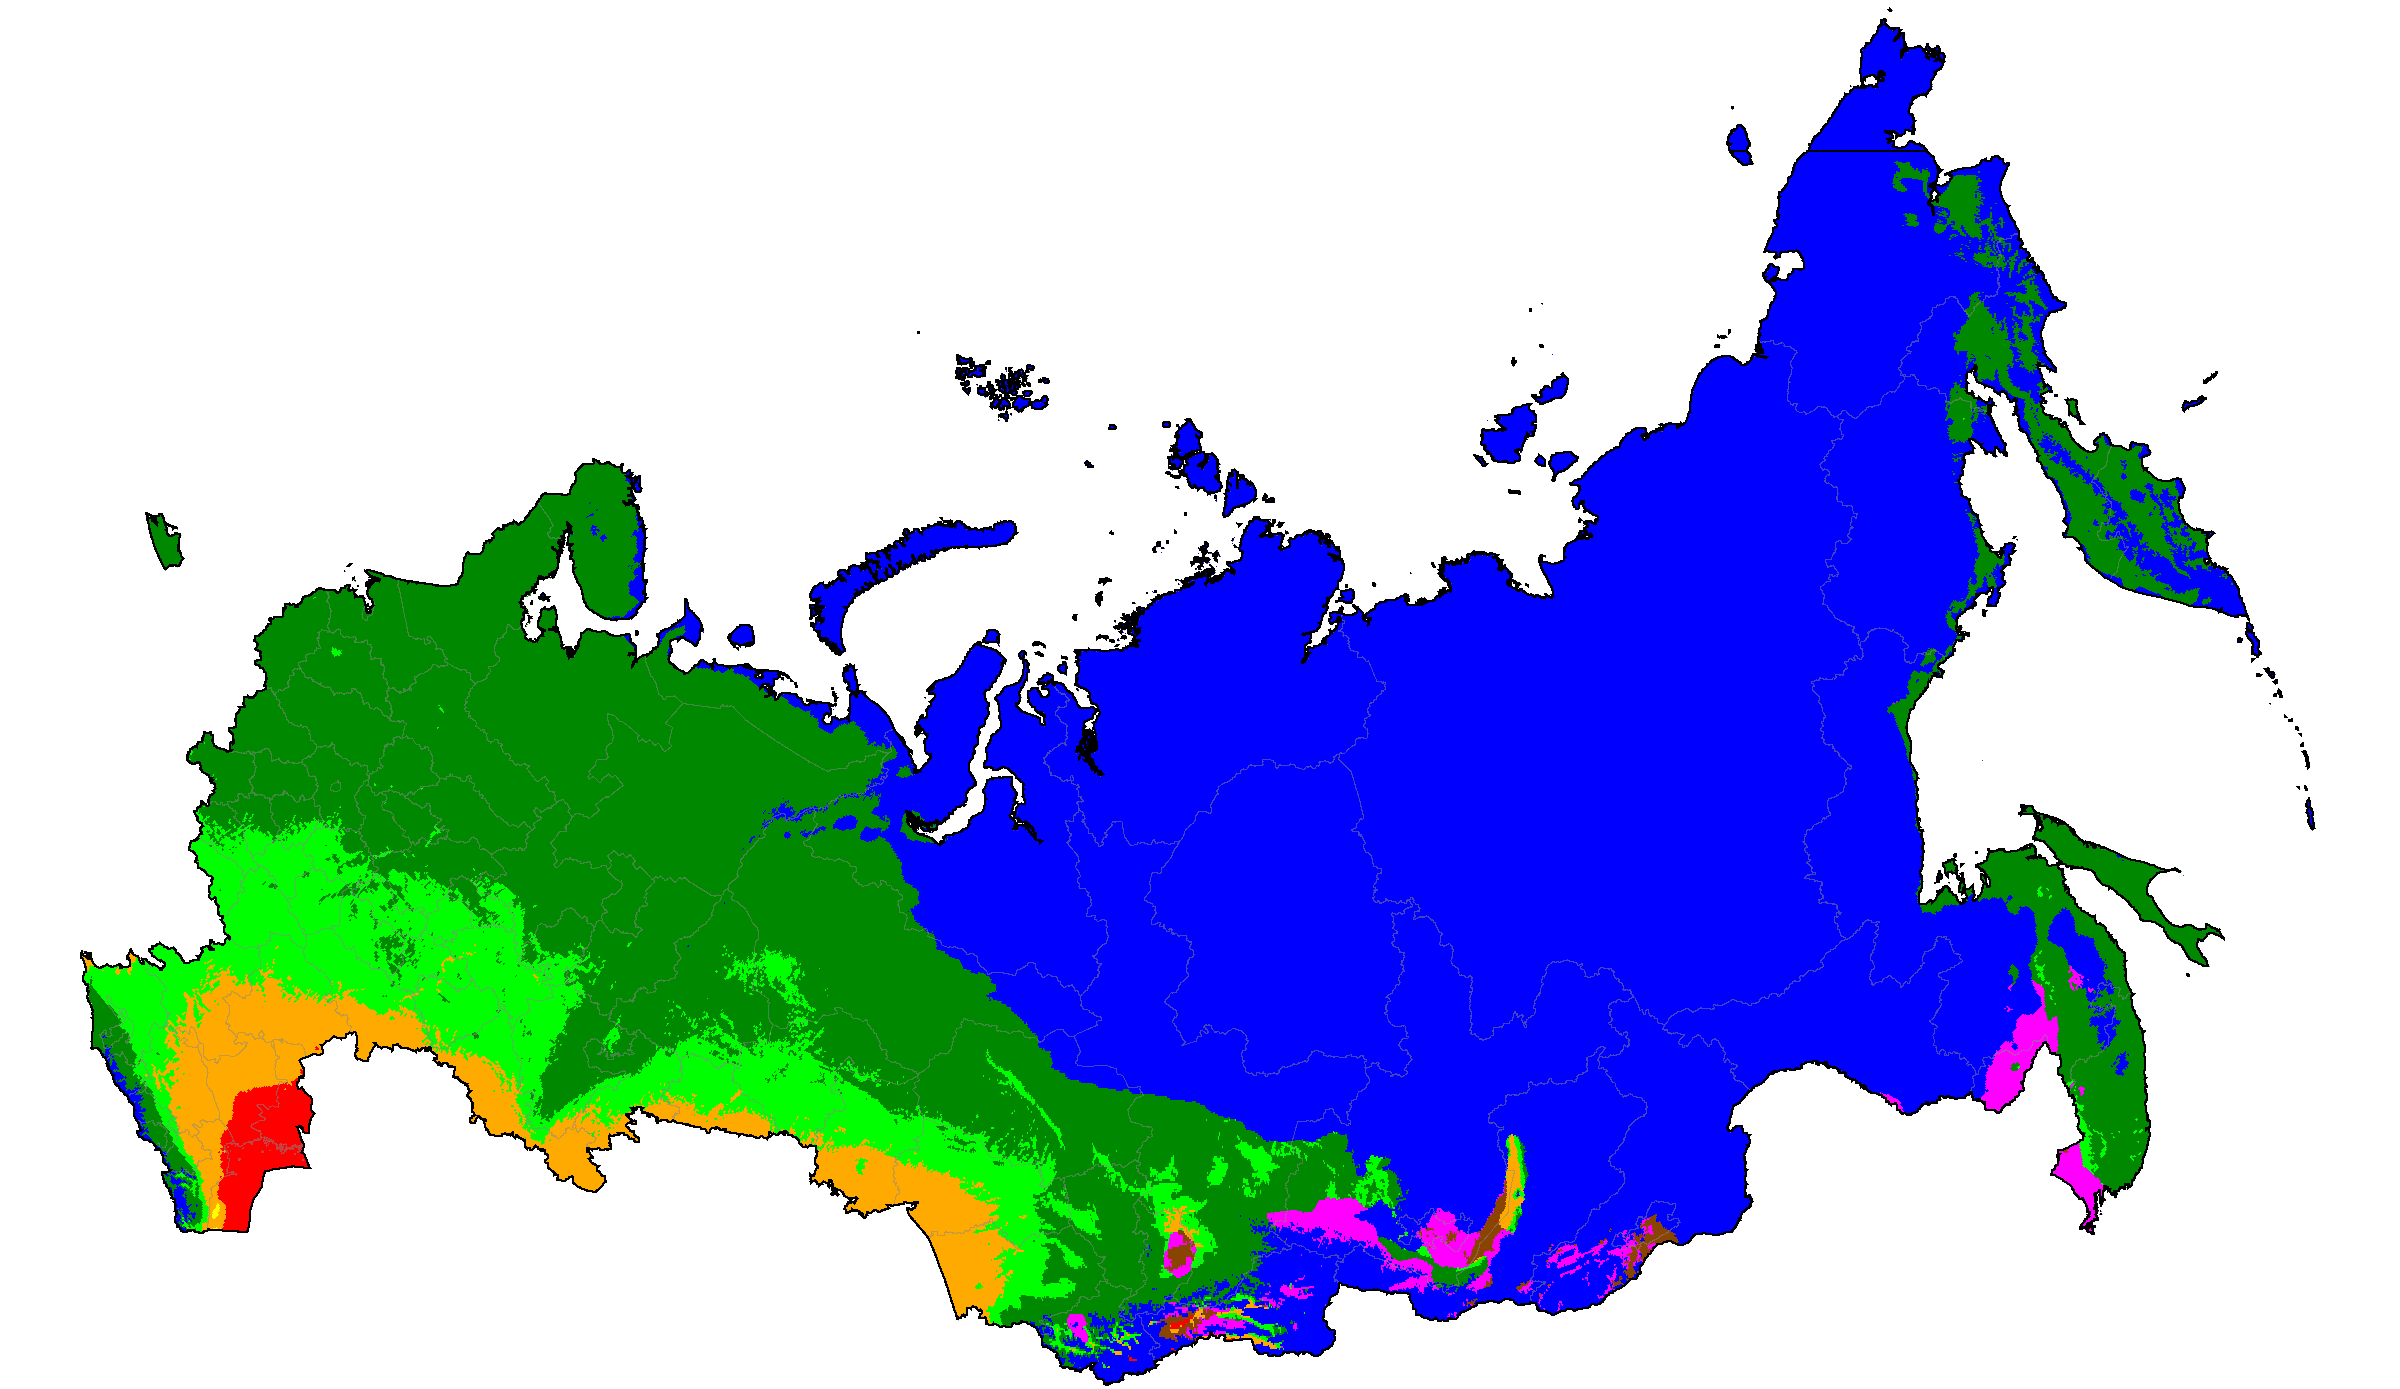
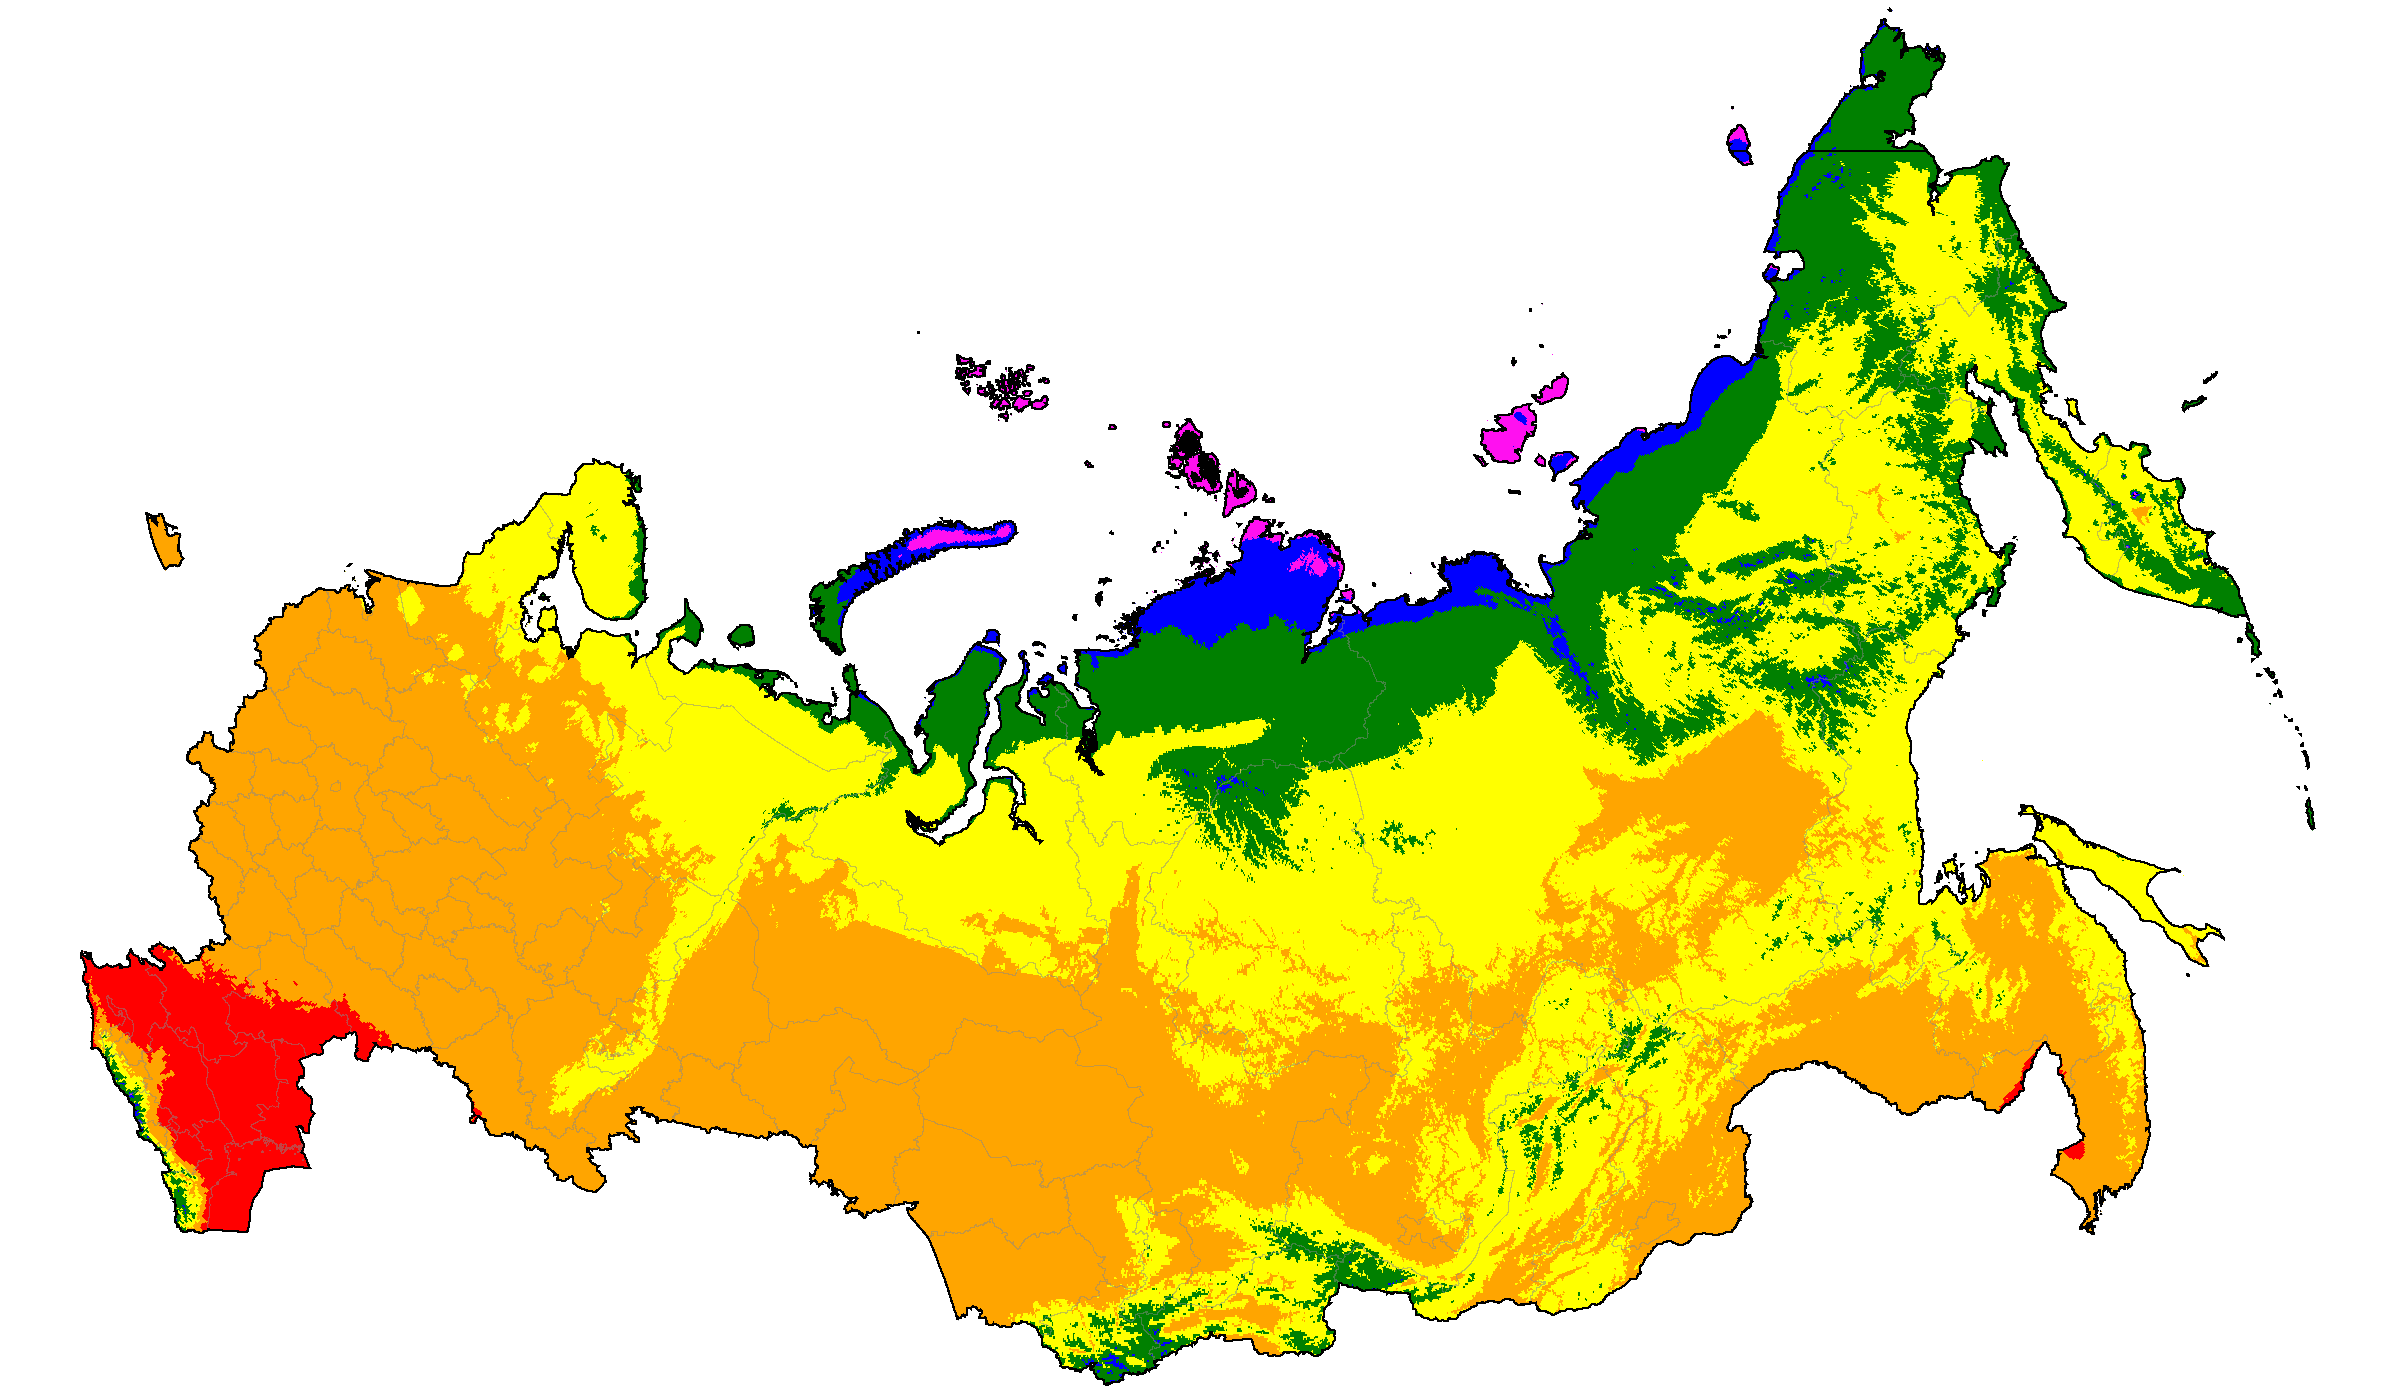
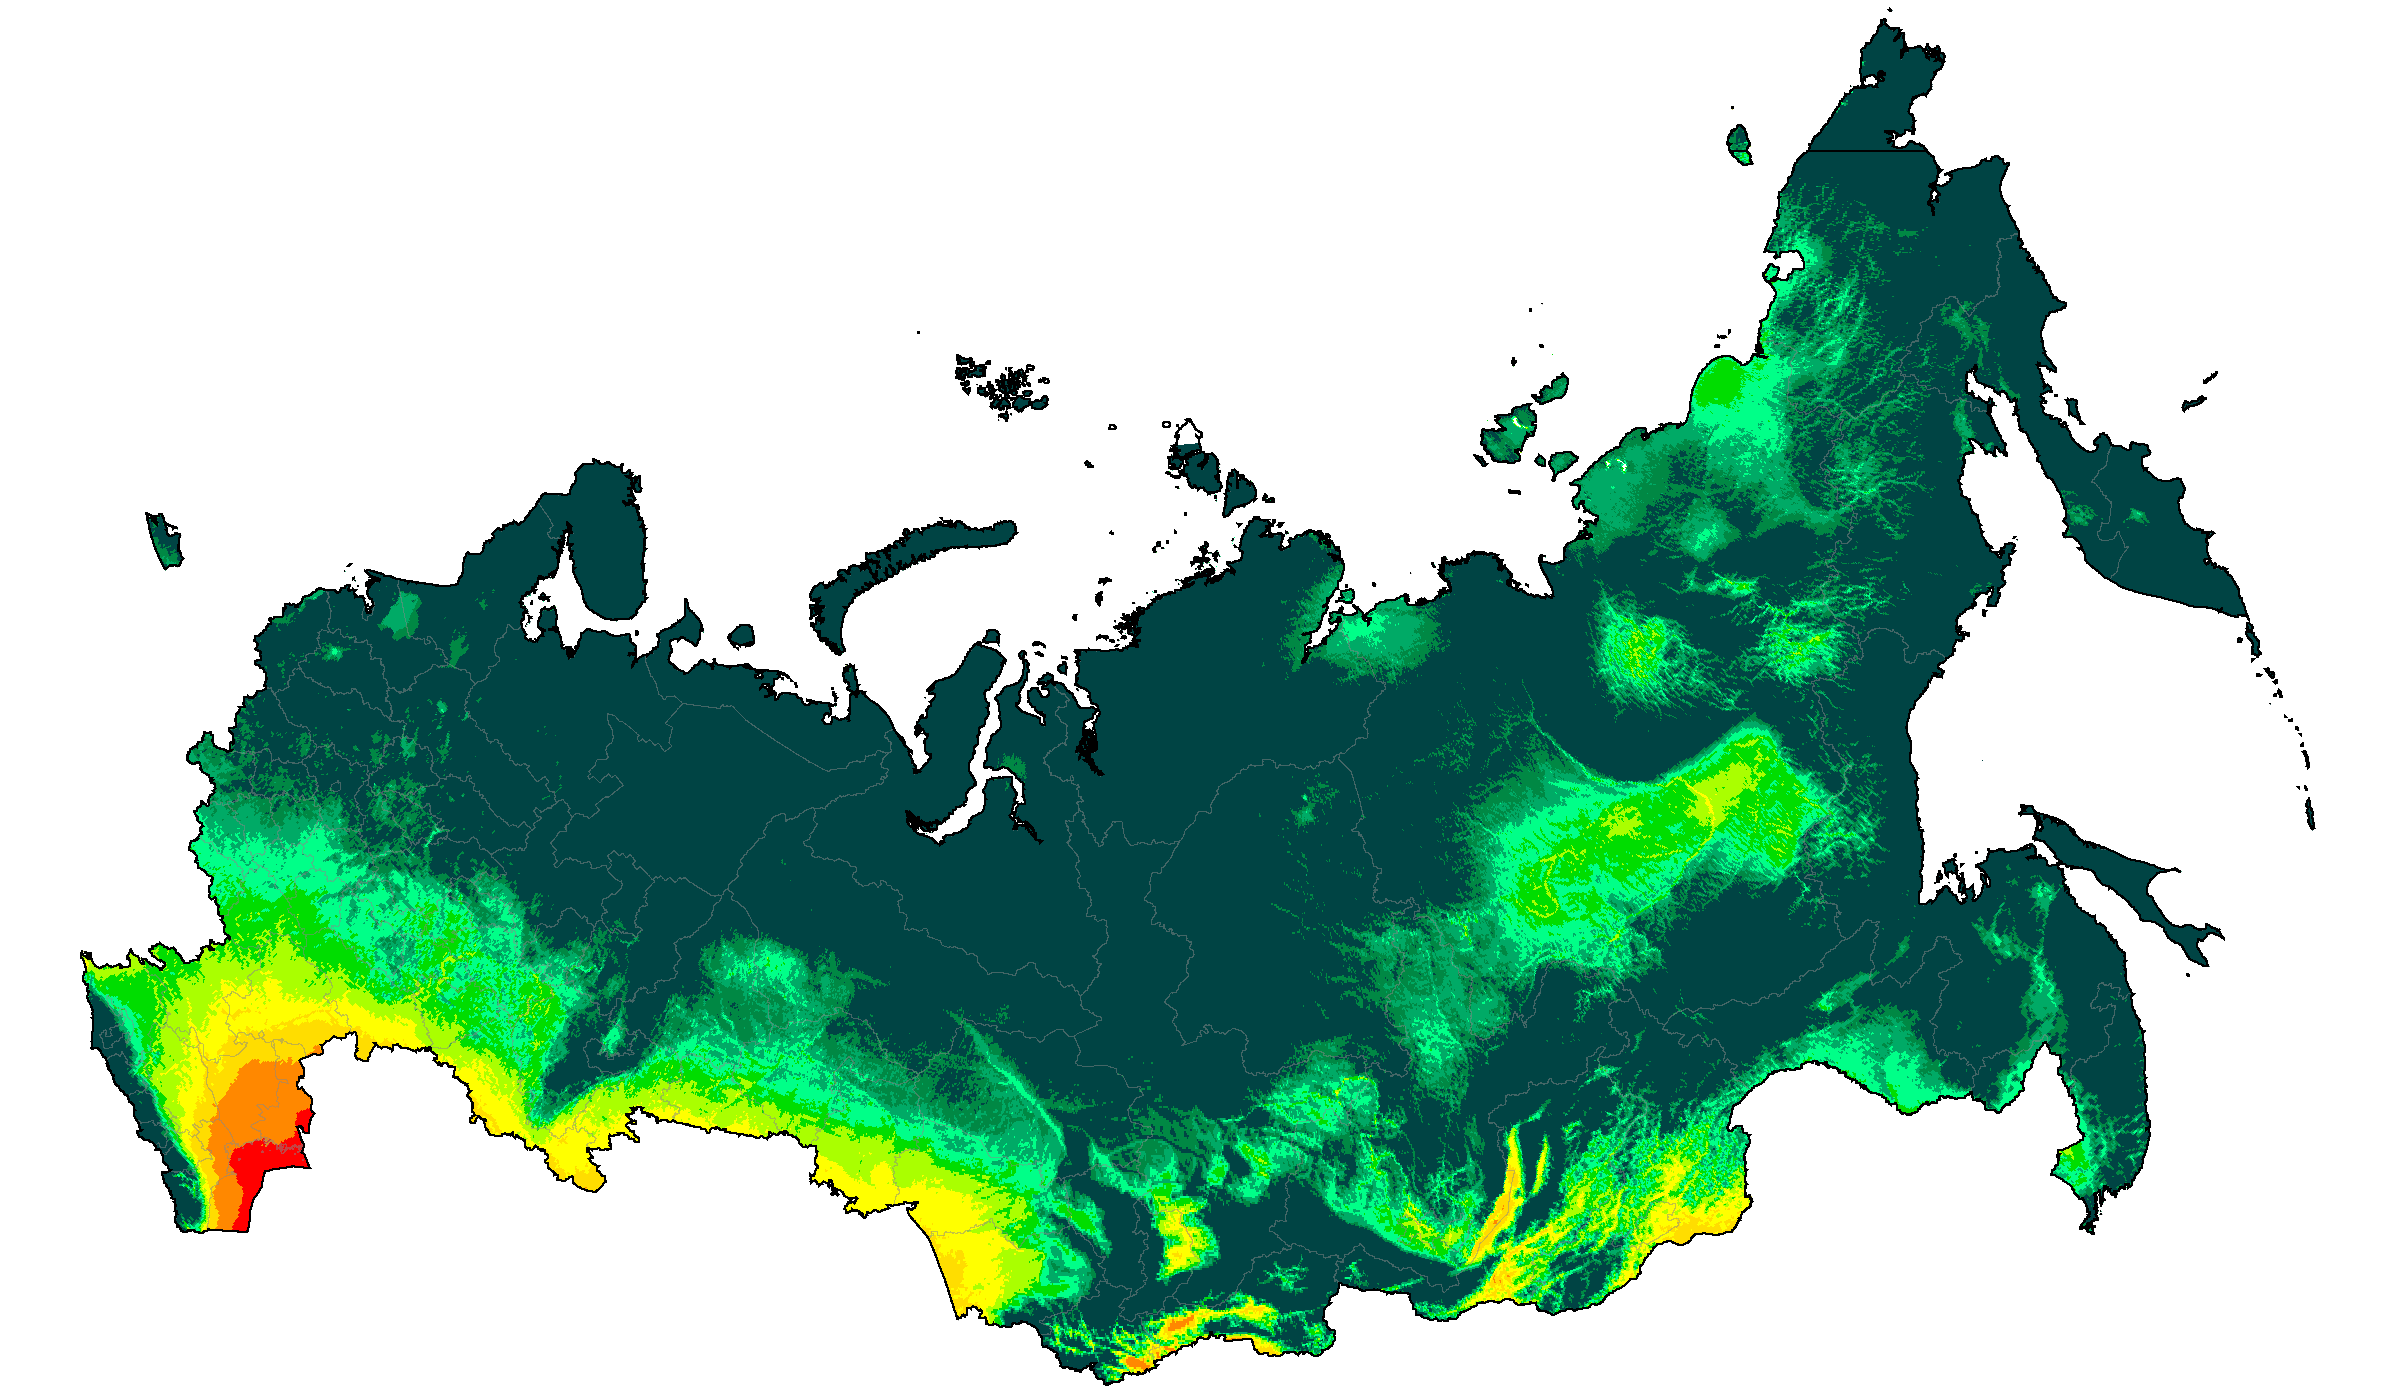
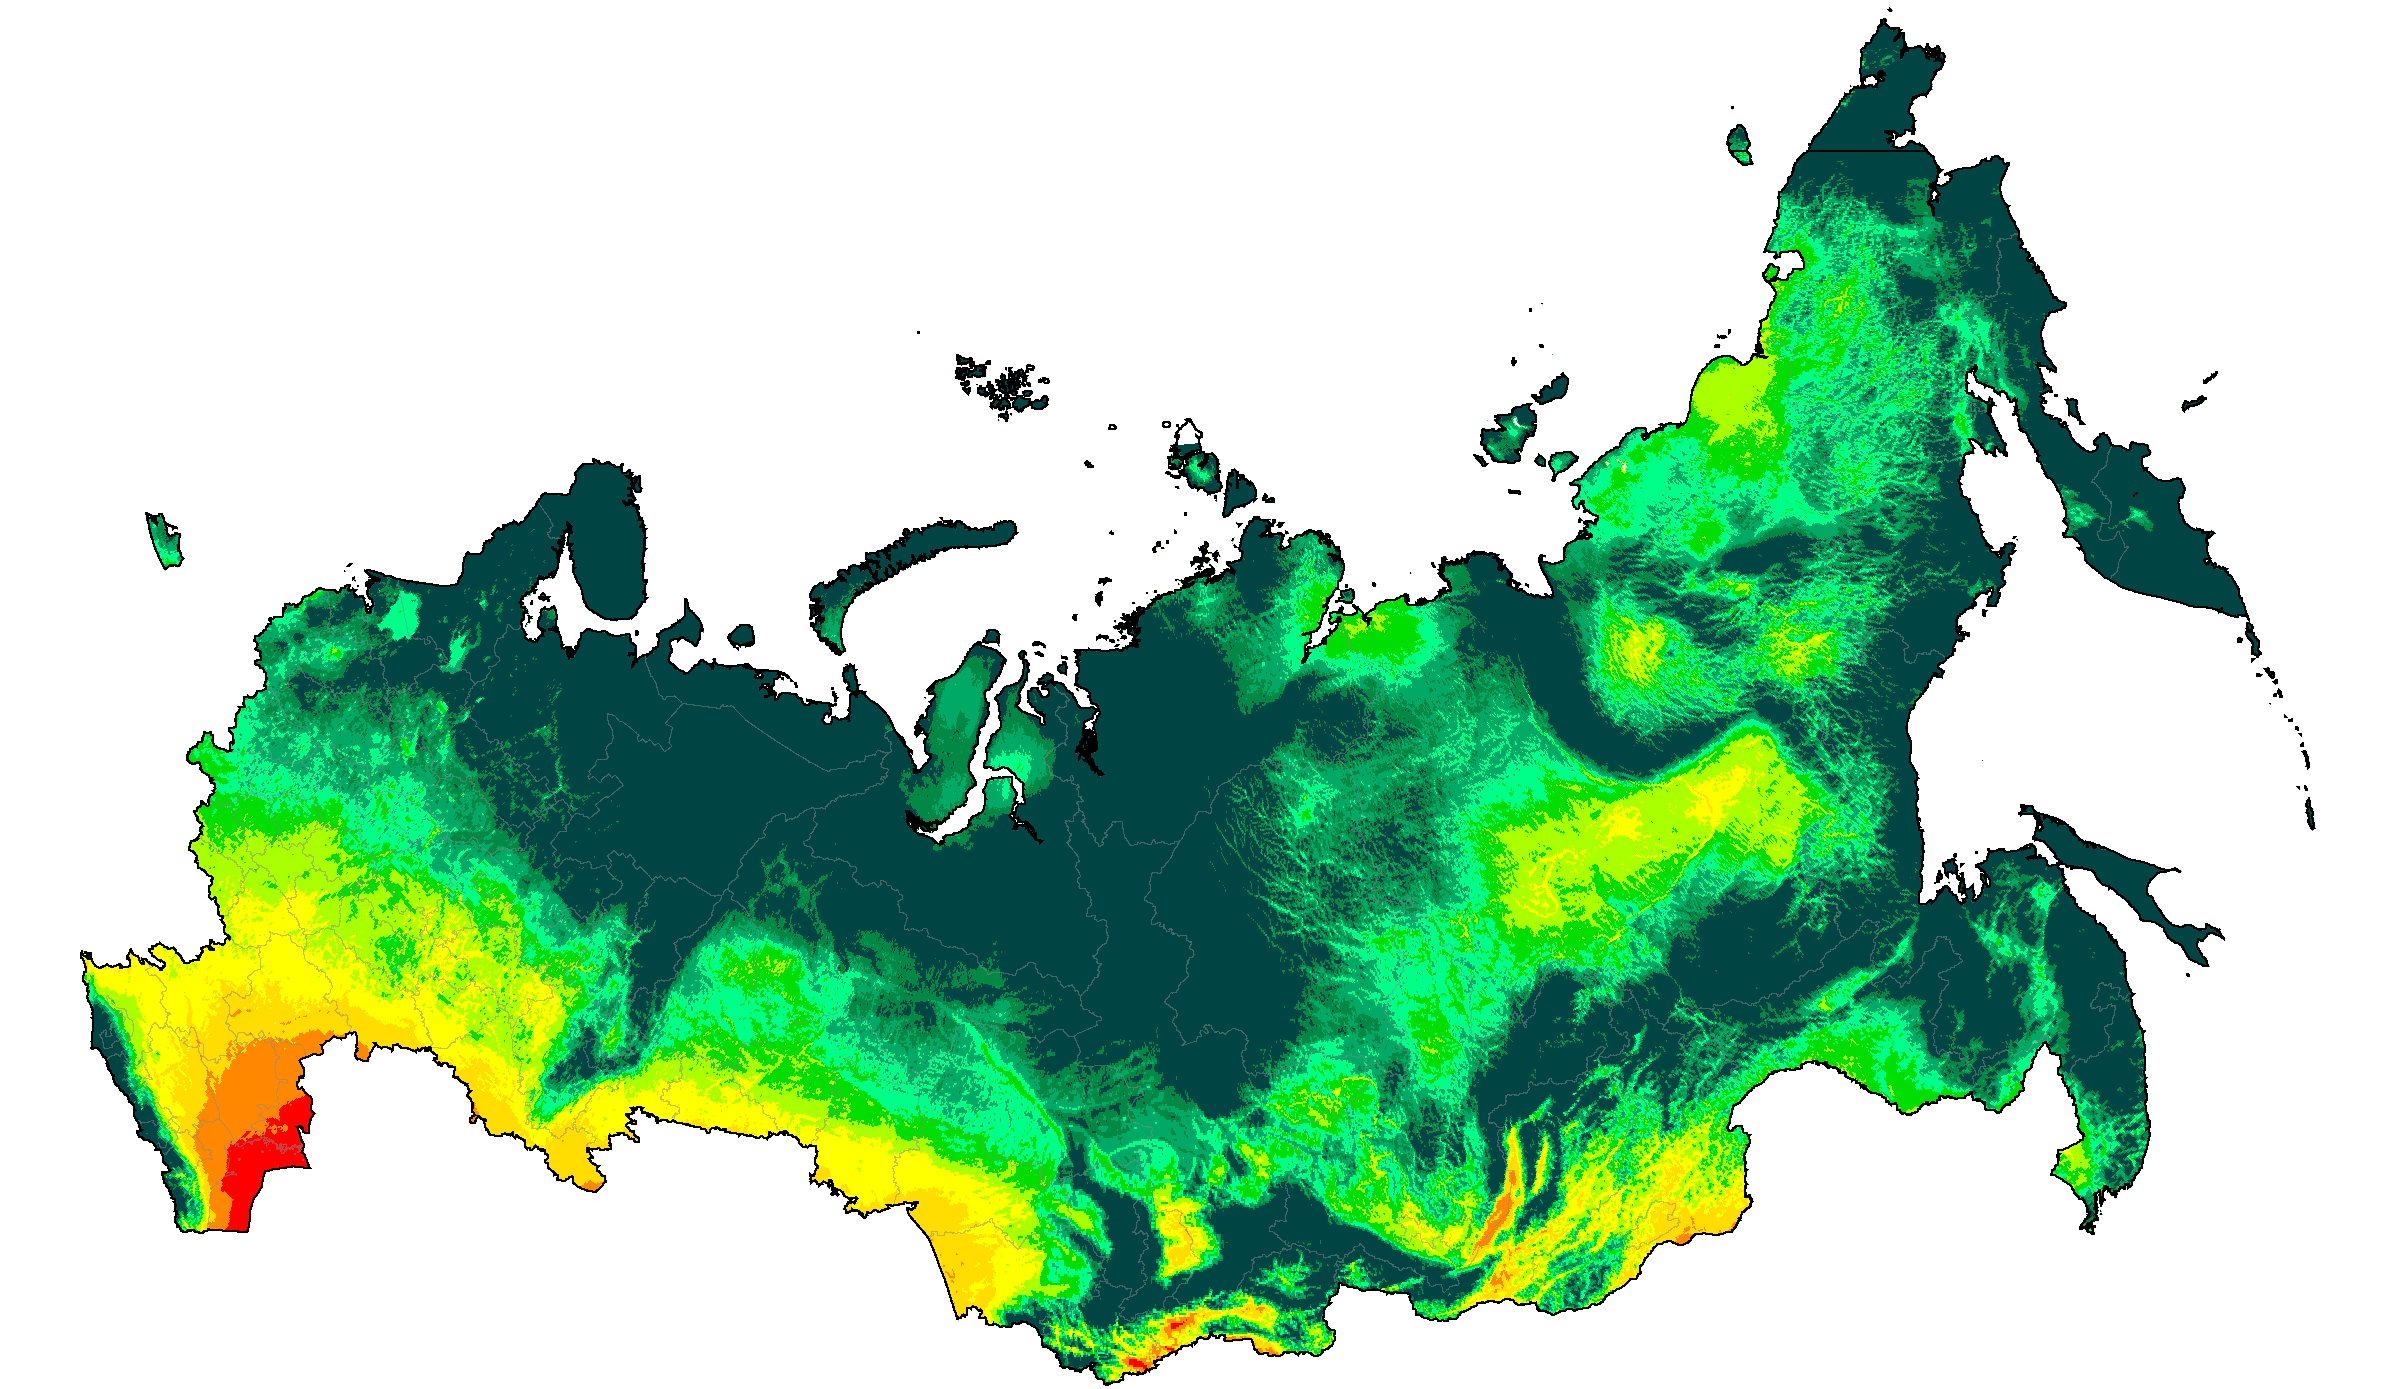
Russia distribution of aridity categories (projections are SSP5-8.5 high emissions normals)
Note: The line visible in eastern Russia is a cartographic artifact of the International Date Line (180° meridian), not a political boundary.
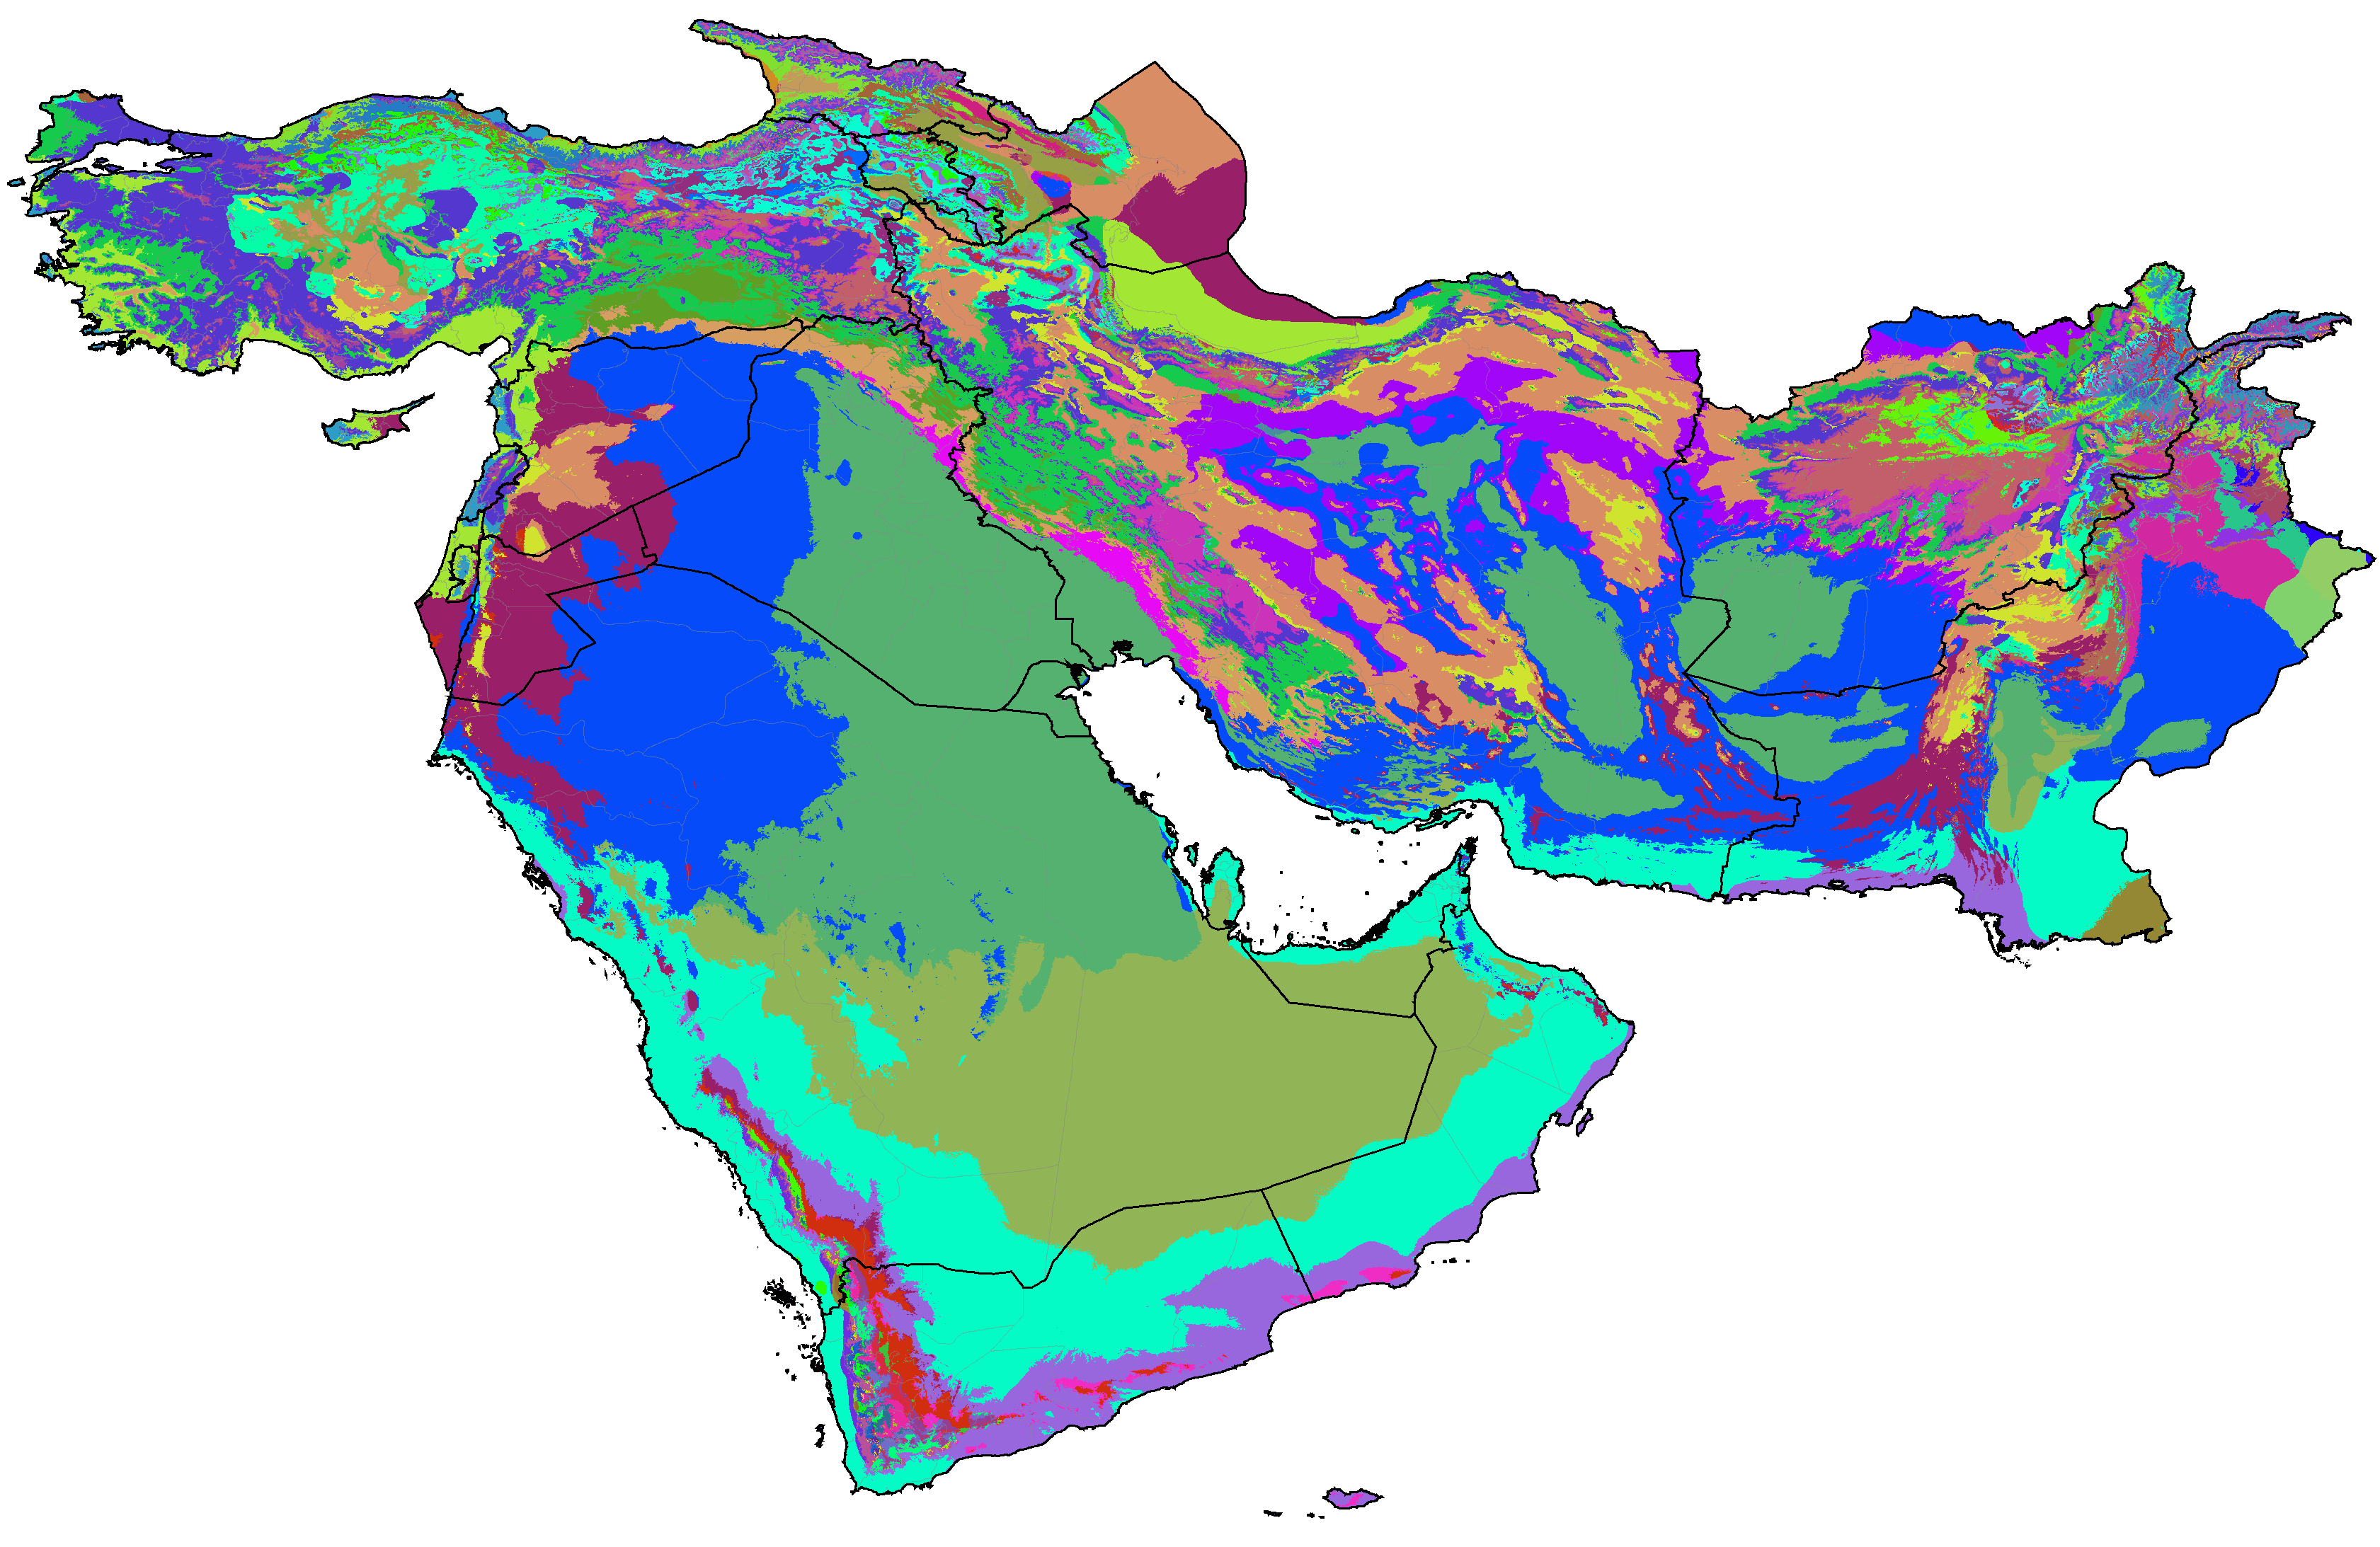
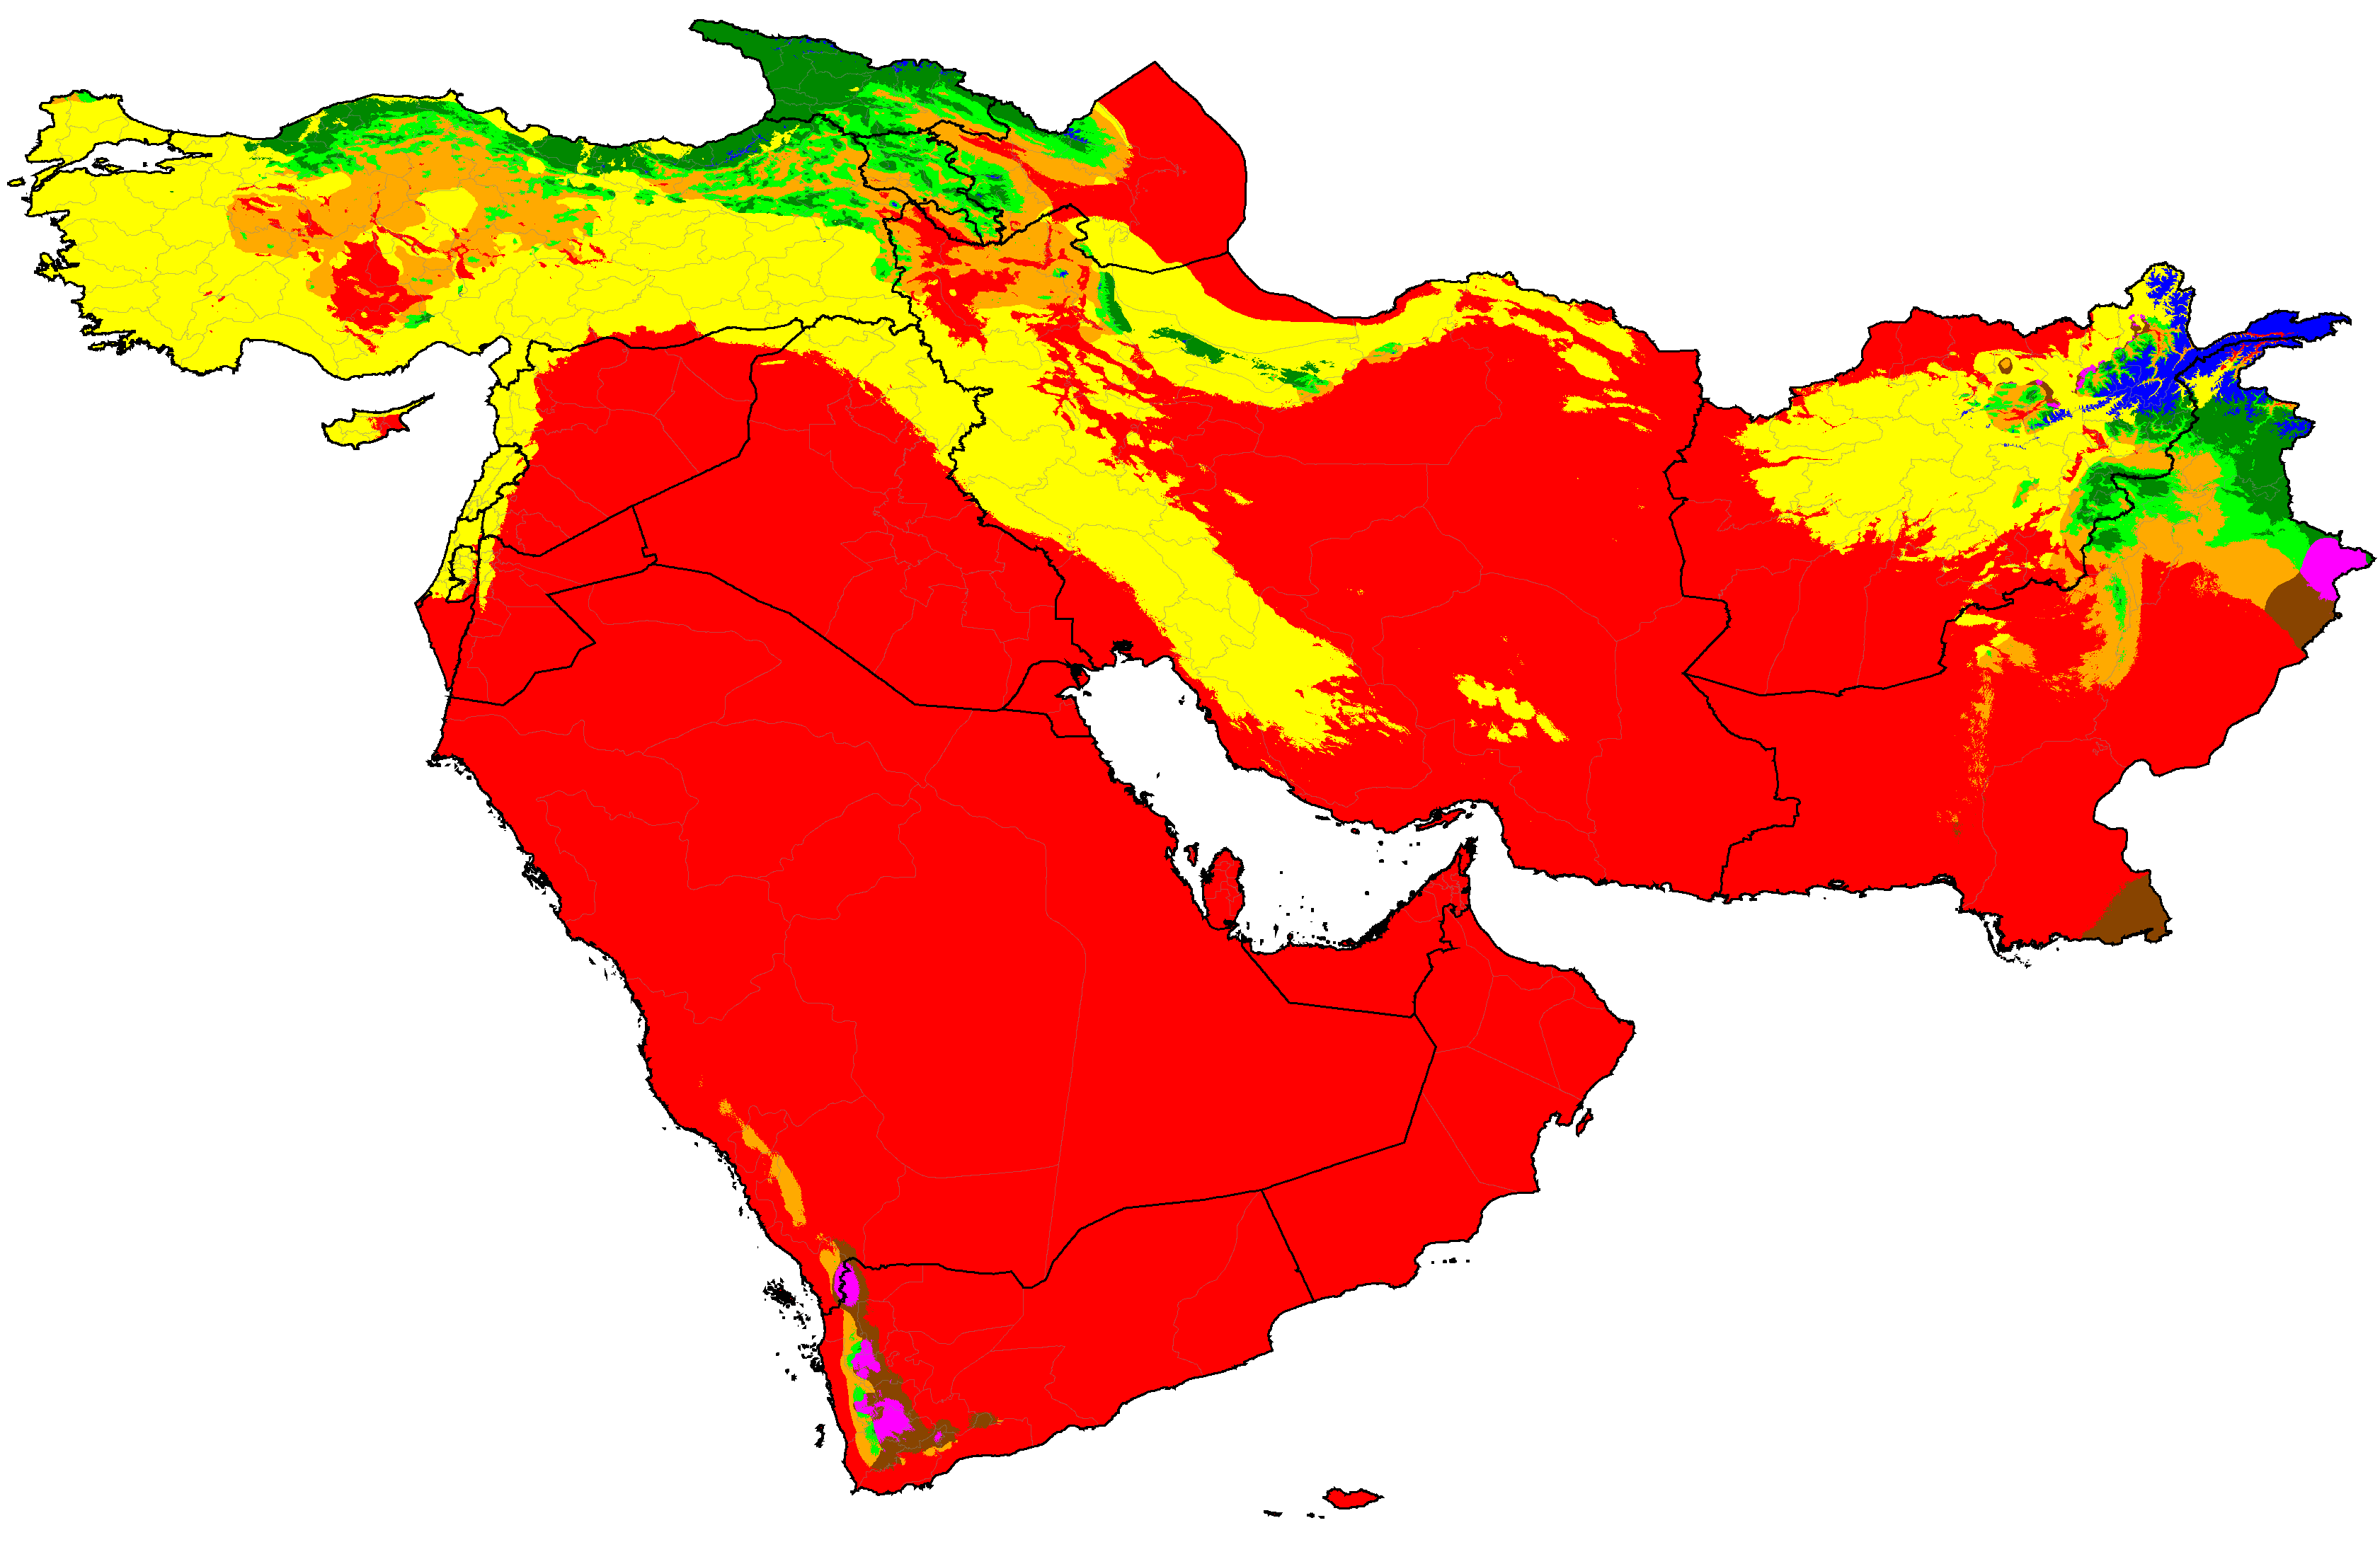
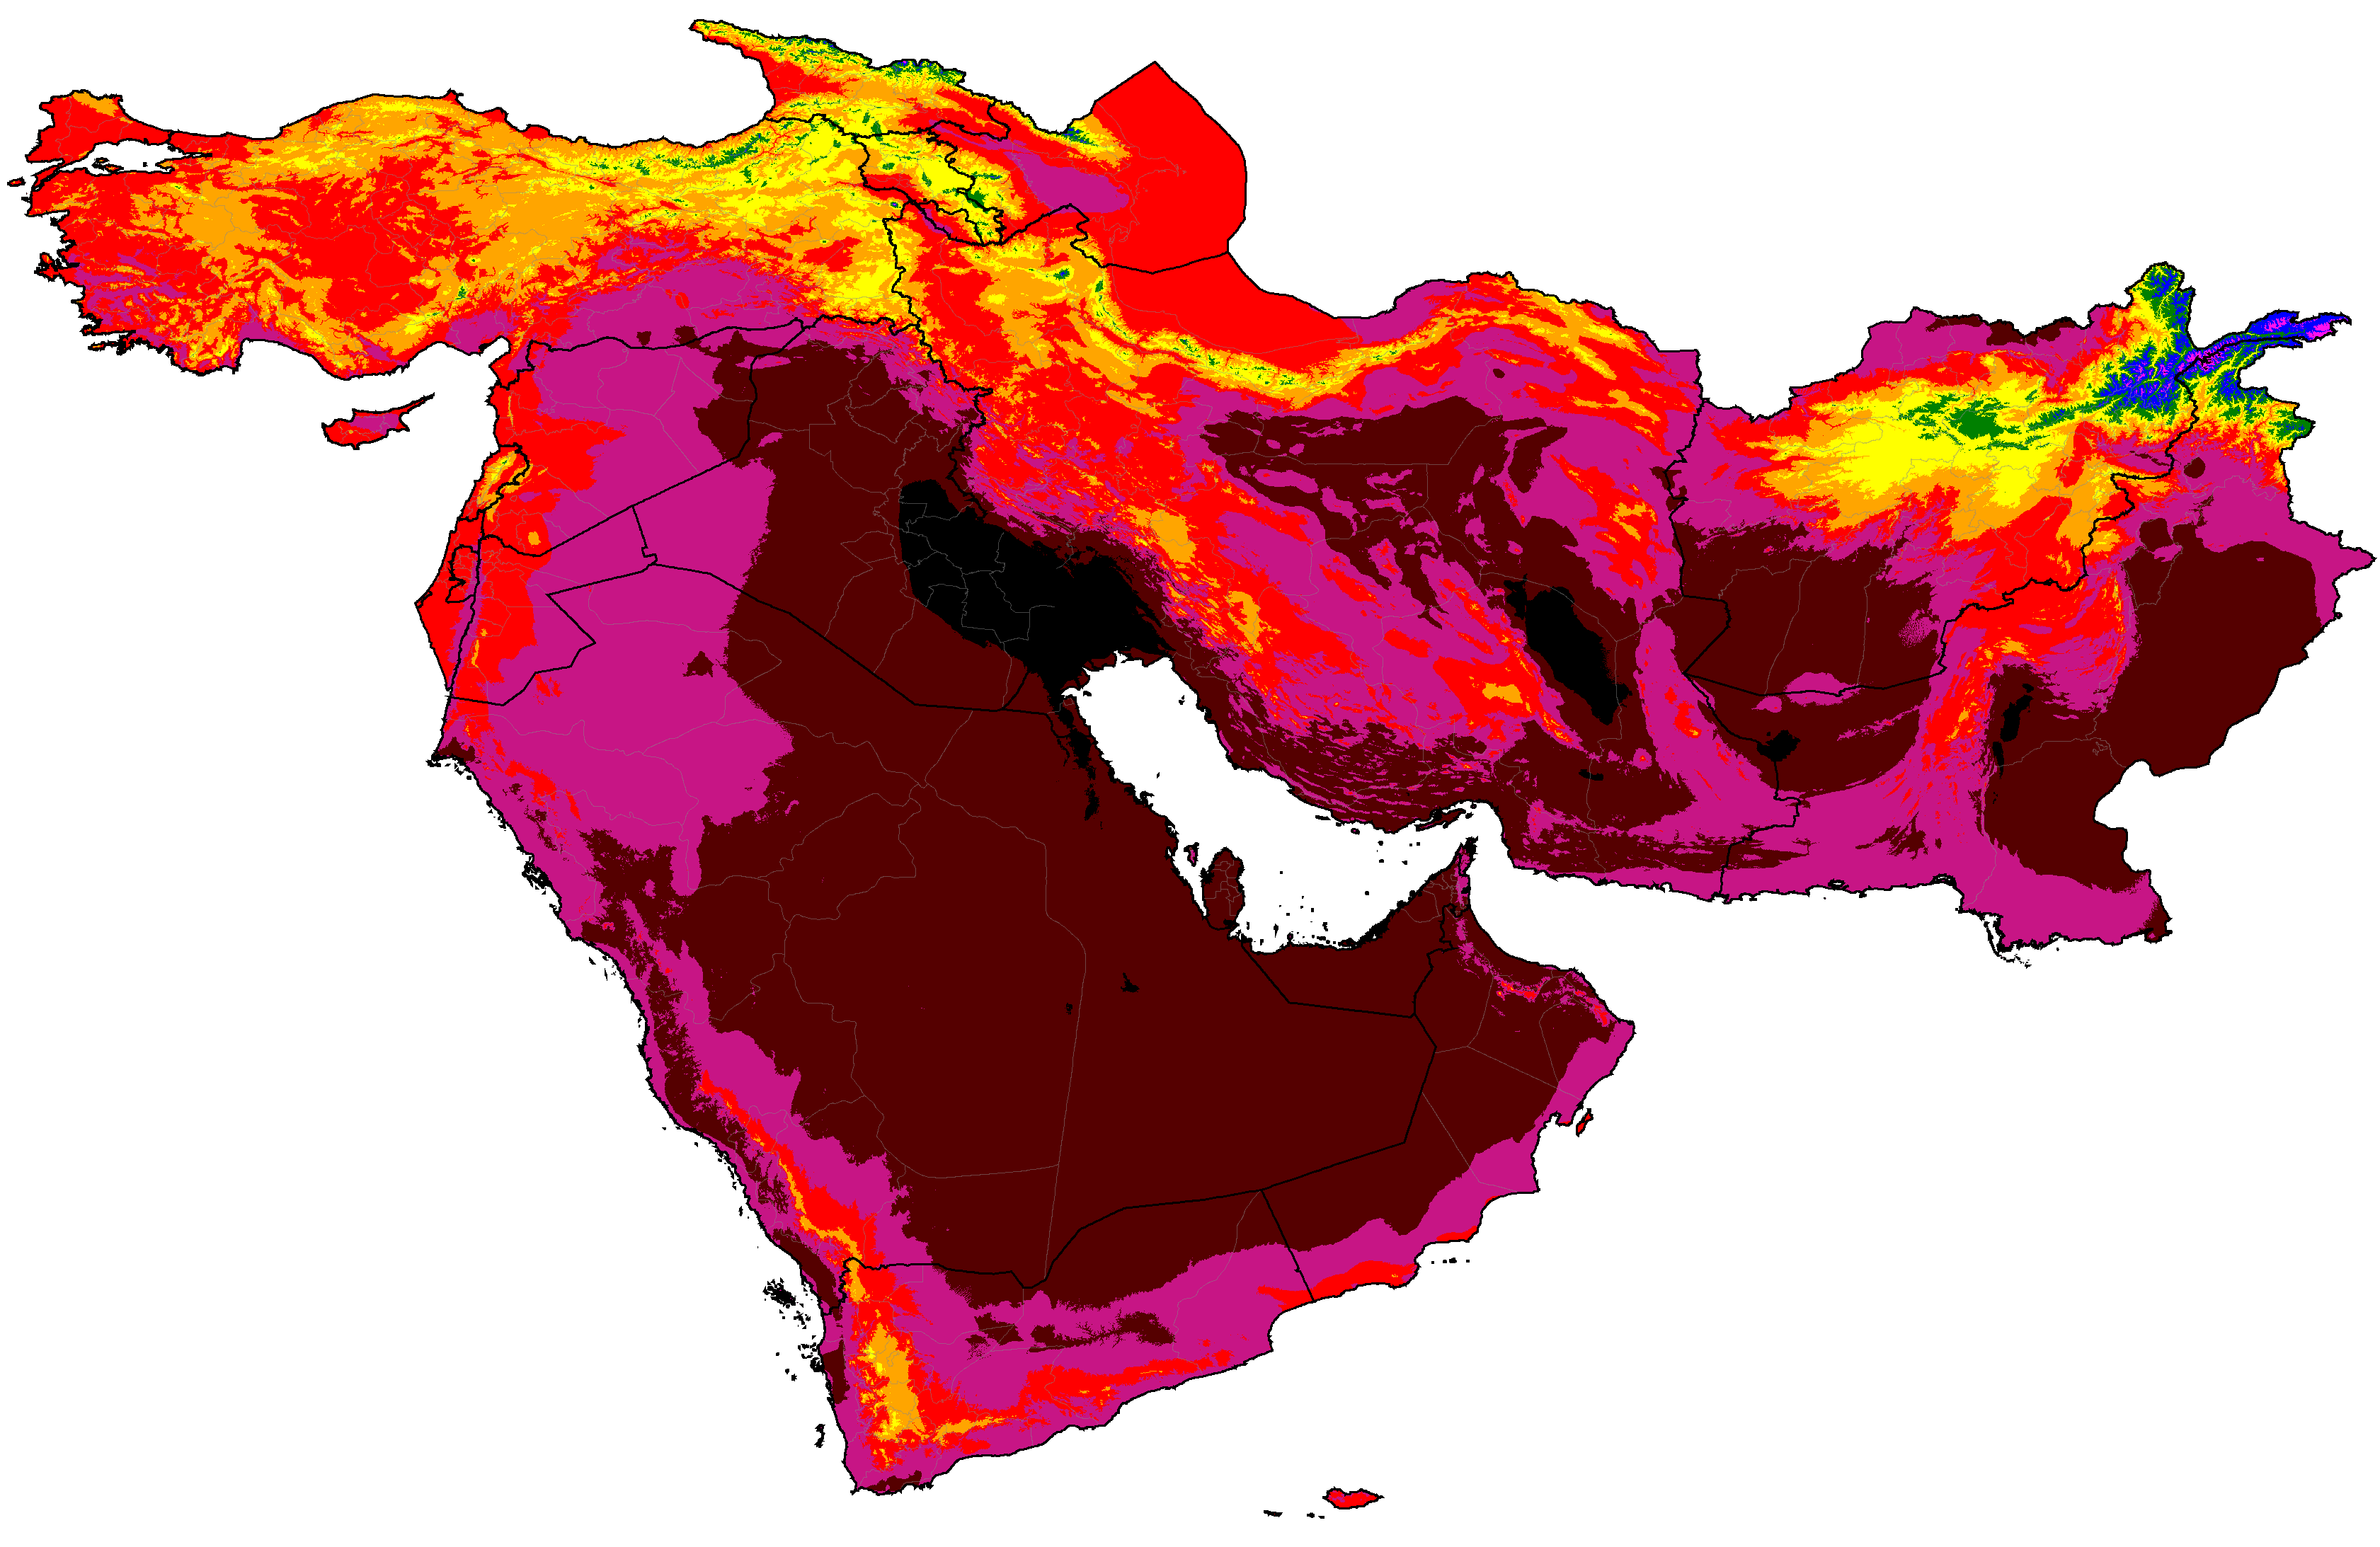
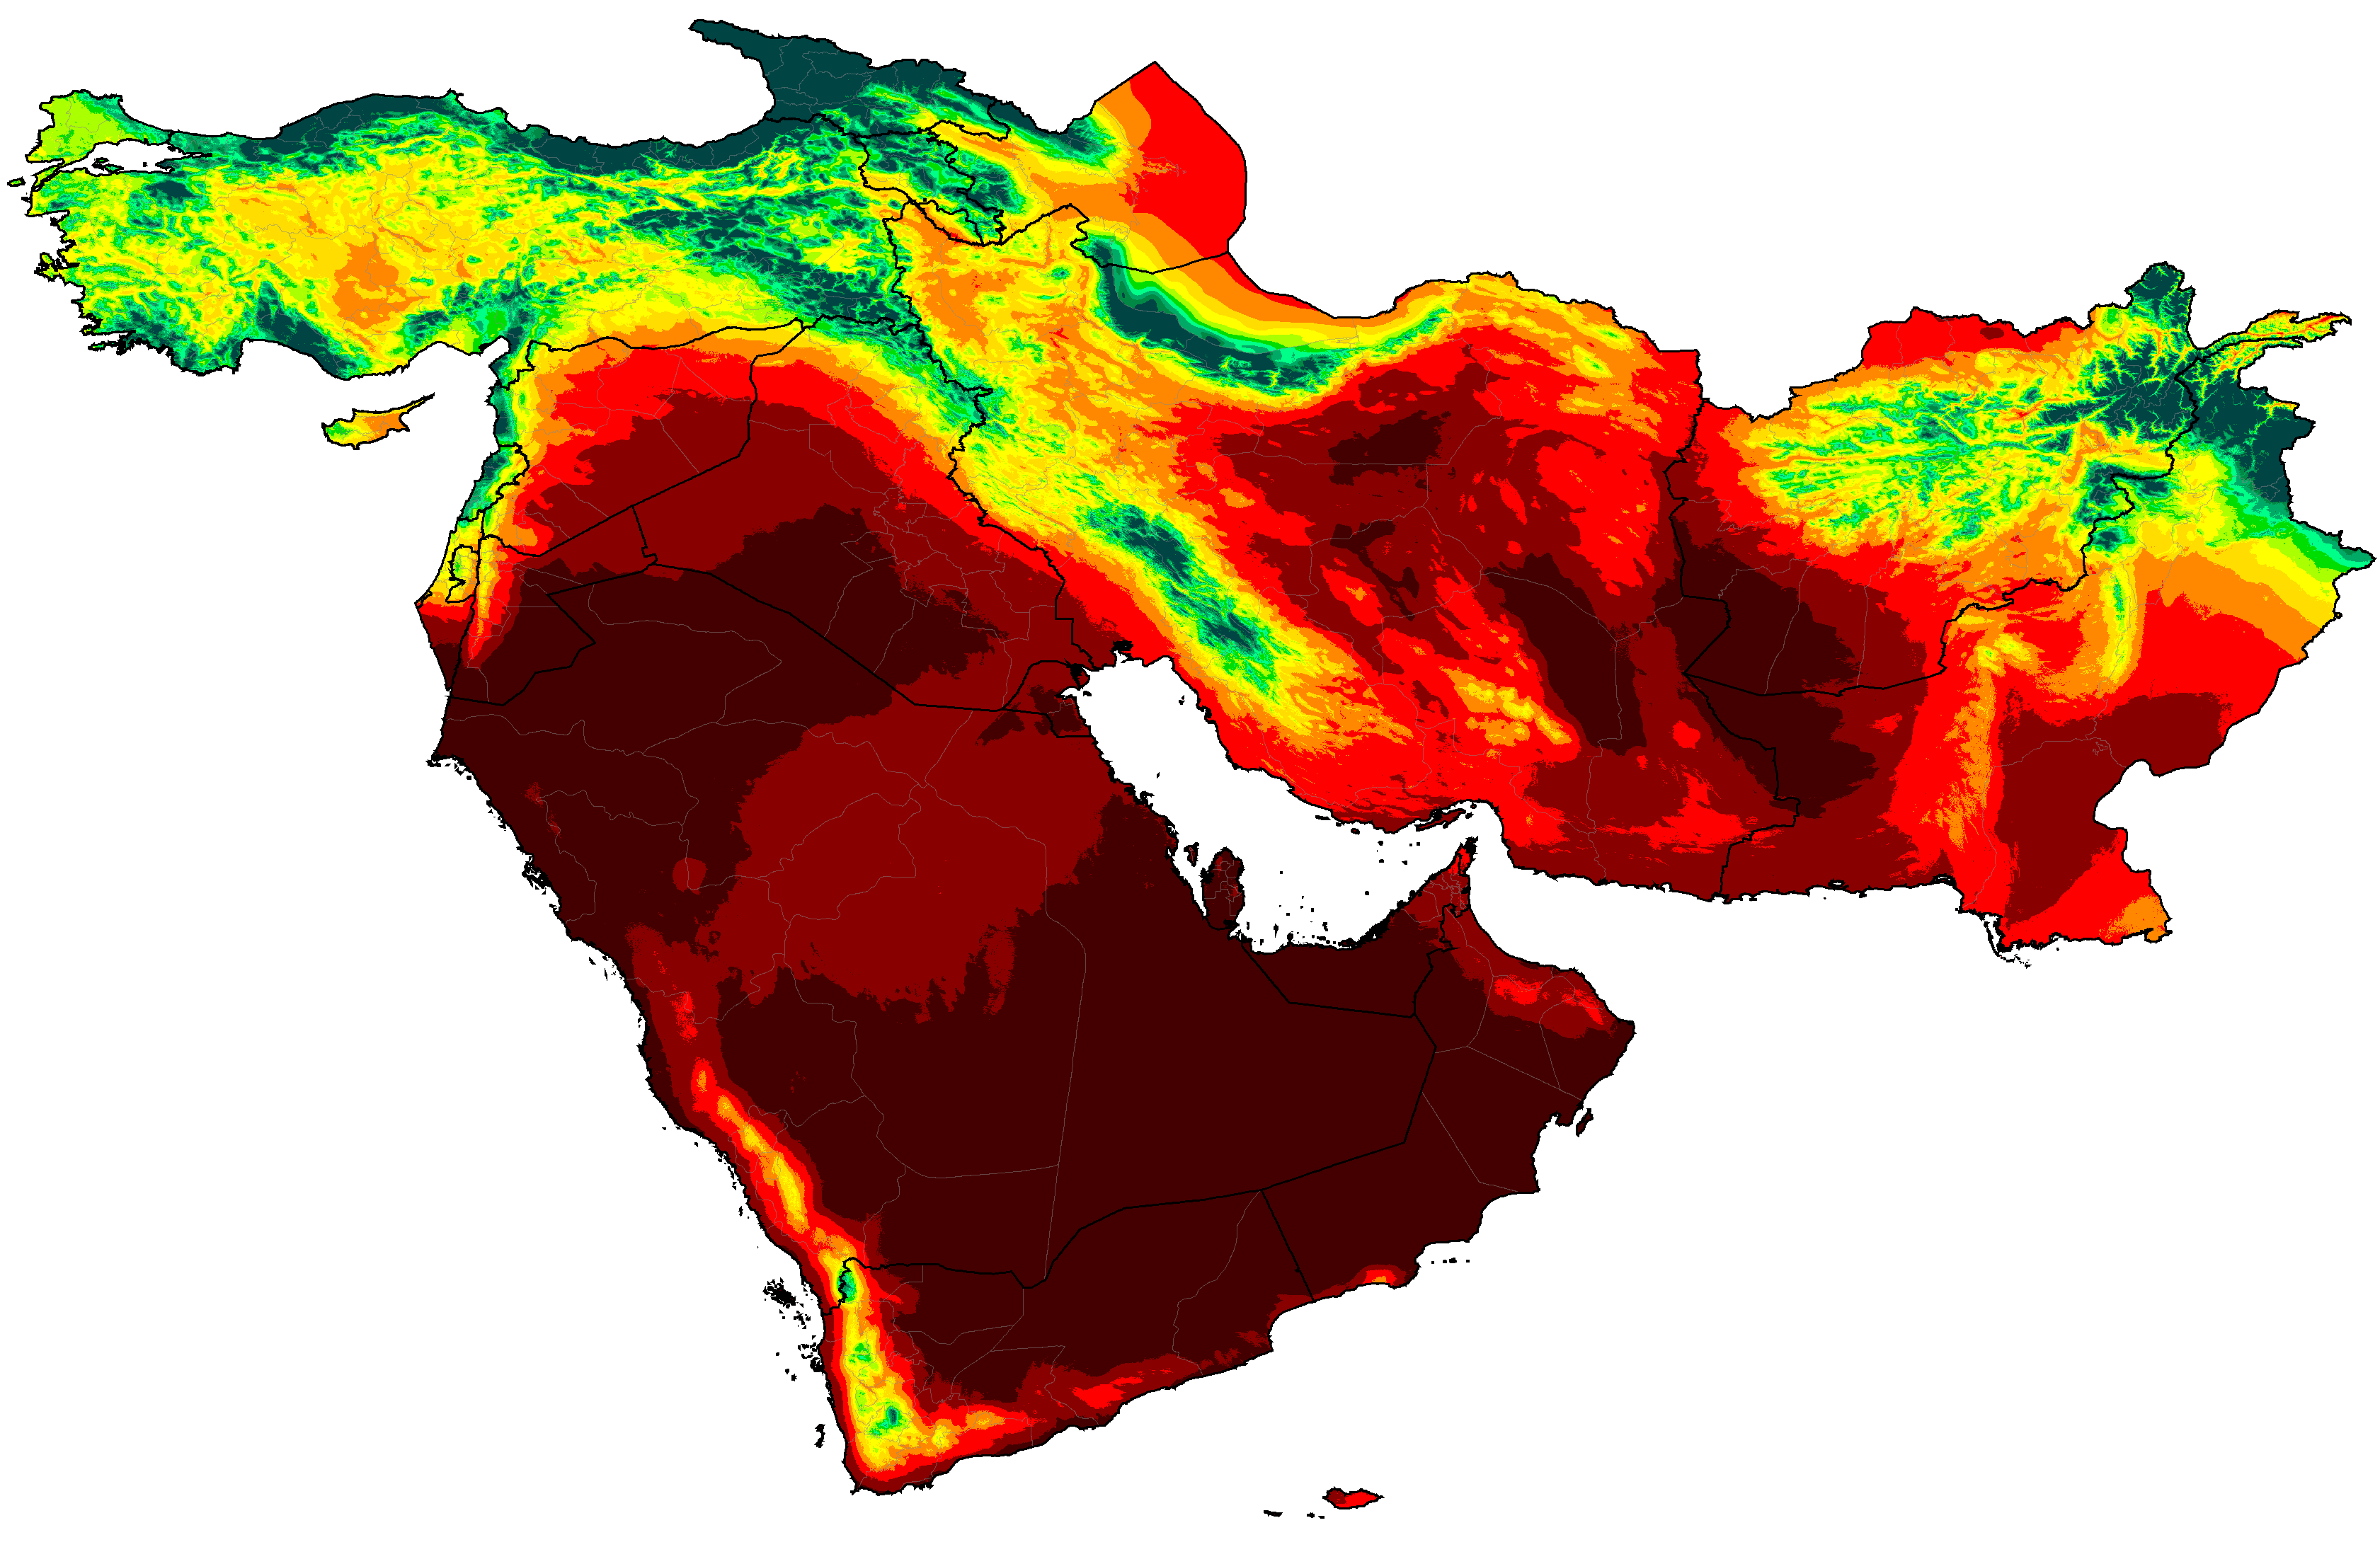
West Asia distribution of aridity categories (projections are SSP5-8.5 high emissions normals)
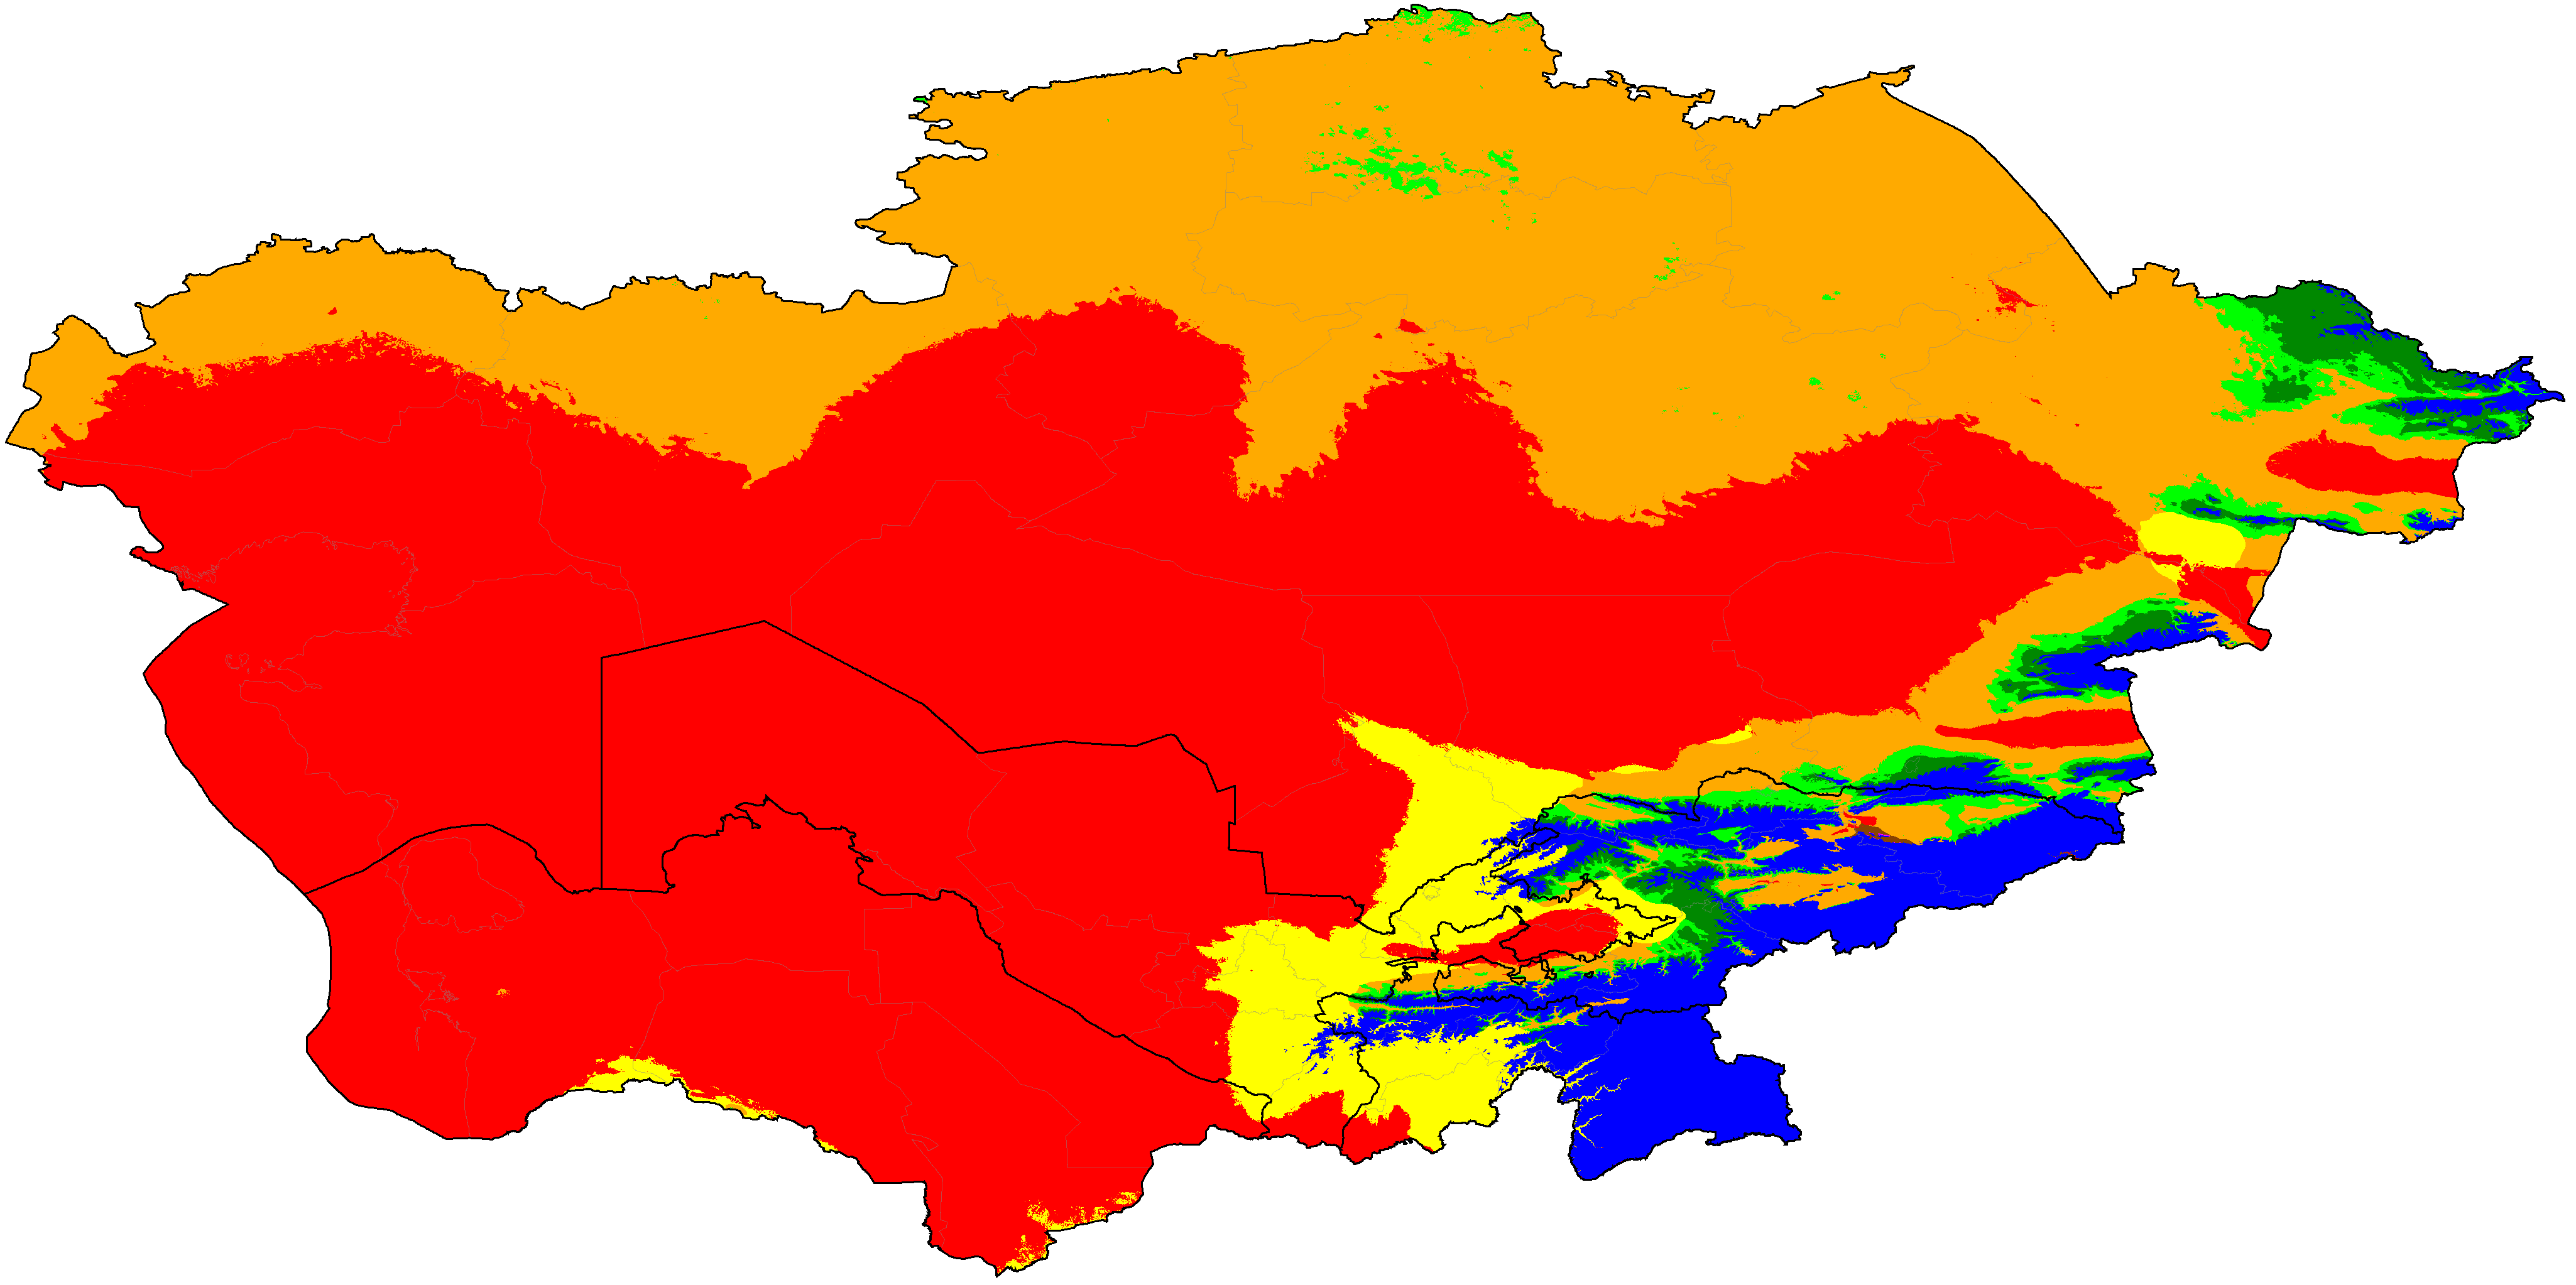
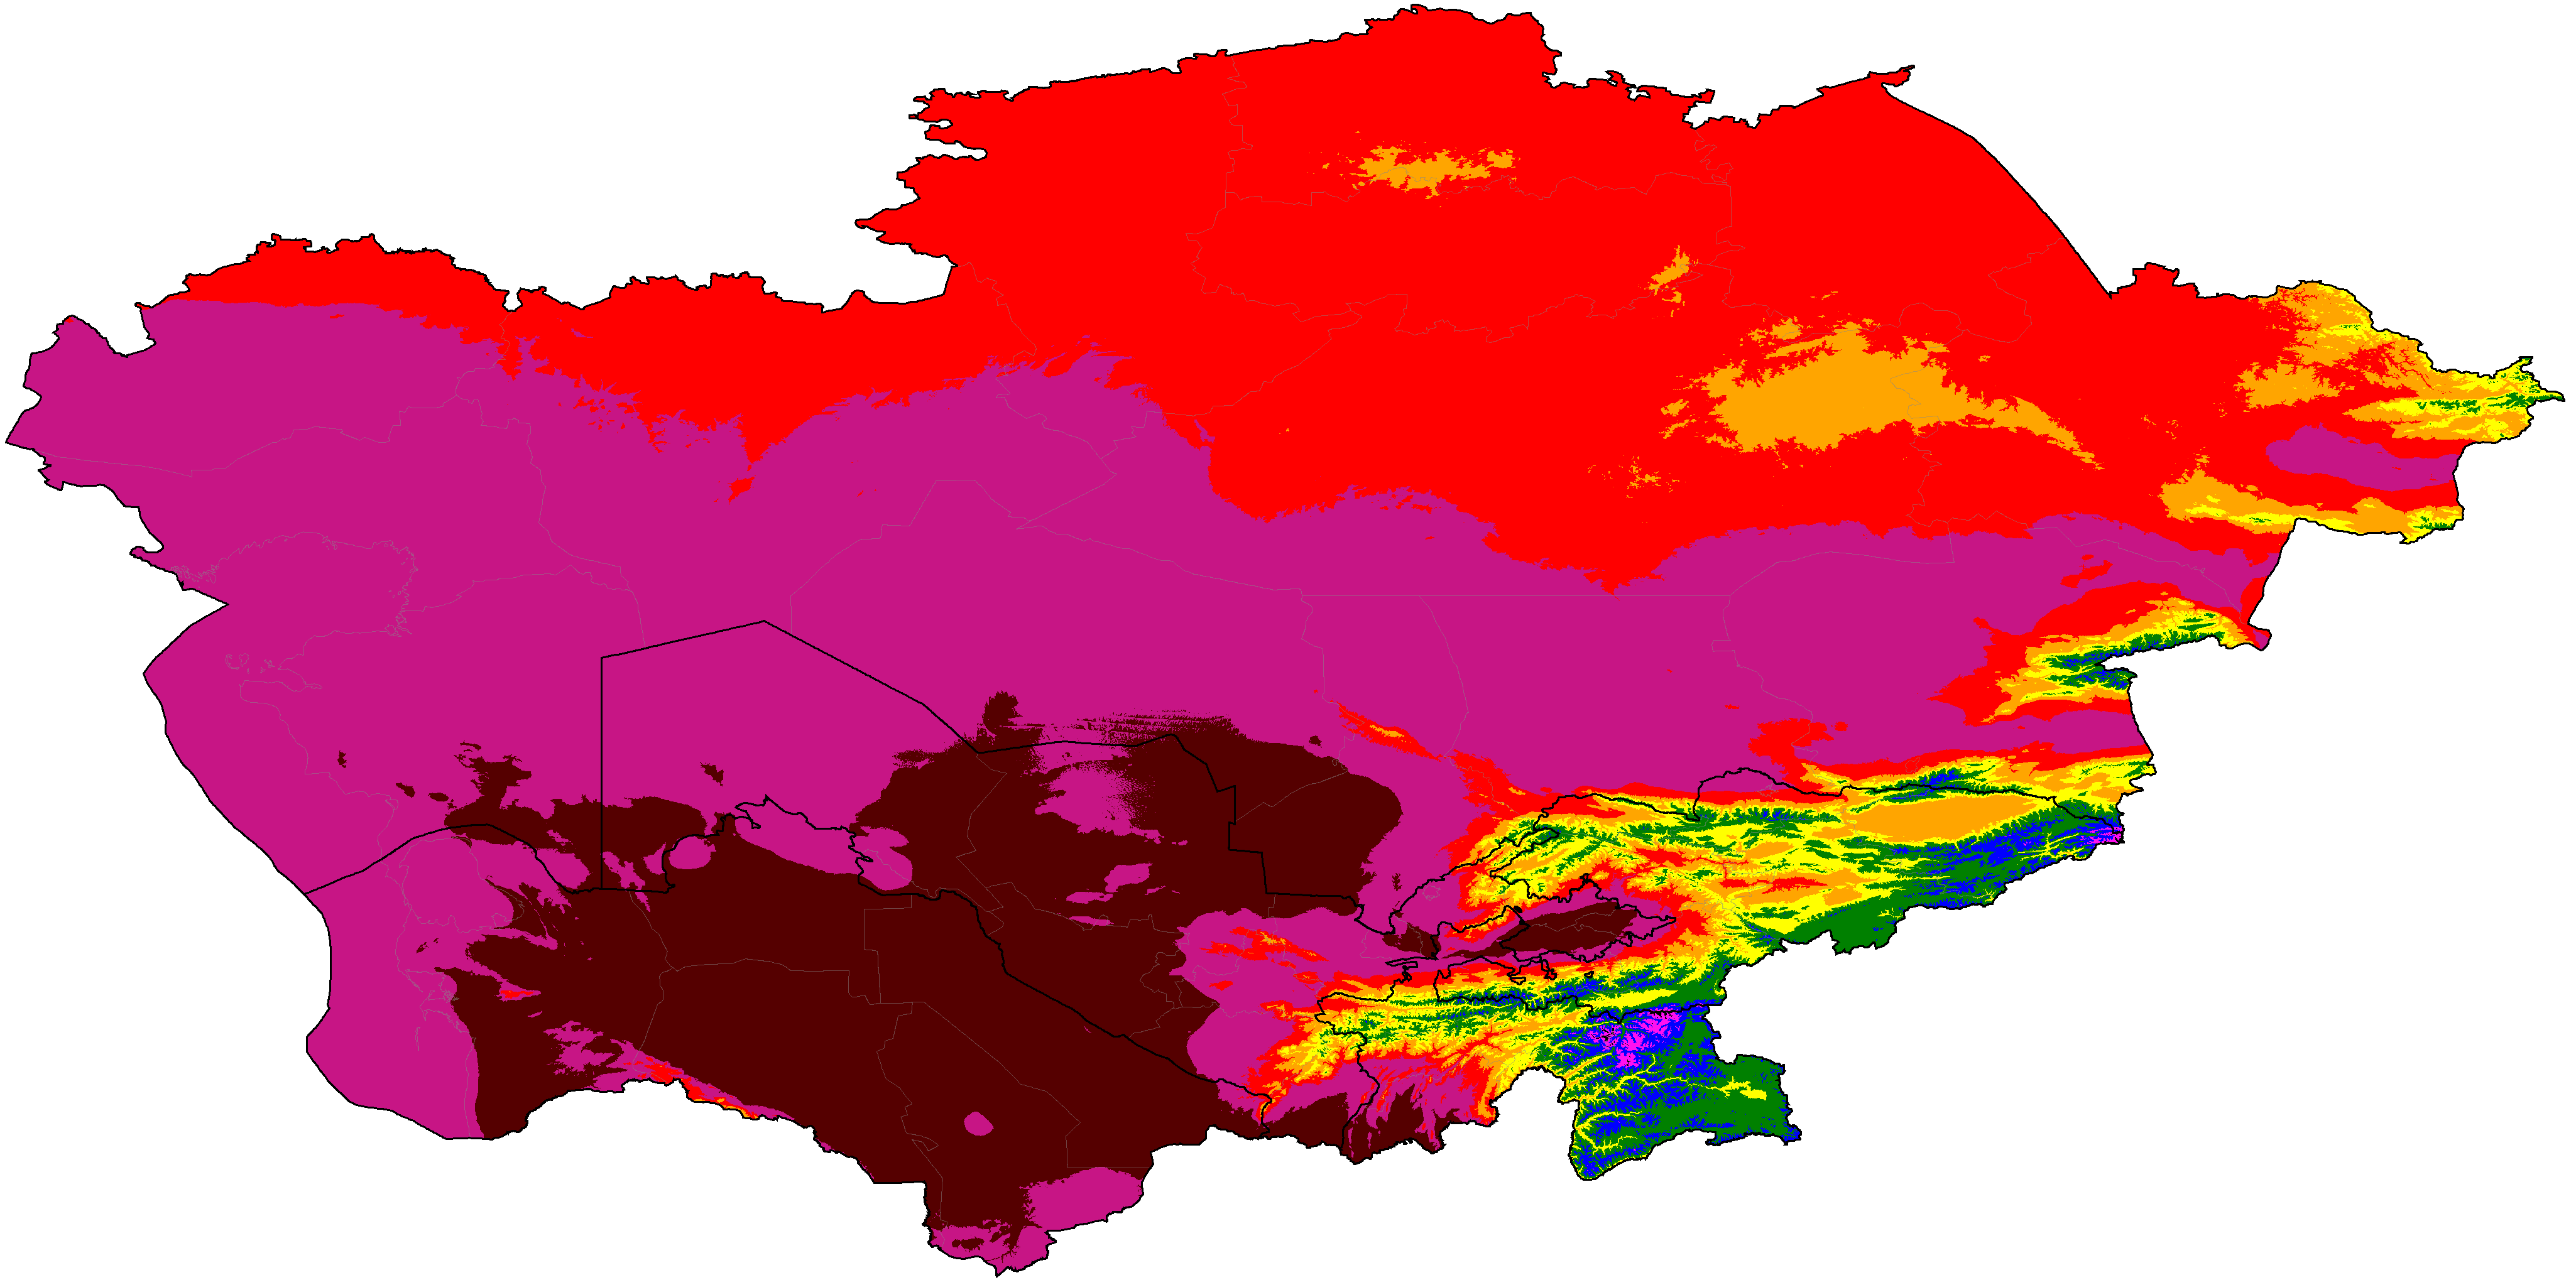
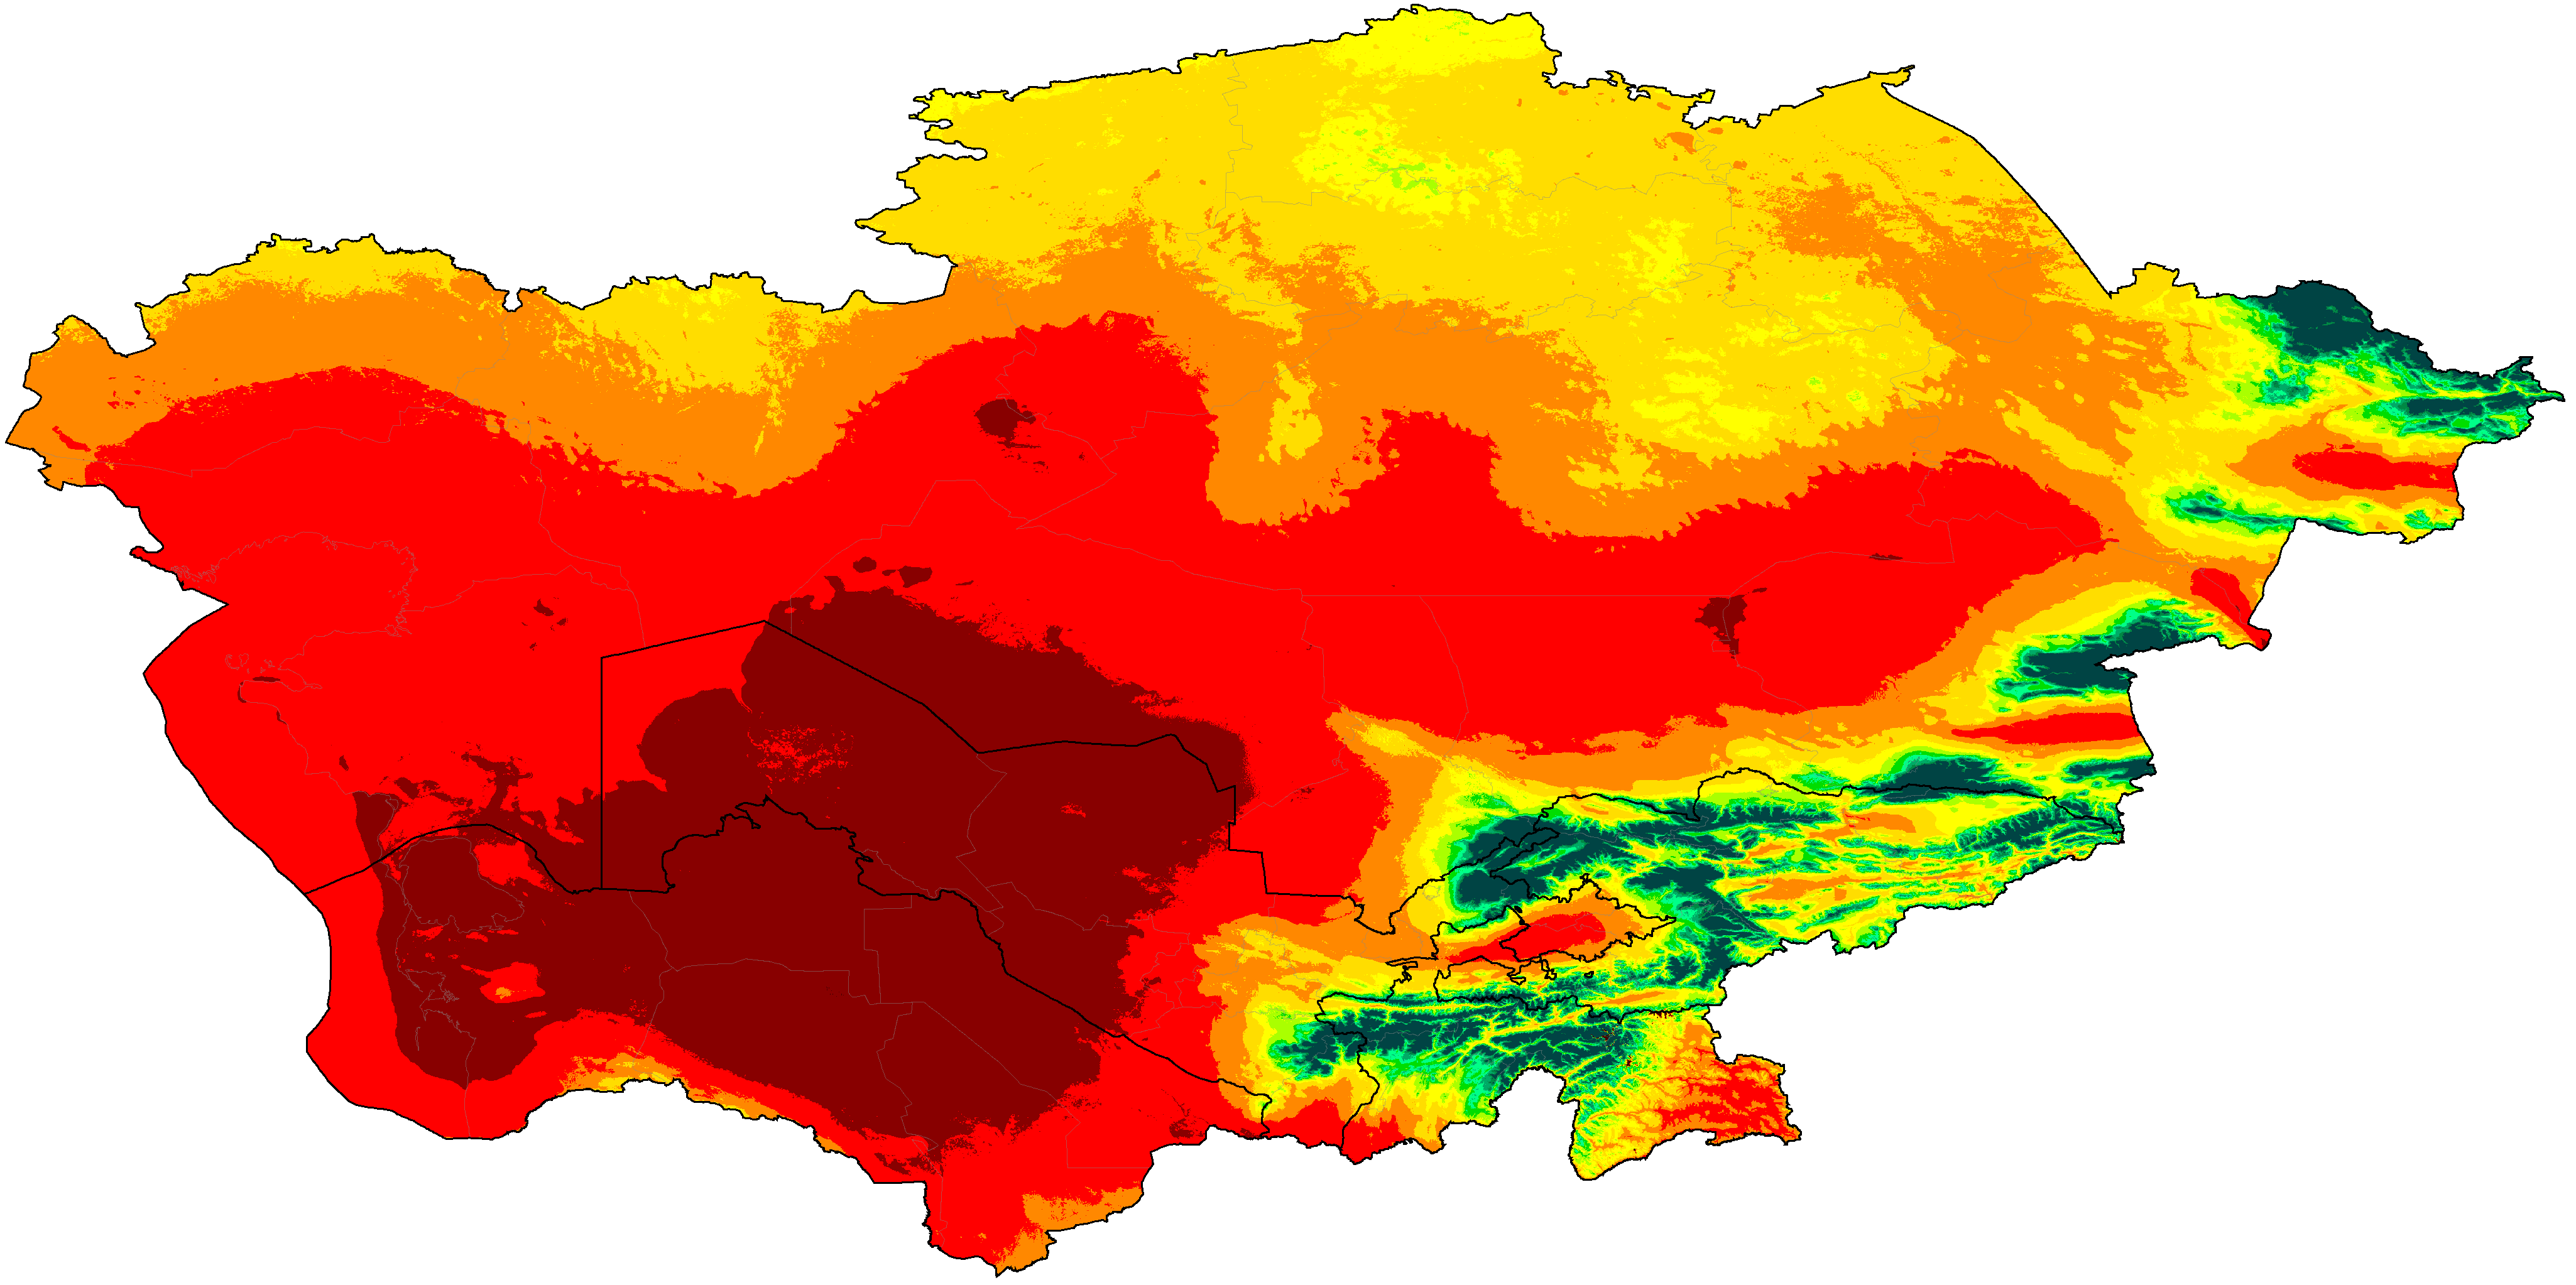
Central Asia distribution of aridity categories (projections are SSP5-8.5 high emissions normals)
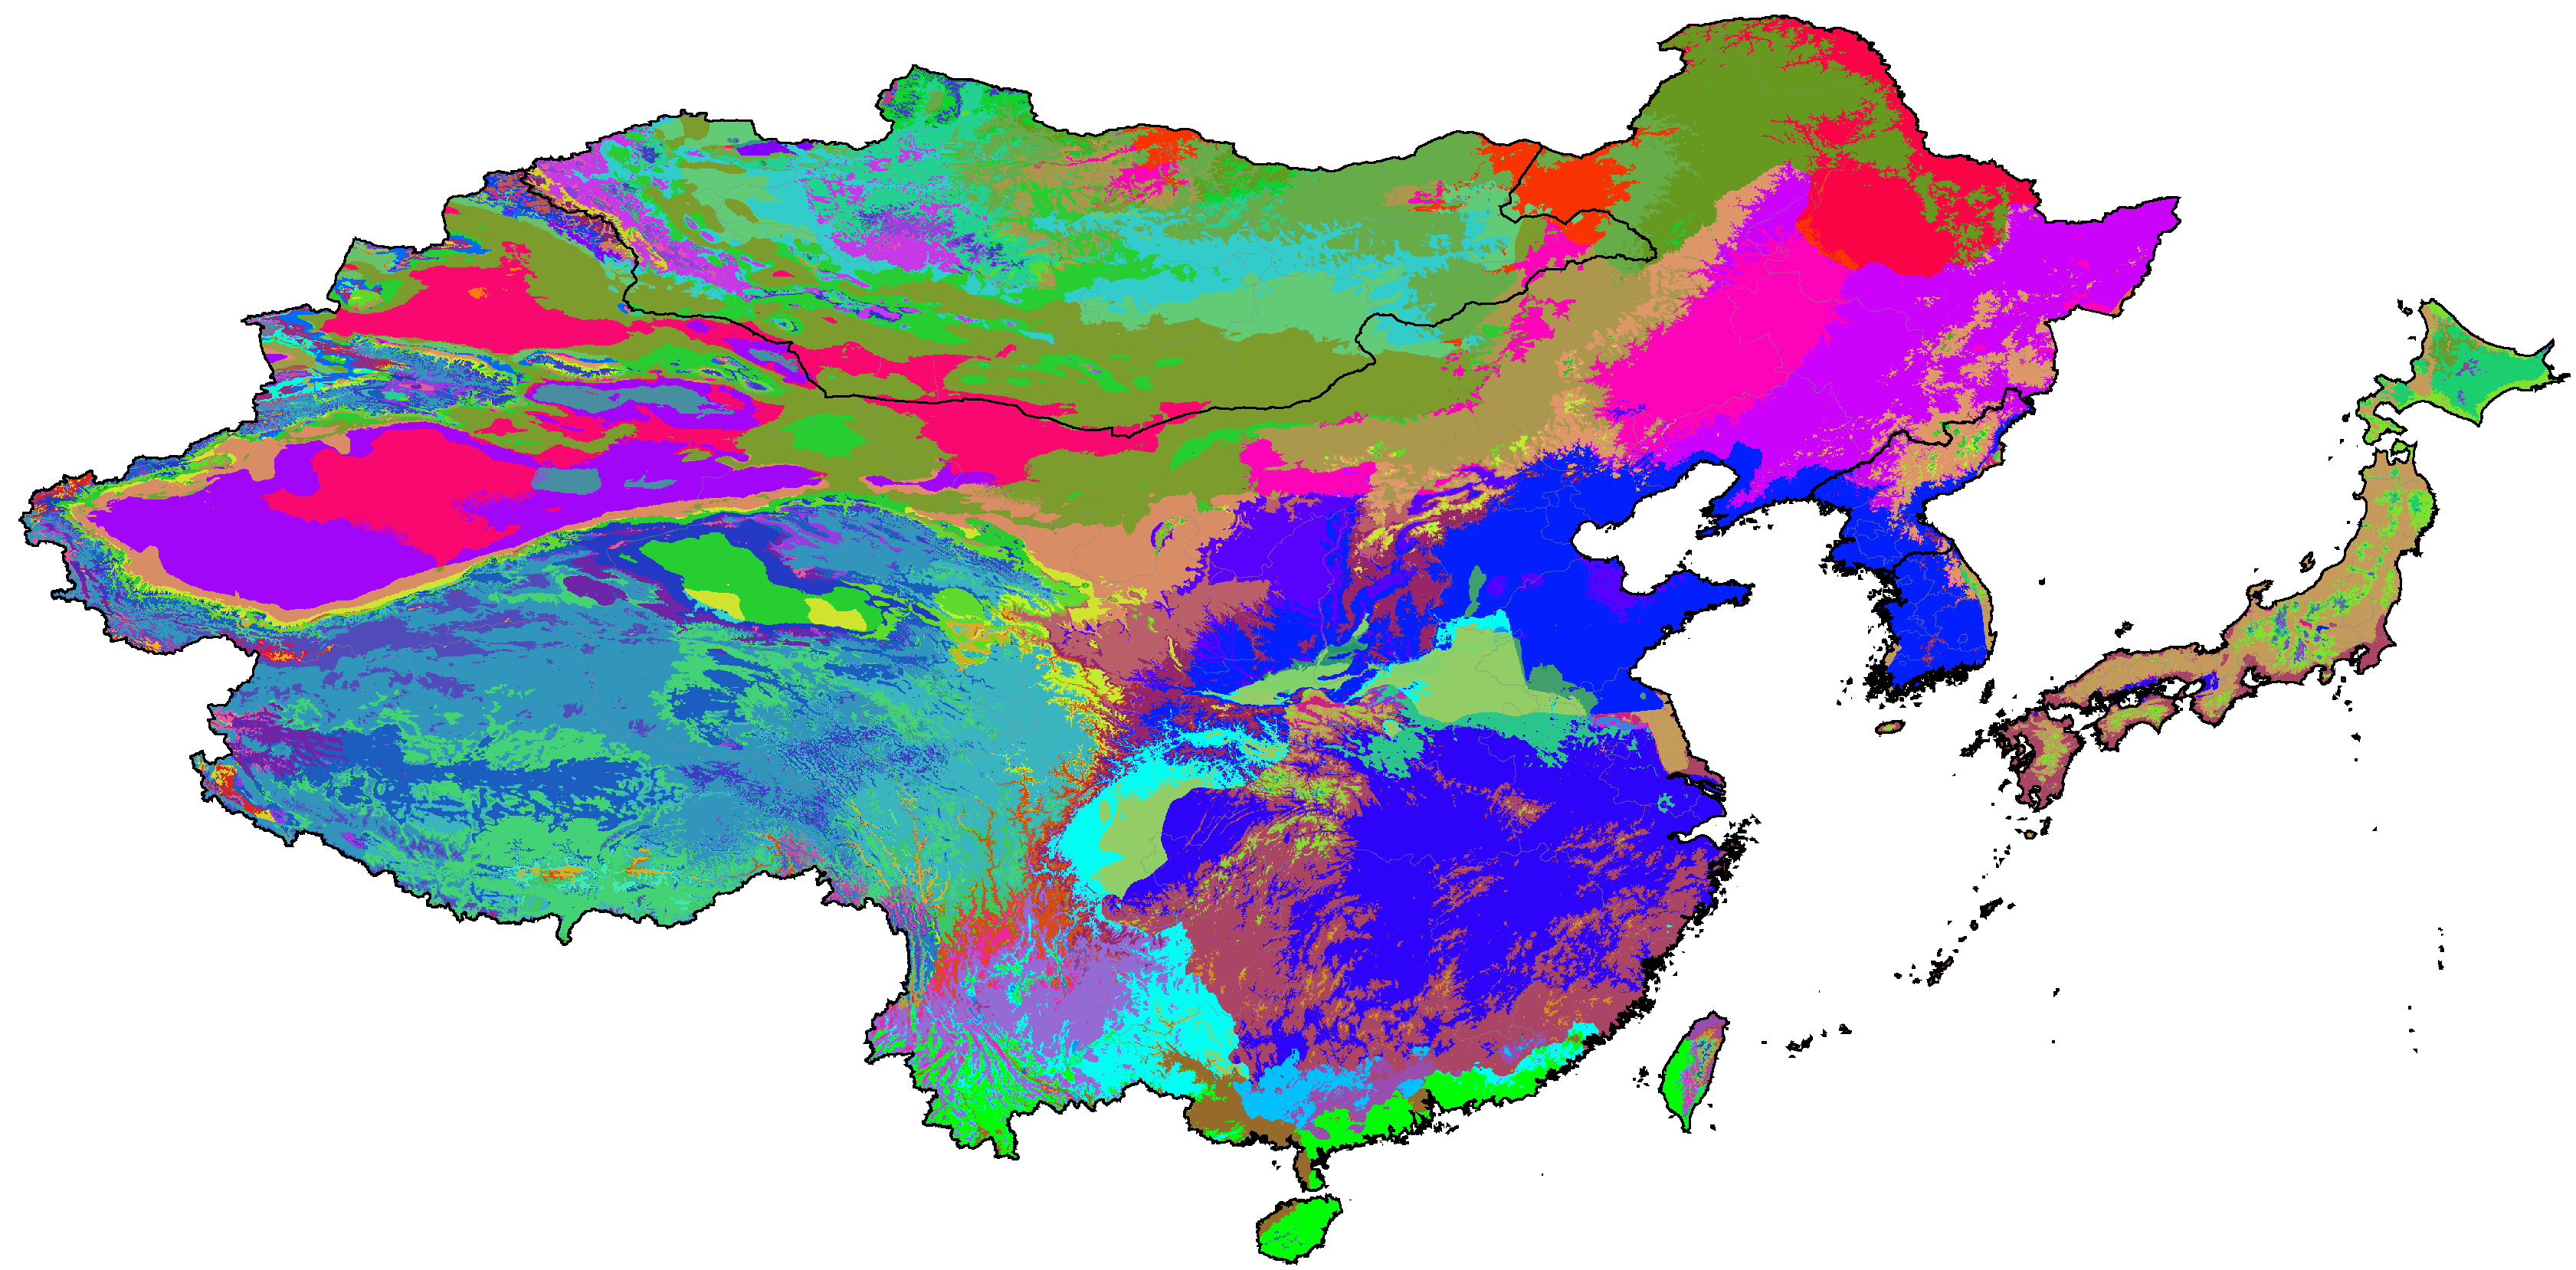
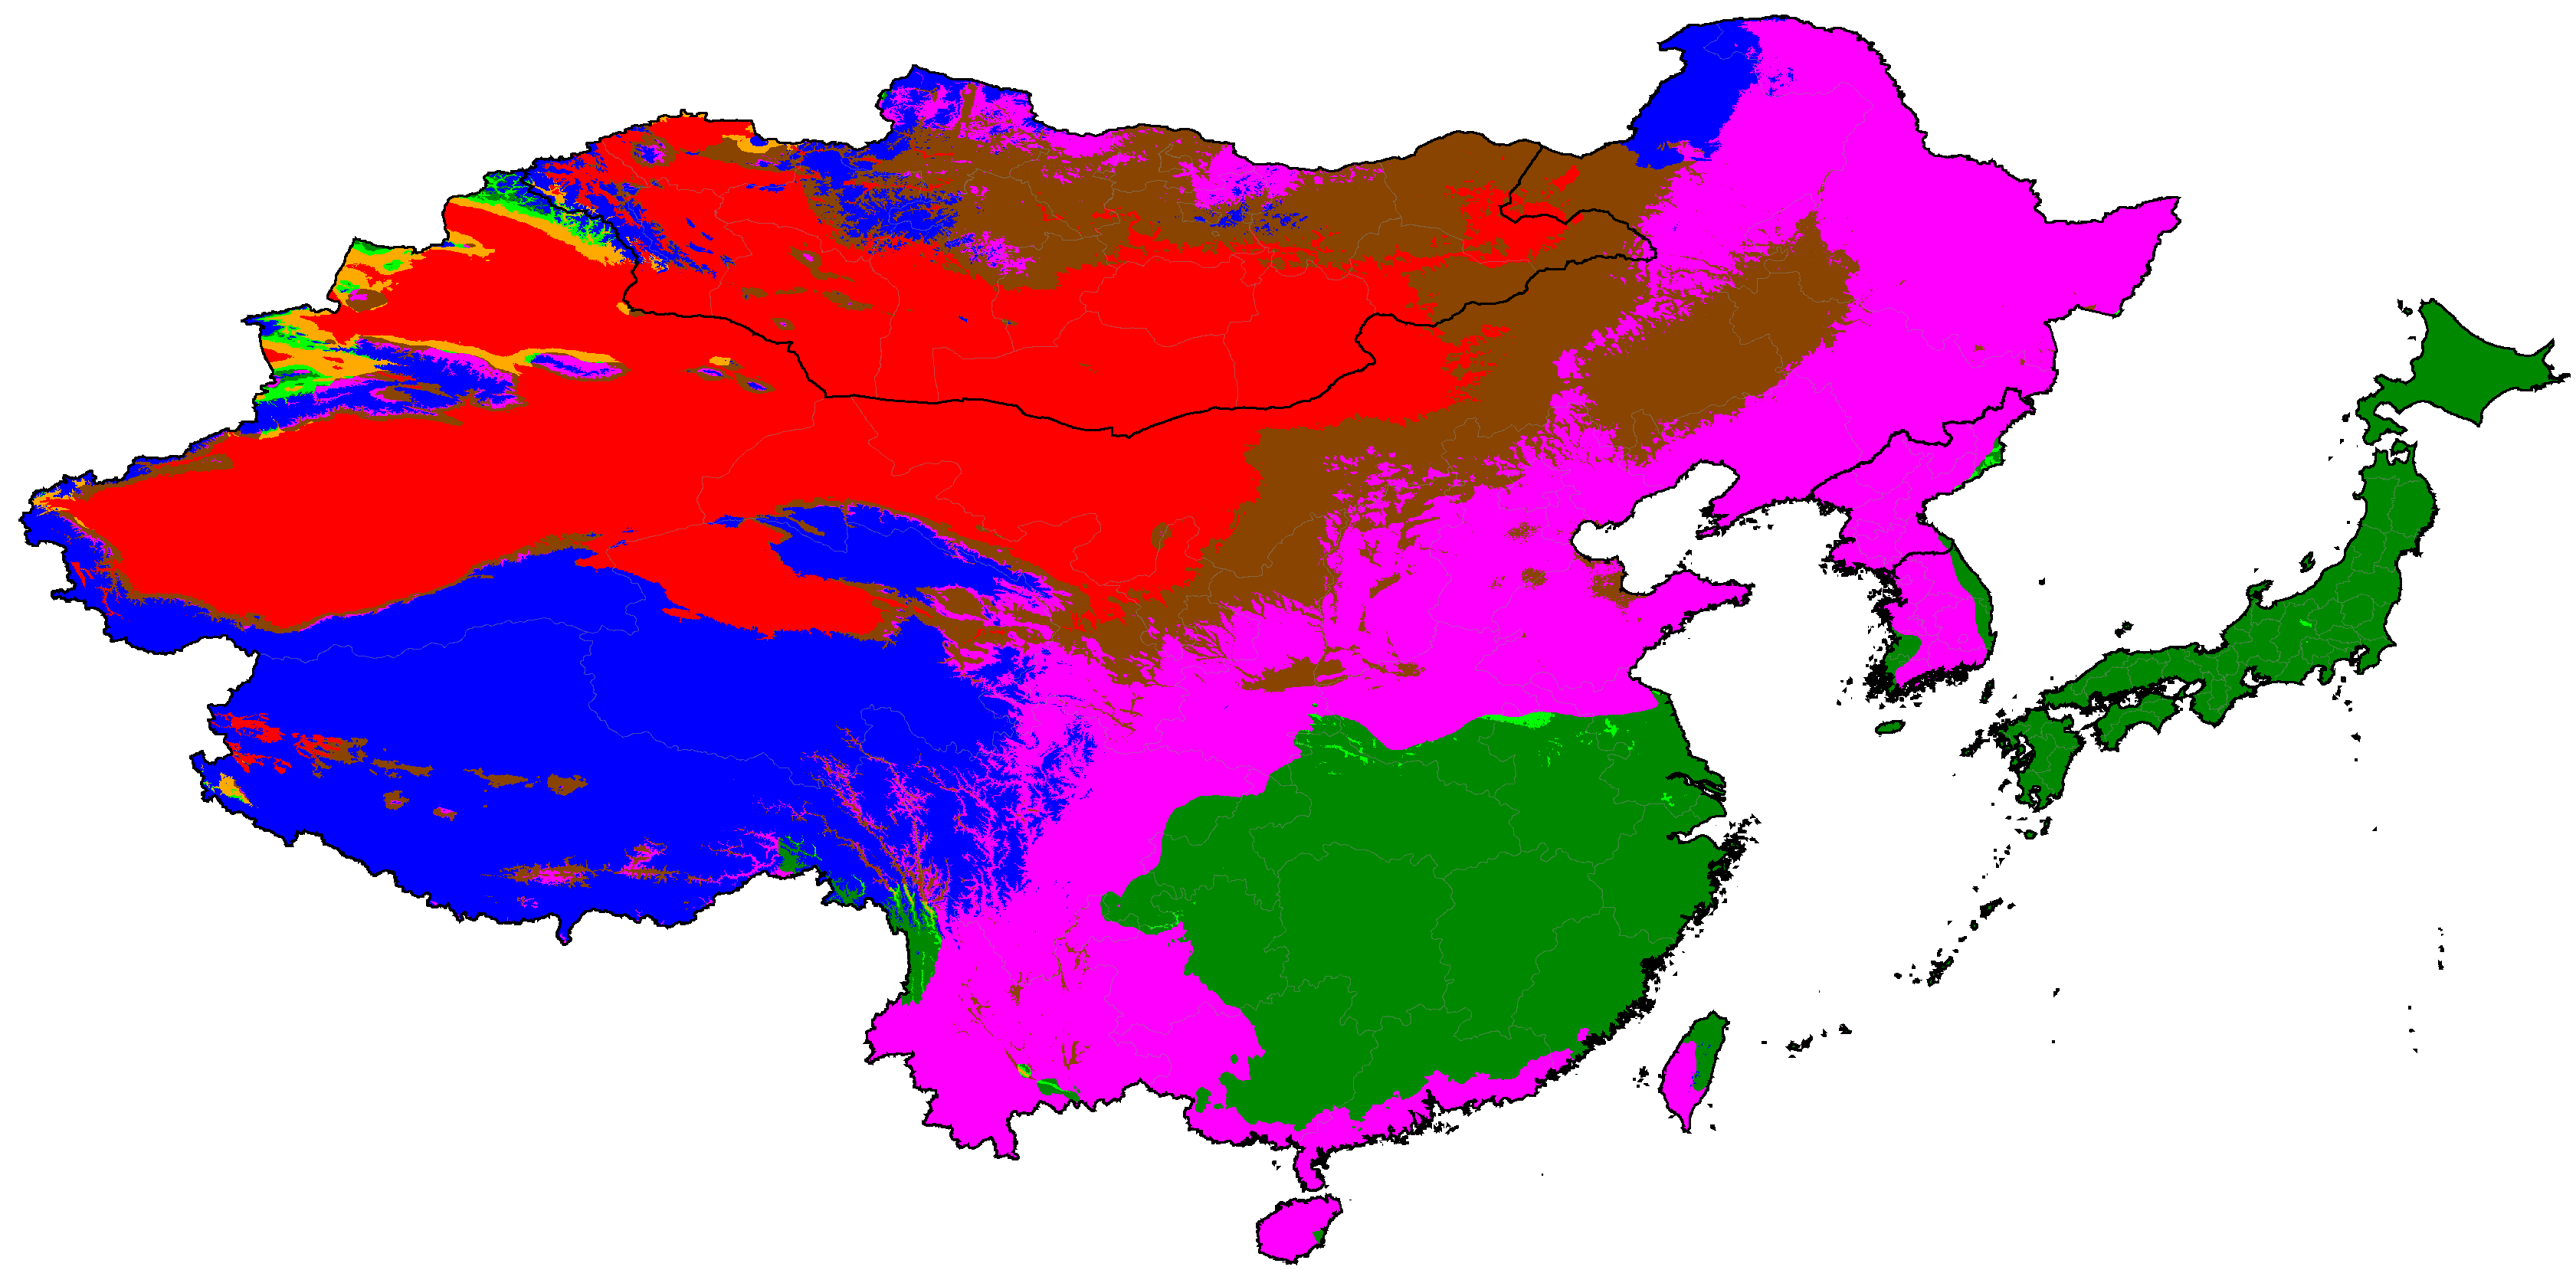
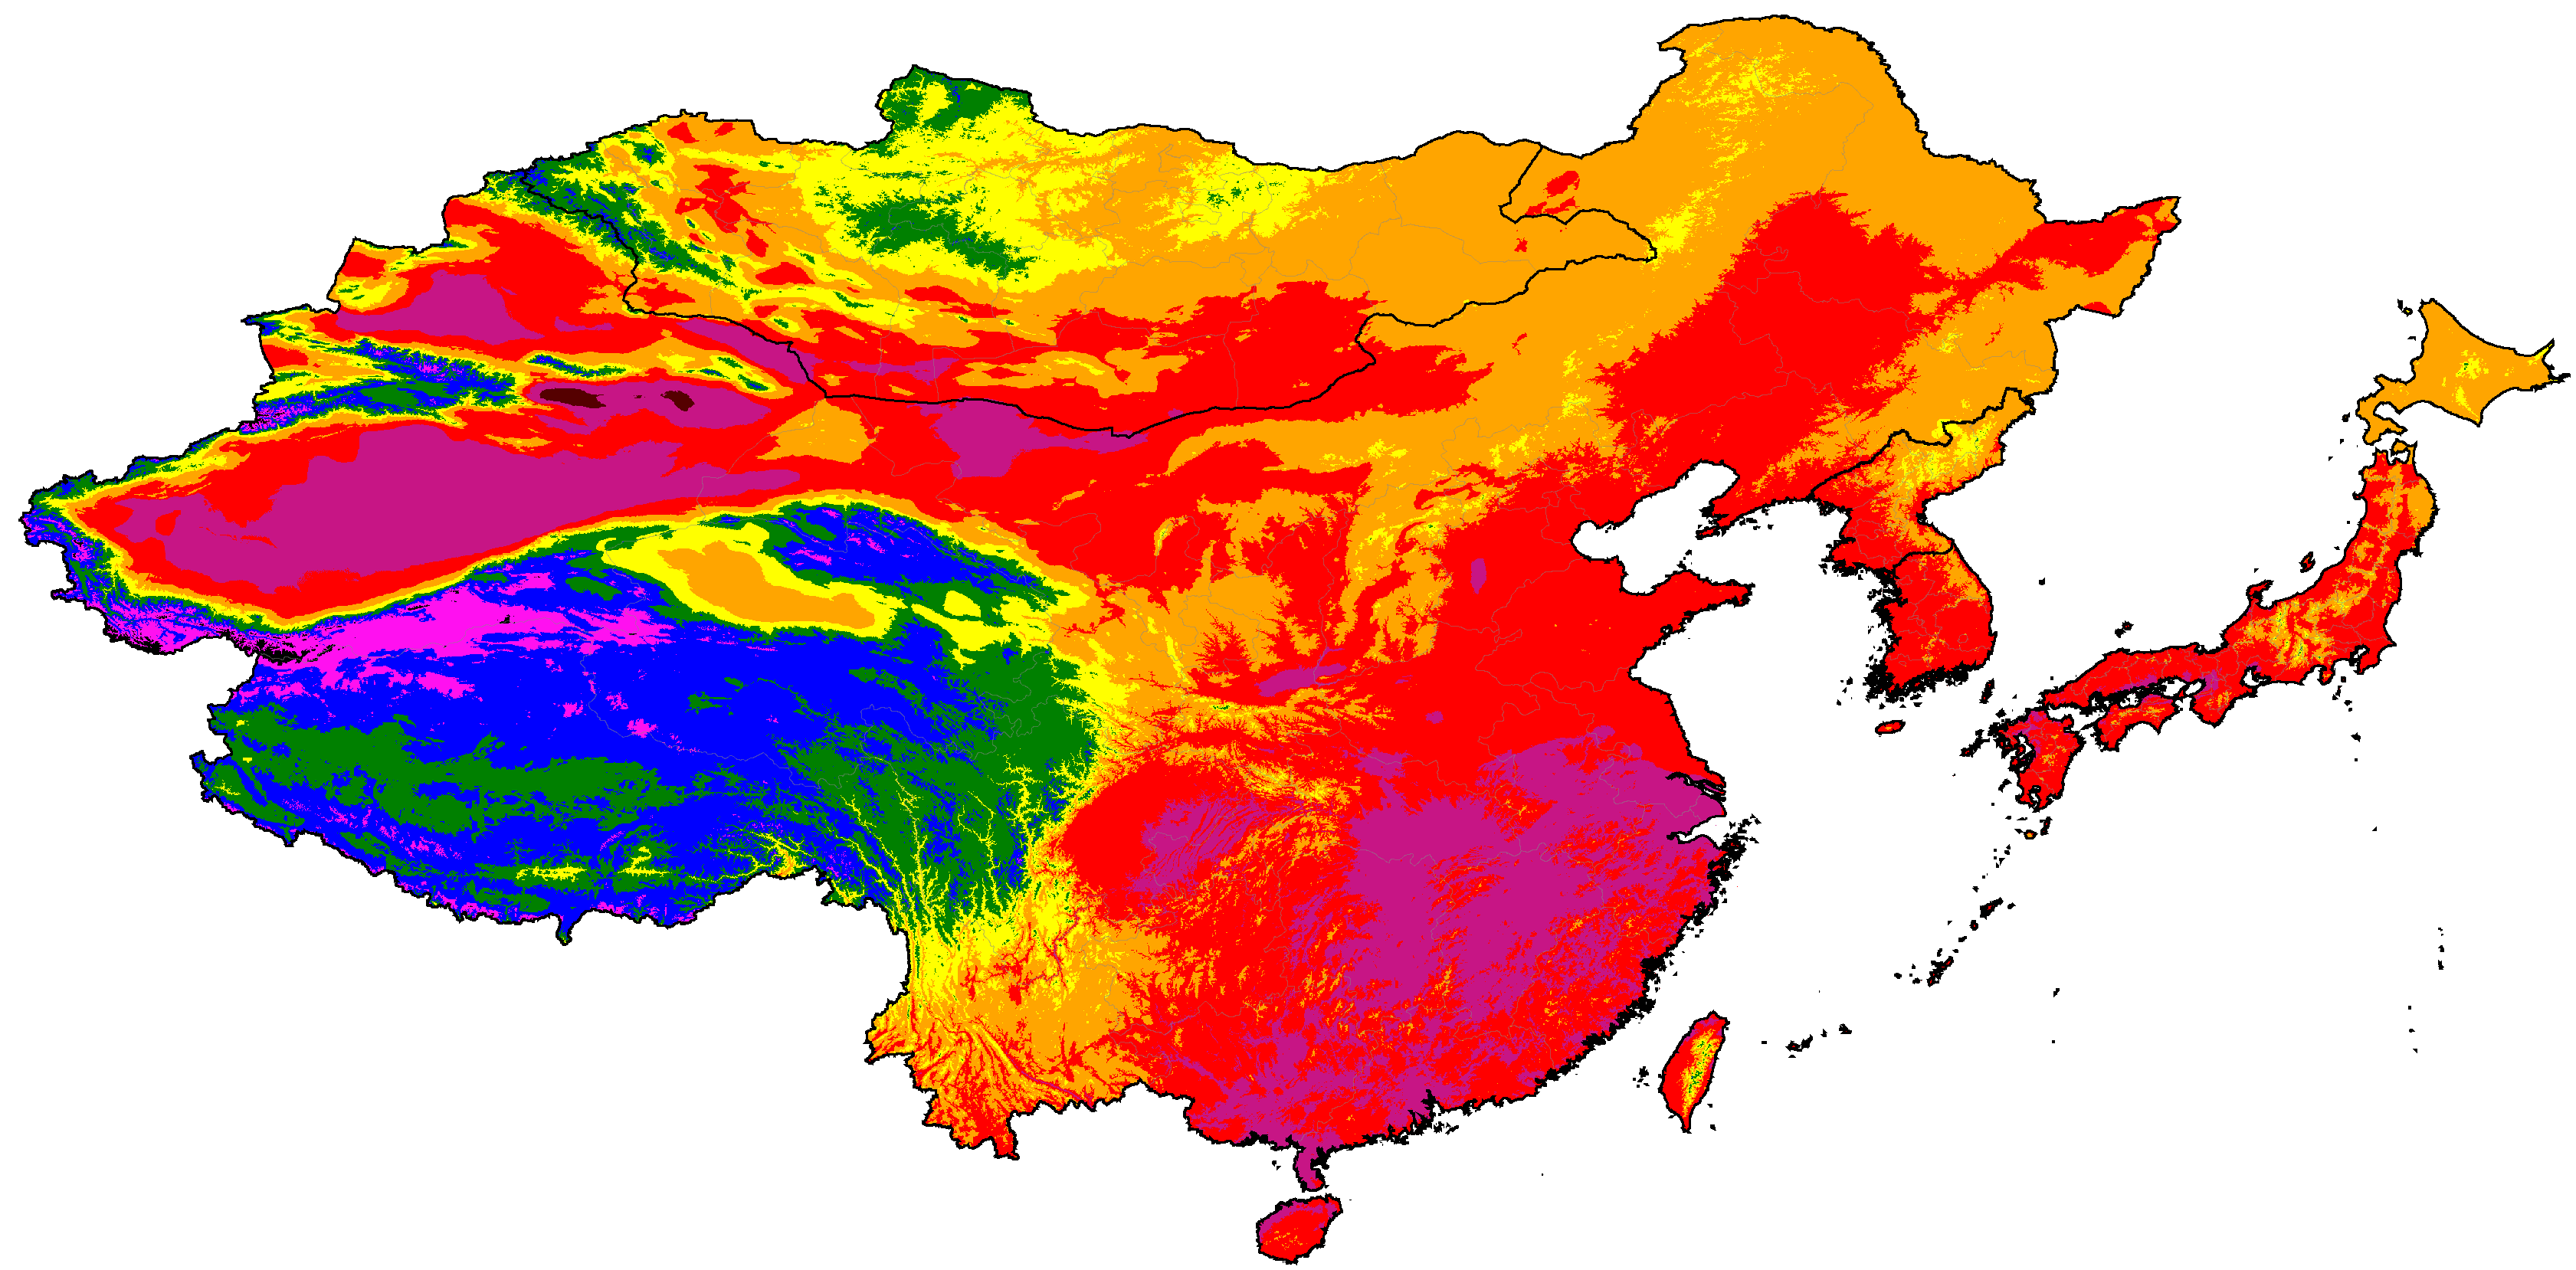
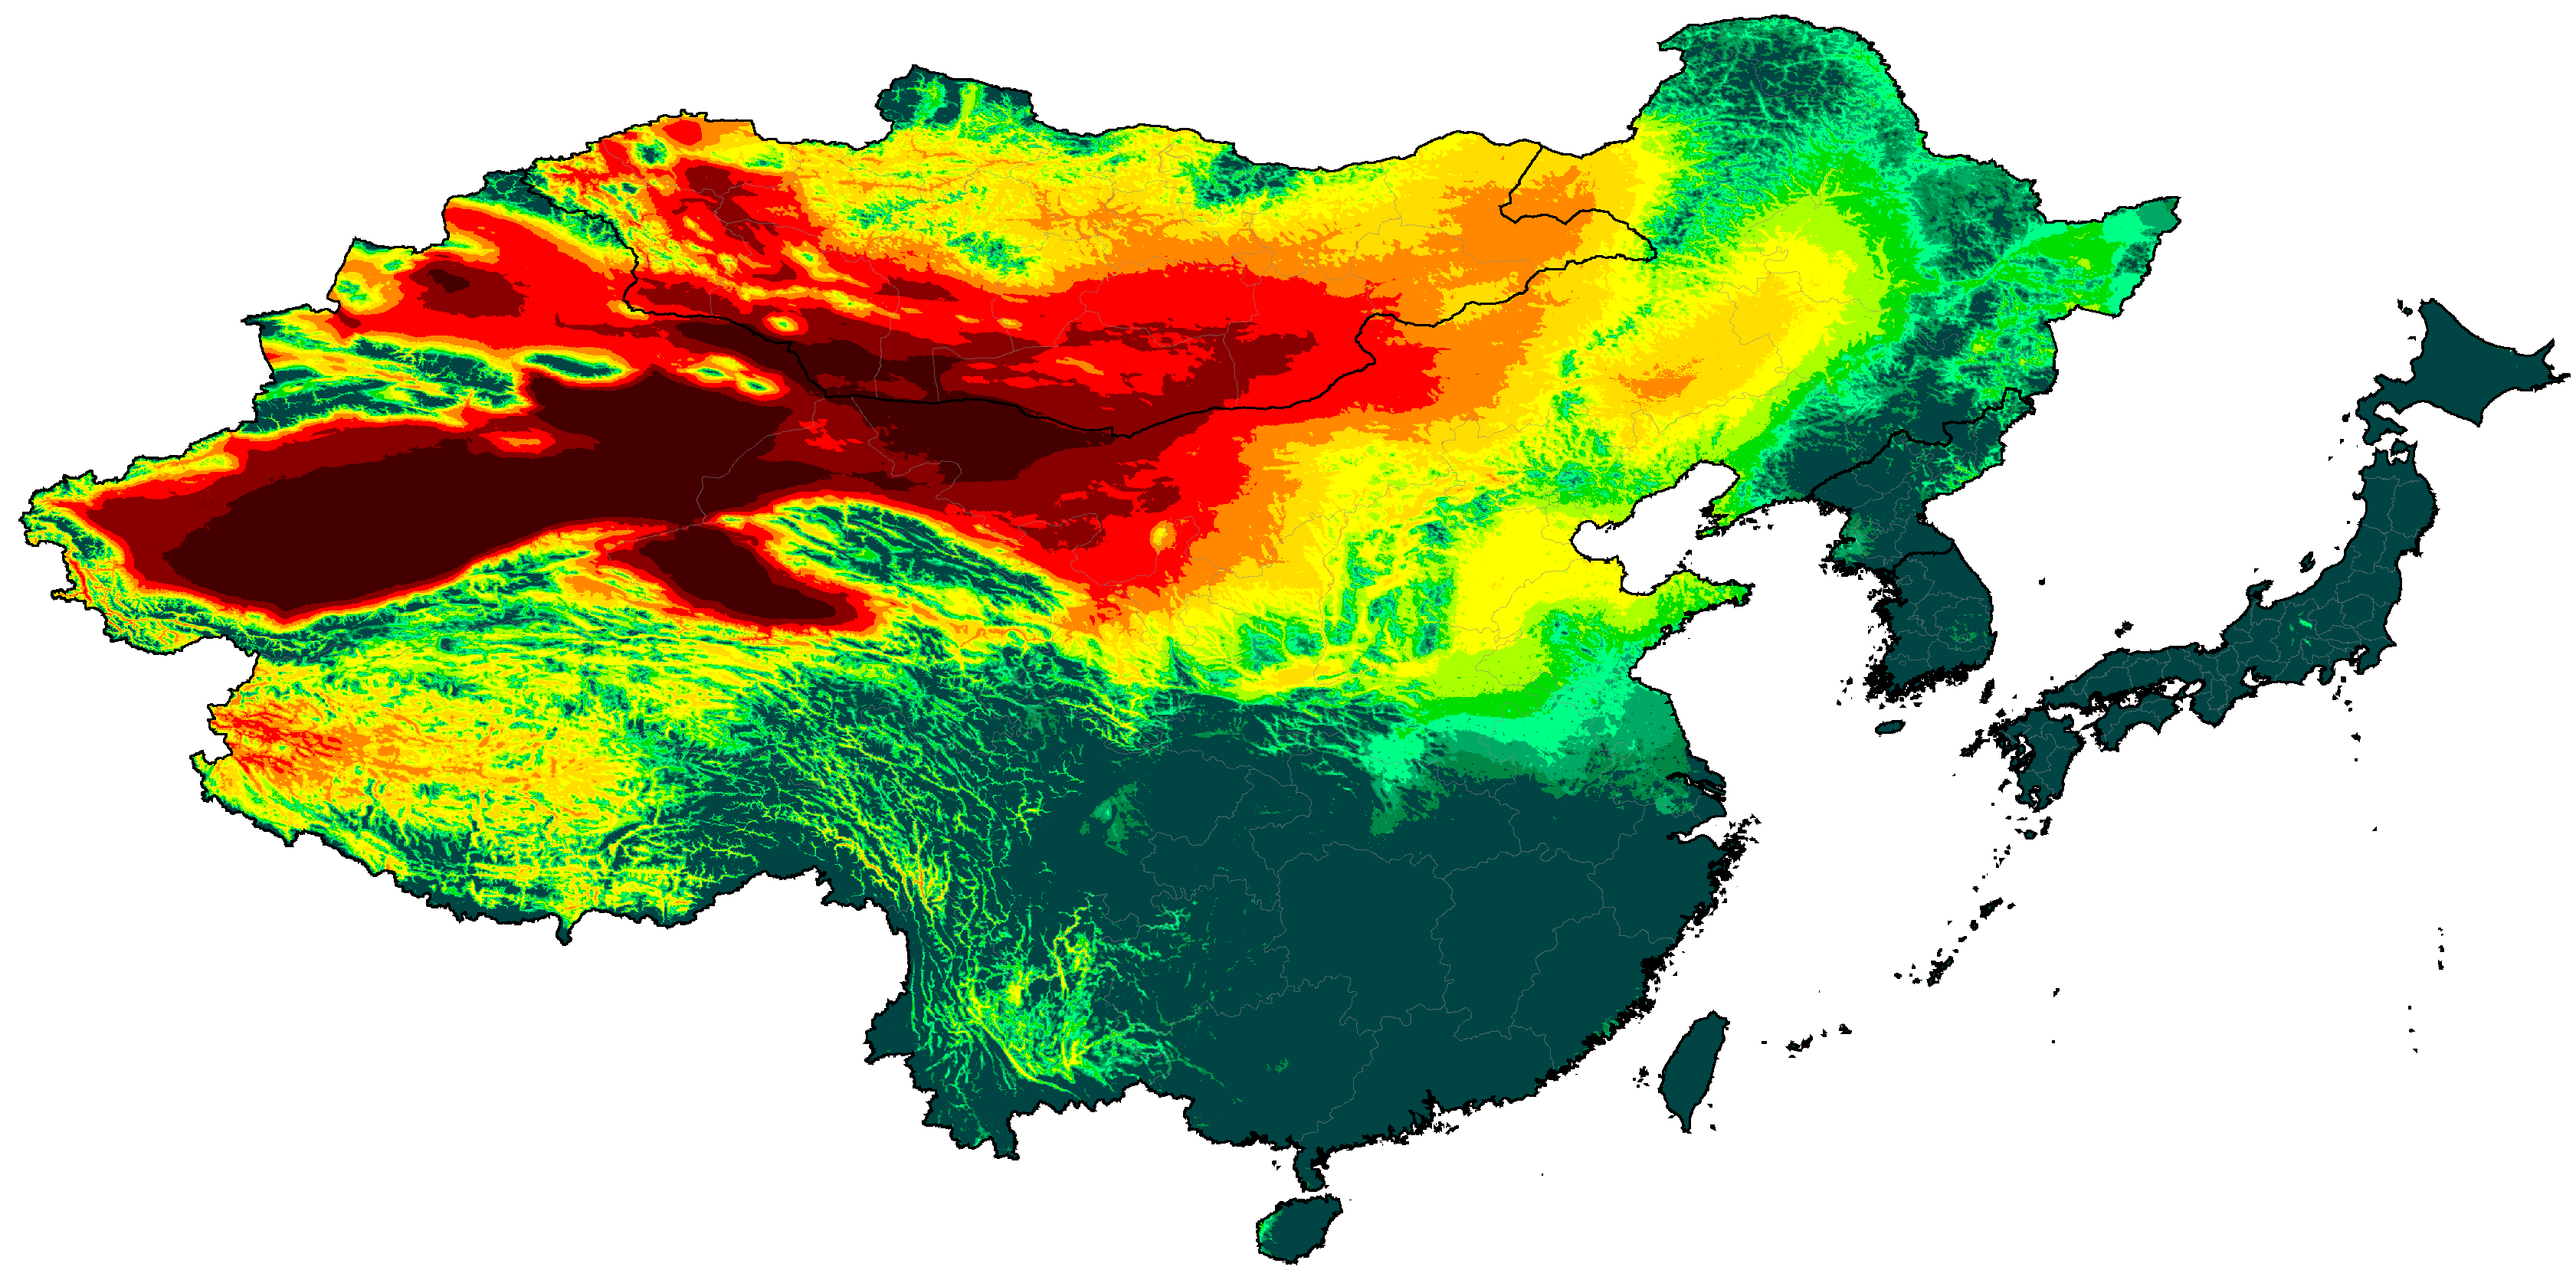
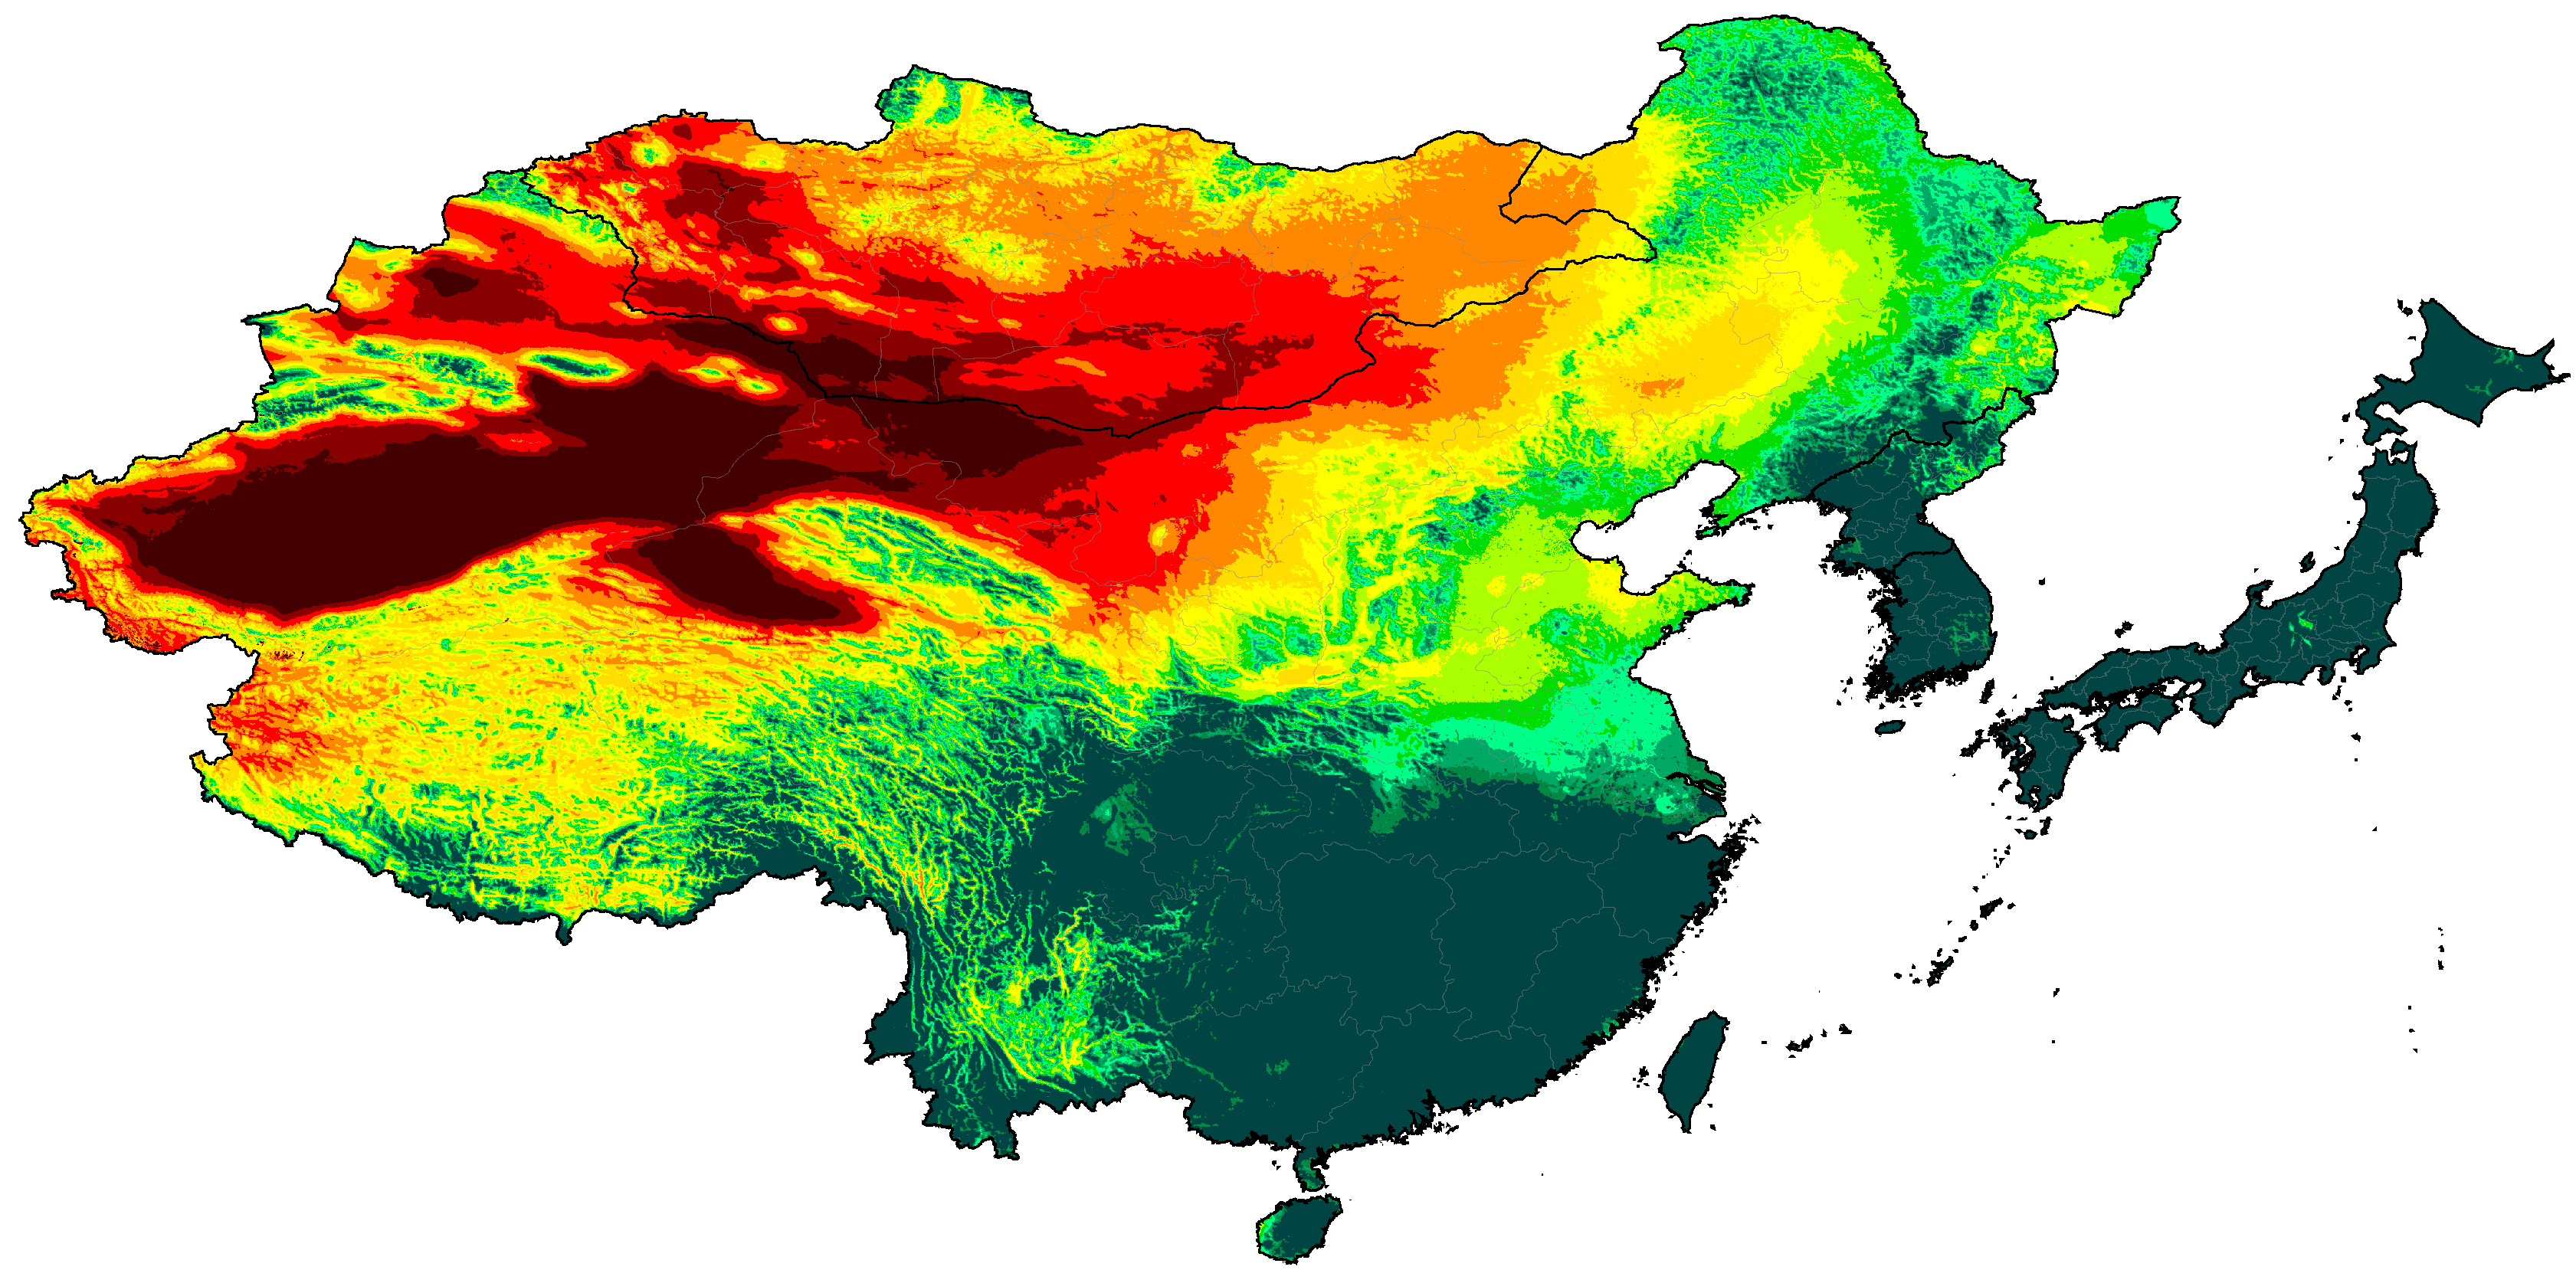
East Asia distribution of aridity categories (projections are SSP5-8.5 high emissions normals)
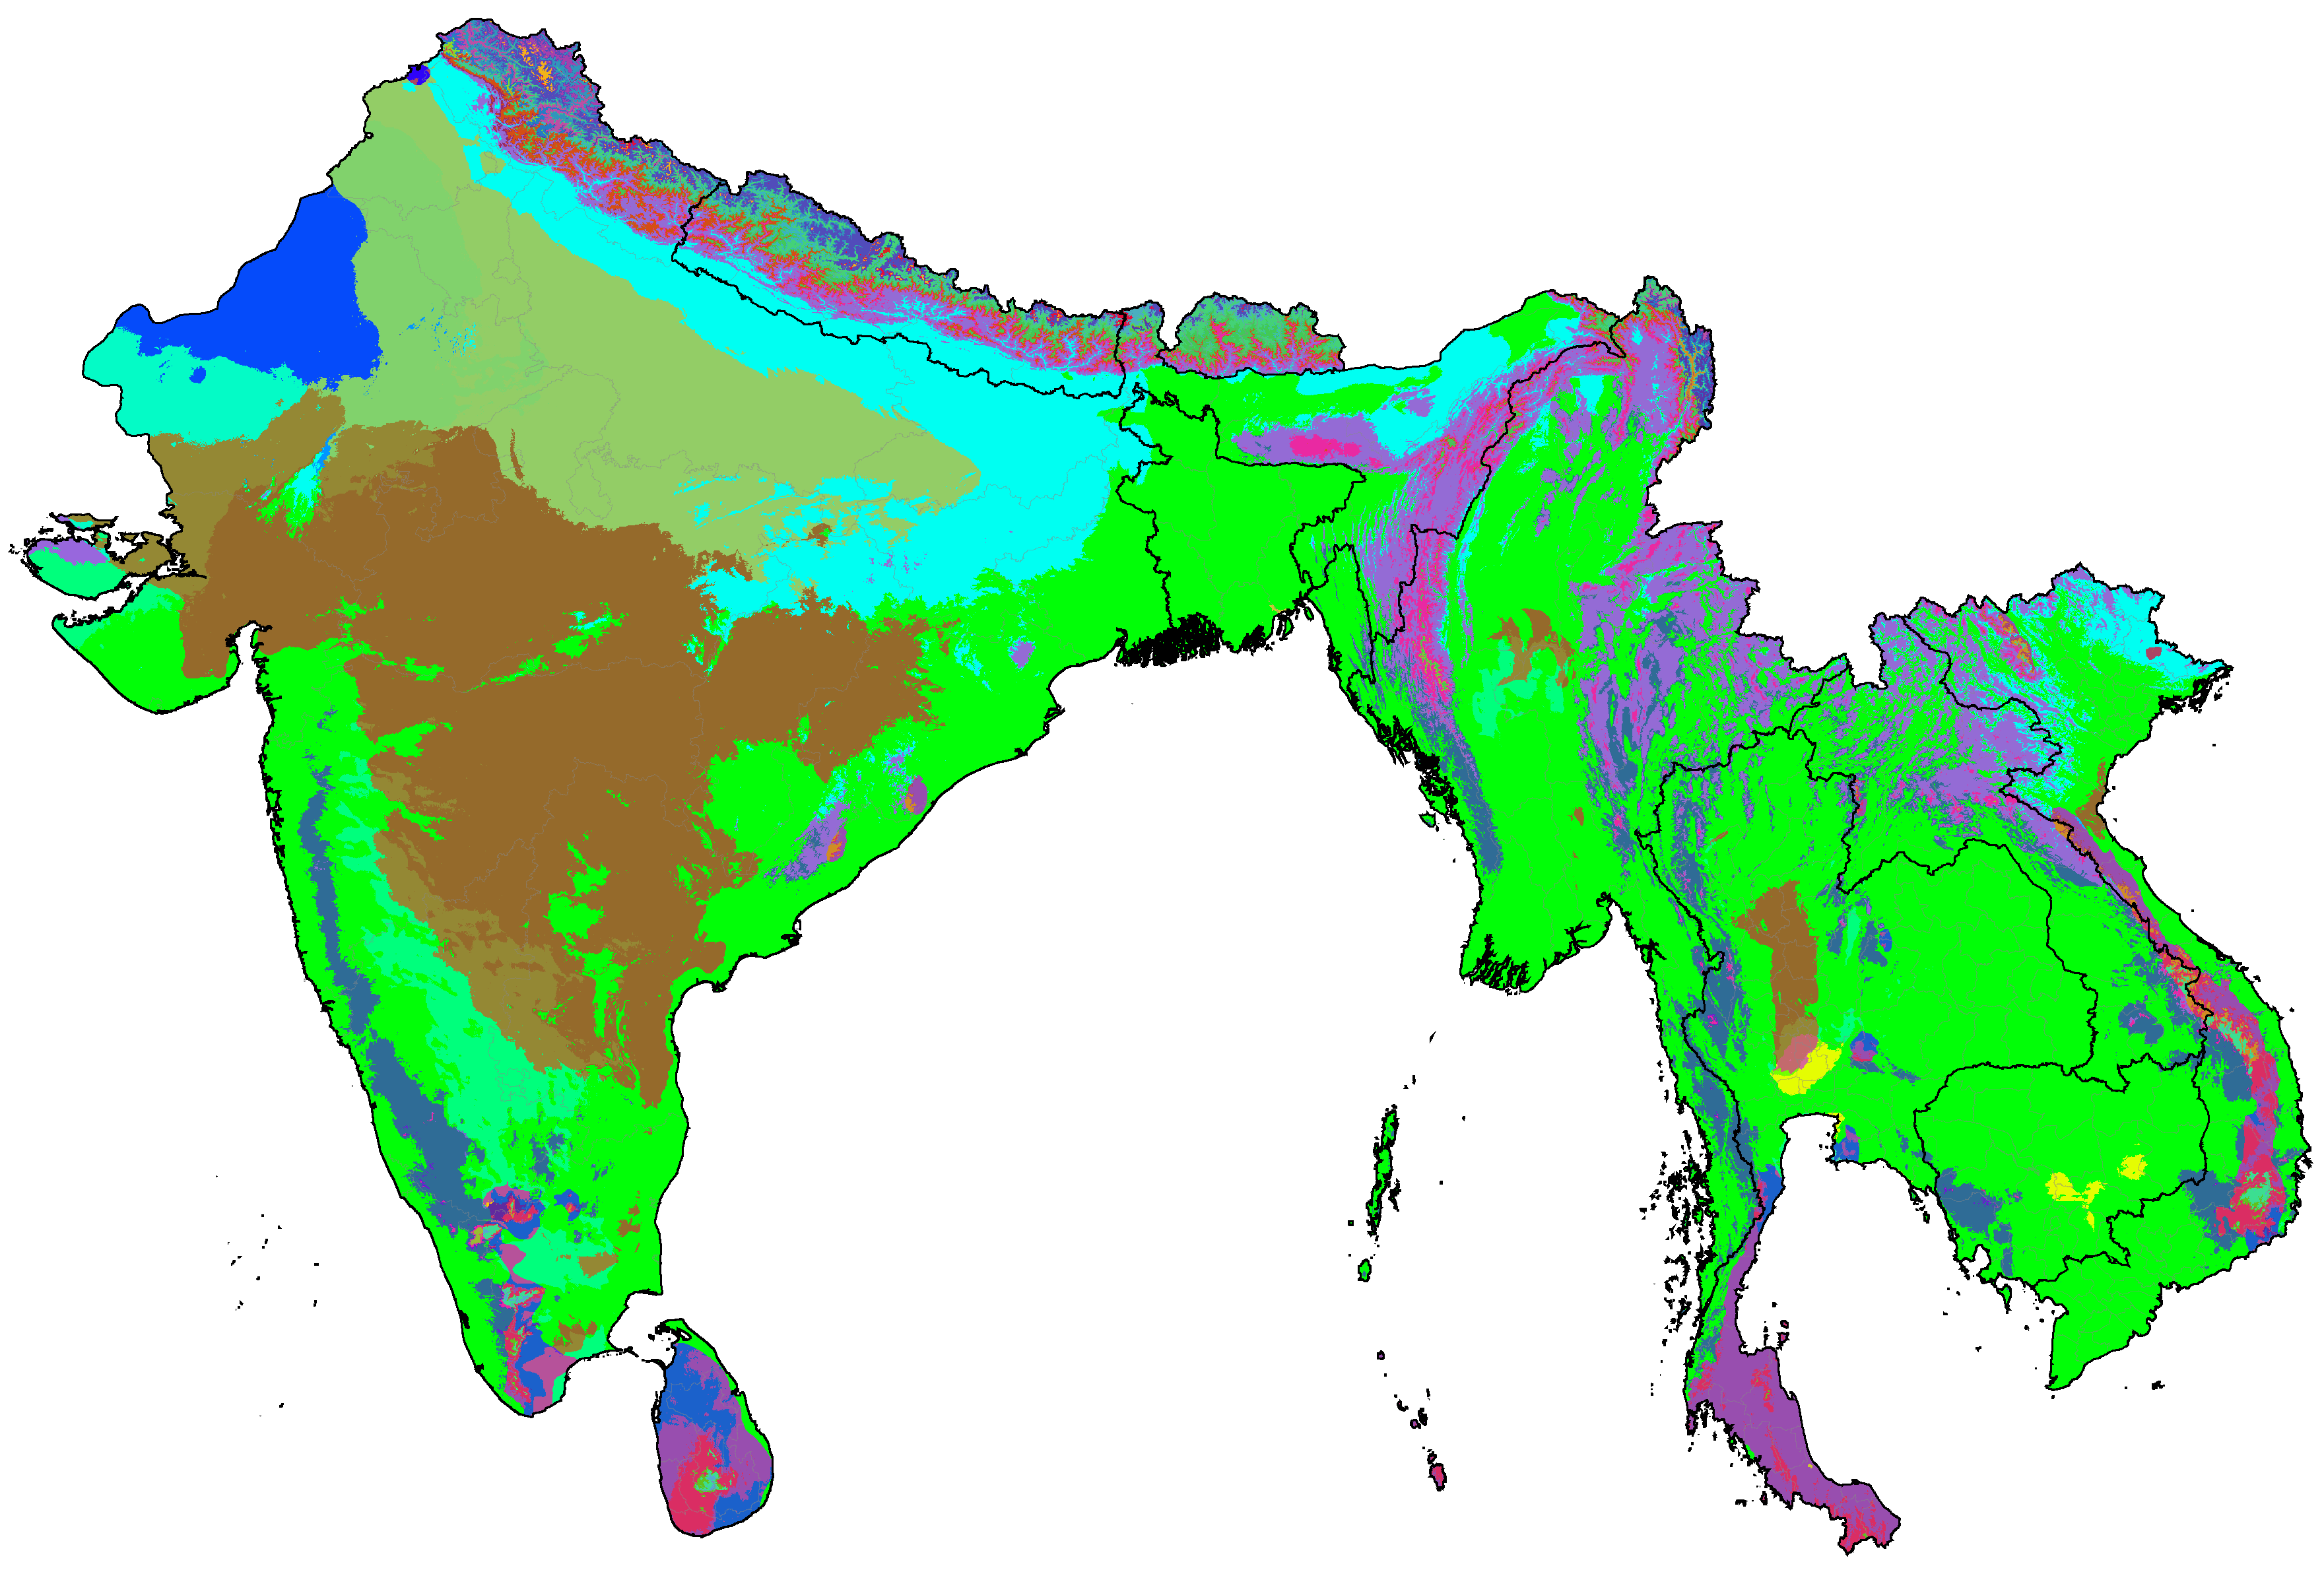
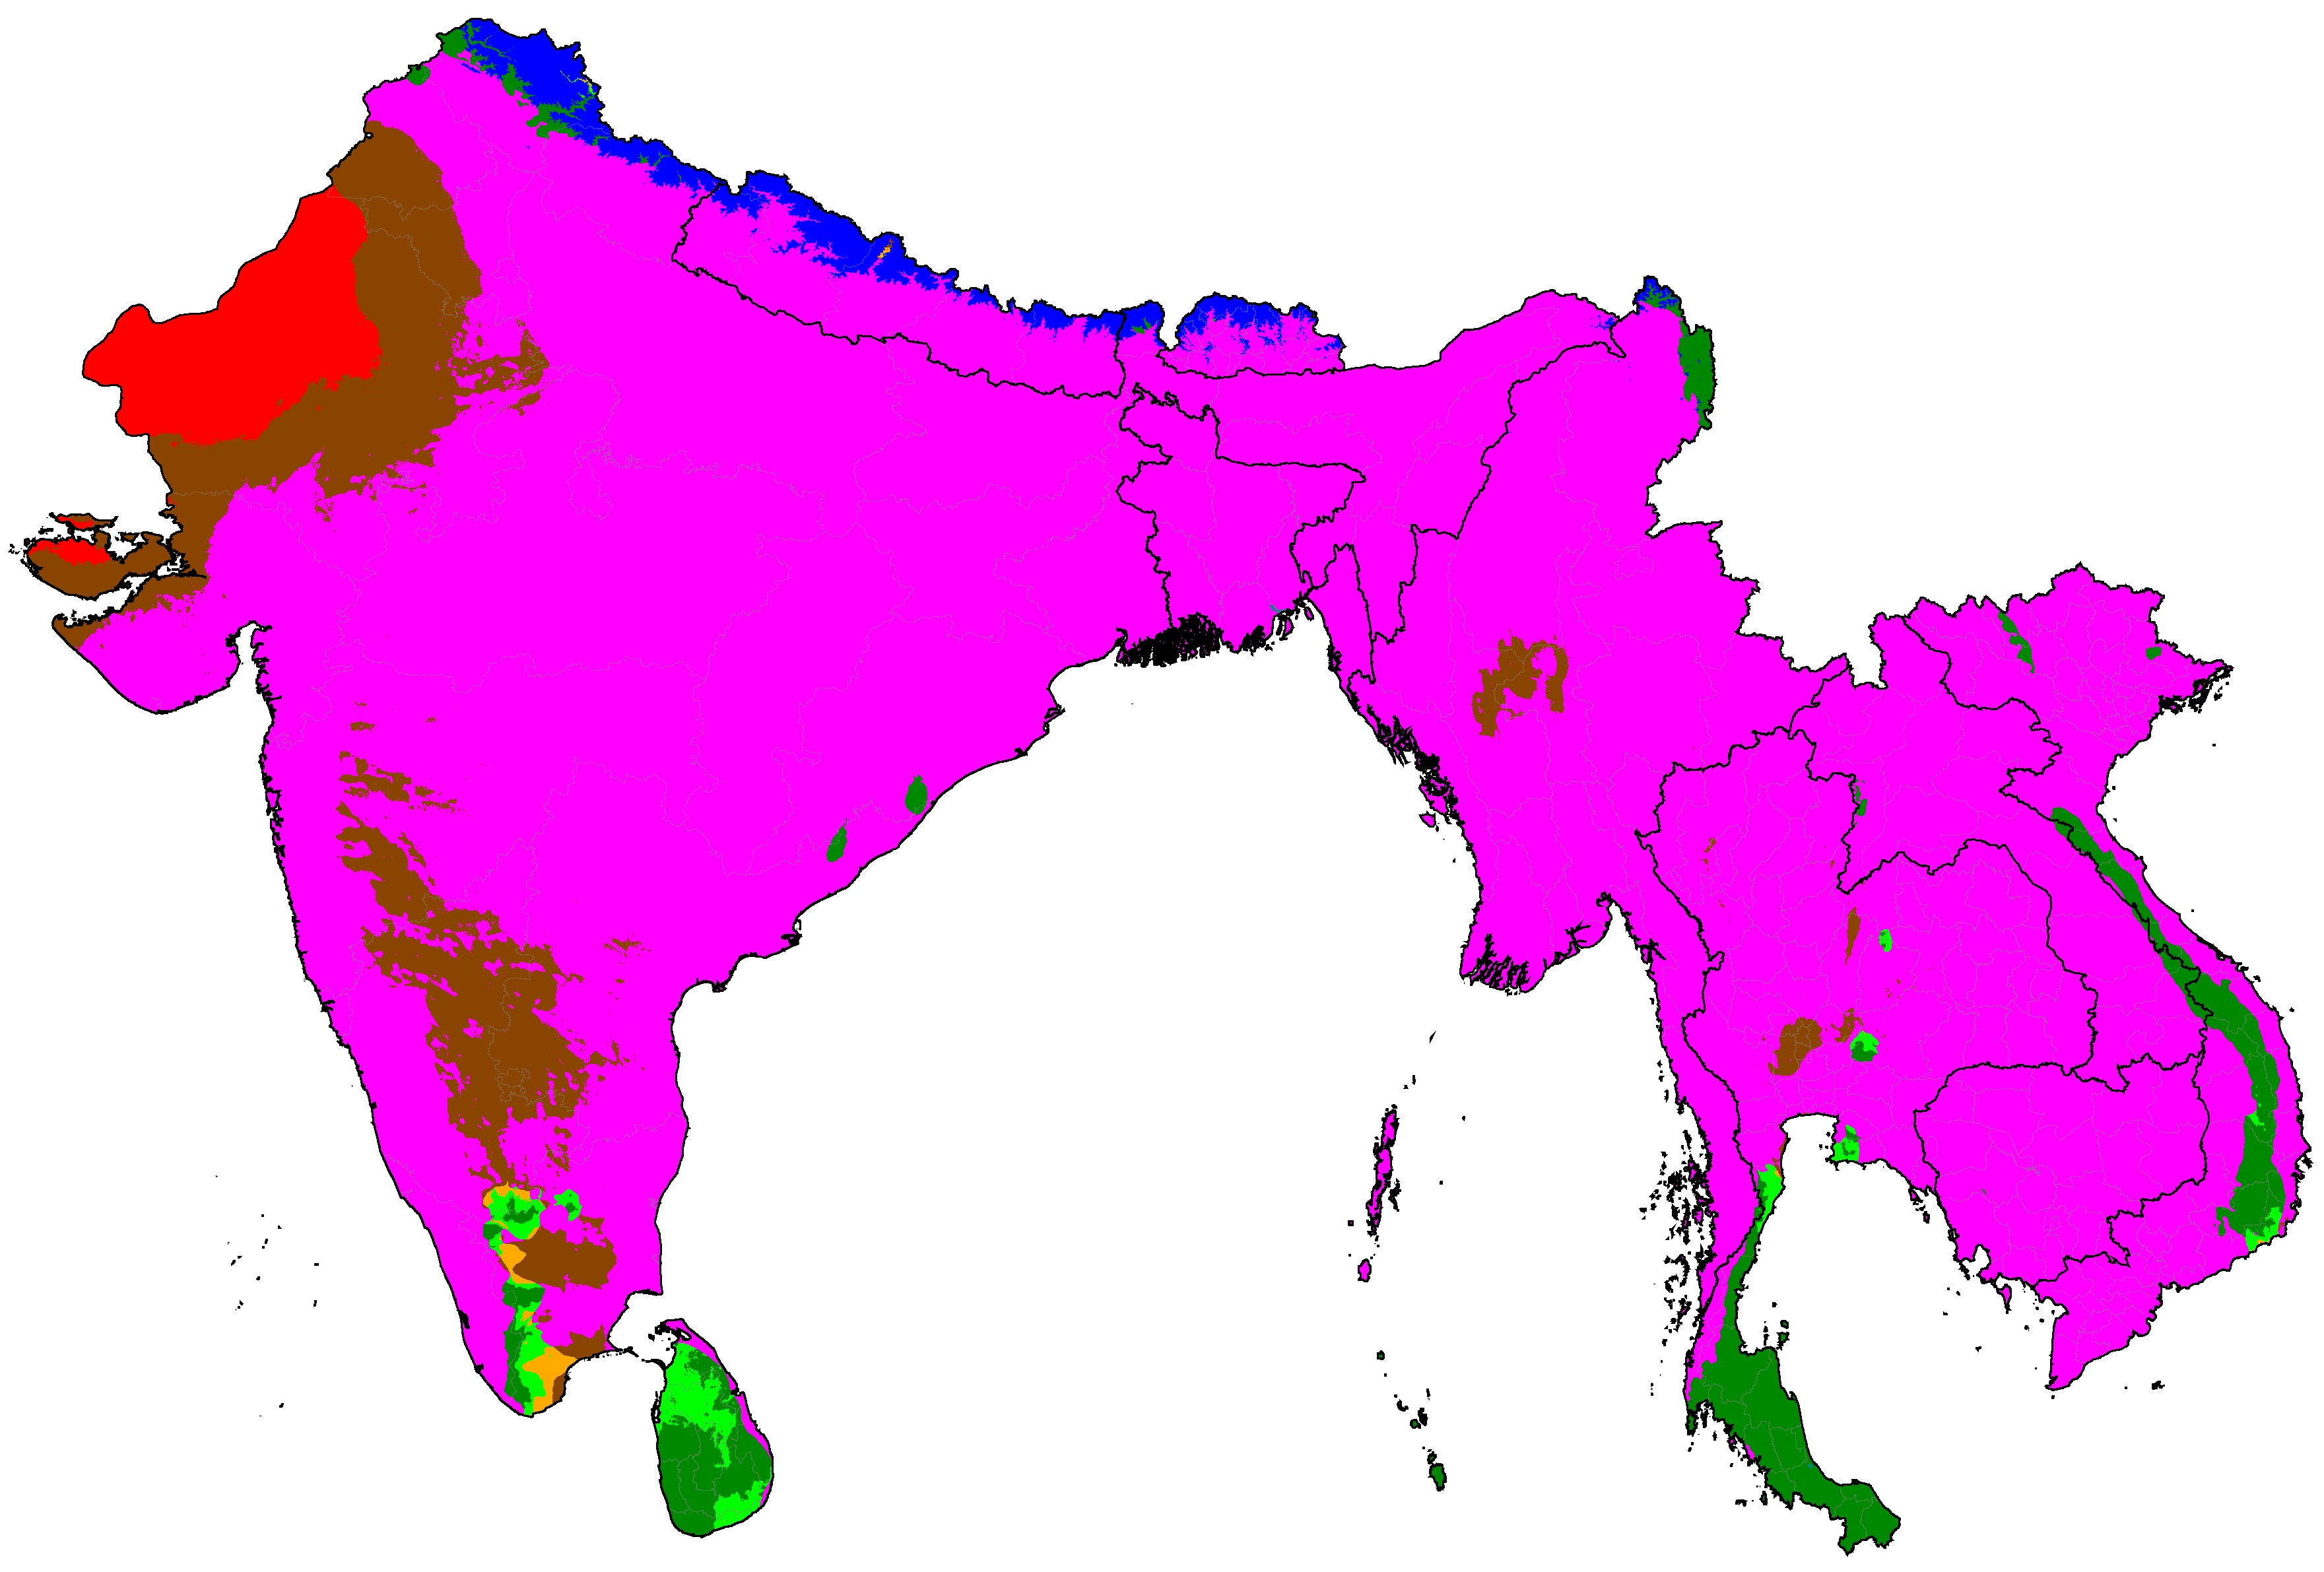
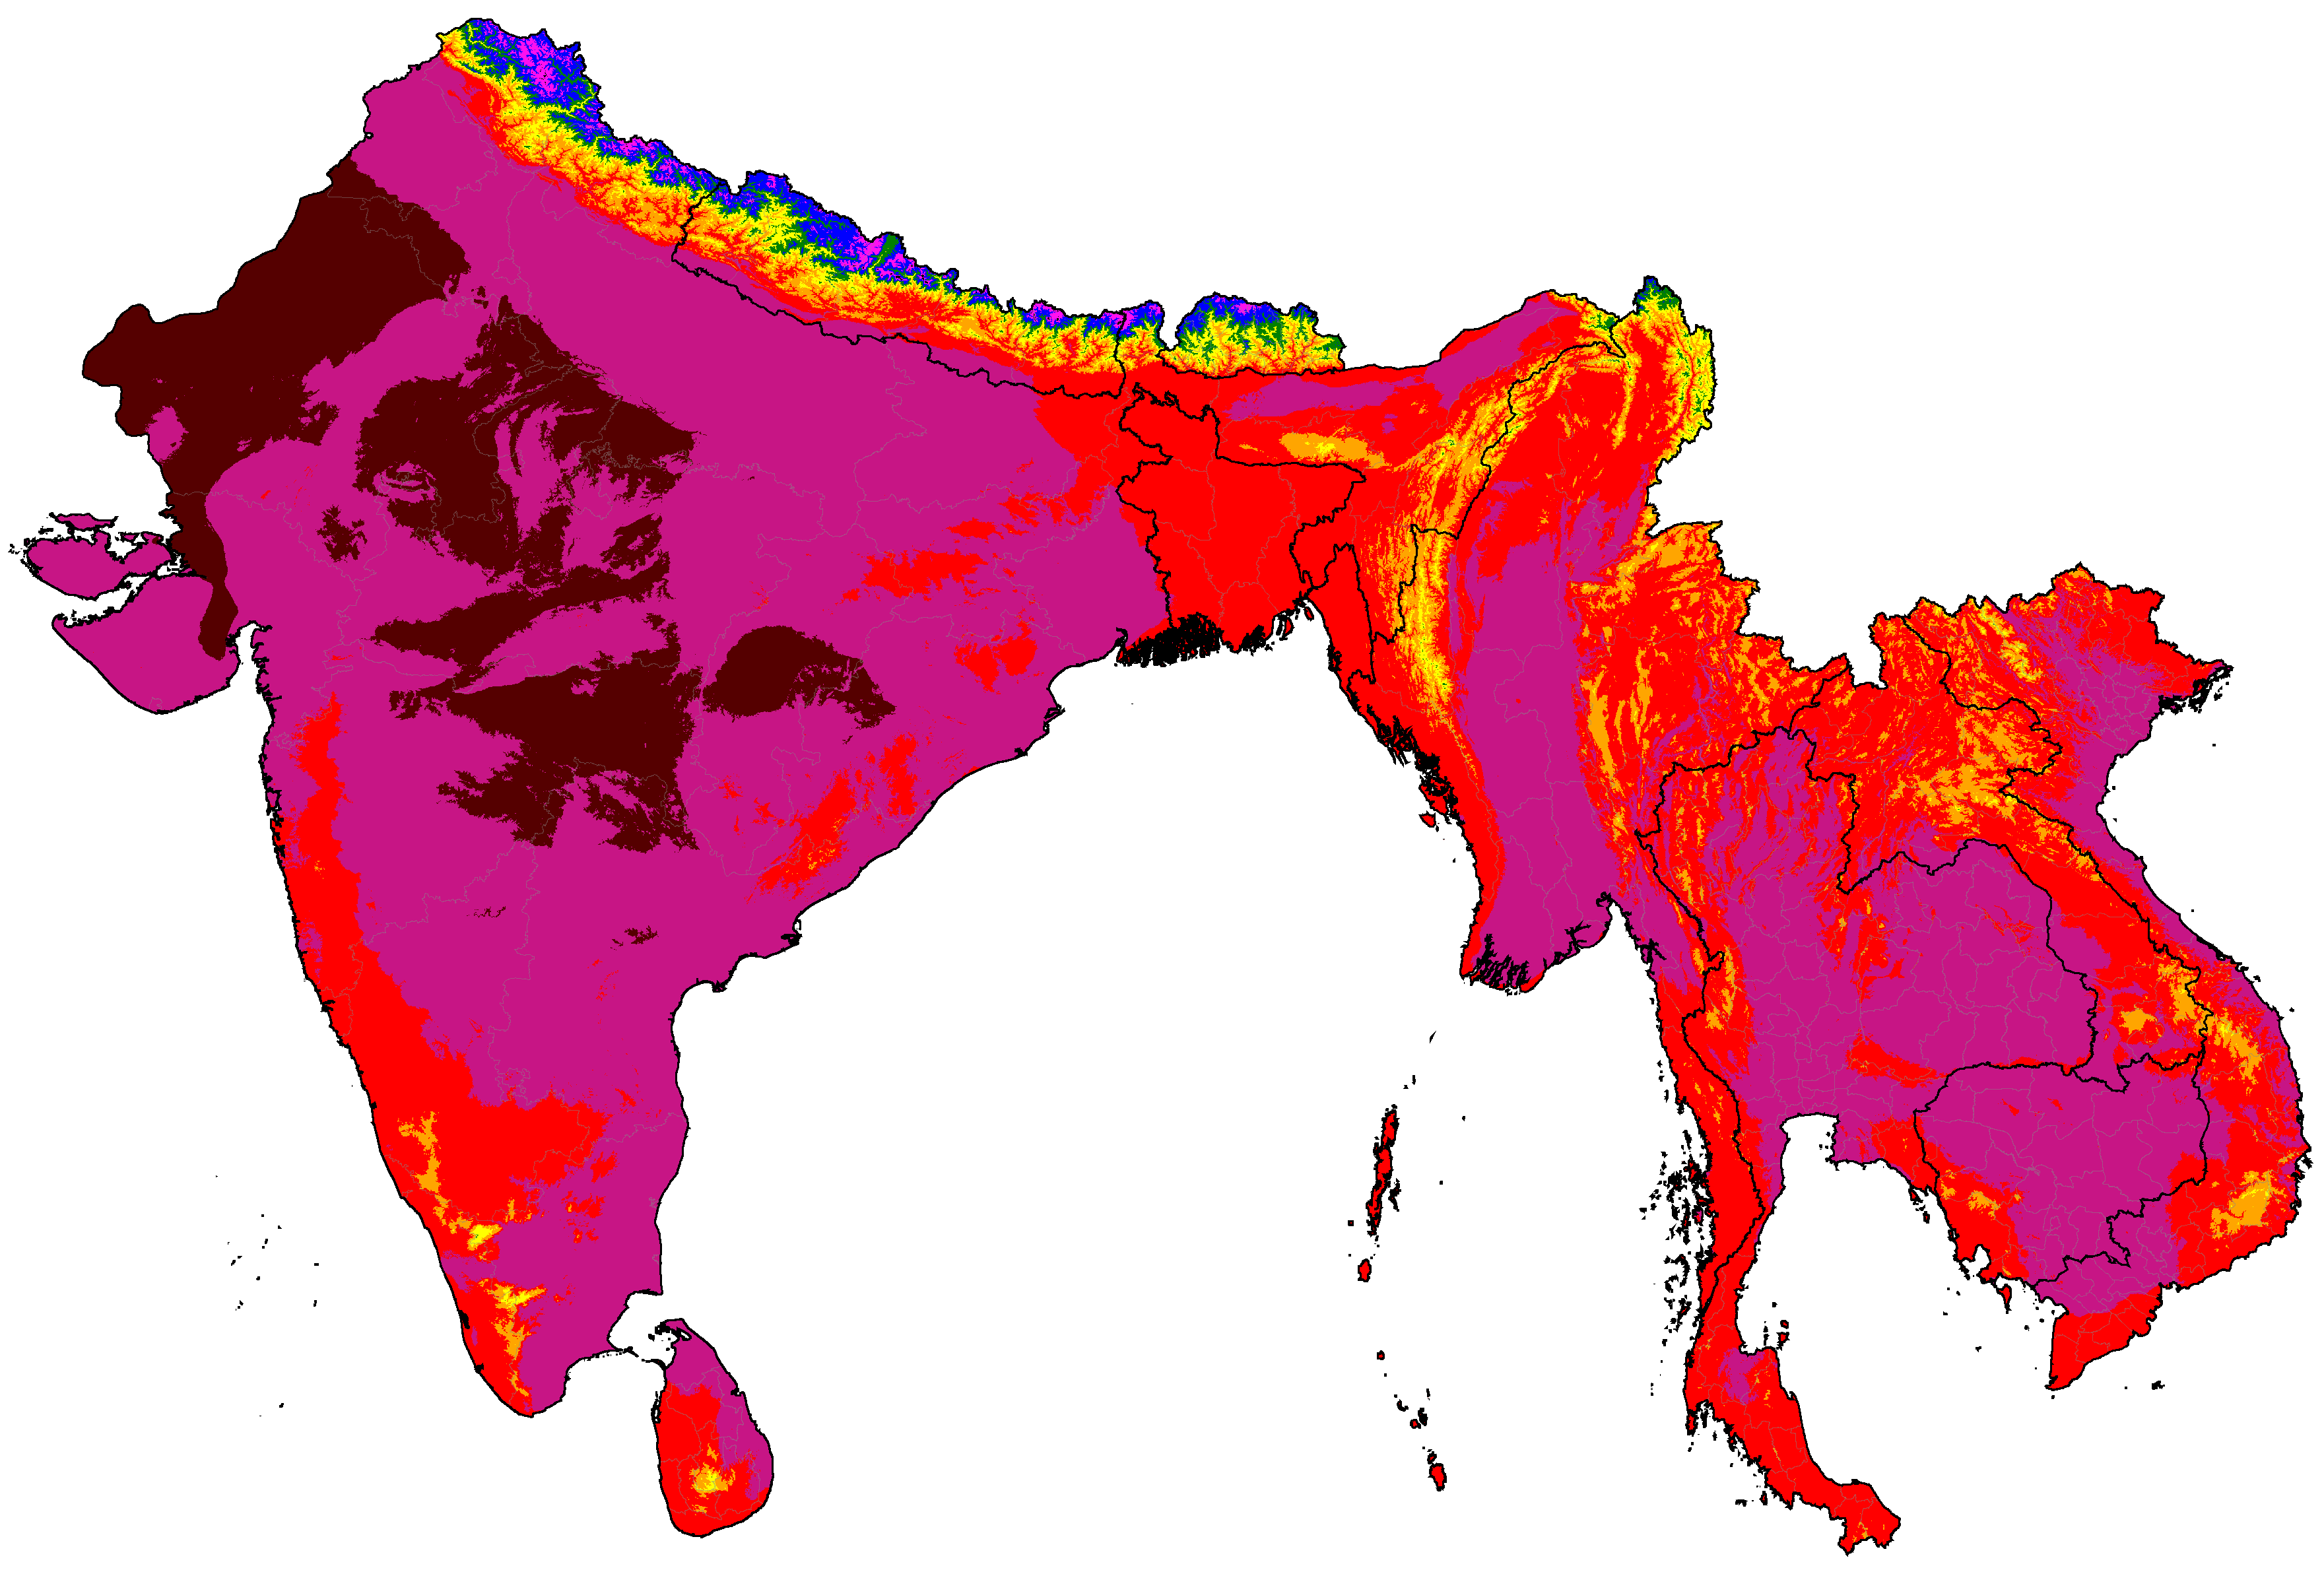
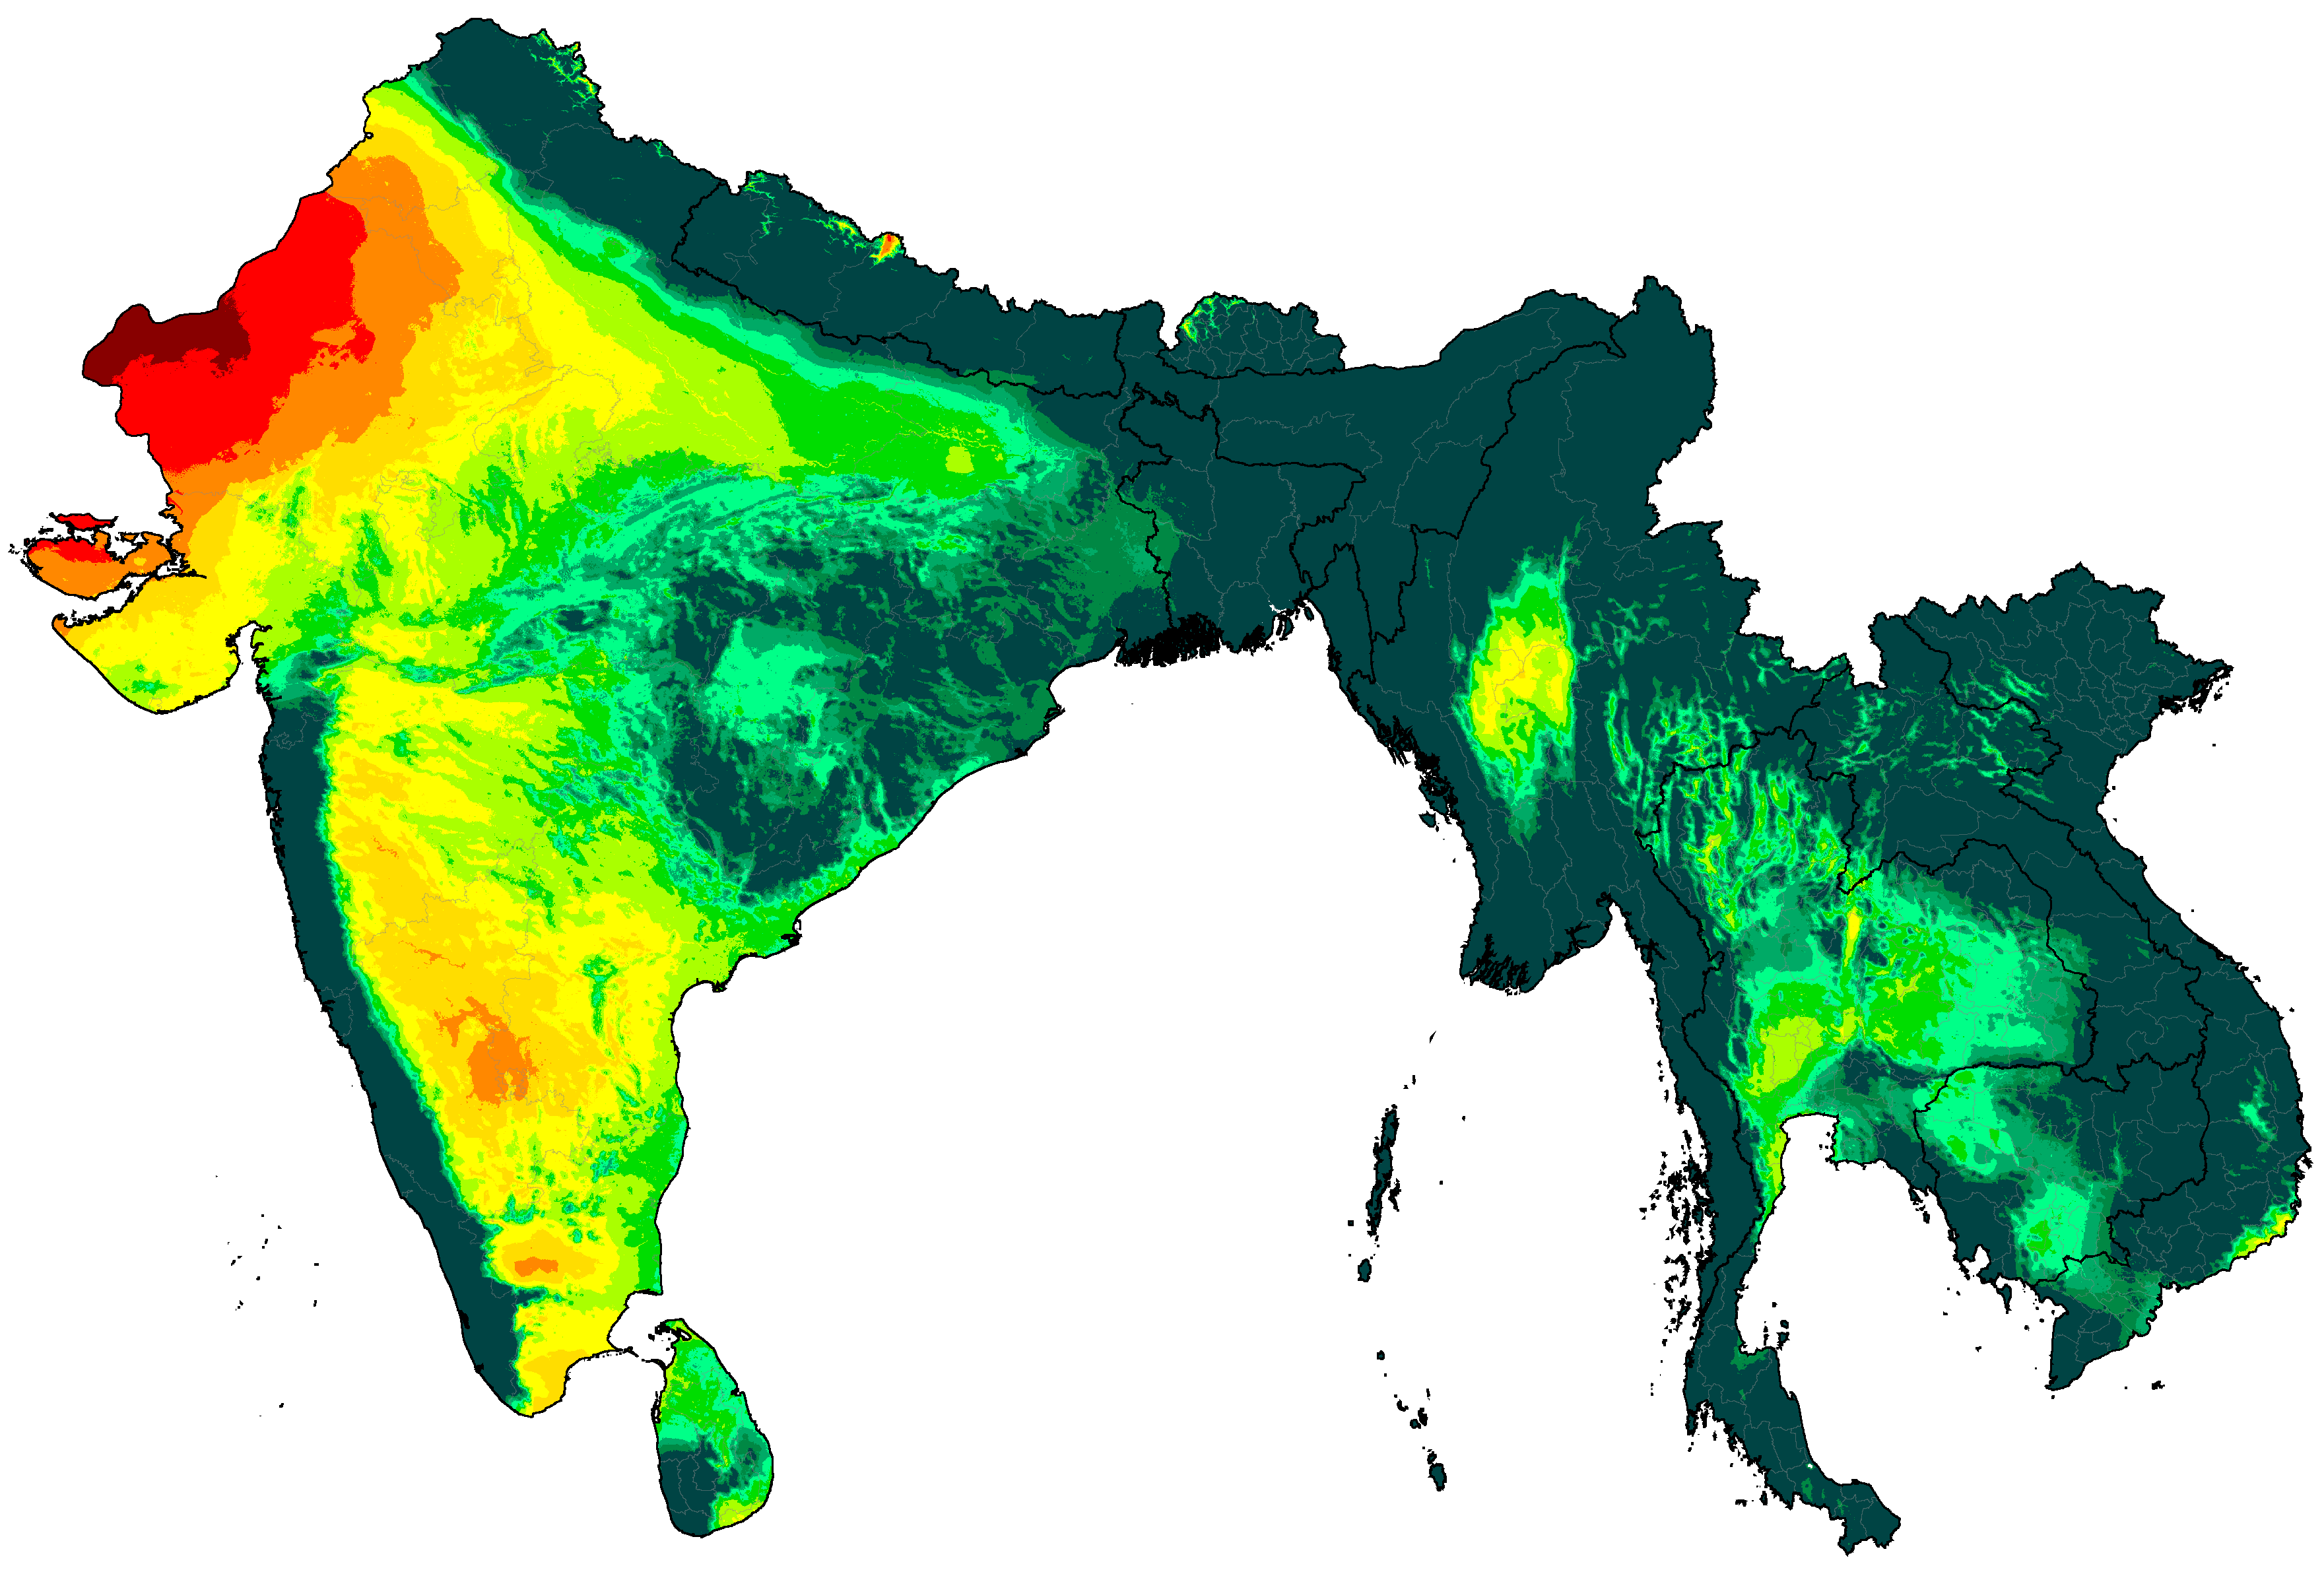
South Asia distribution of aridity categories (projections are SSP5-8.5 high emissions normals)
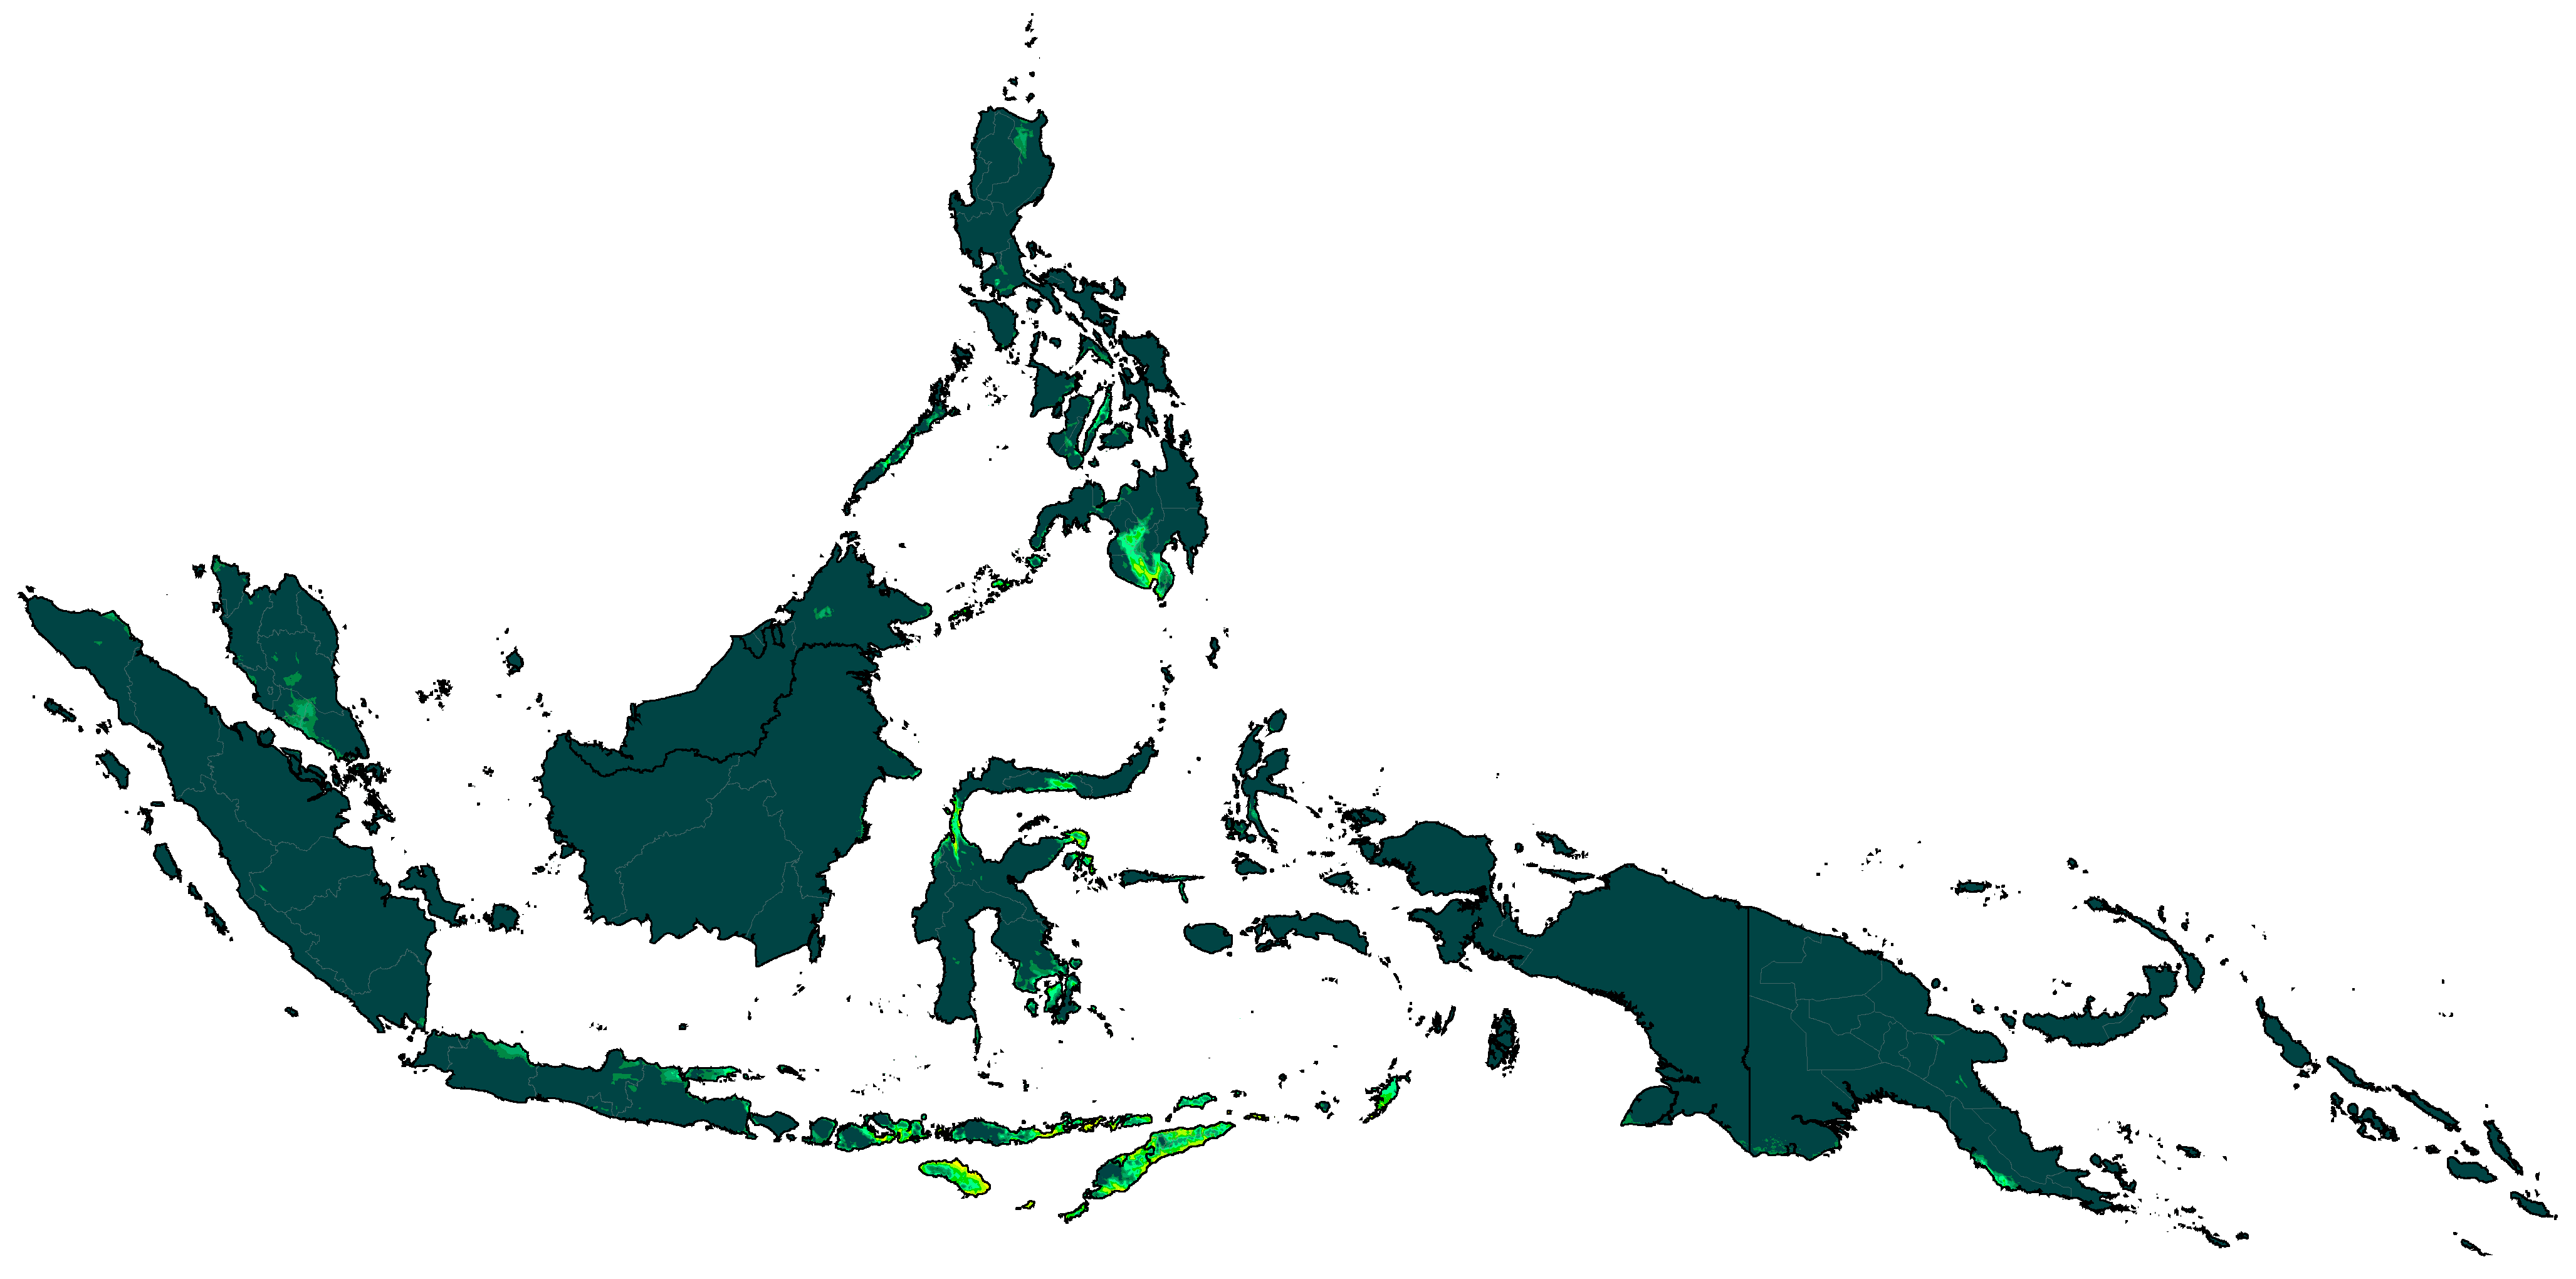
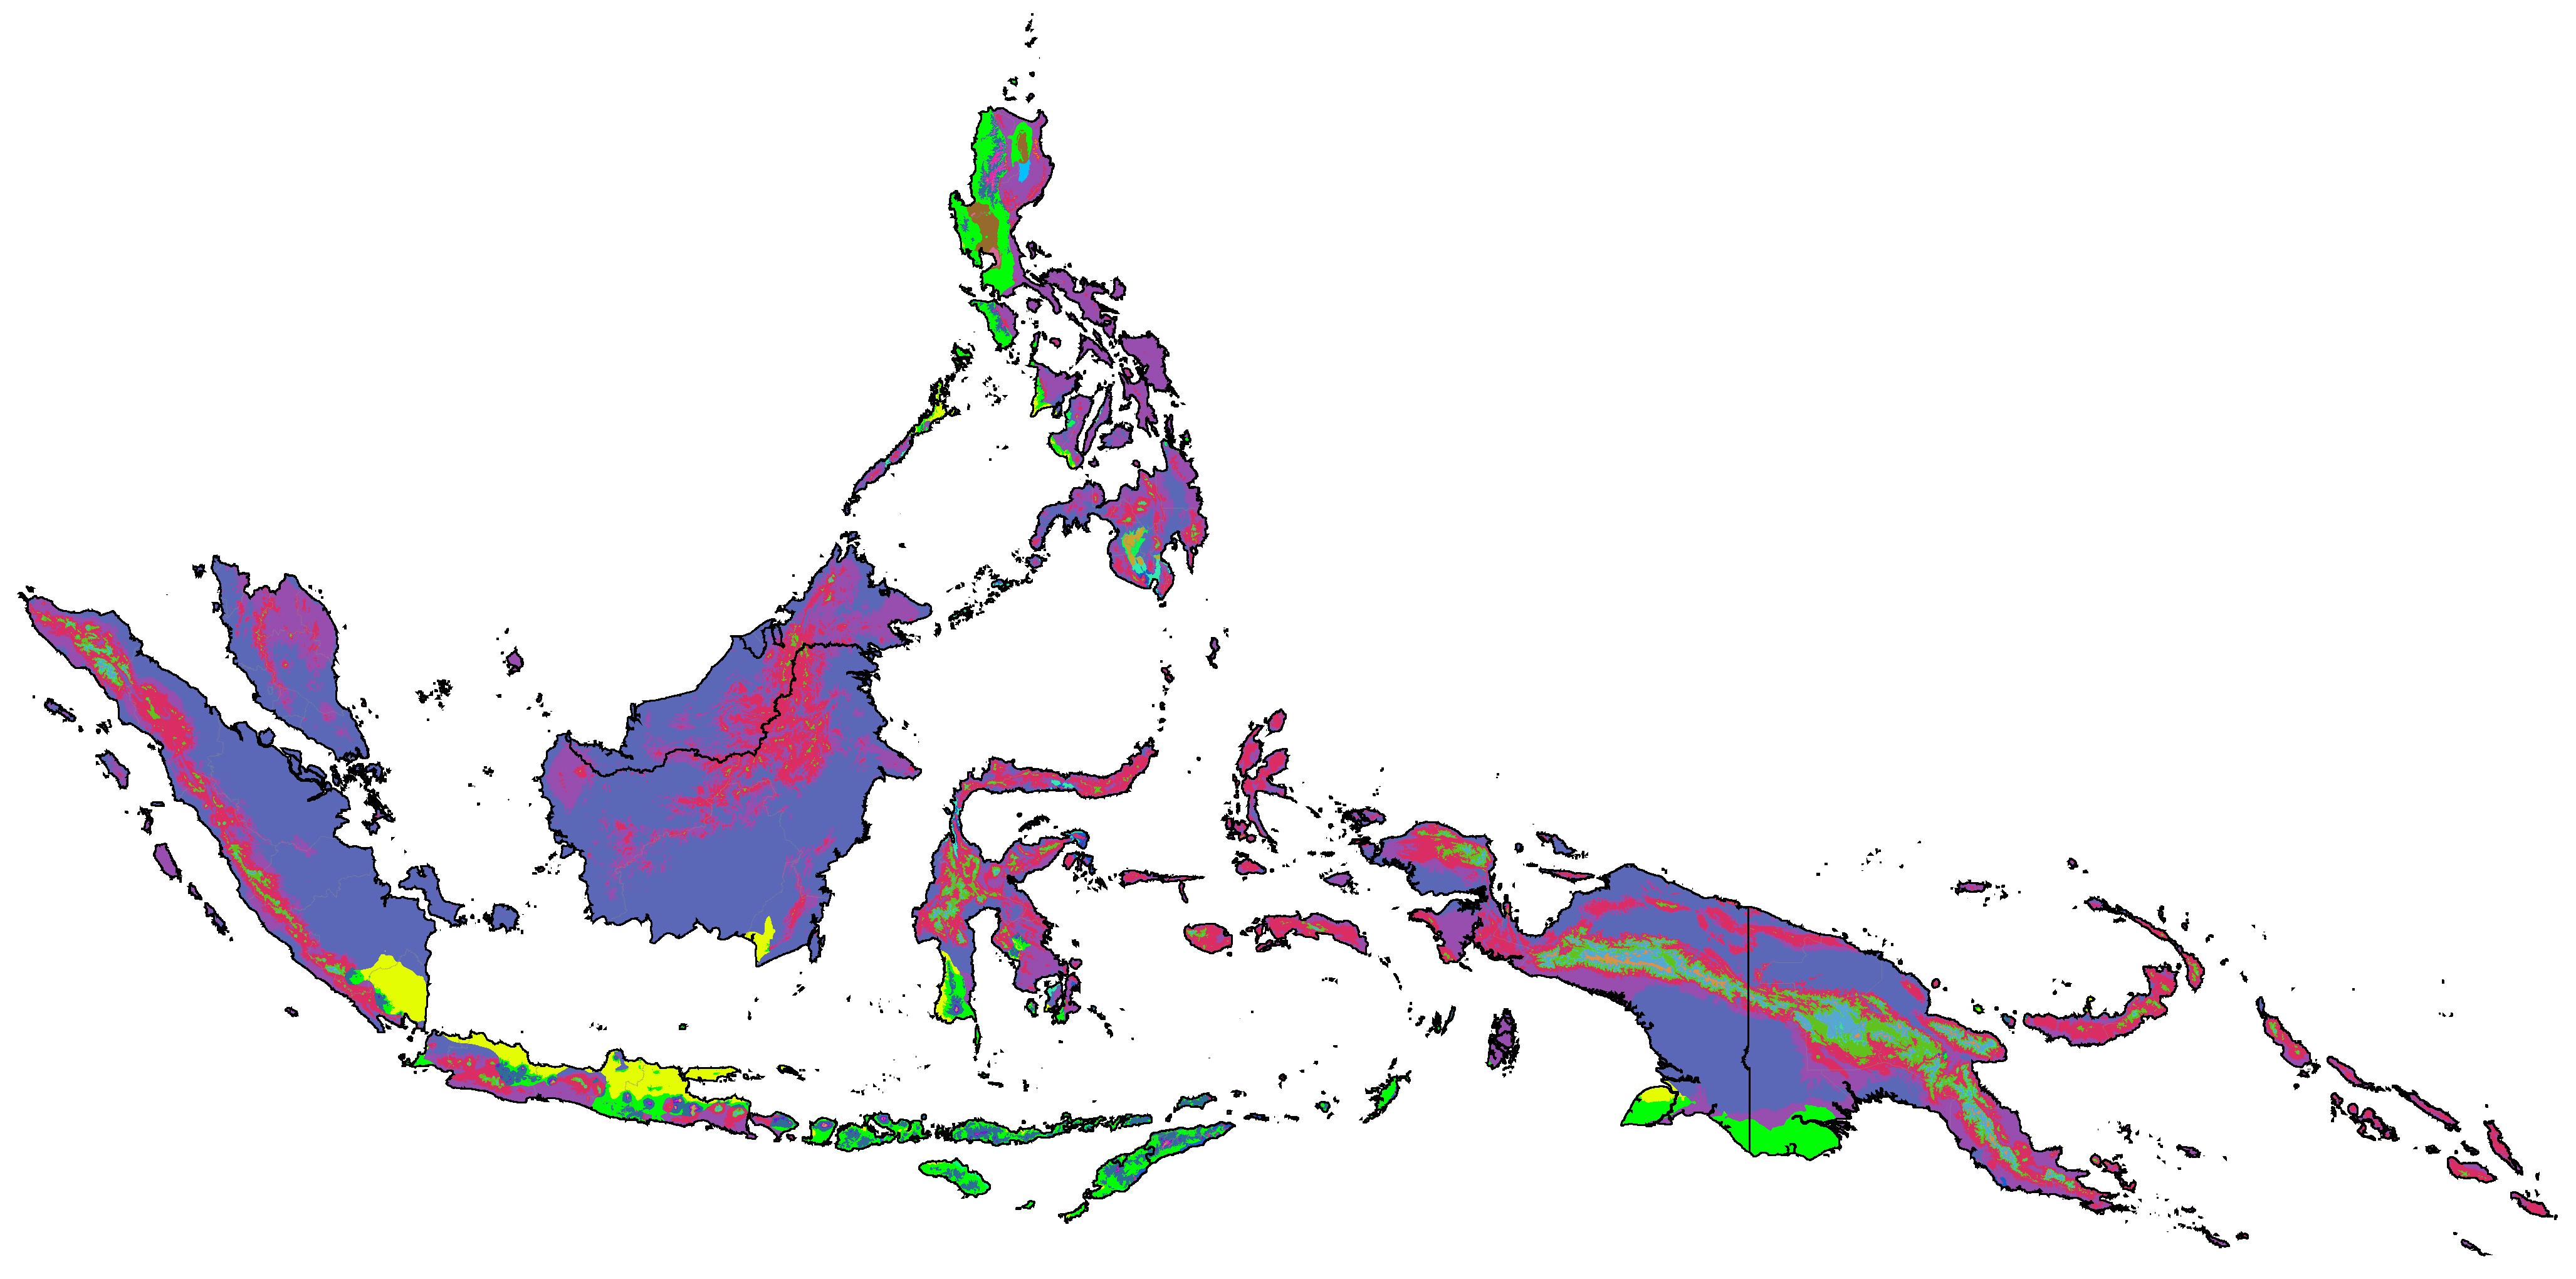
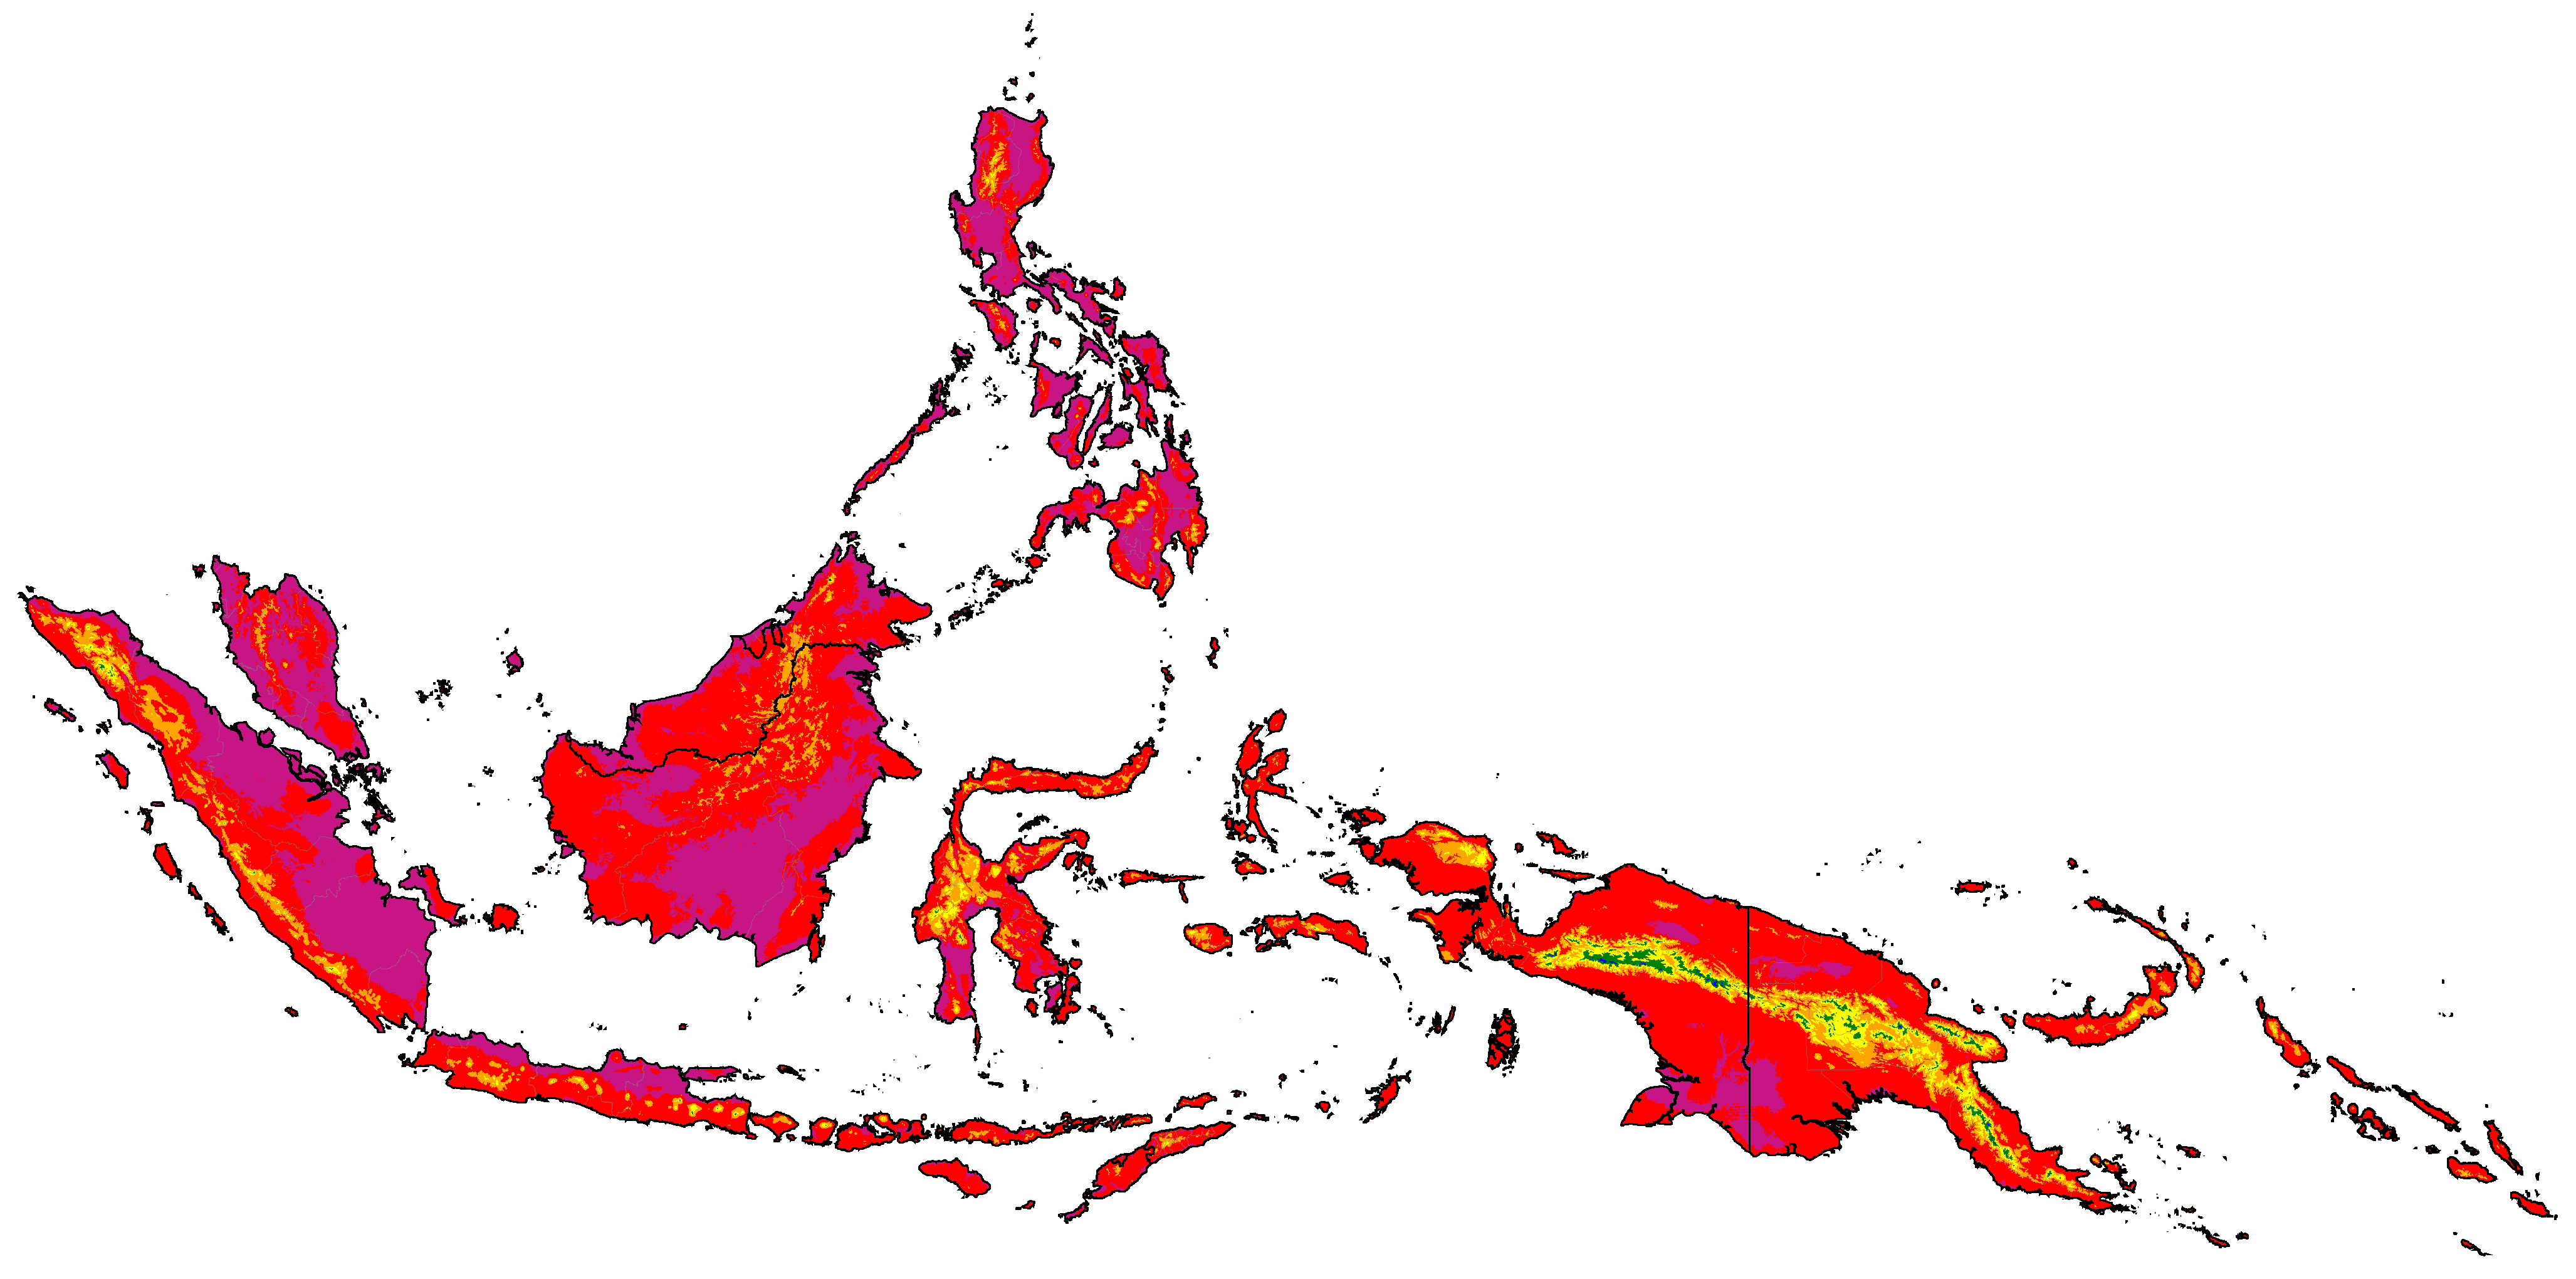
Maritime Southeast Asia distribution of aridity categories (projections are SSP5-8.5 high emissions normals)


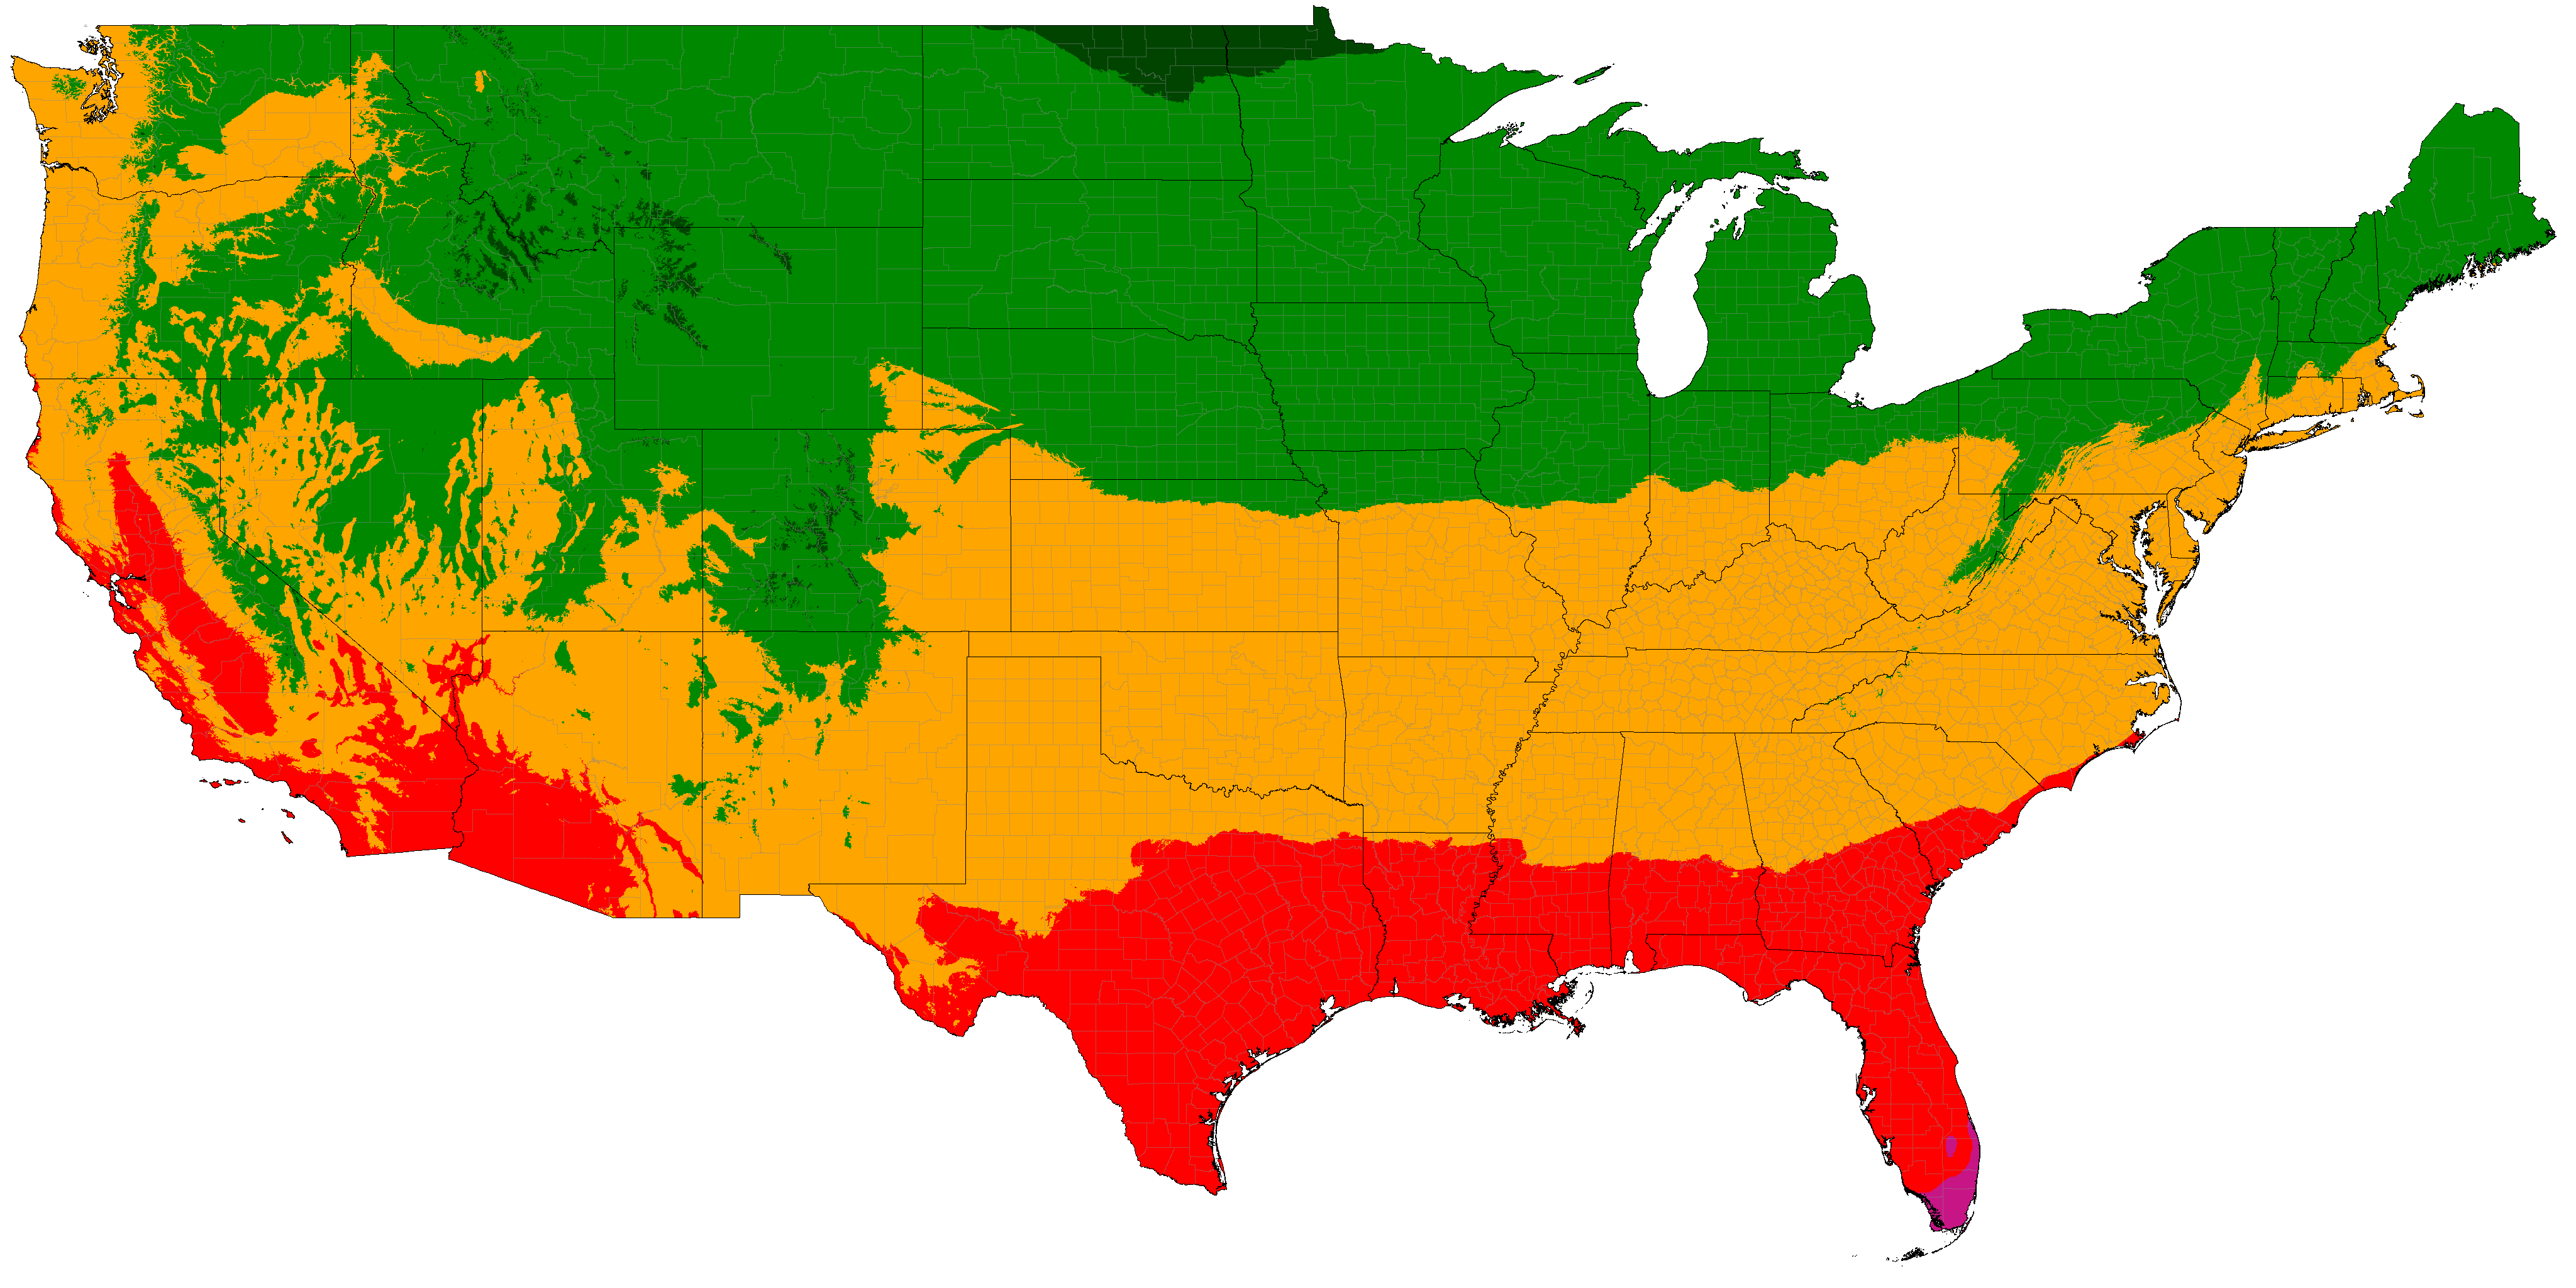
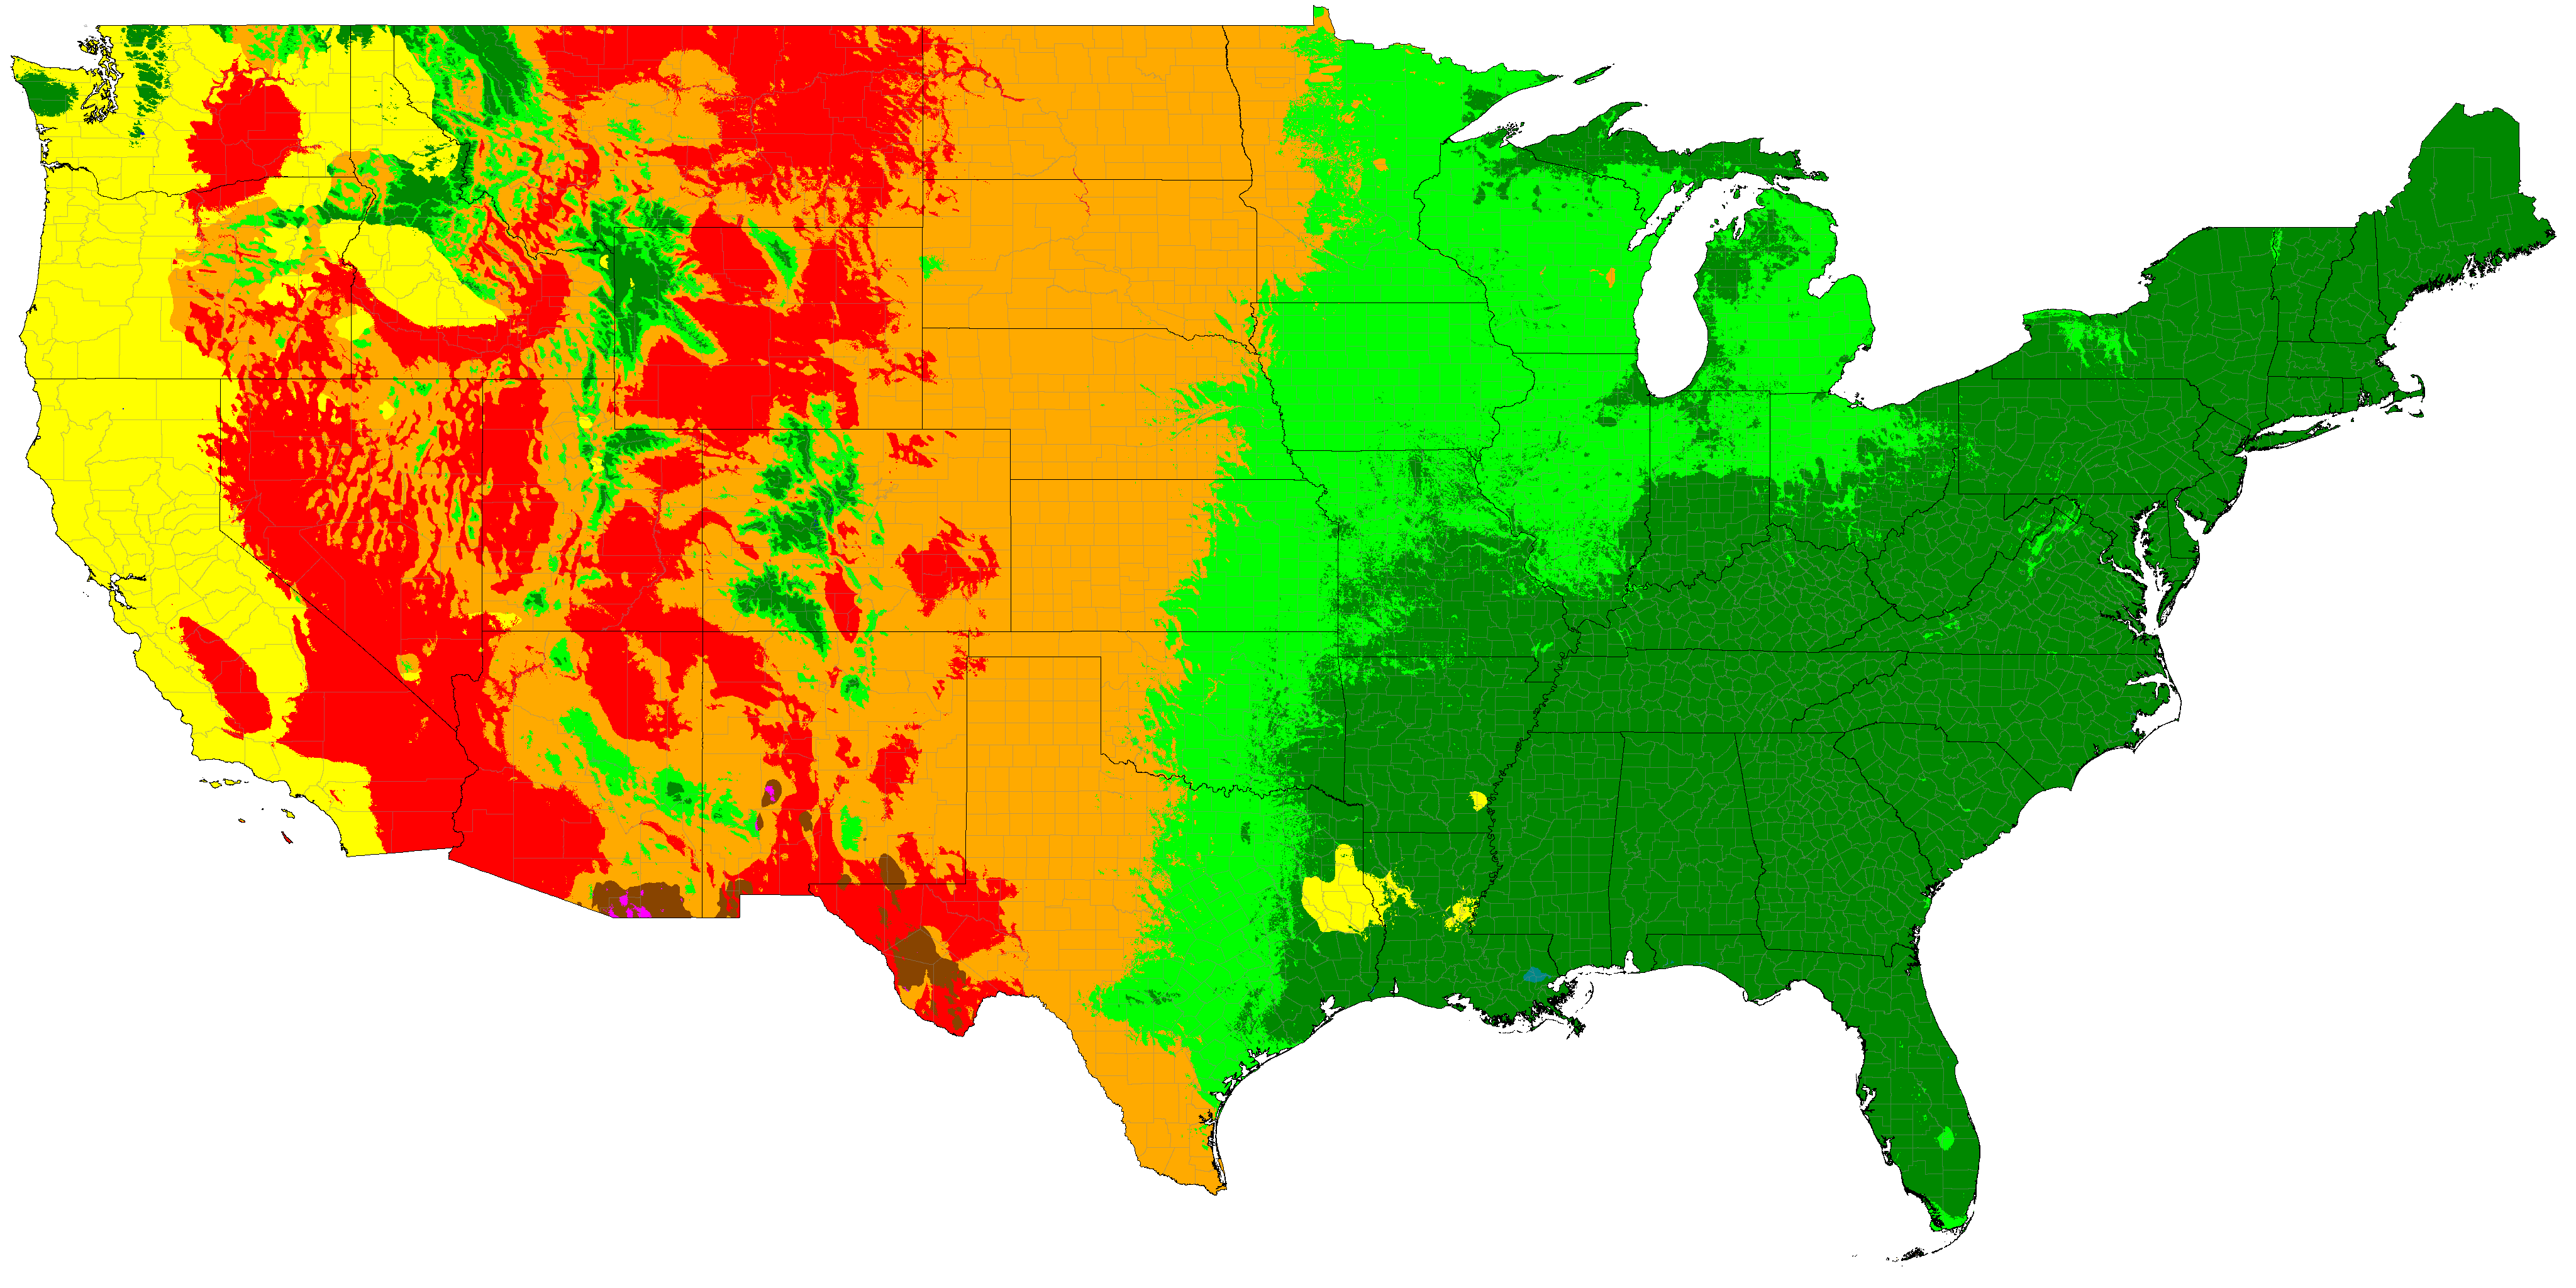
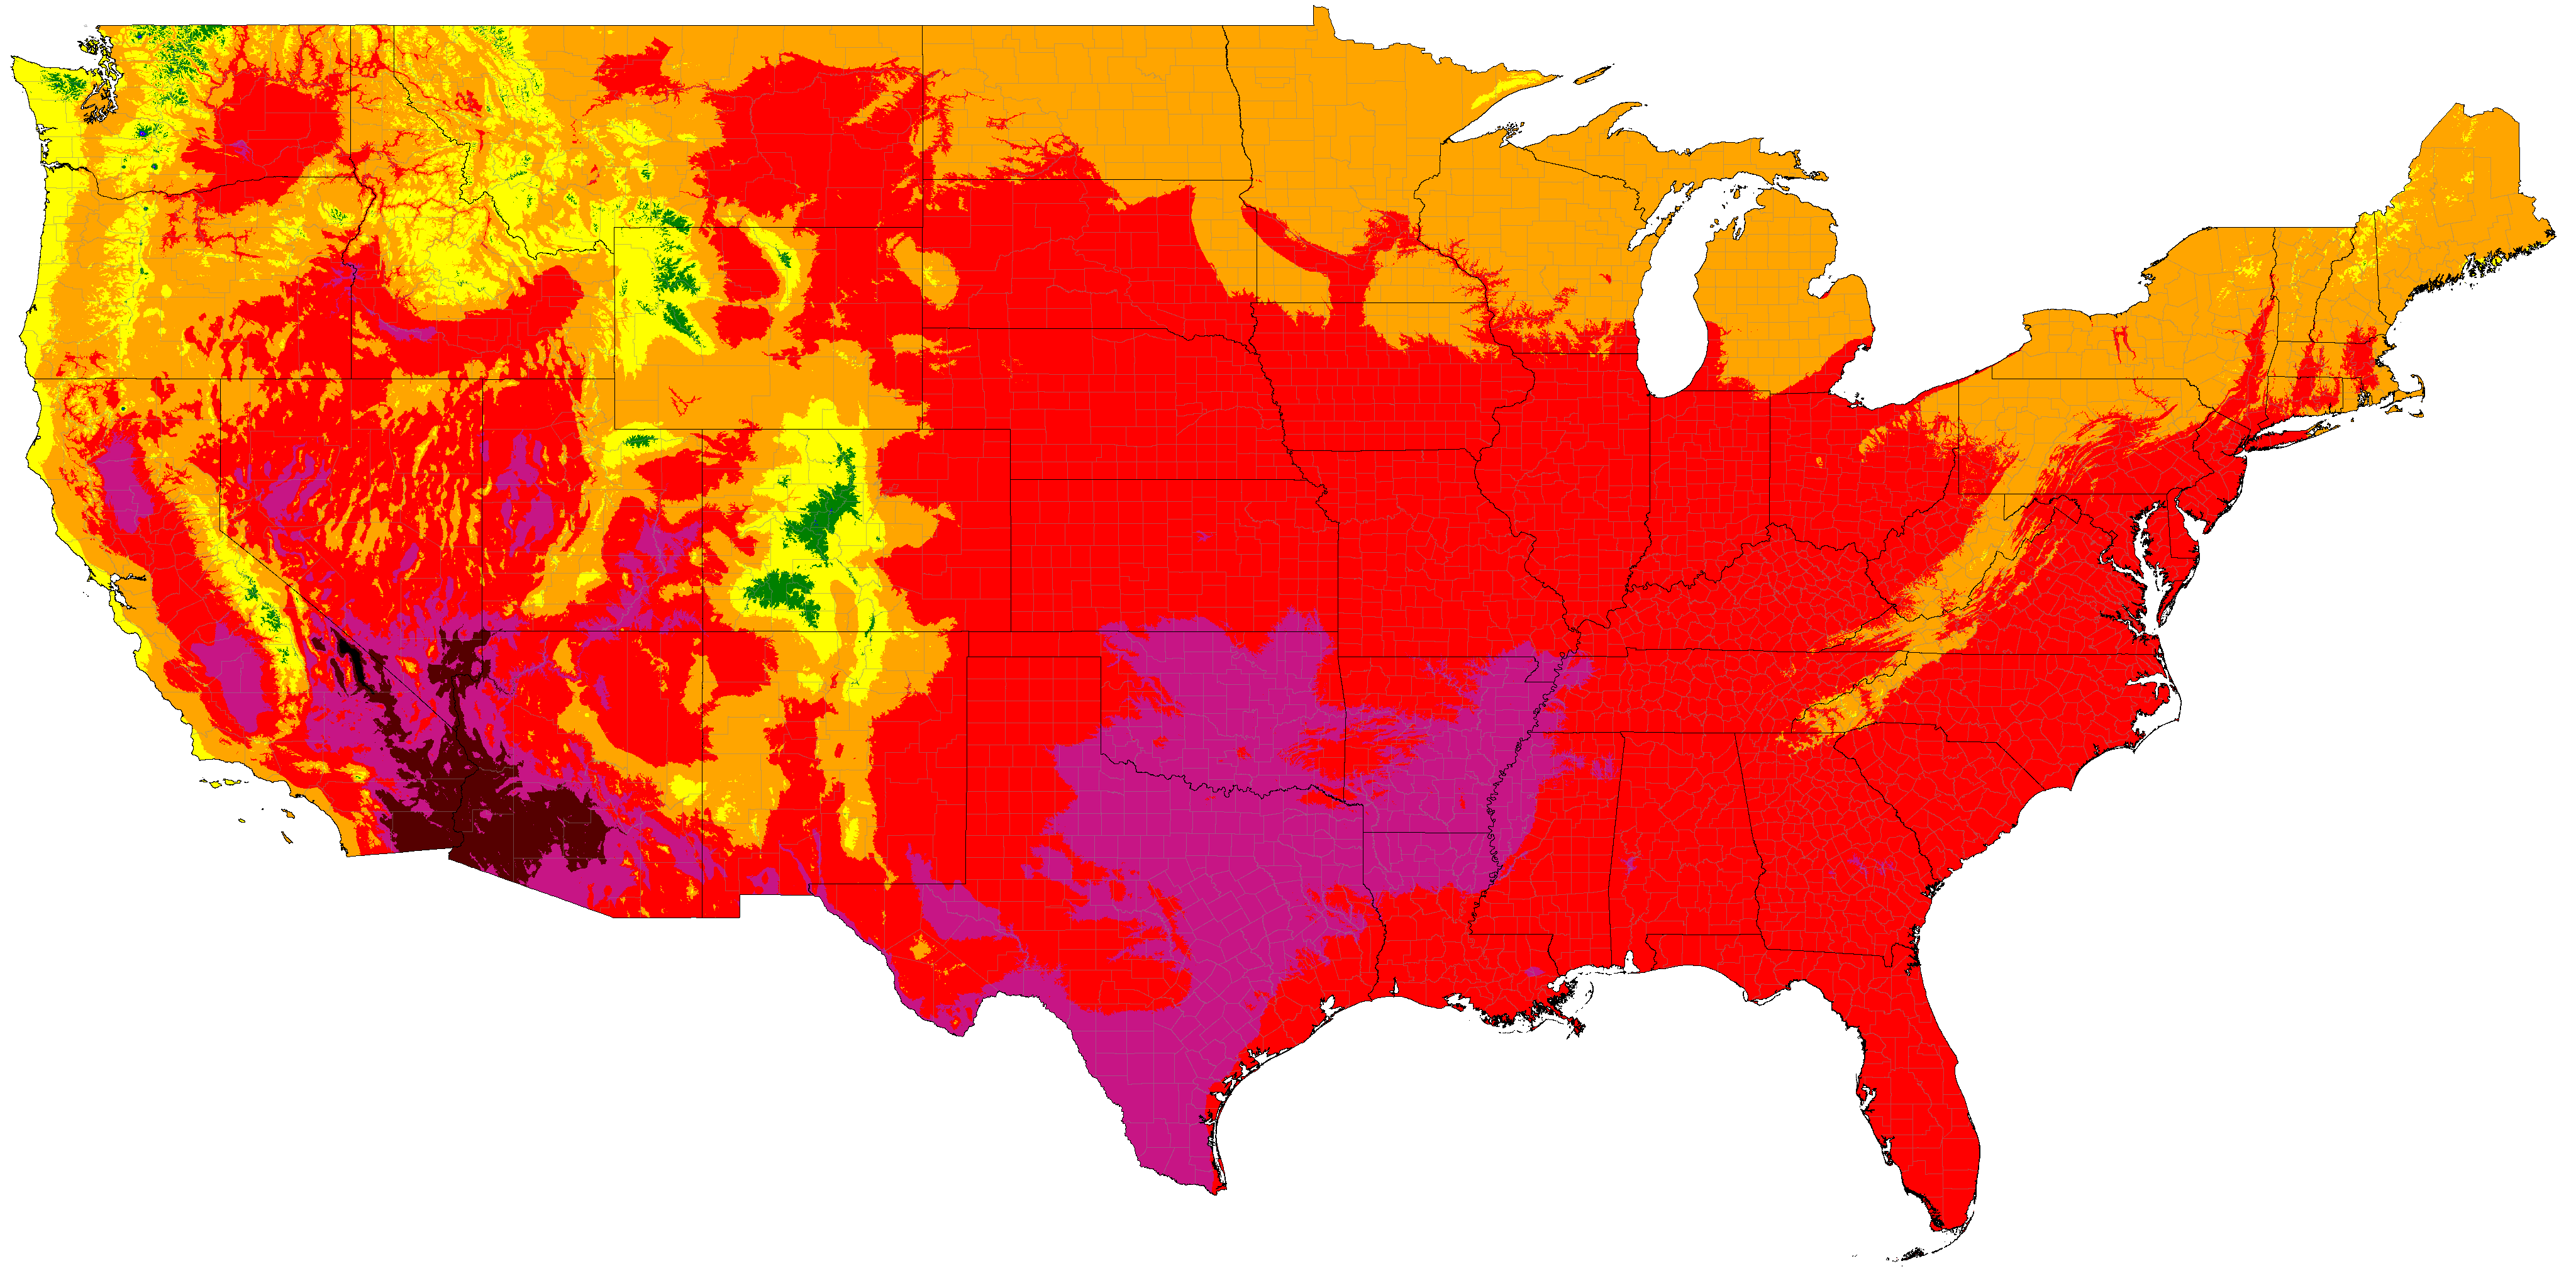
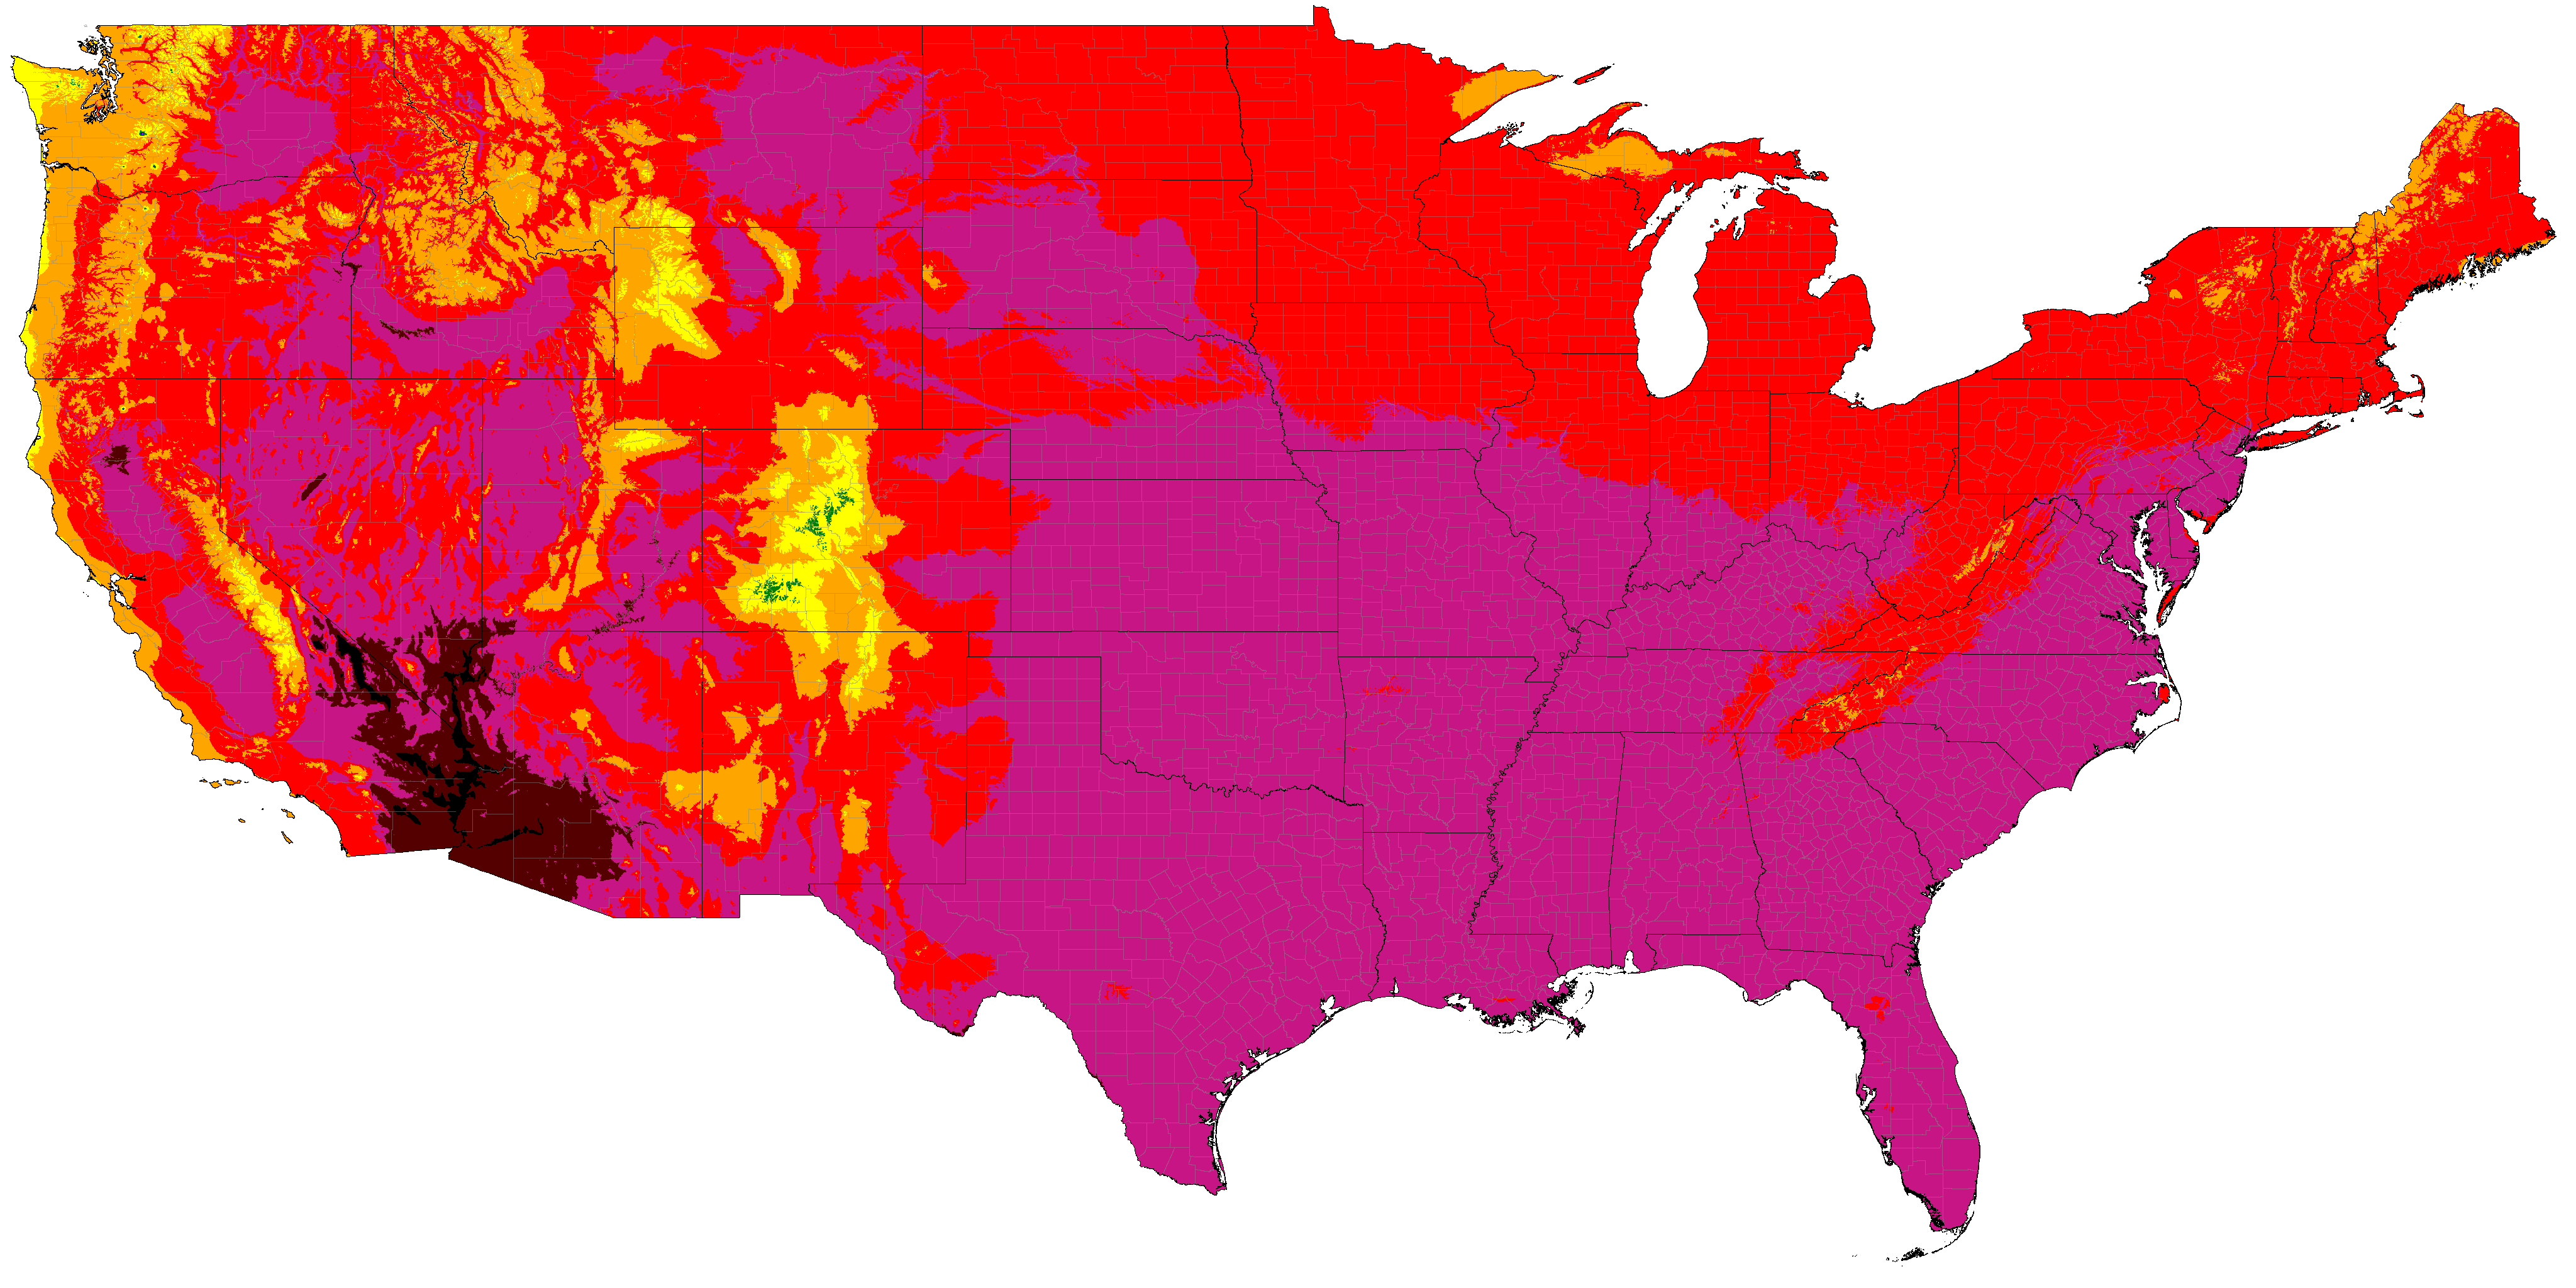
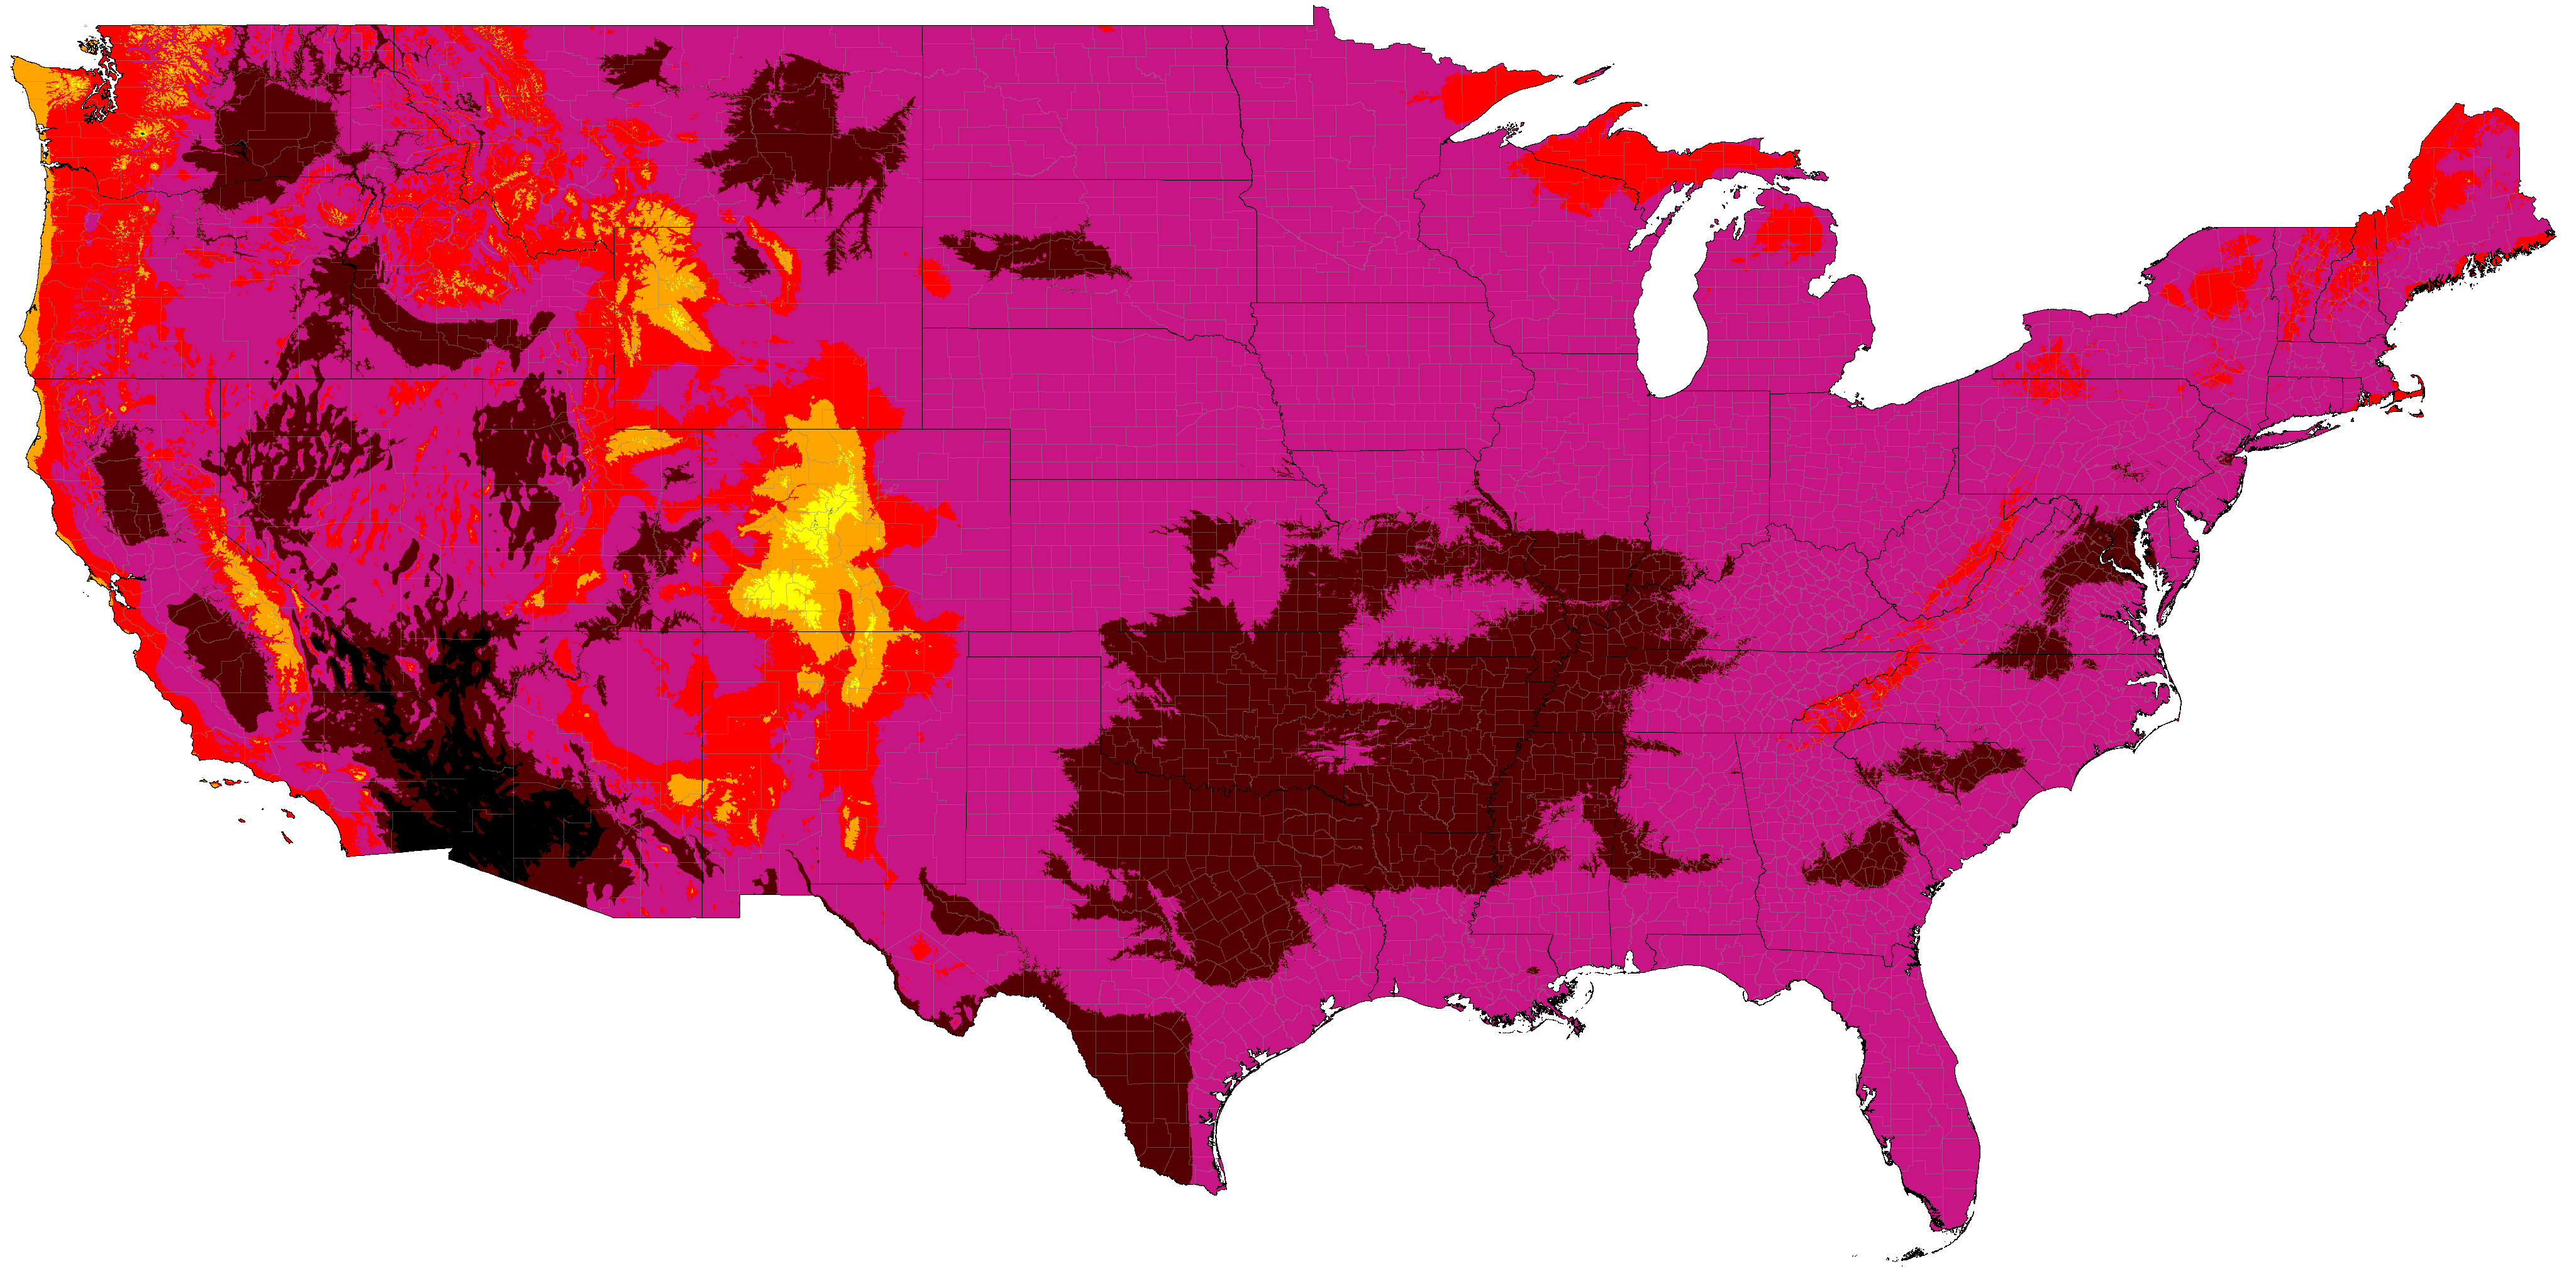
Note: Conveniently, Pheonix, Arizona (United States) sits exactly on the z1/z2 summer category boundary in the 1981-2010 normals, and likewise in the same normals period, Death Valley, California (United States) sits exactly on the z2/X summer category boundary. Therefore, It could reasonably be said that places with scorching summers (z2) are hotter than Pheonix, and places with hyperthermal summers (X) are hotter than Death Valley.
Global distribution of summer categories (projections are SSP5-8.5 high emissions normals)


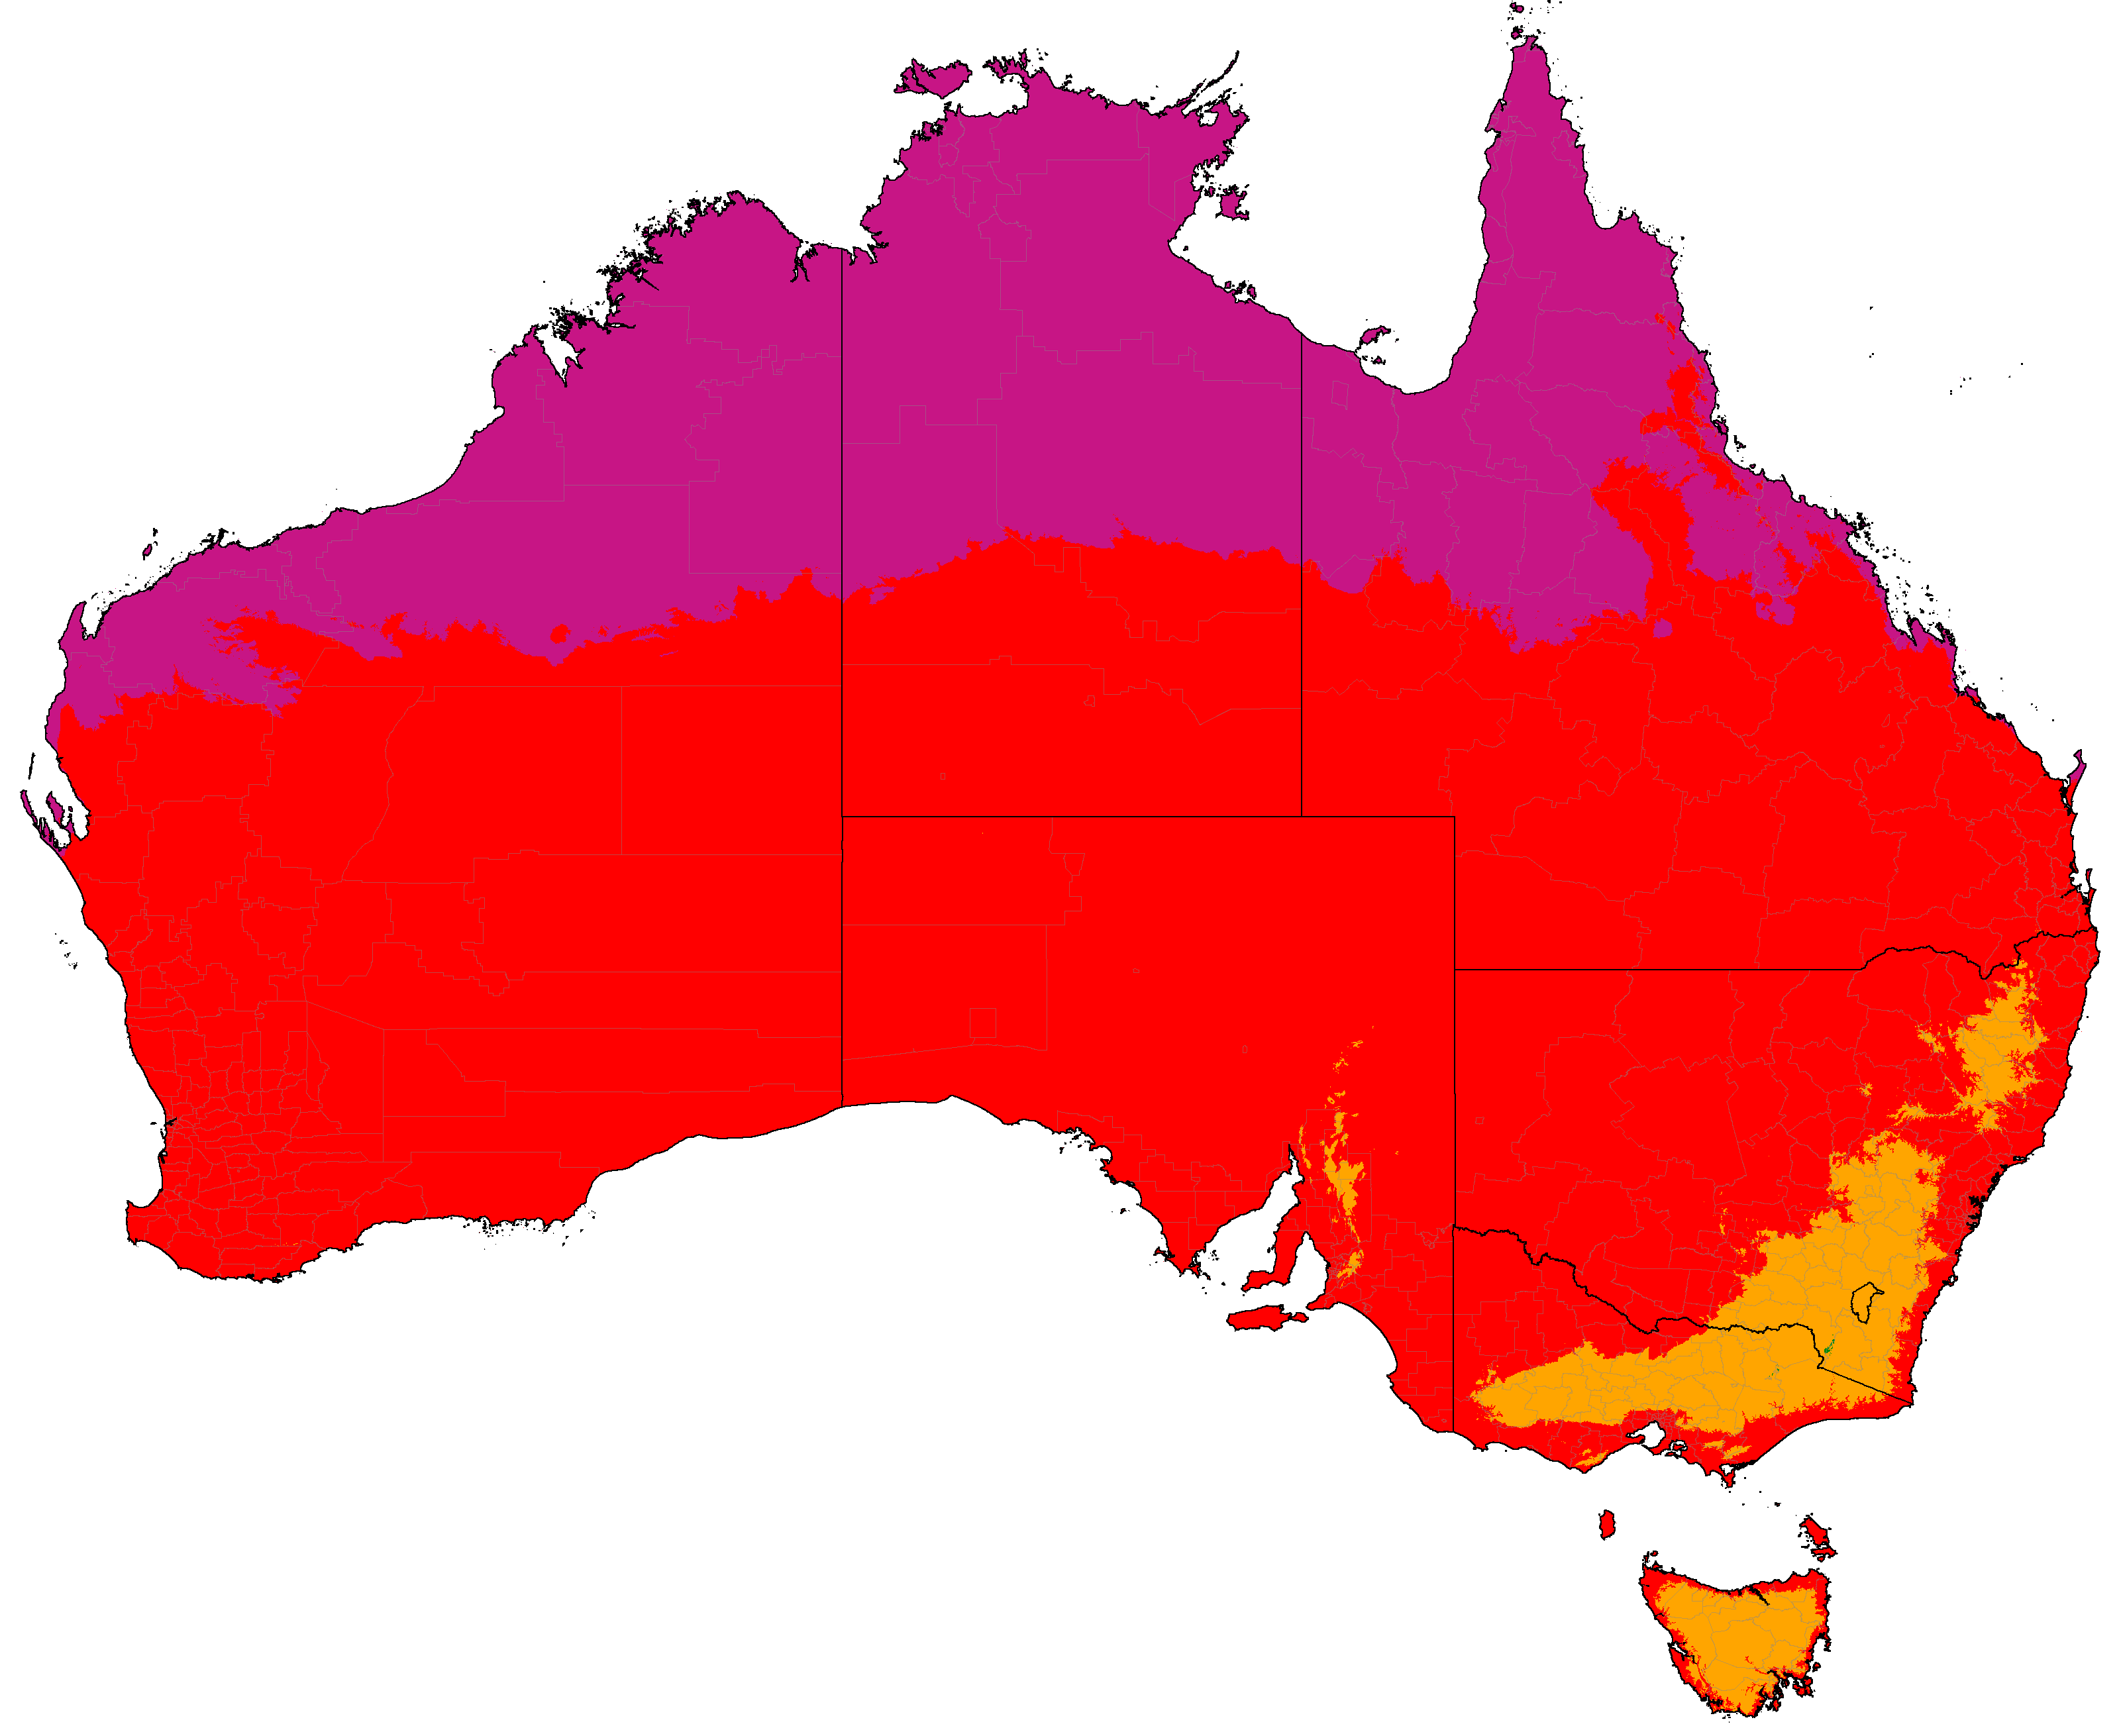
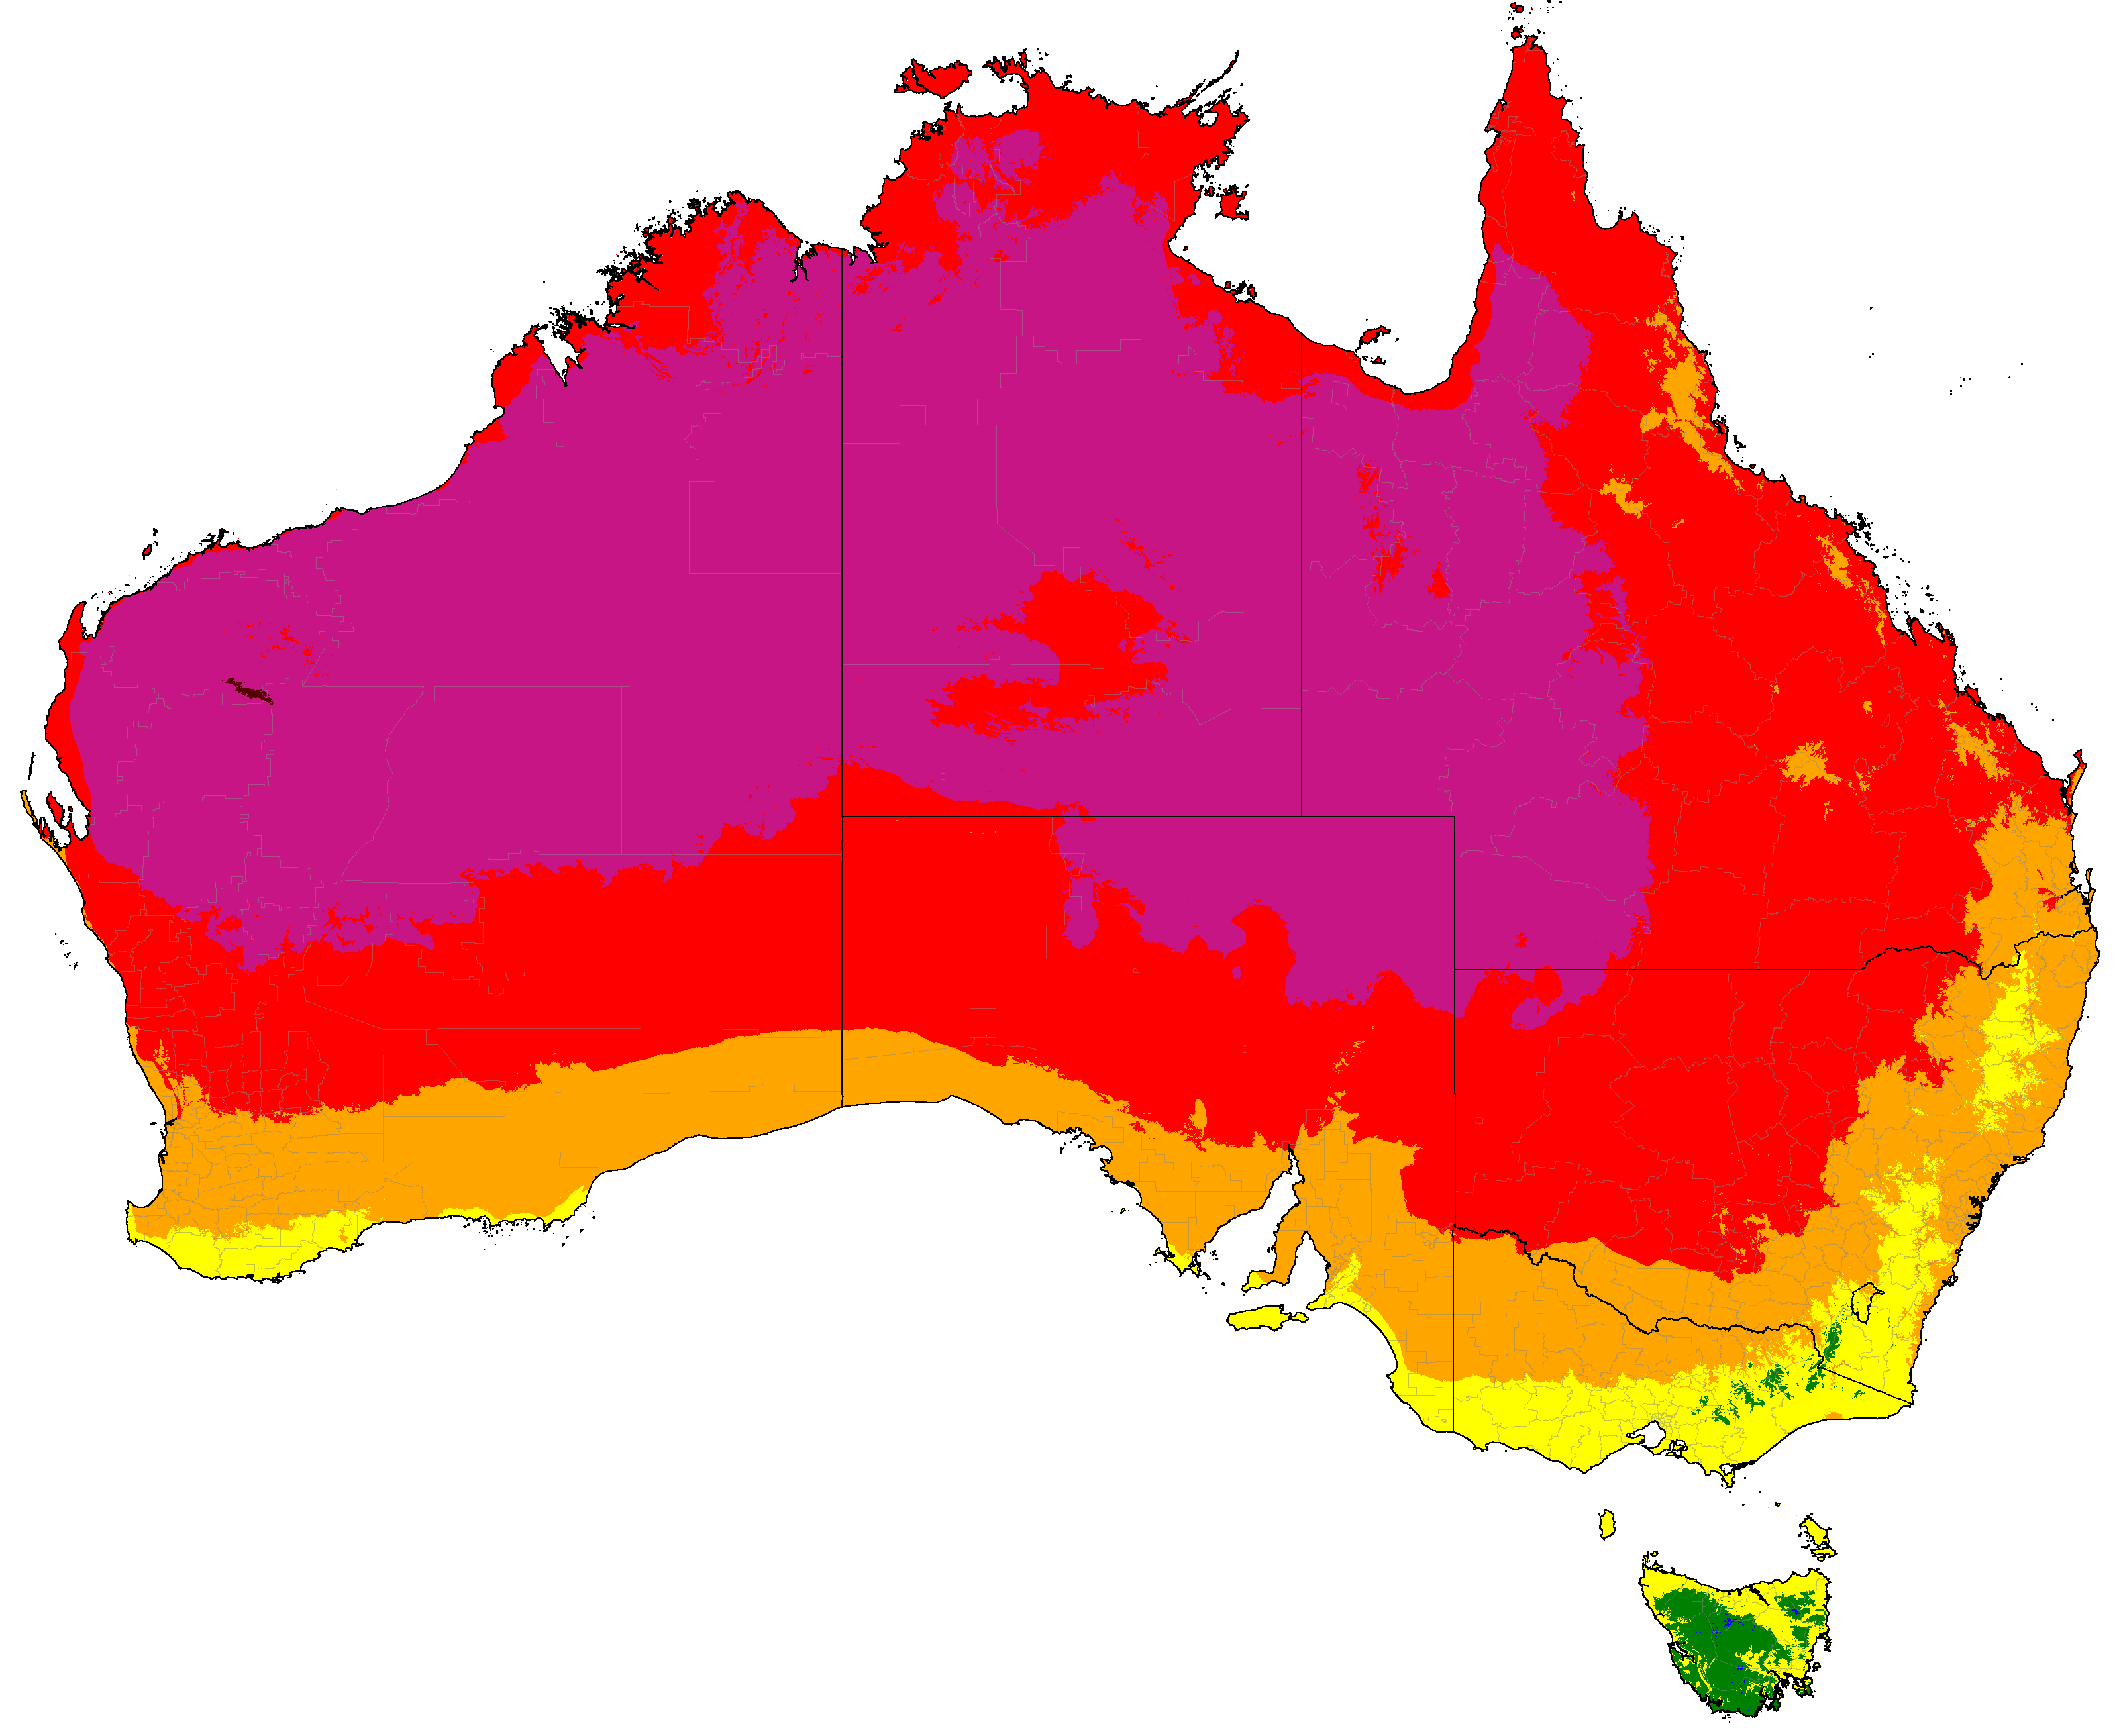
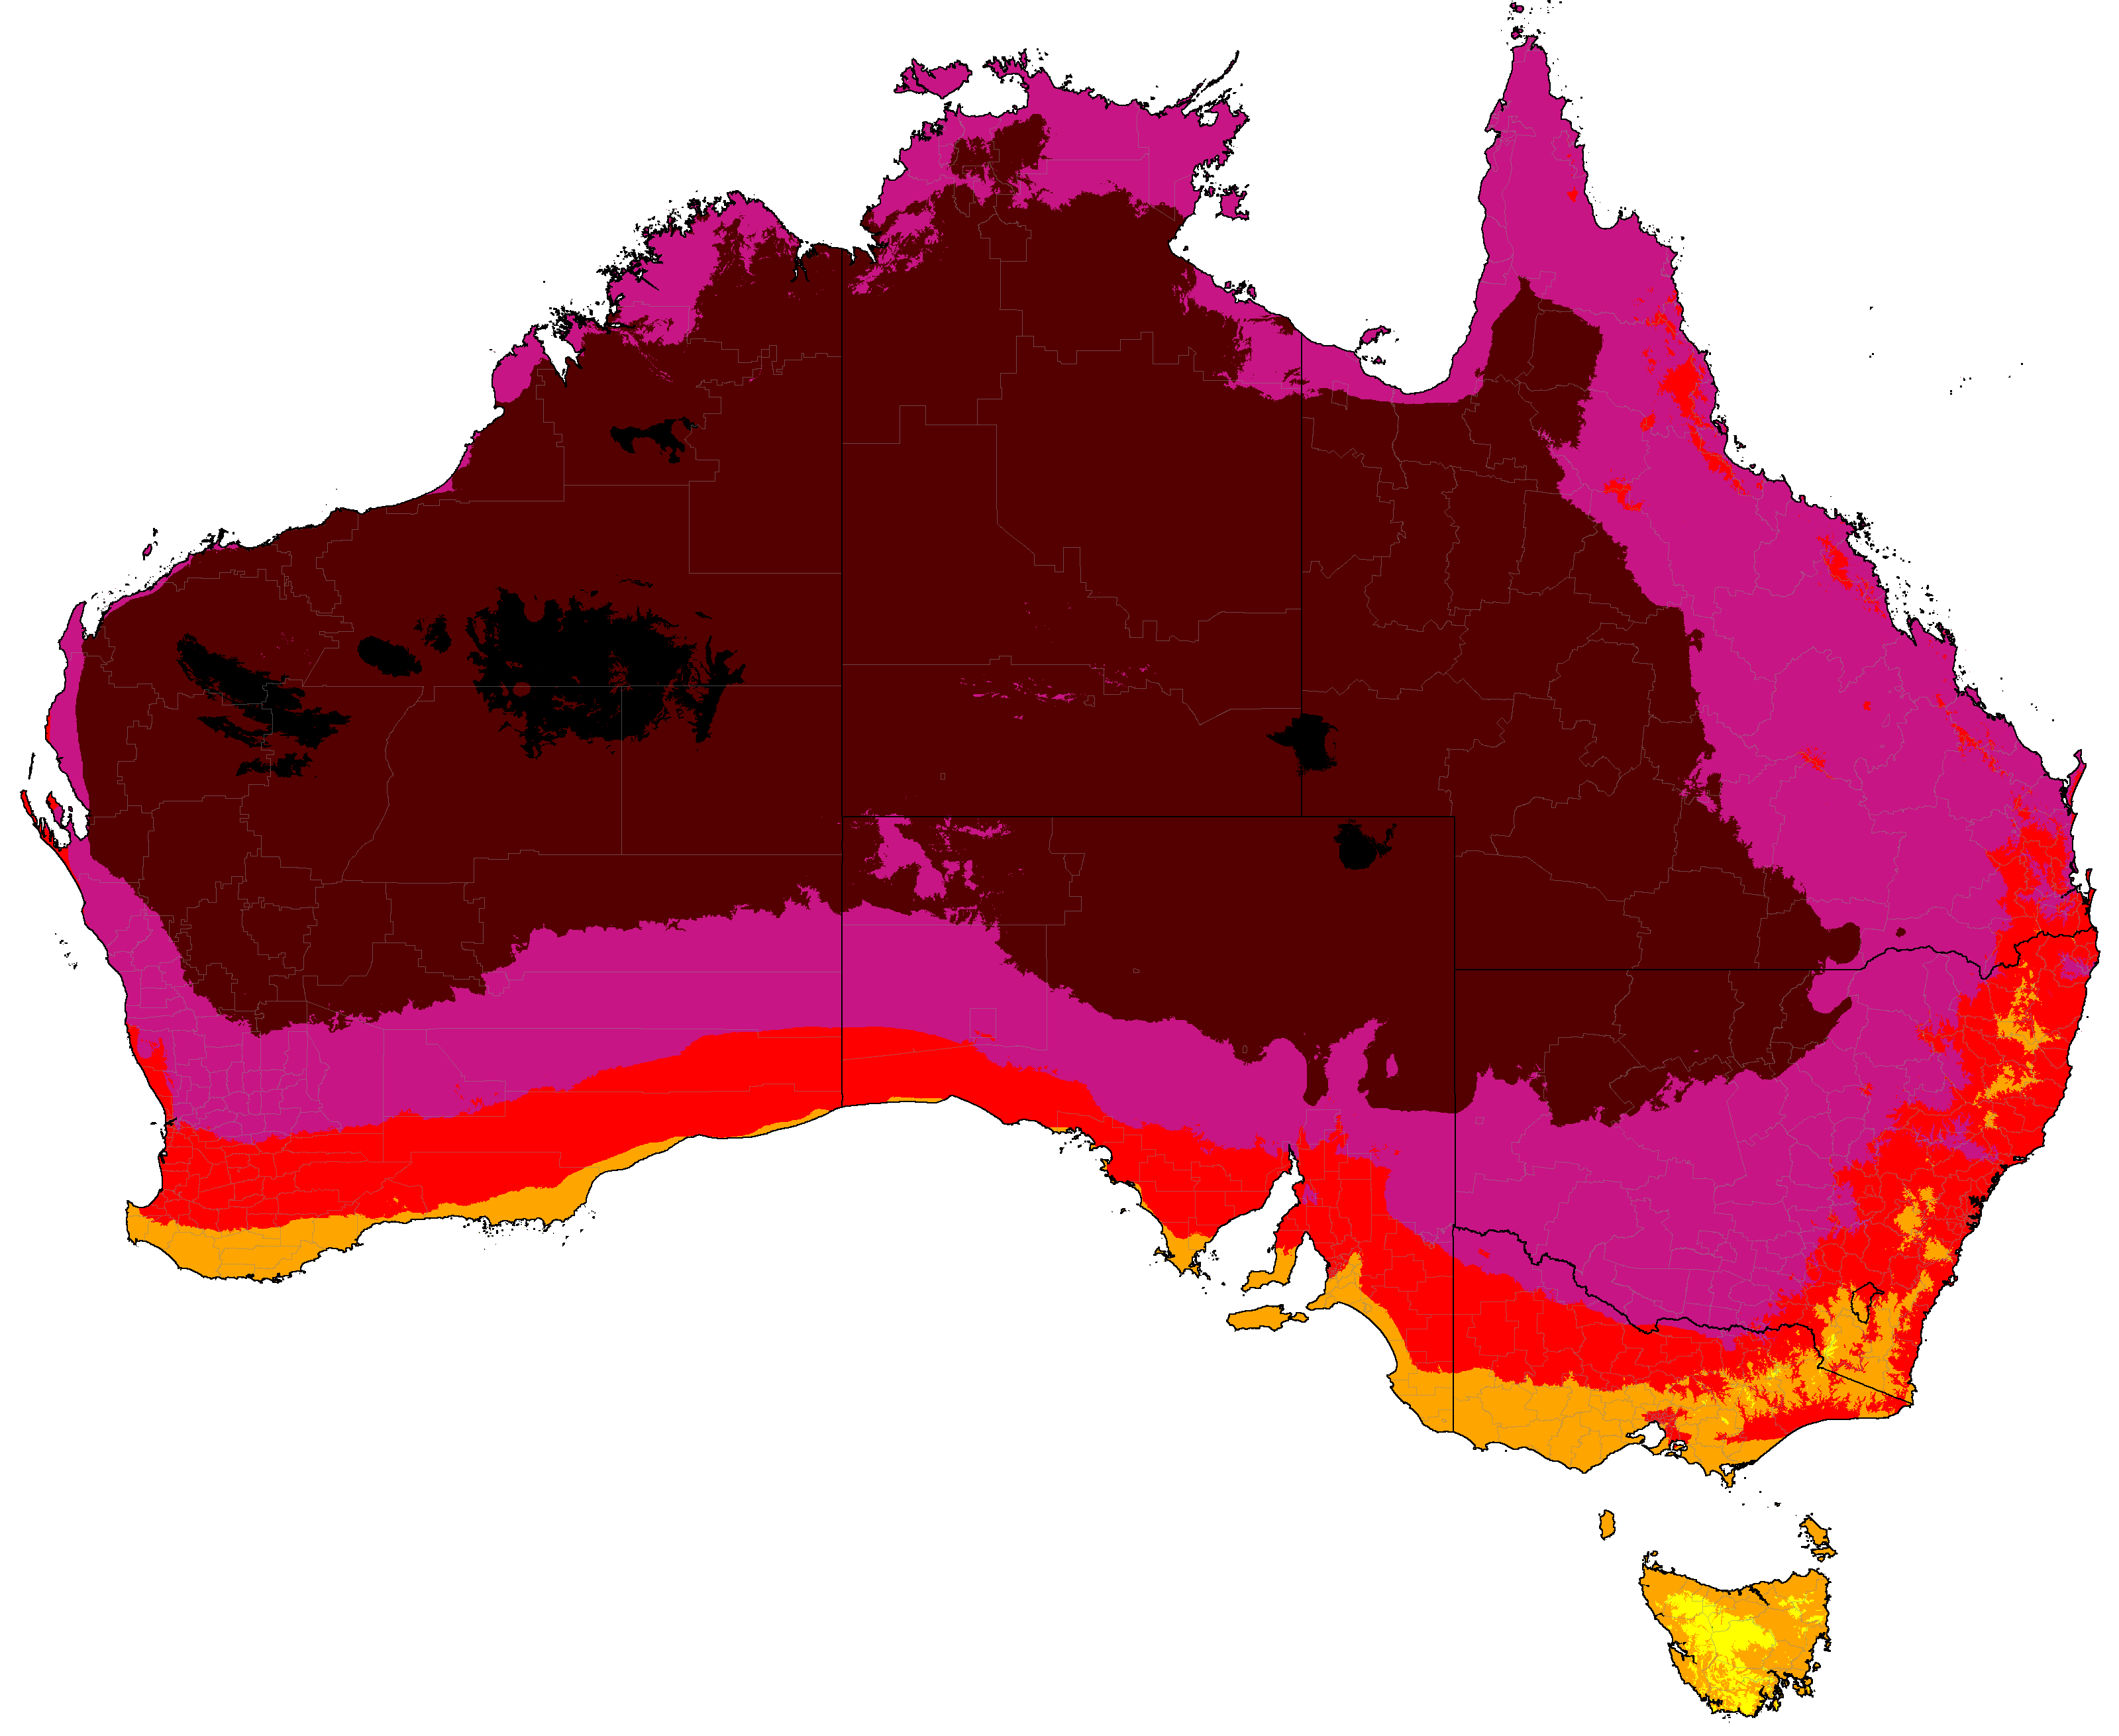
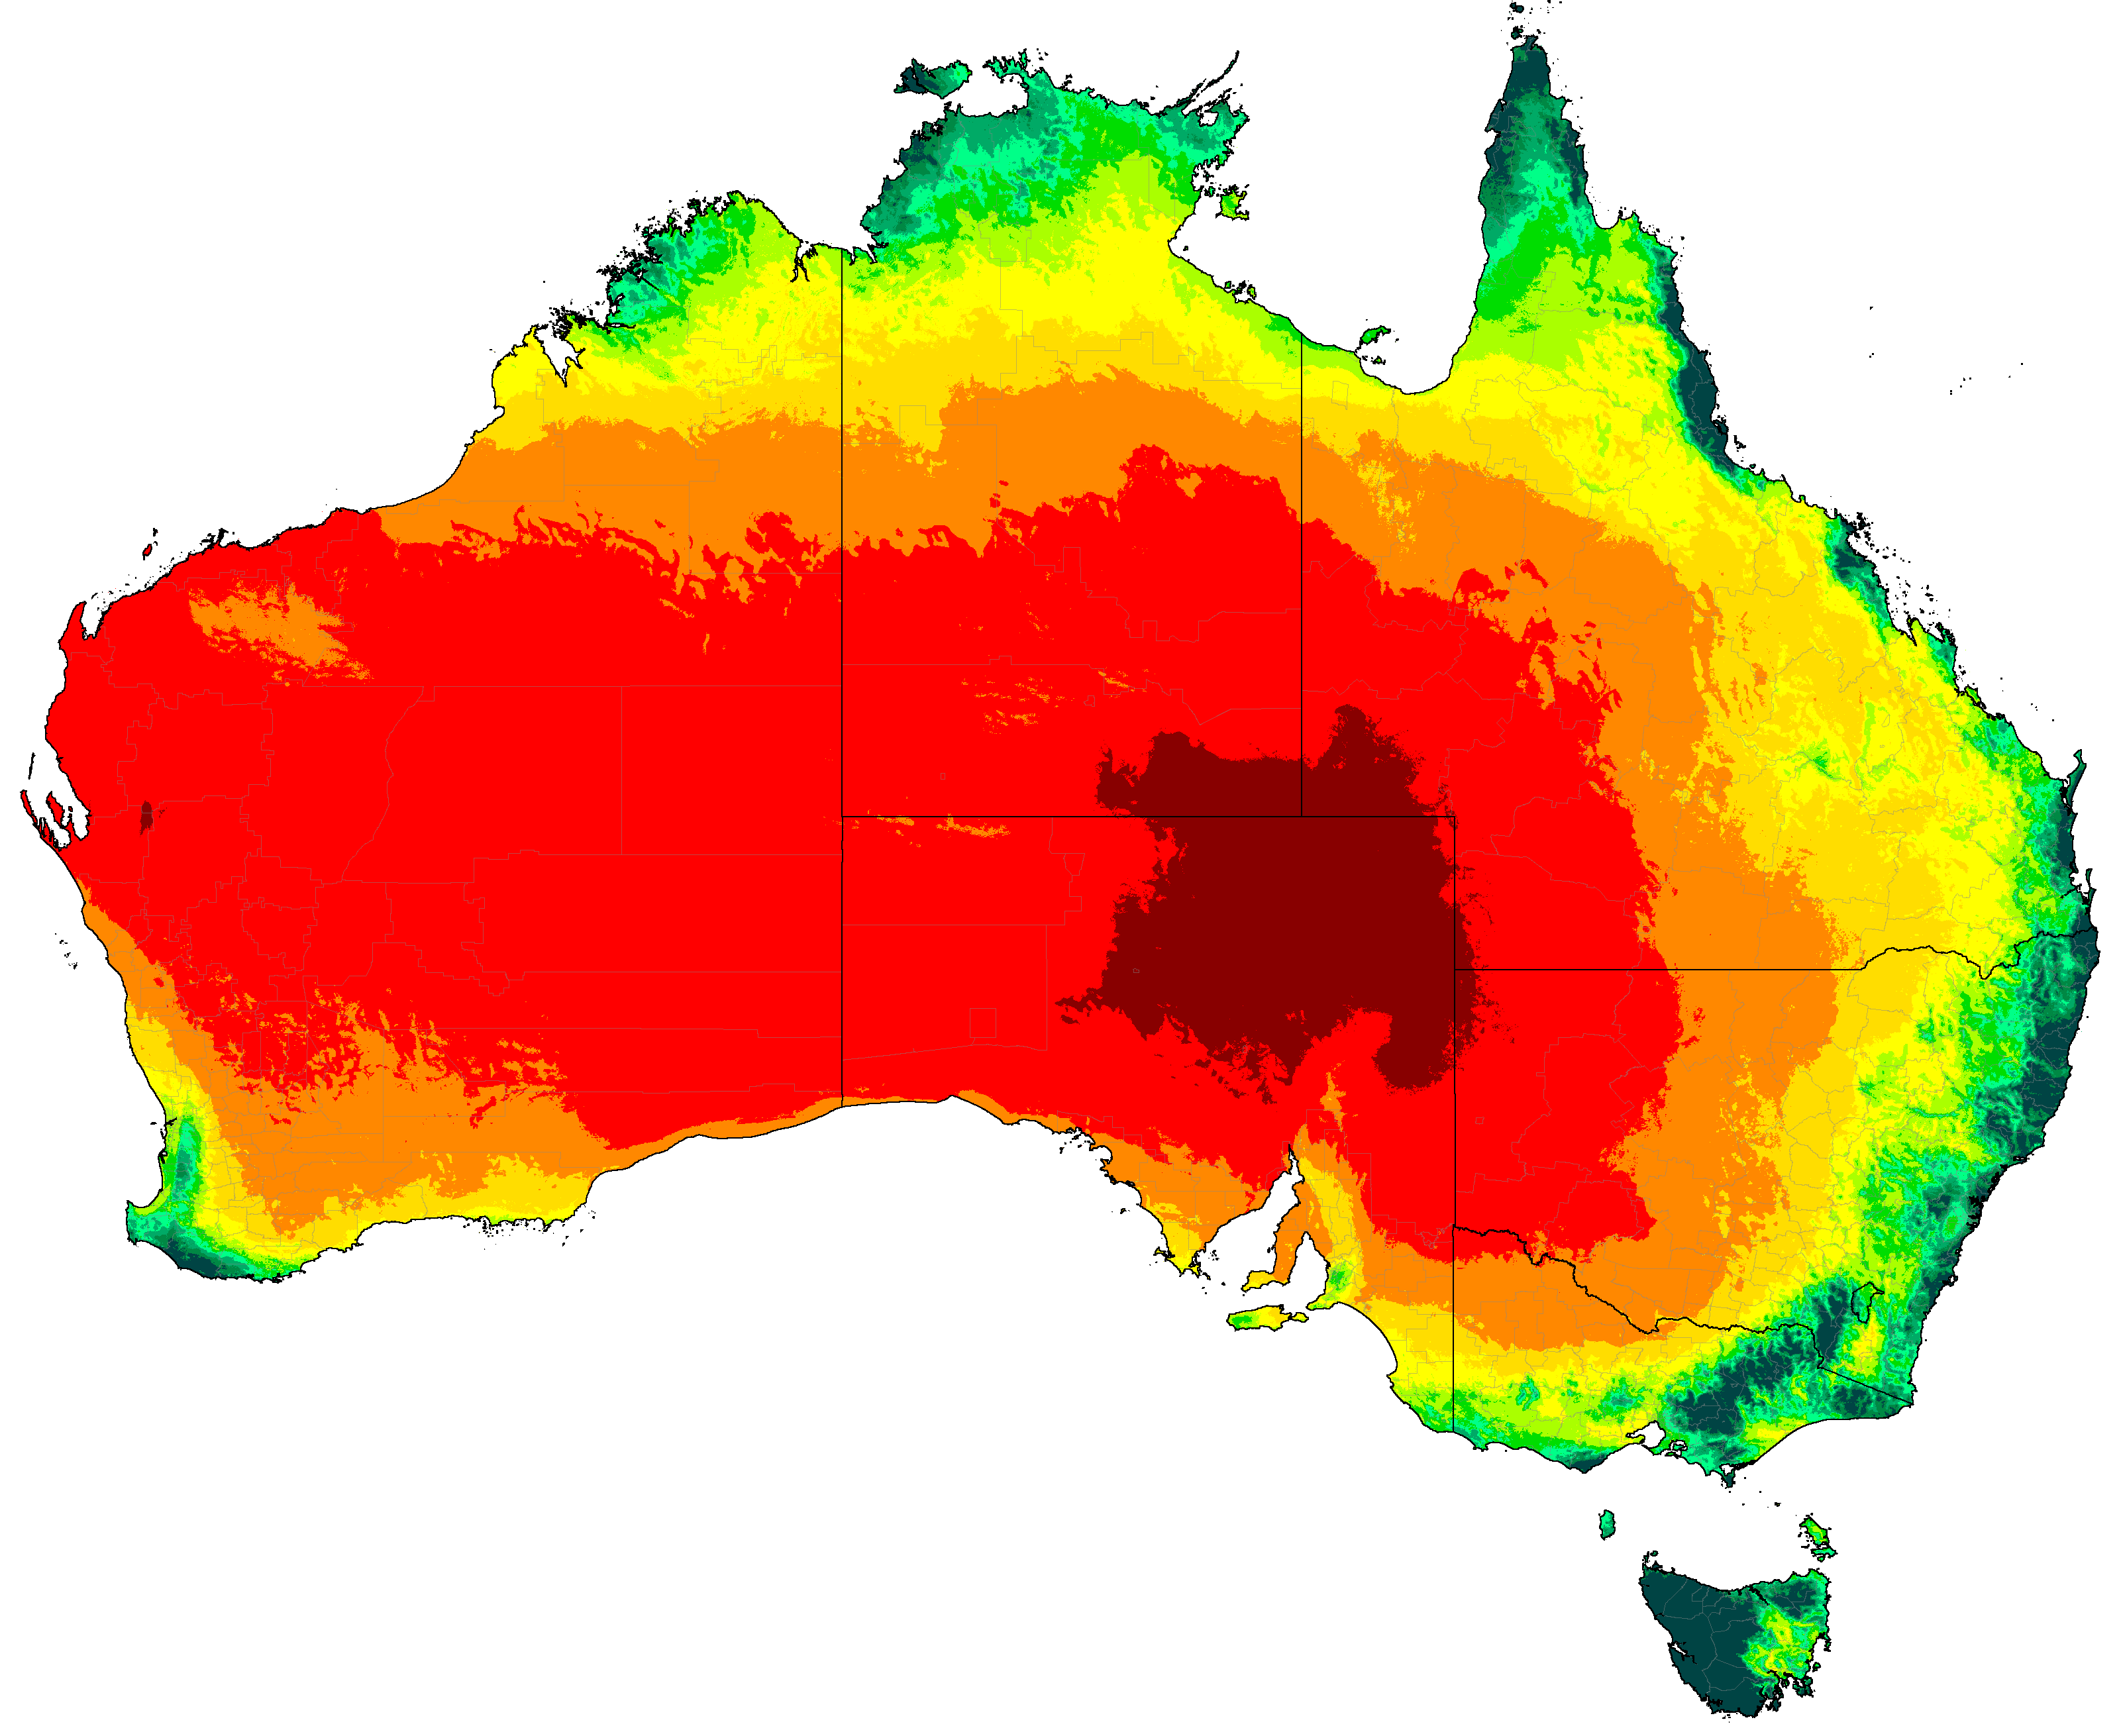
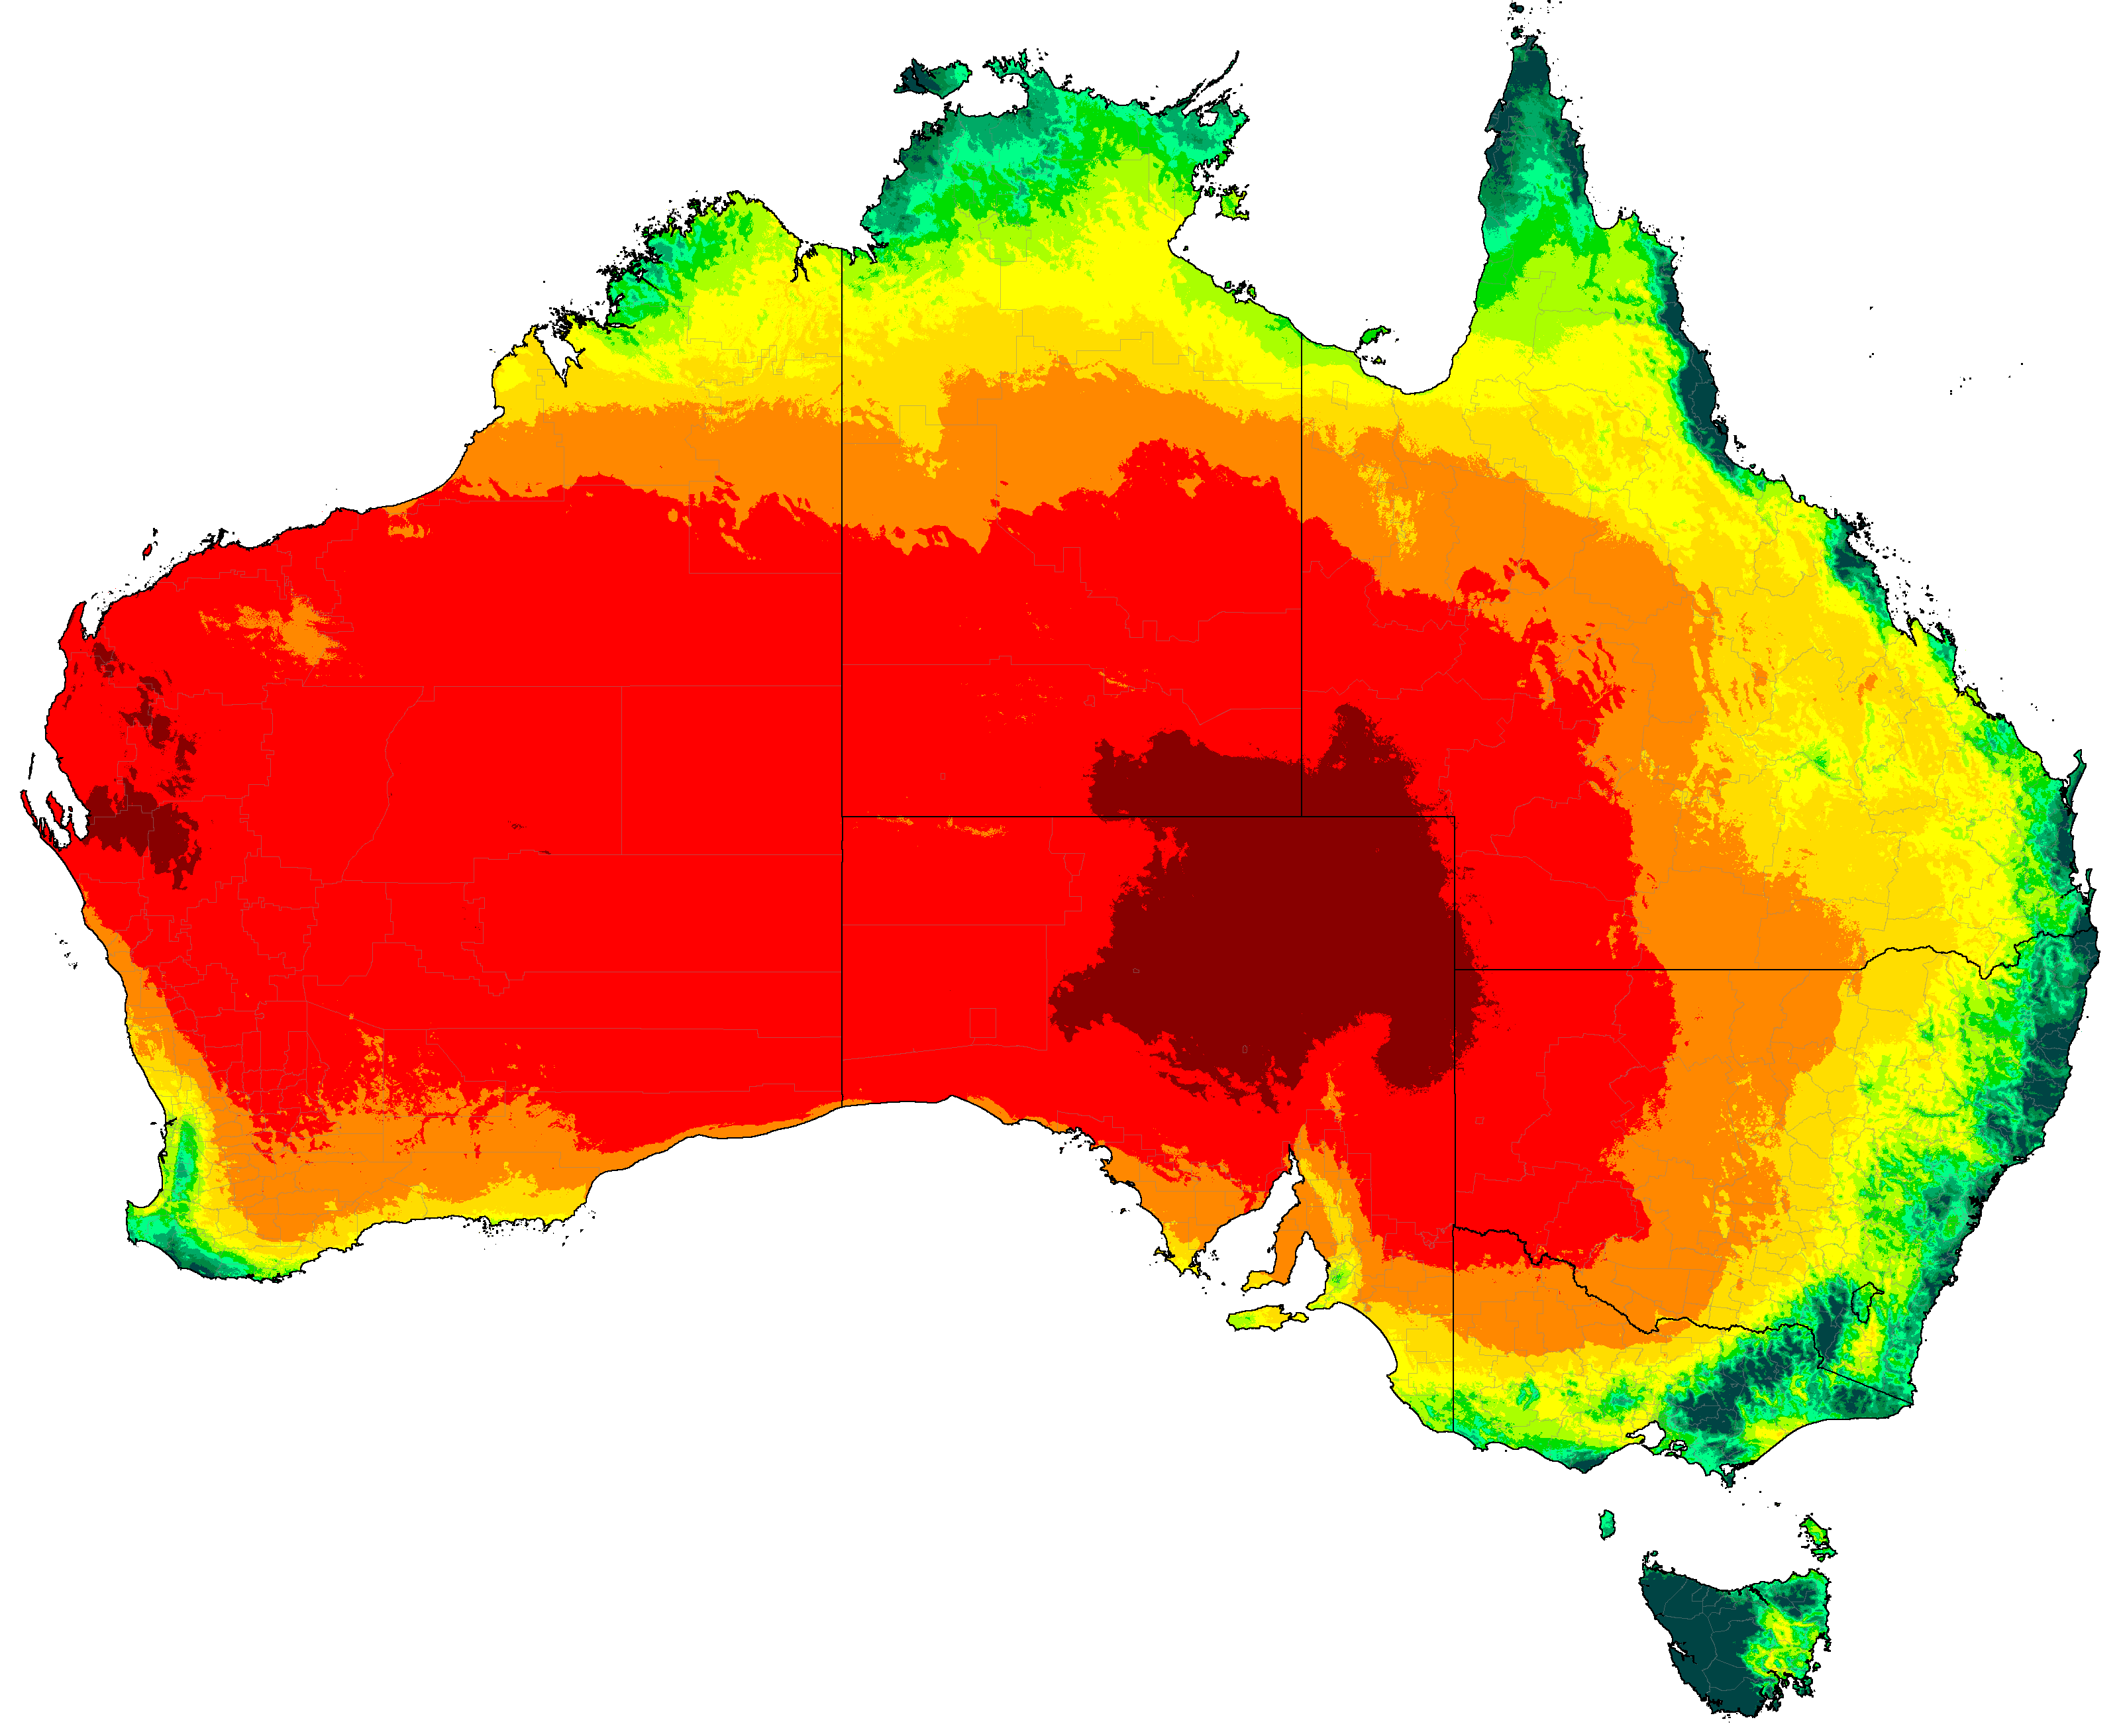
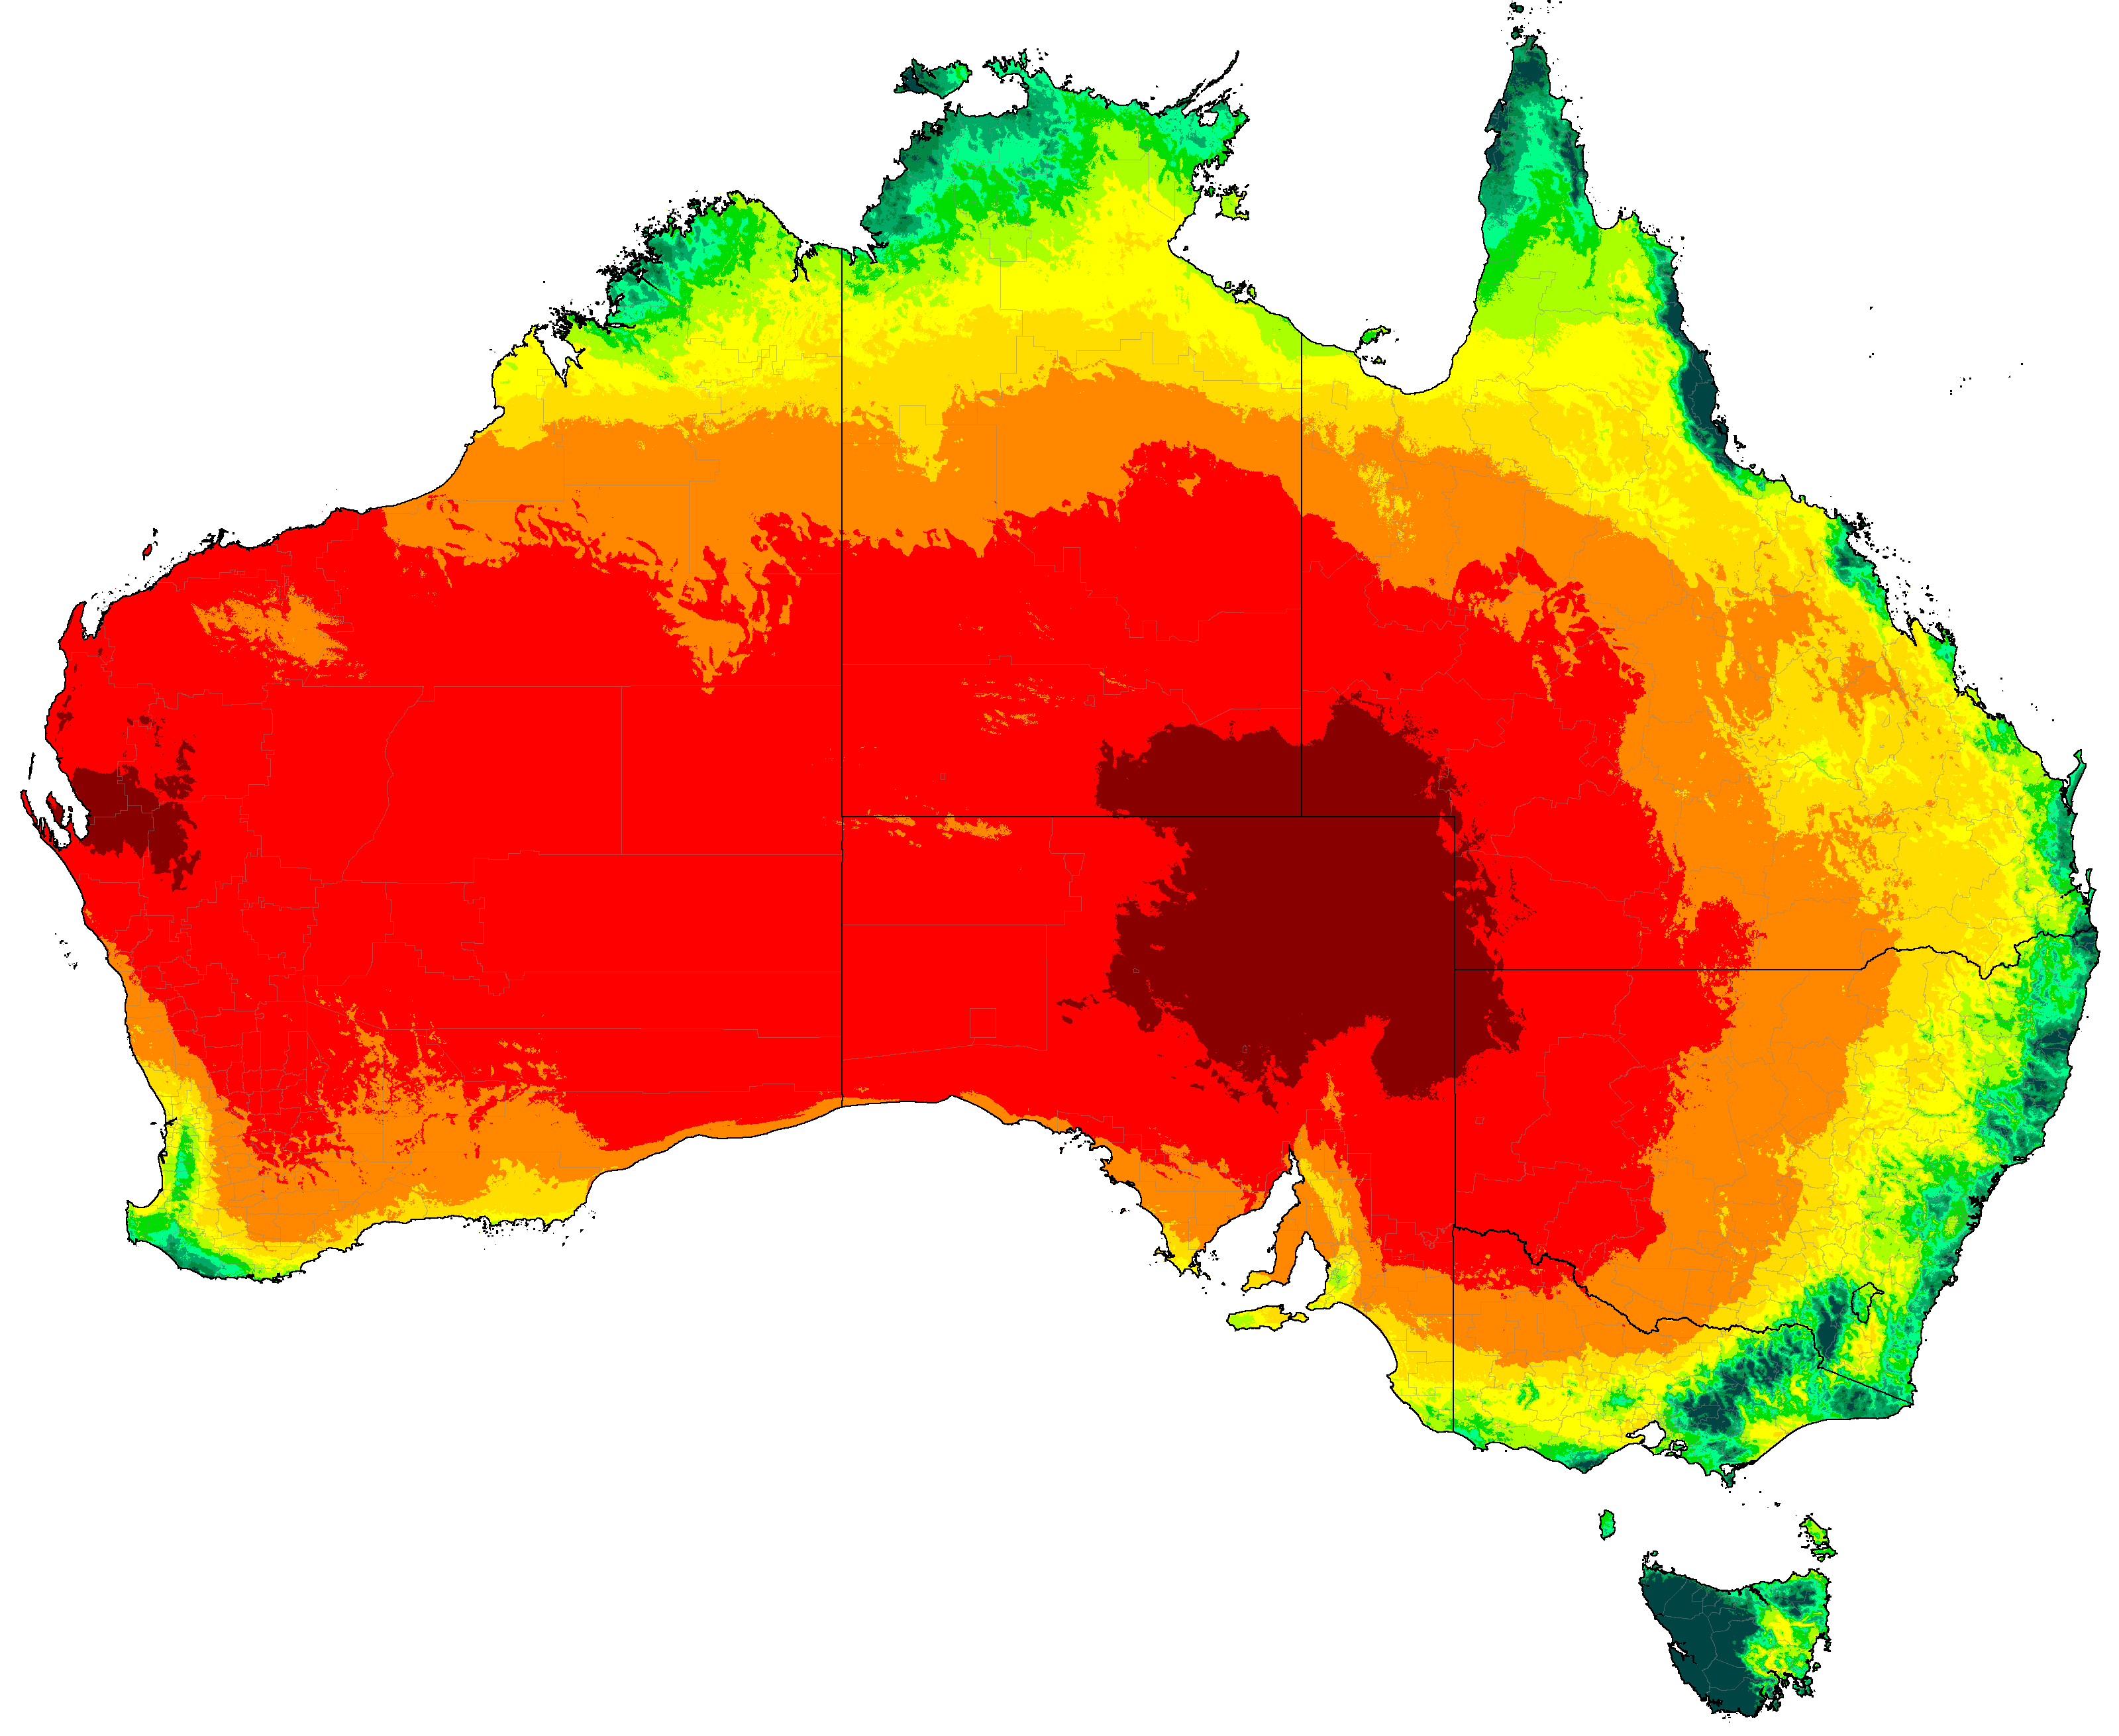
Australia distribution of summer categories (projections are SSP5-8.5 high emissions normals)
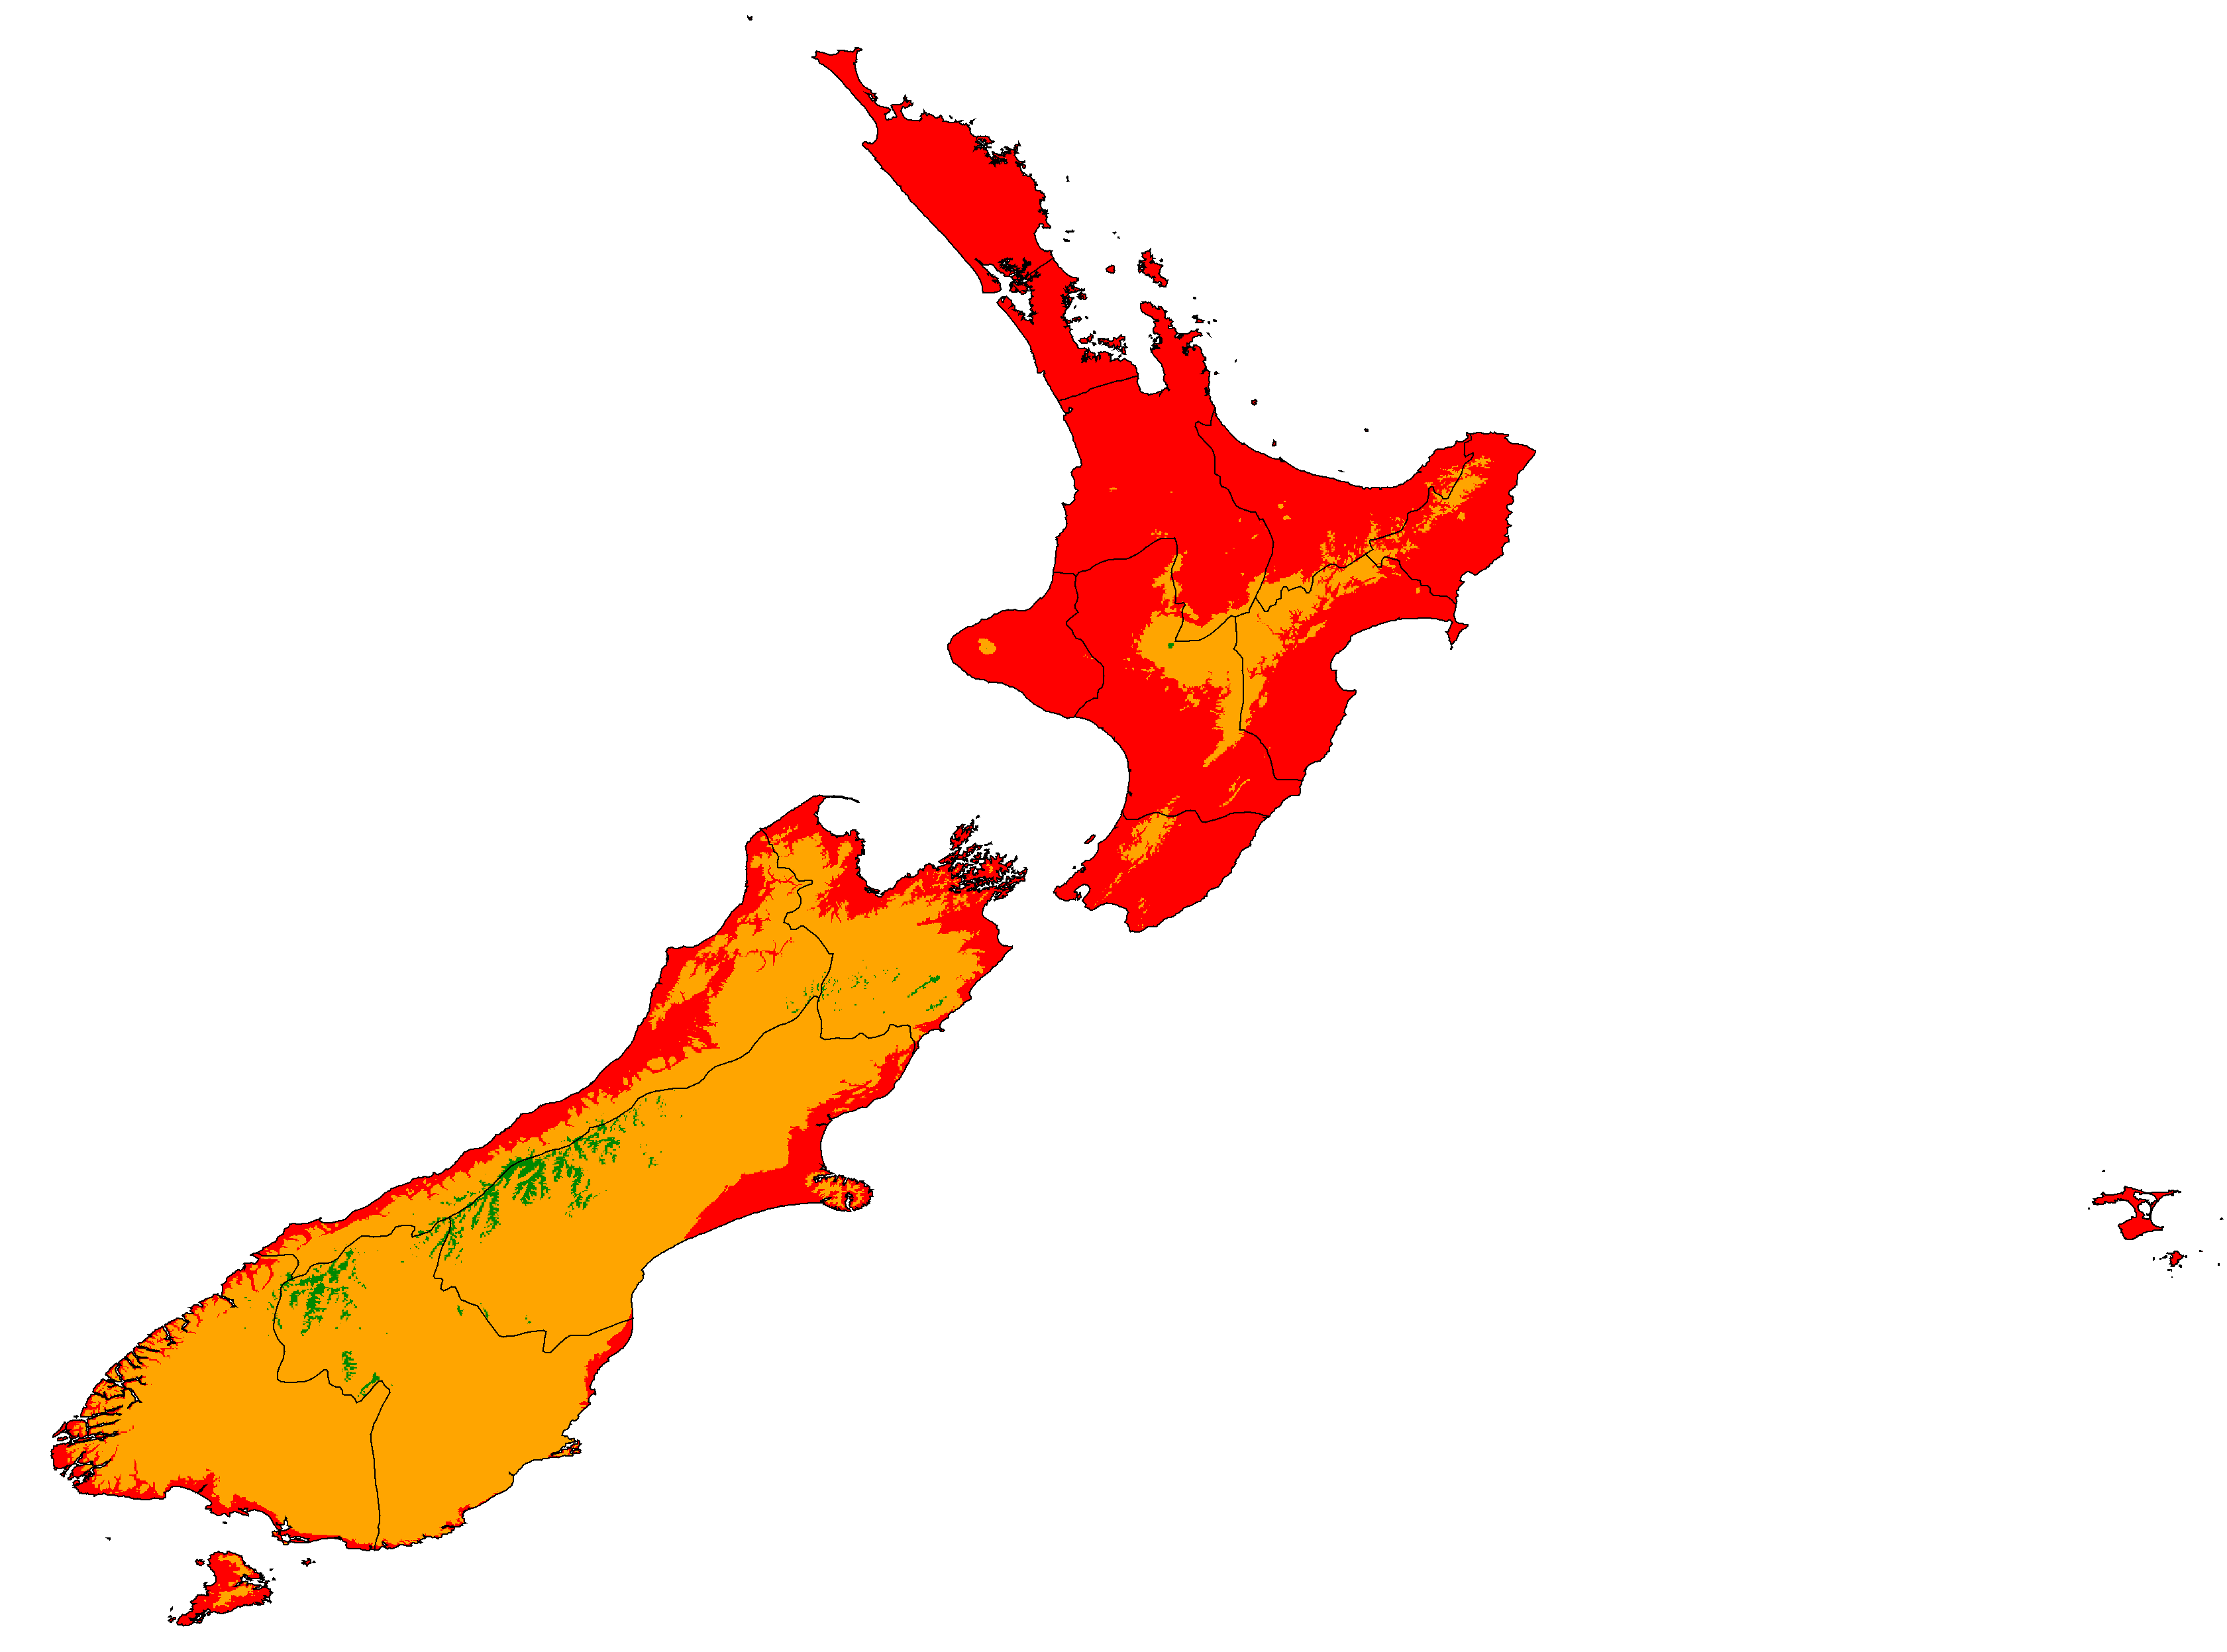
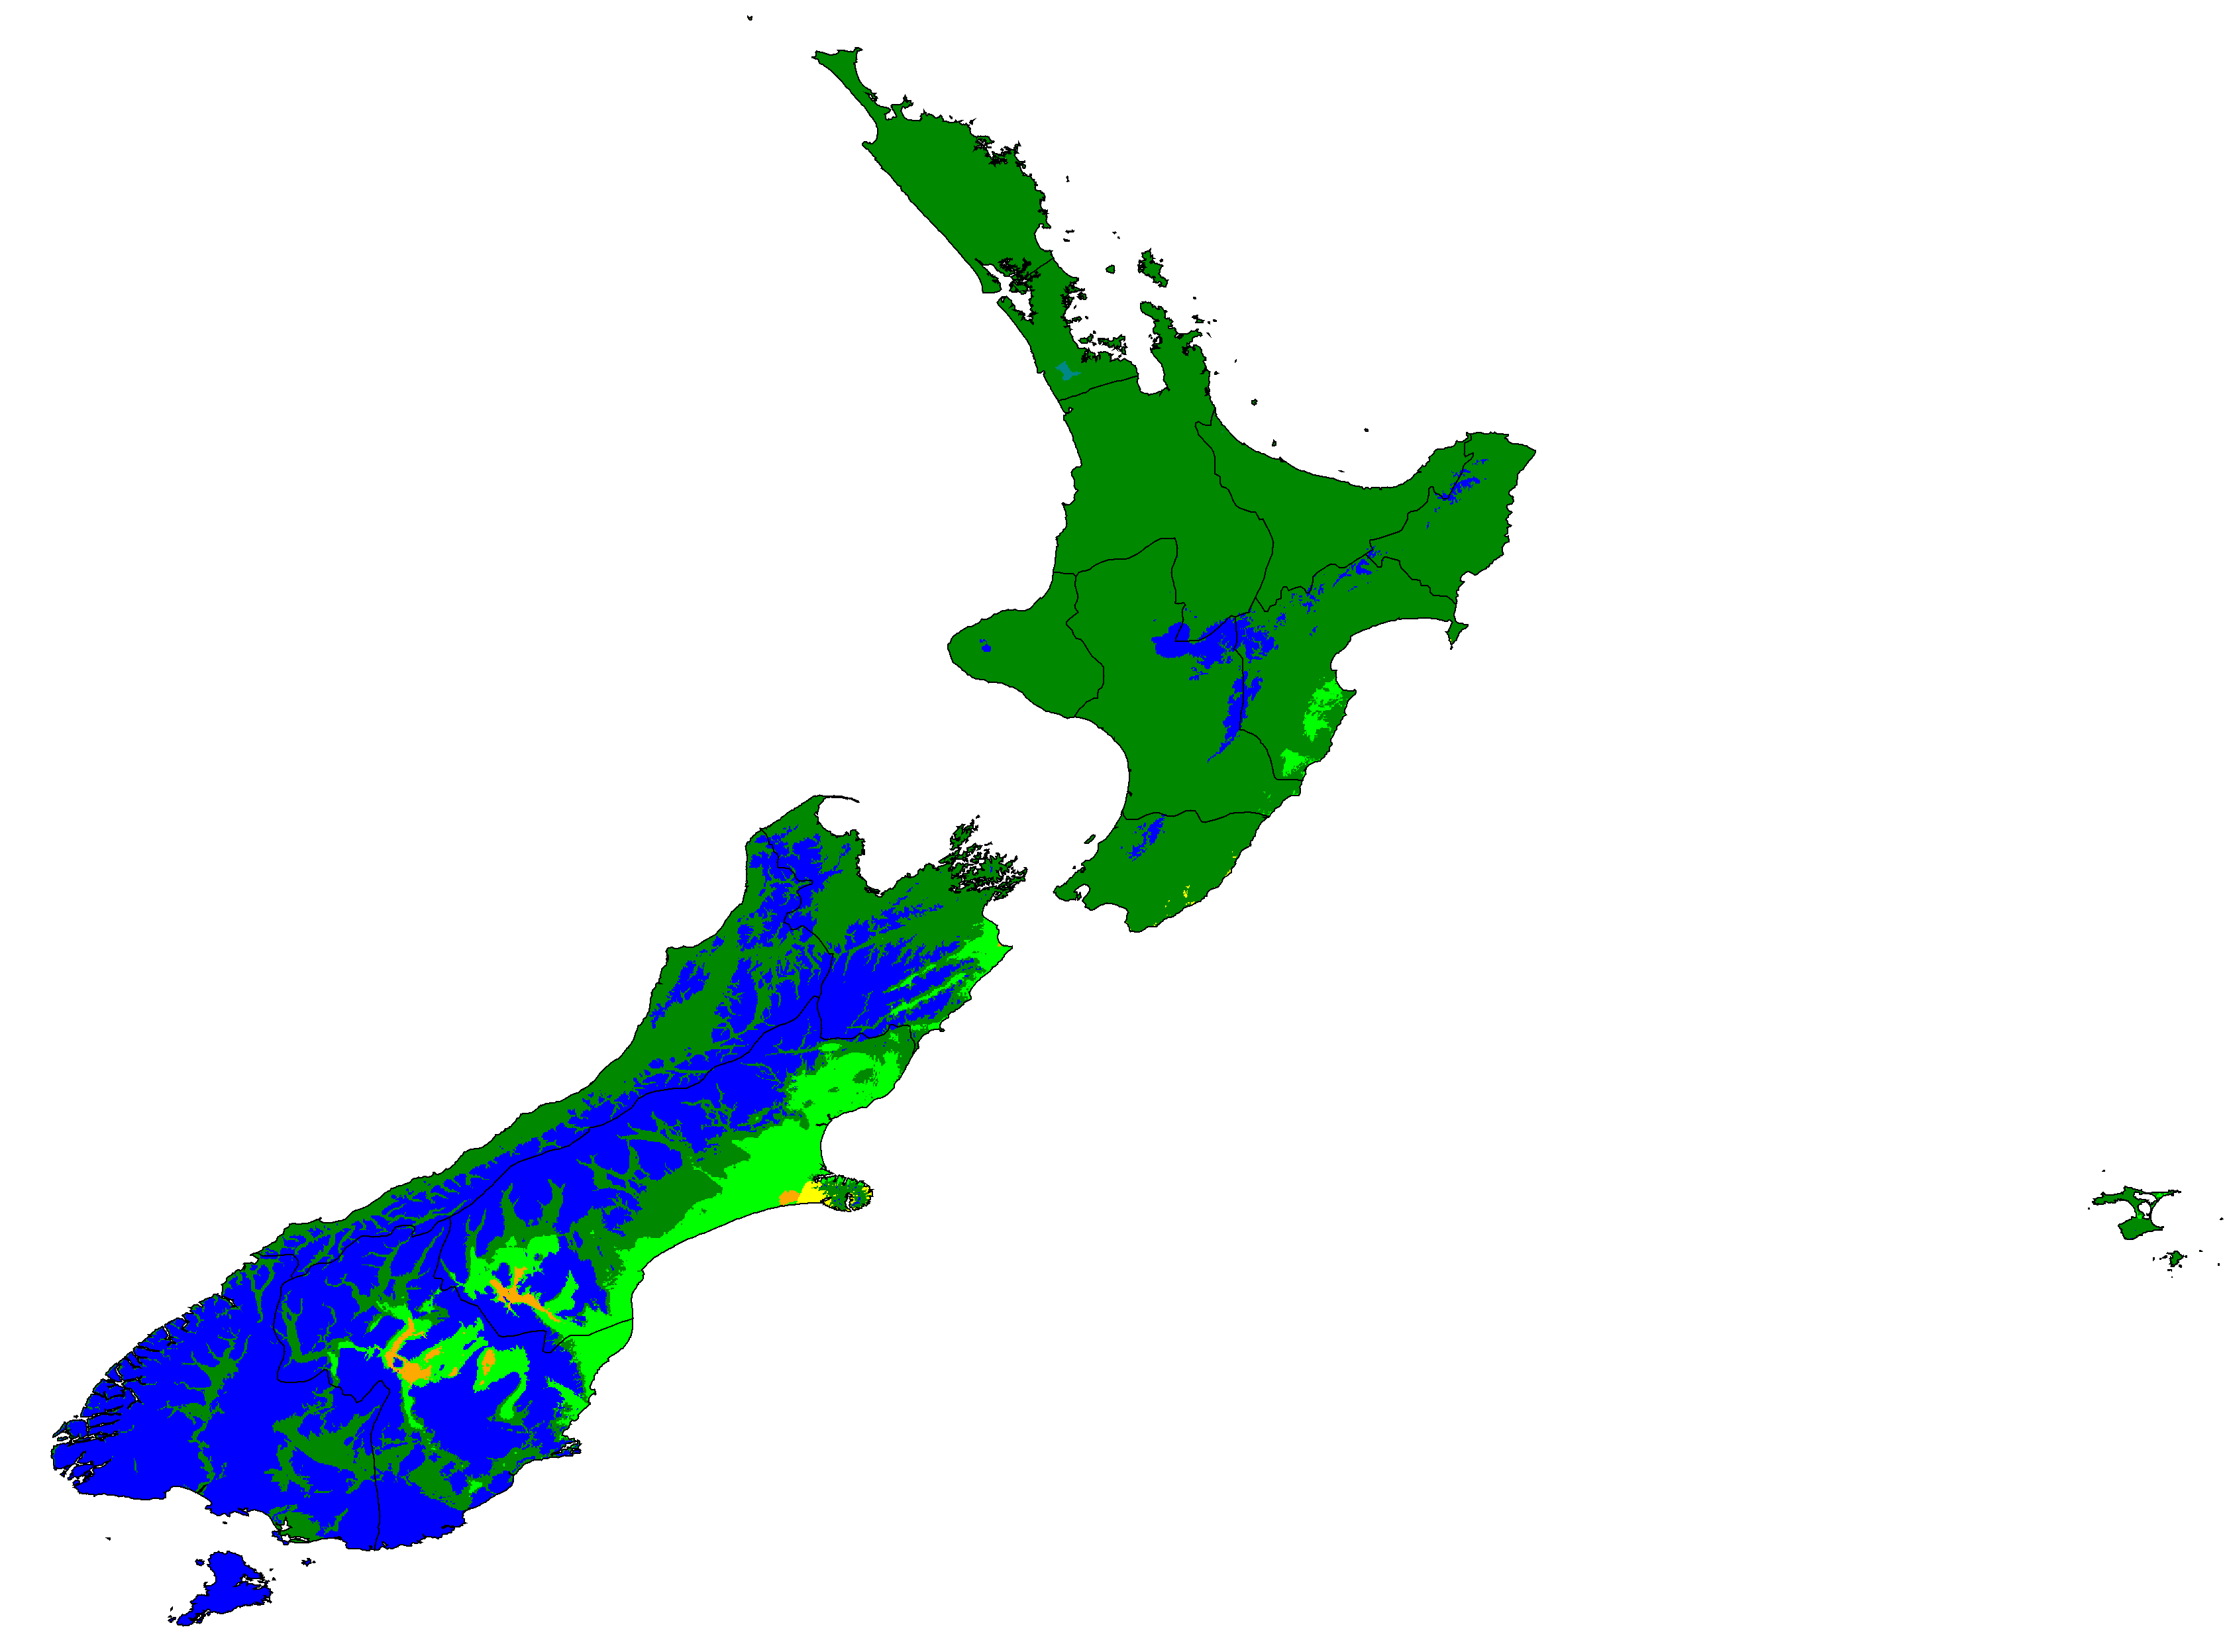
New Zealand distribution of summer categories (projections are SSP5-8.5 high emissions normals)
Hawaii distribution of summer categories (projections are SSP5-8.5 high emissions normals)

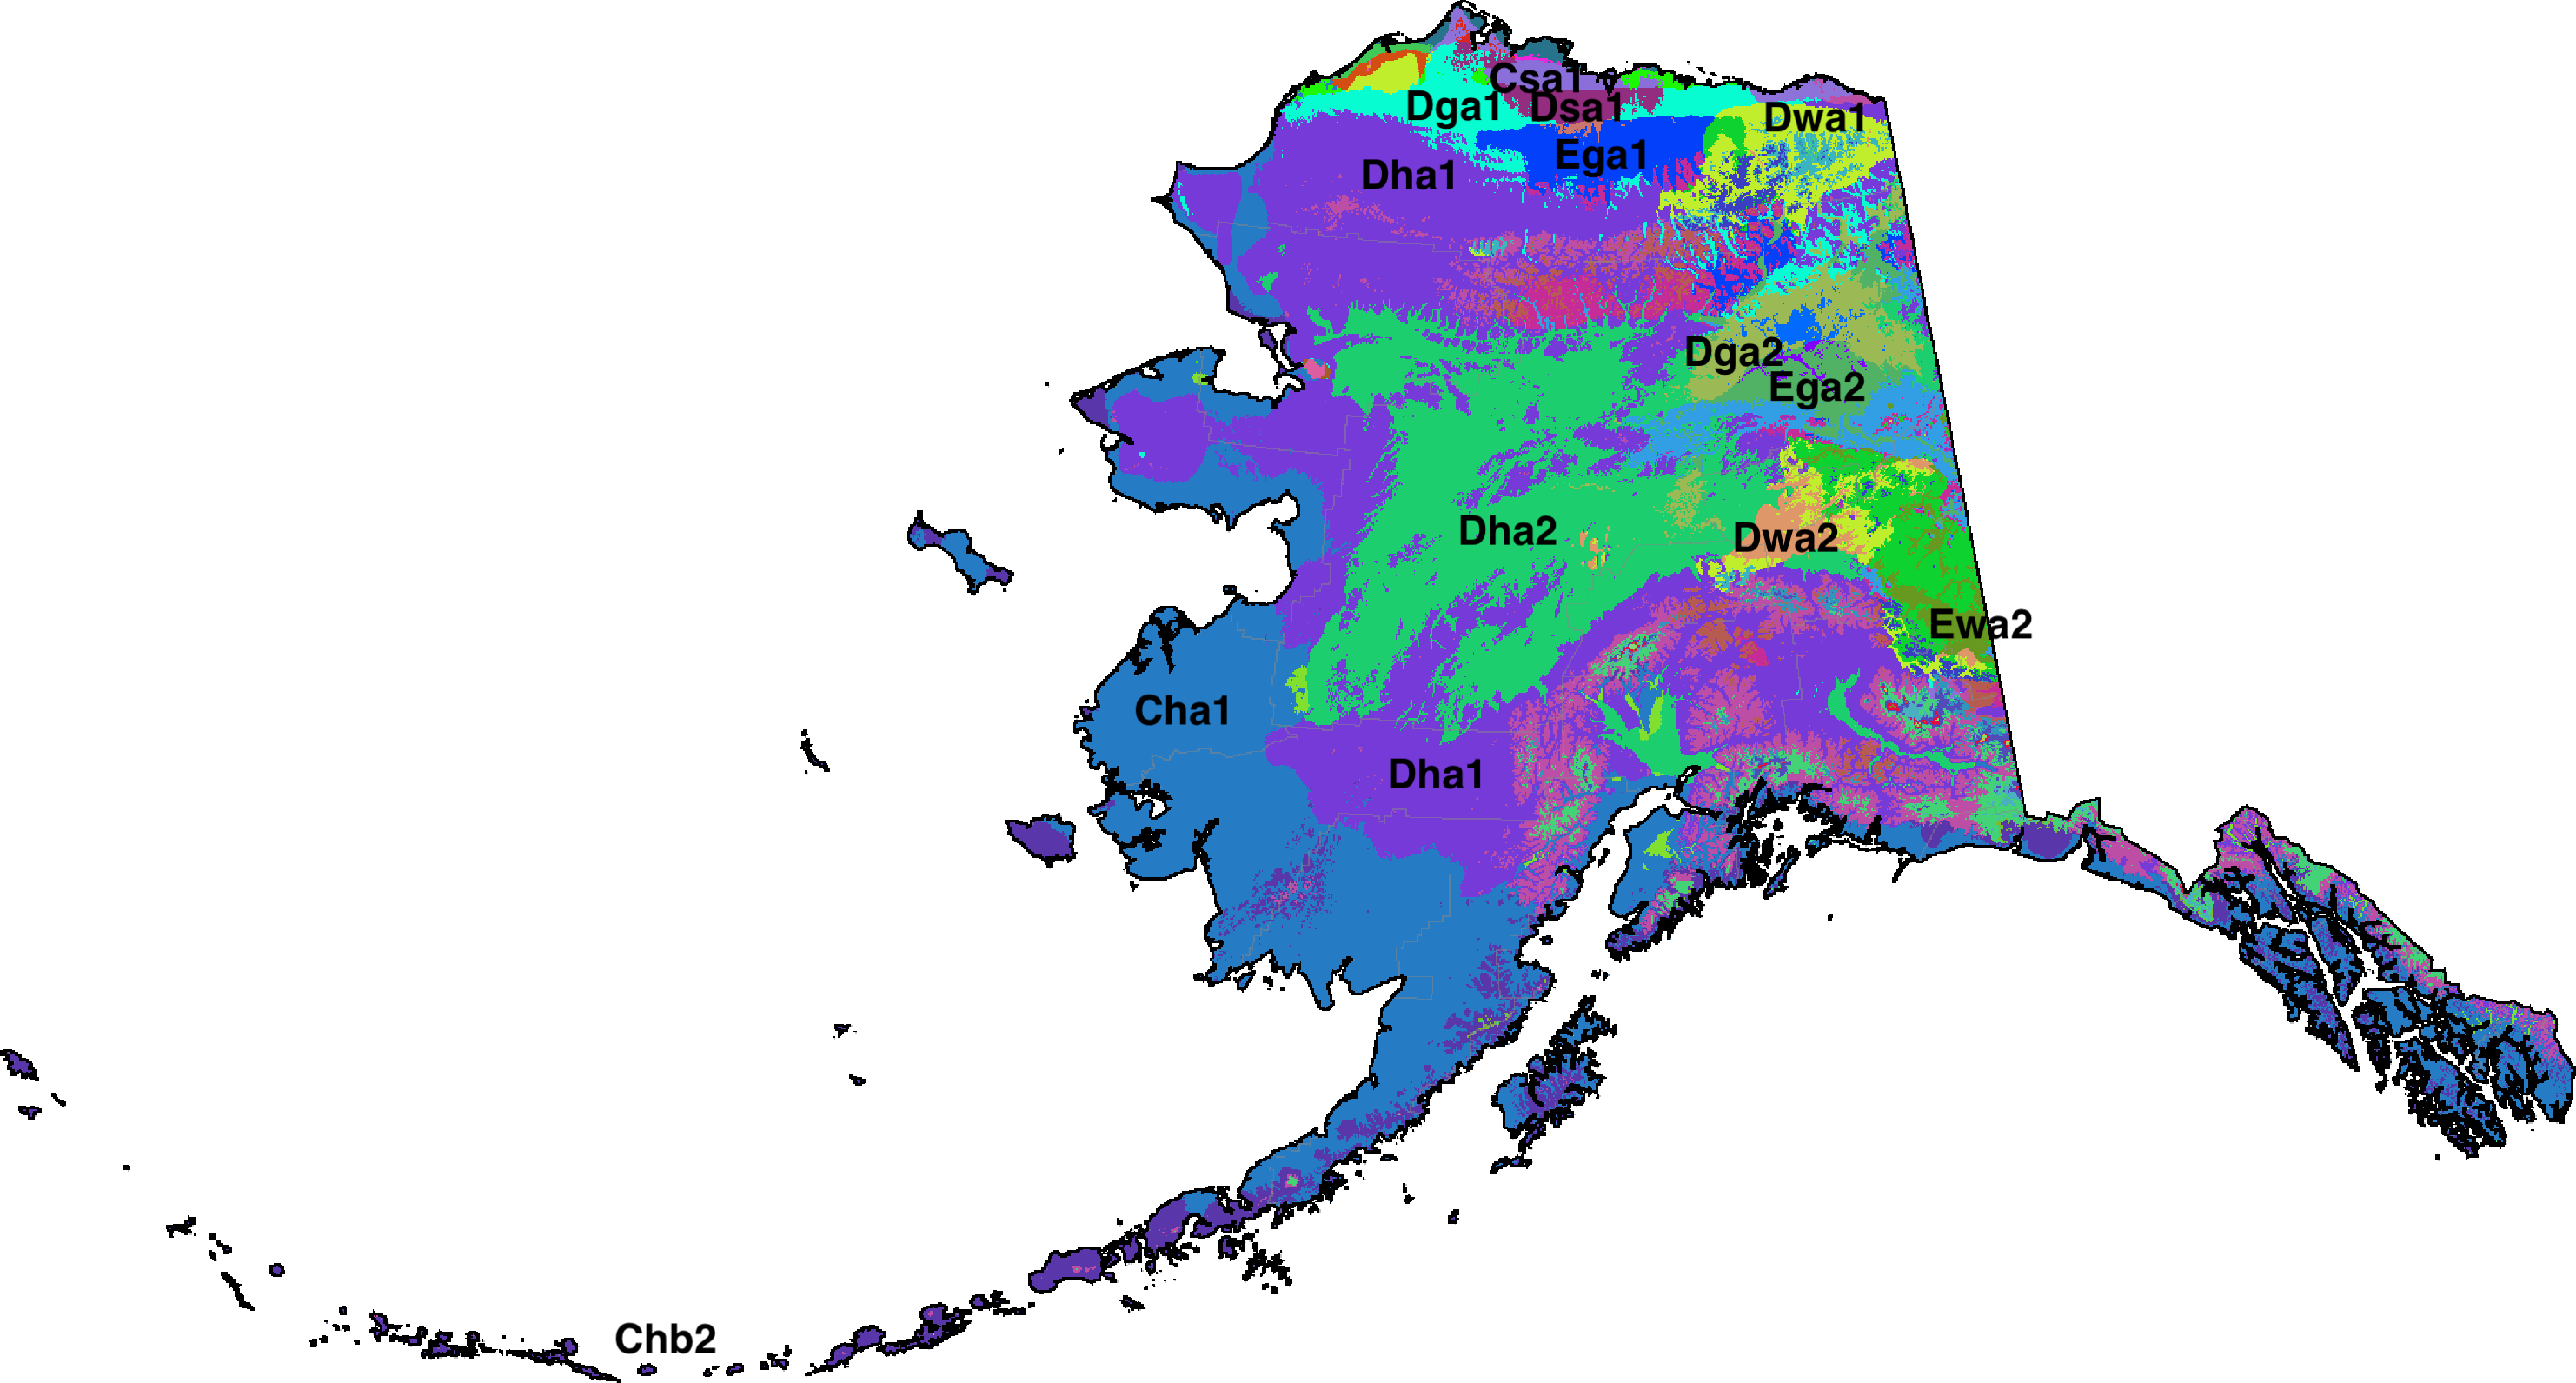
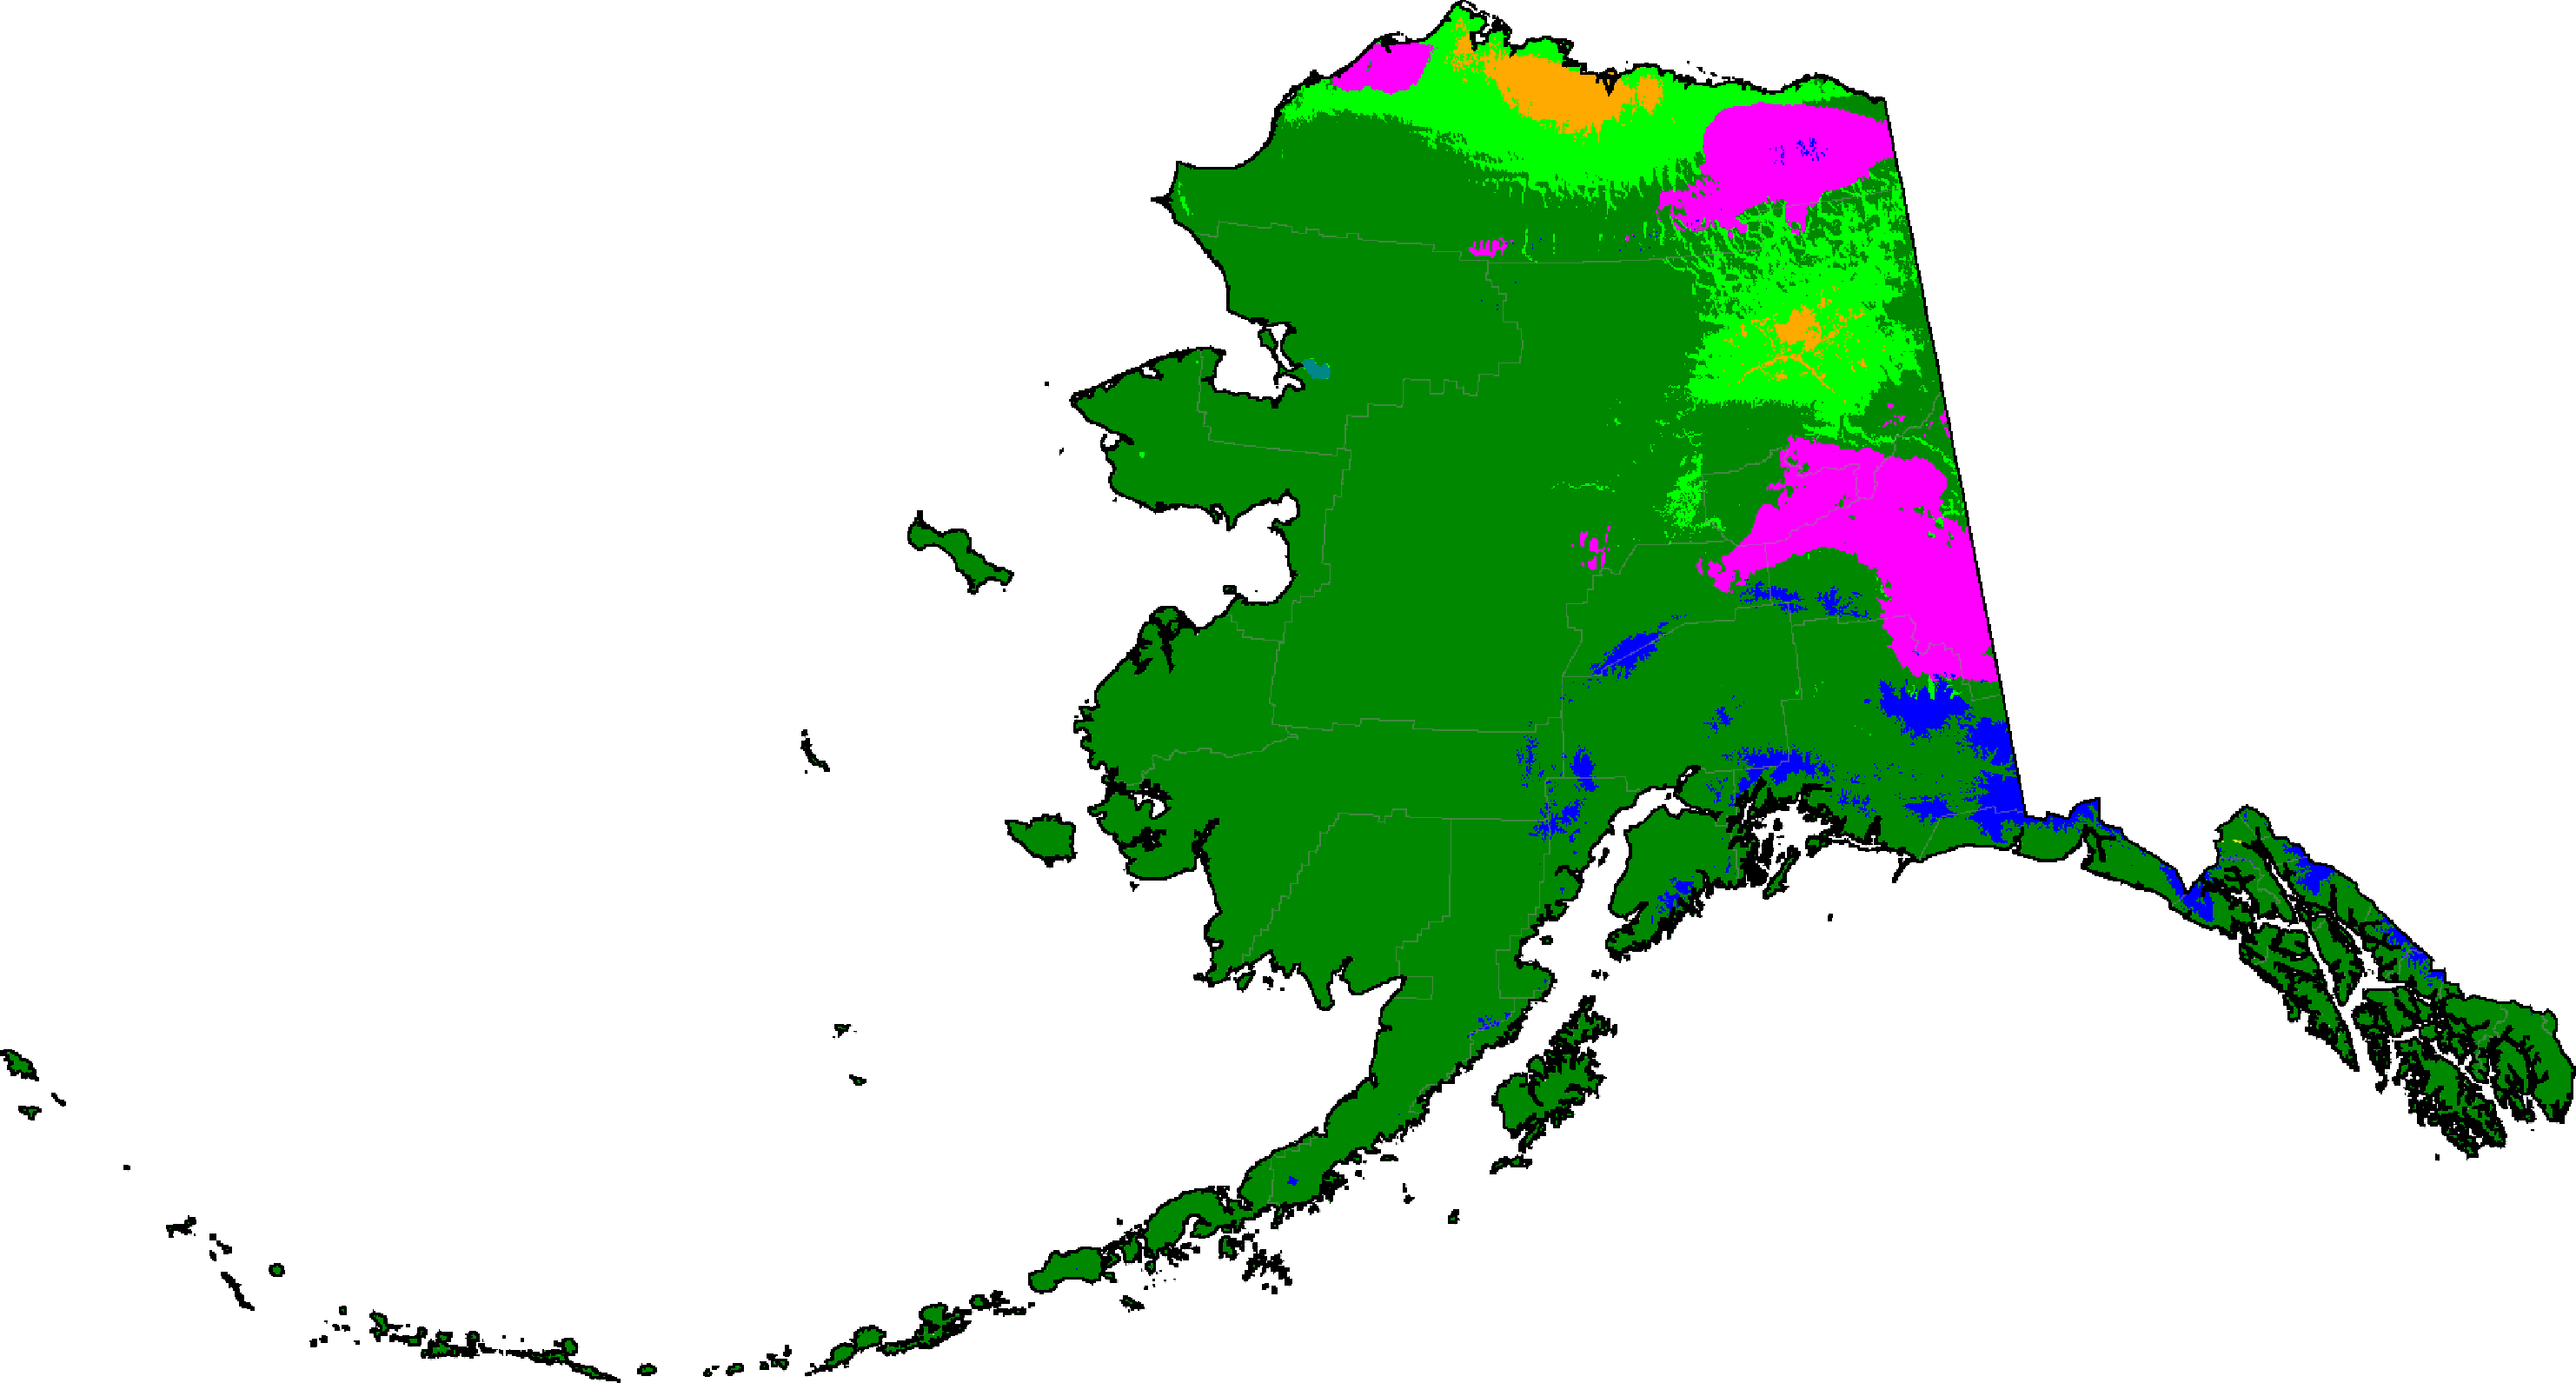
Alaska distribution of summer categories (projections are SSP5-8.5 high emissions normals)
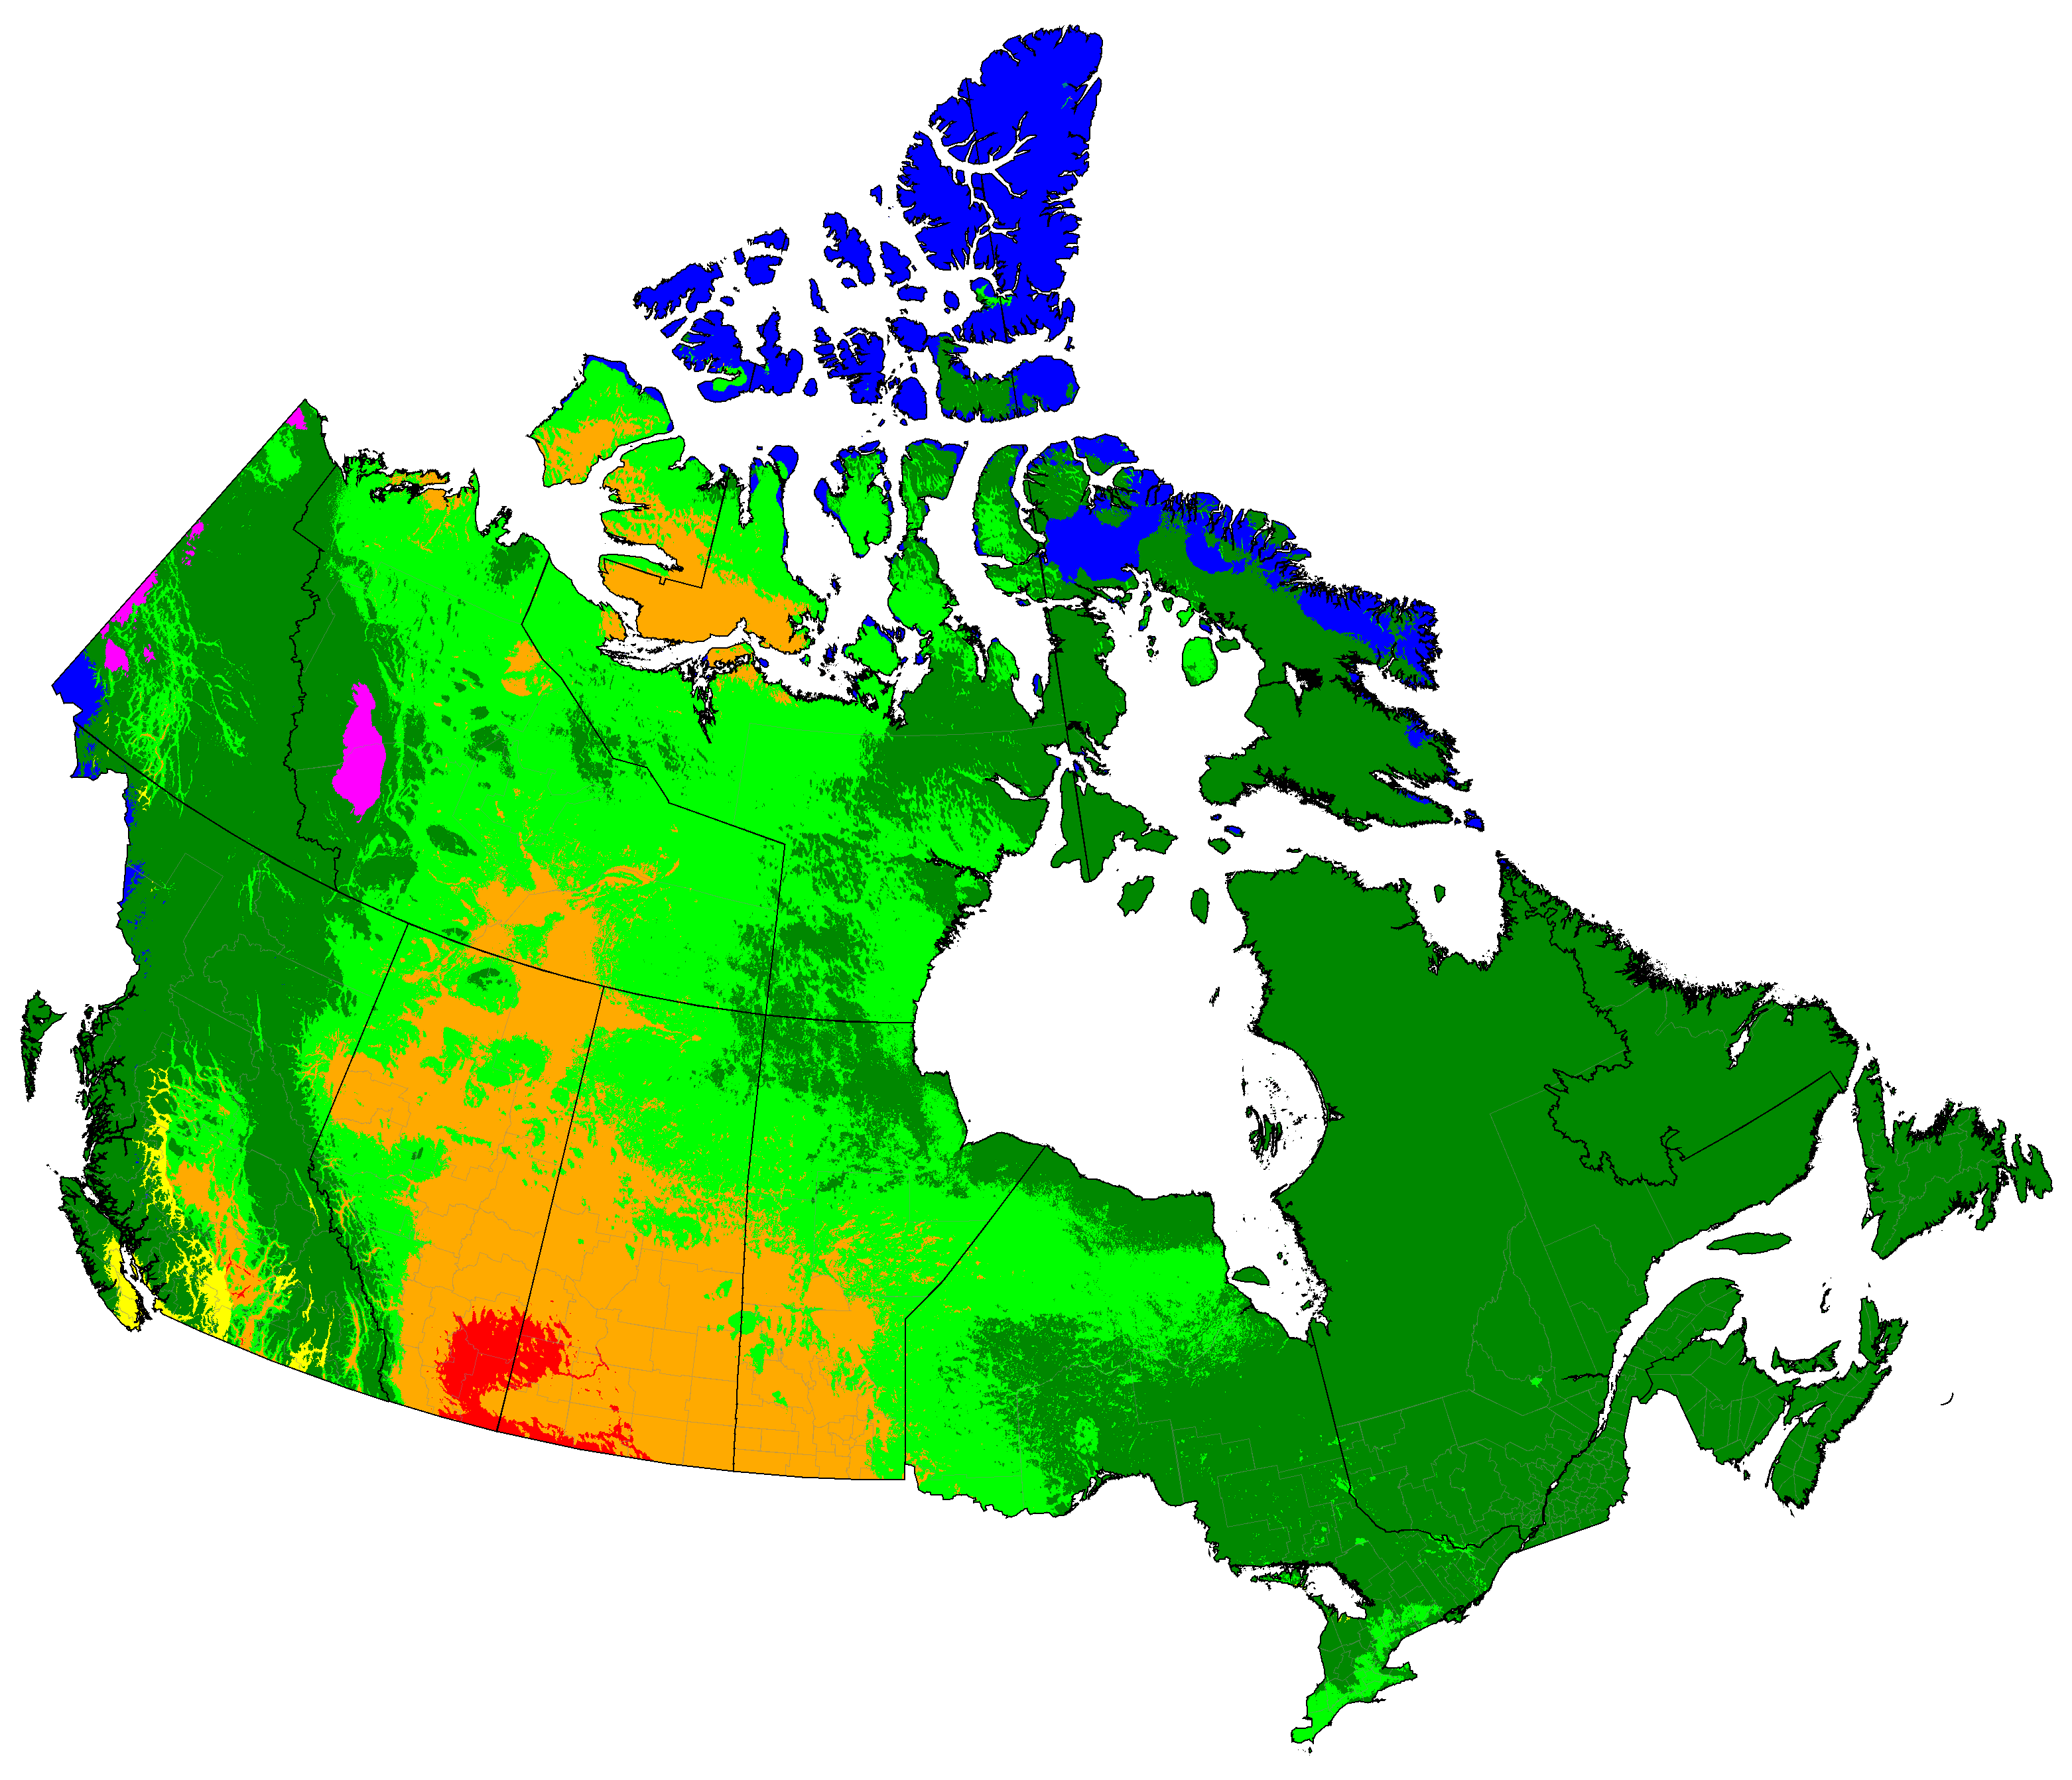
Canada distribution of summer categories (projections are SSP5-8.5 high emissions normals)
Note: The vertical line in the middle of Nunavut is a cartographic artifact, not a political boundary.
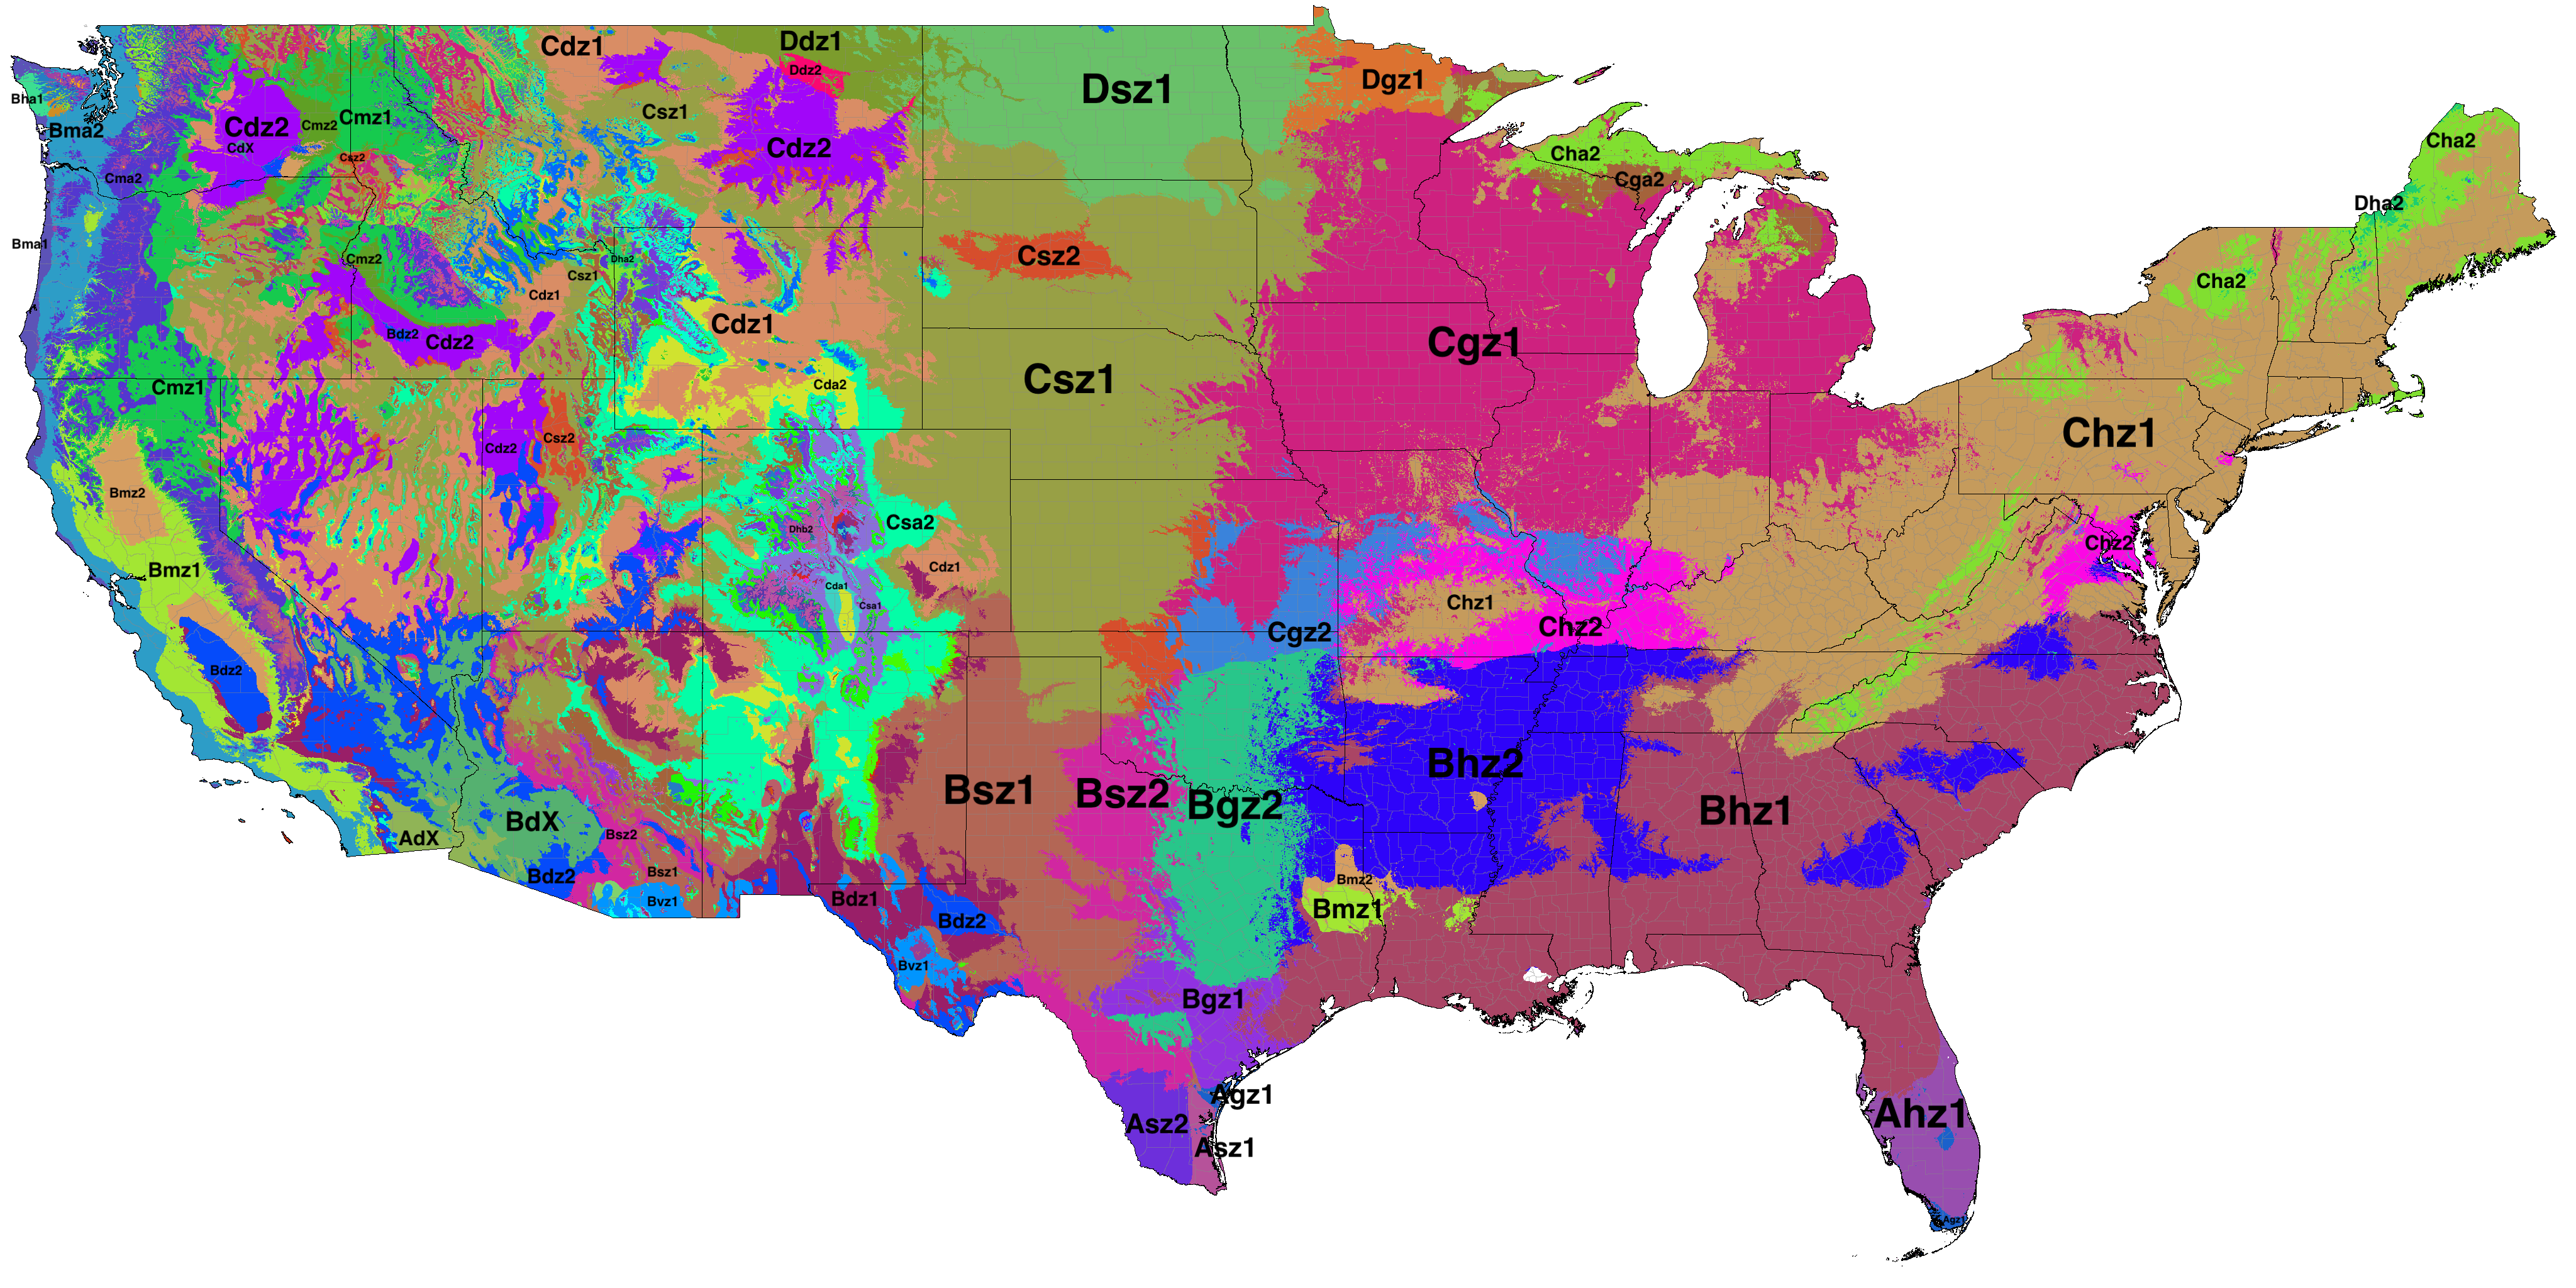
Contiguous United States distribution of summer categories (projections are SSP5-8.5 high emissions normals)
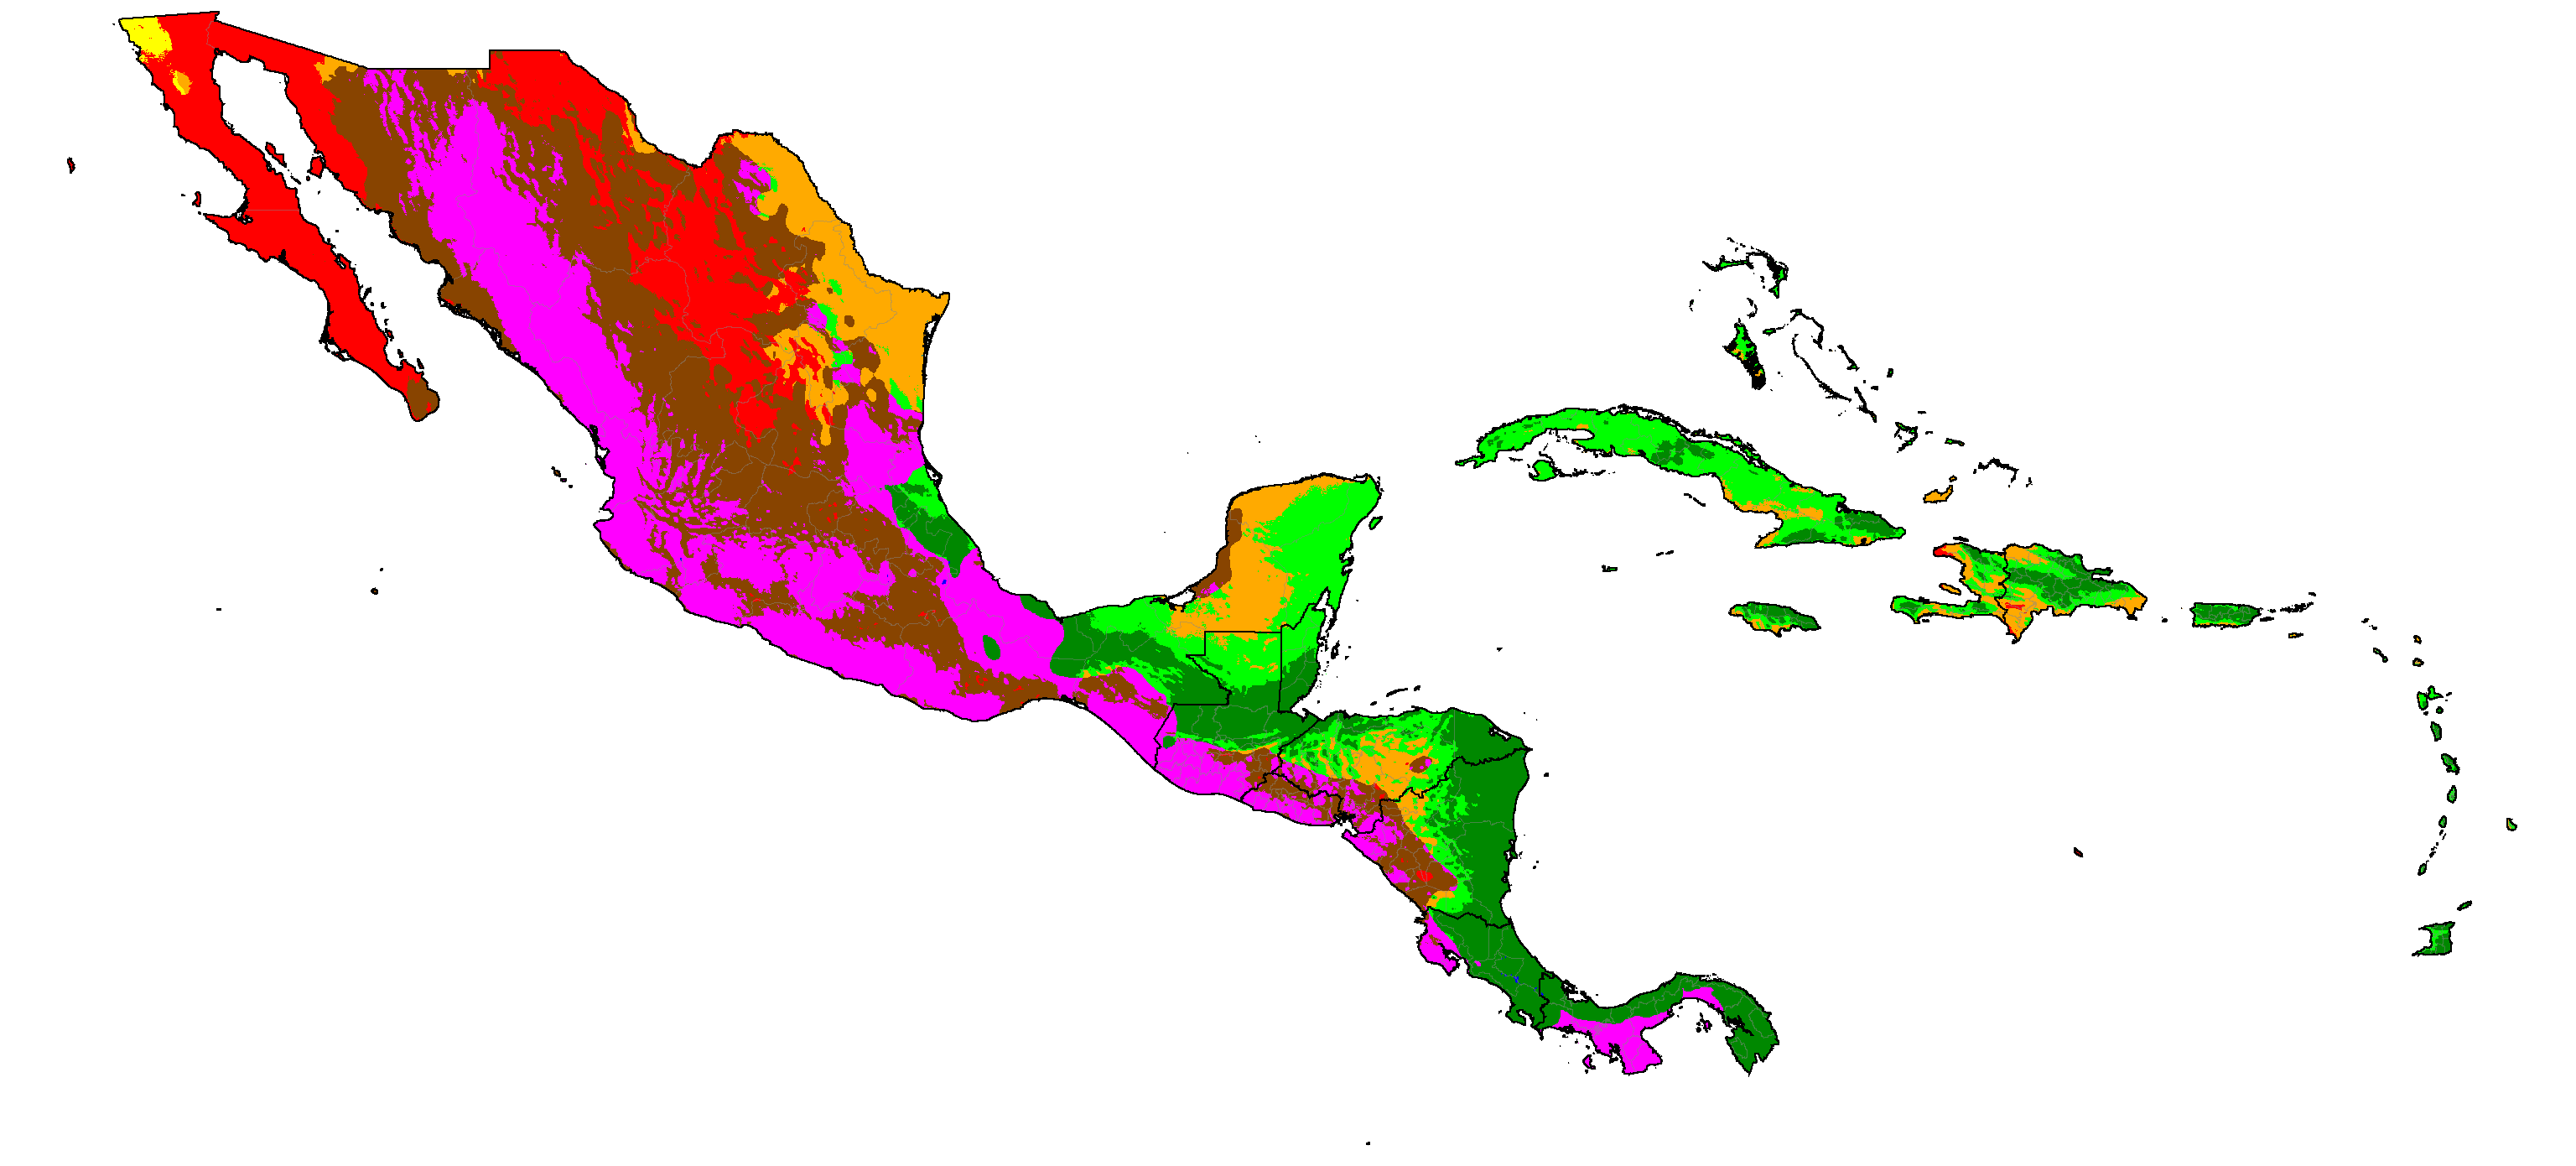
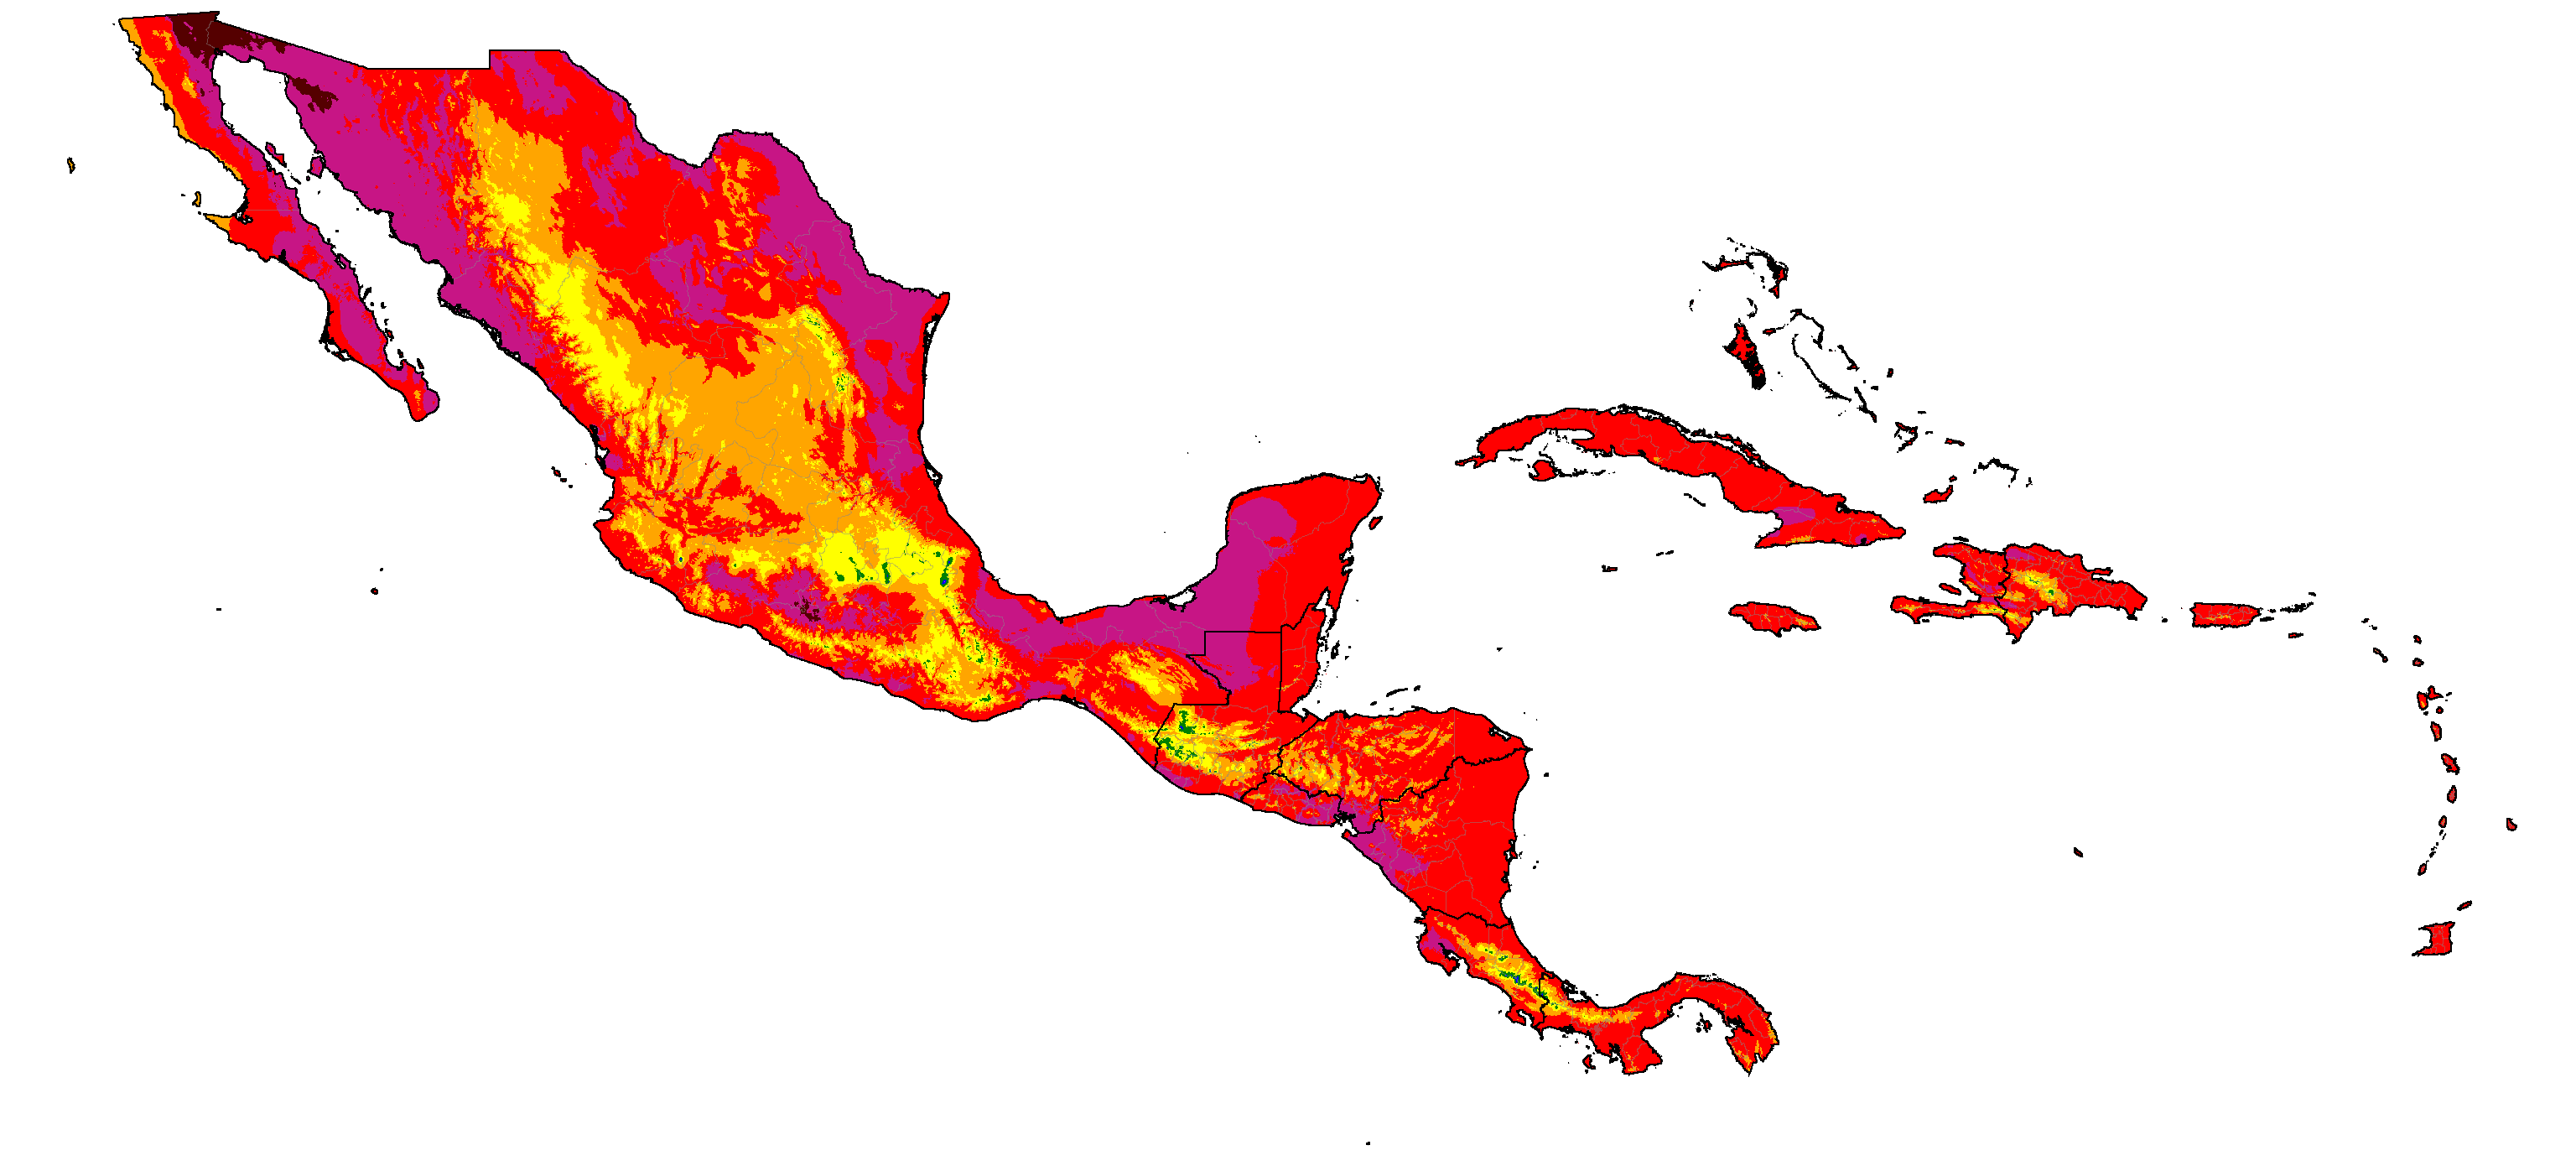
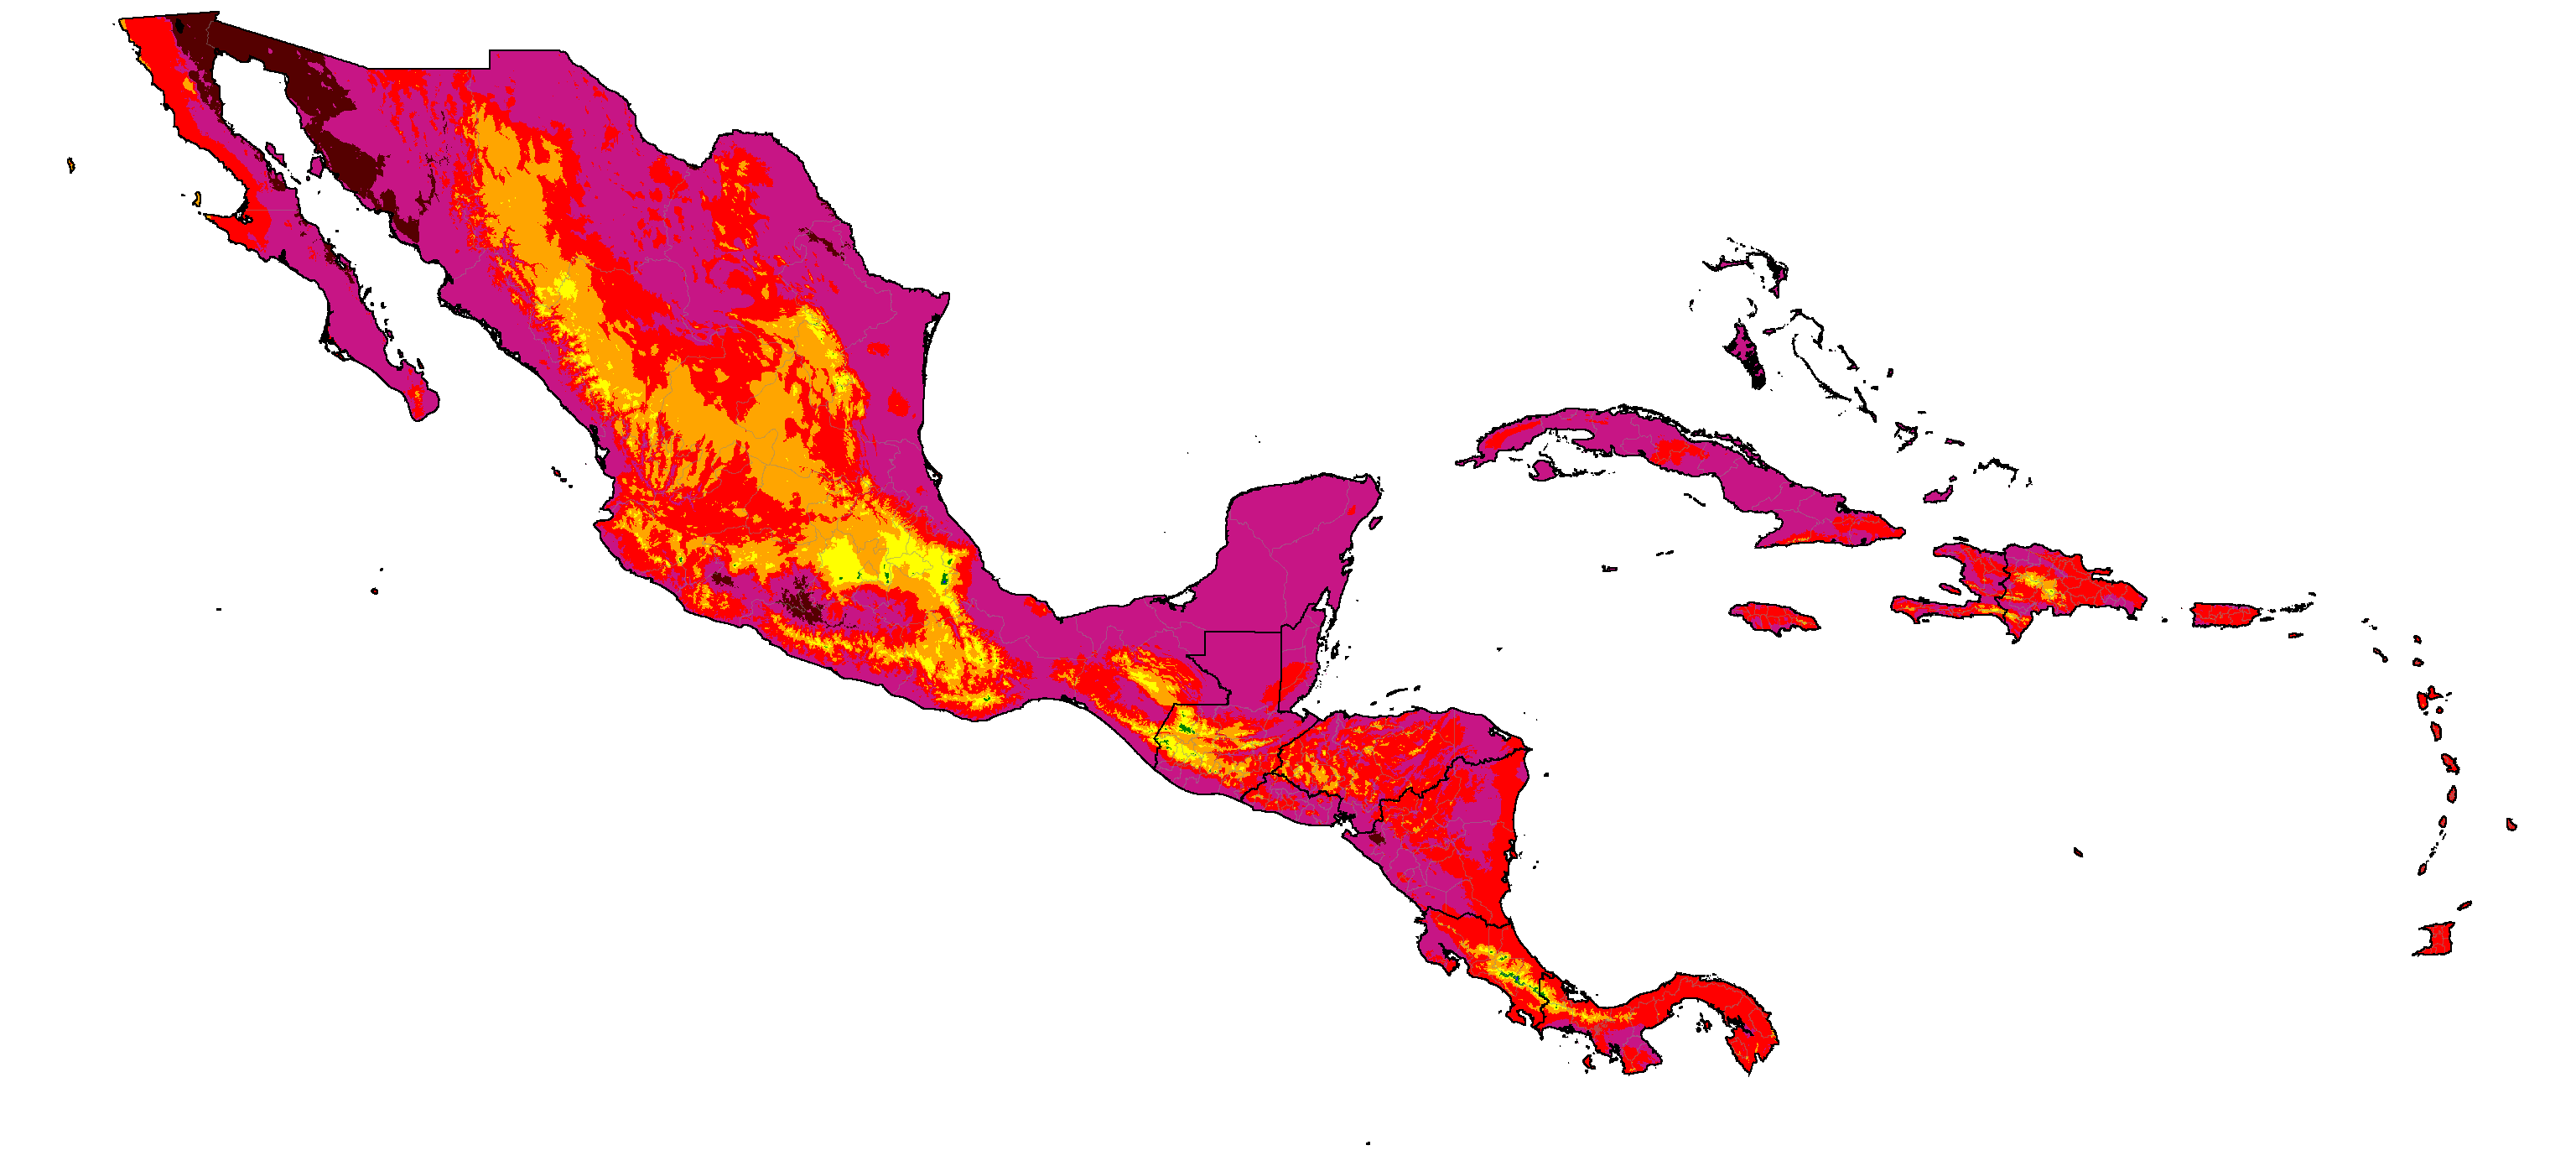
Mexico, Central America & the Carribean distribution of summer categories (projections are SSP5-8.5 high emissions normals)

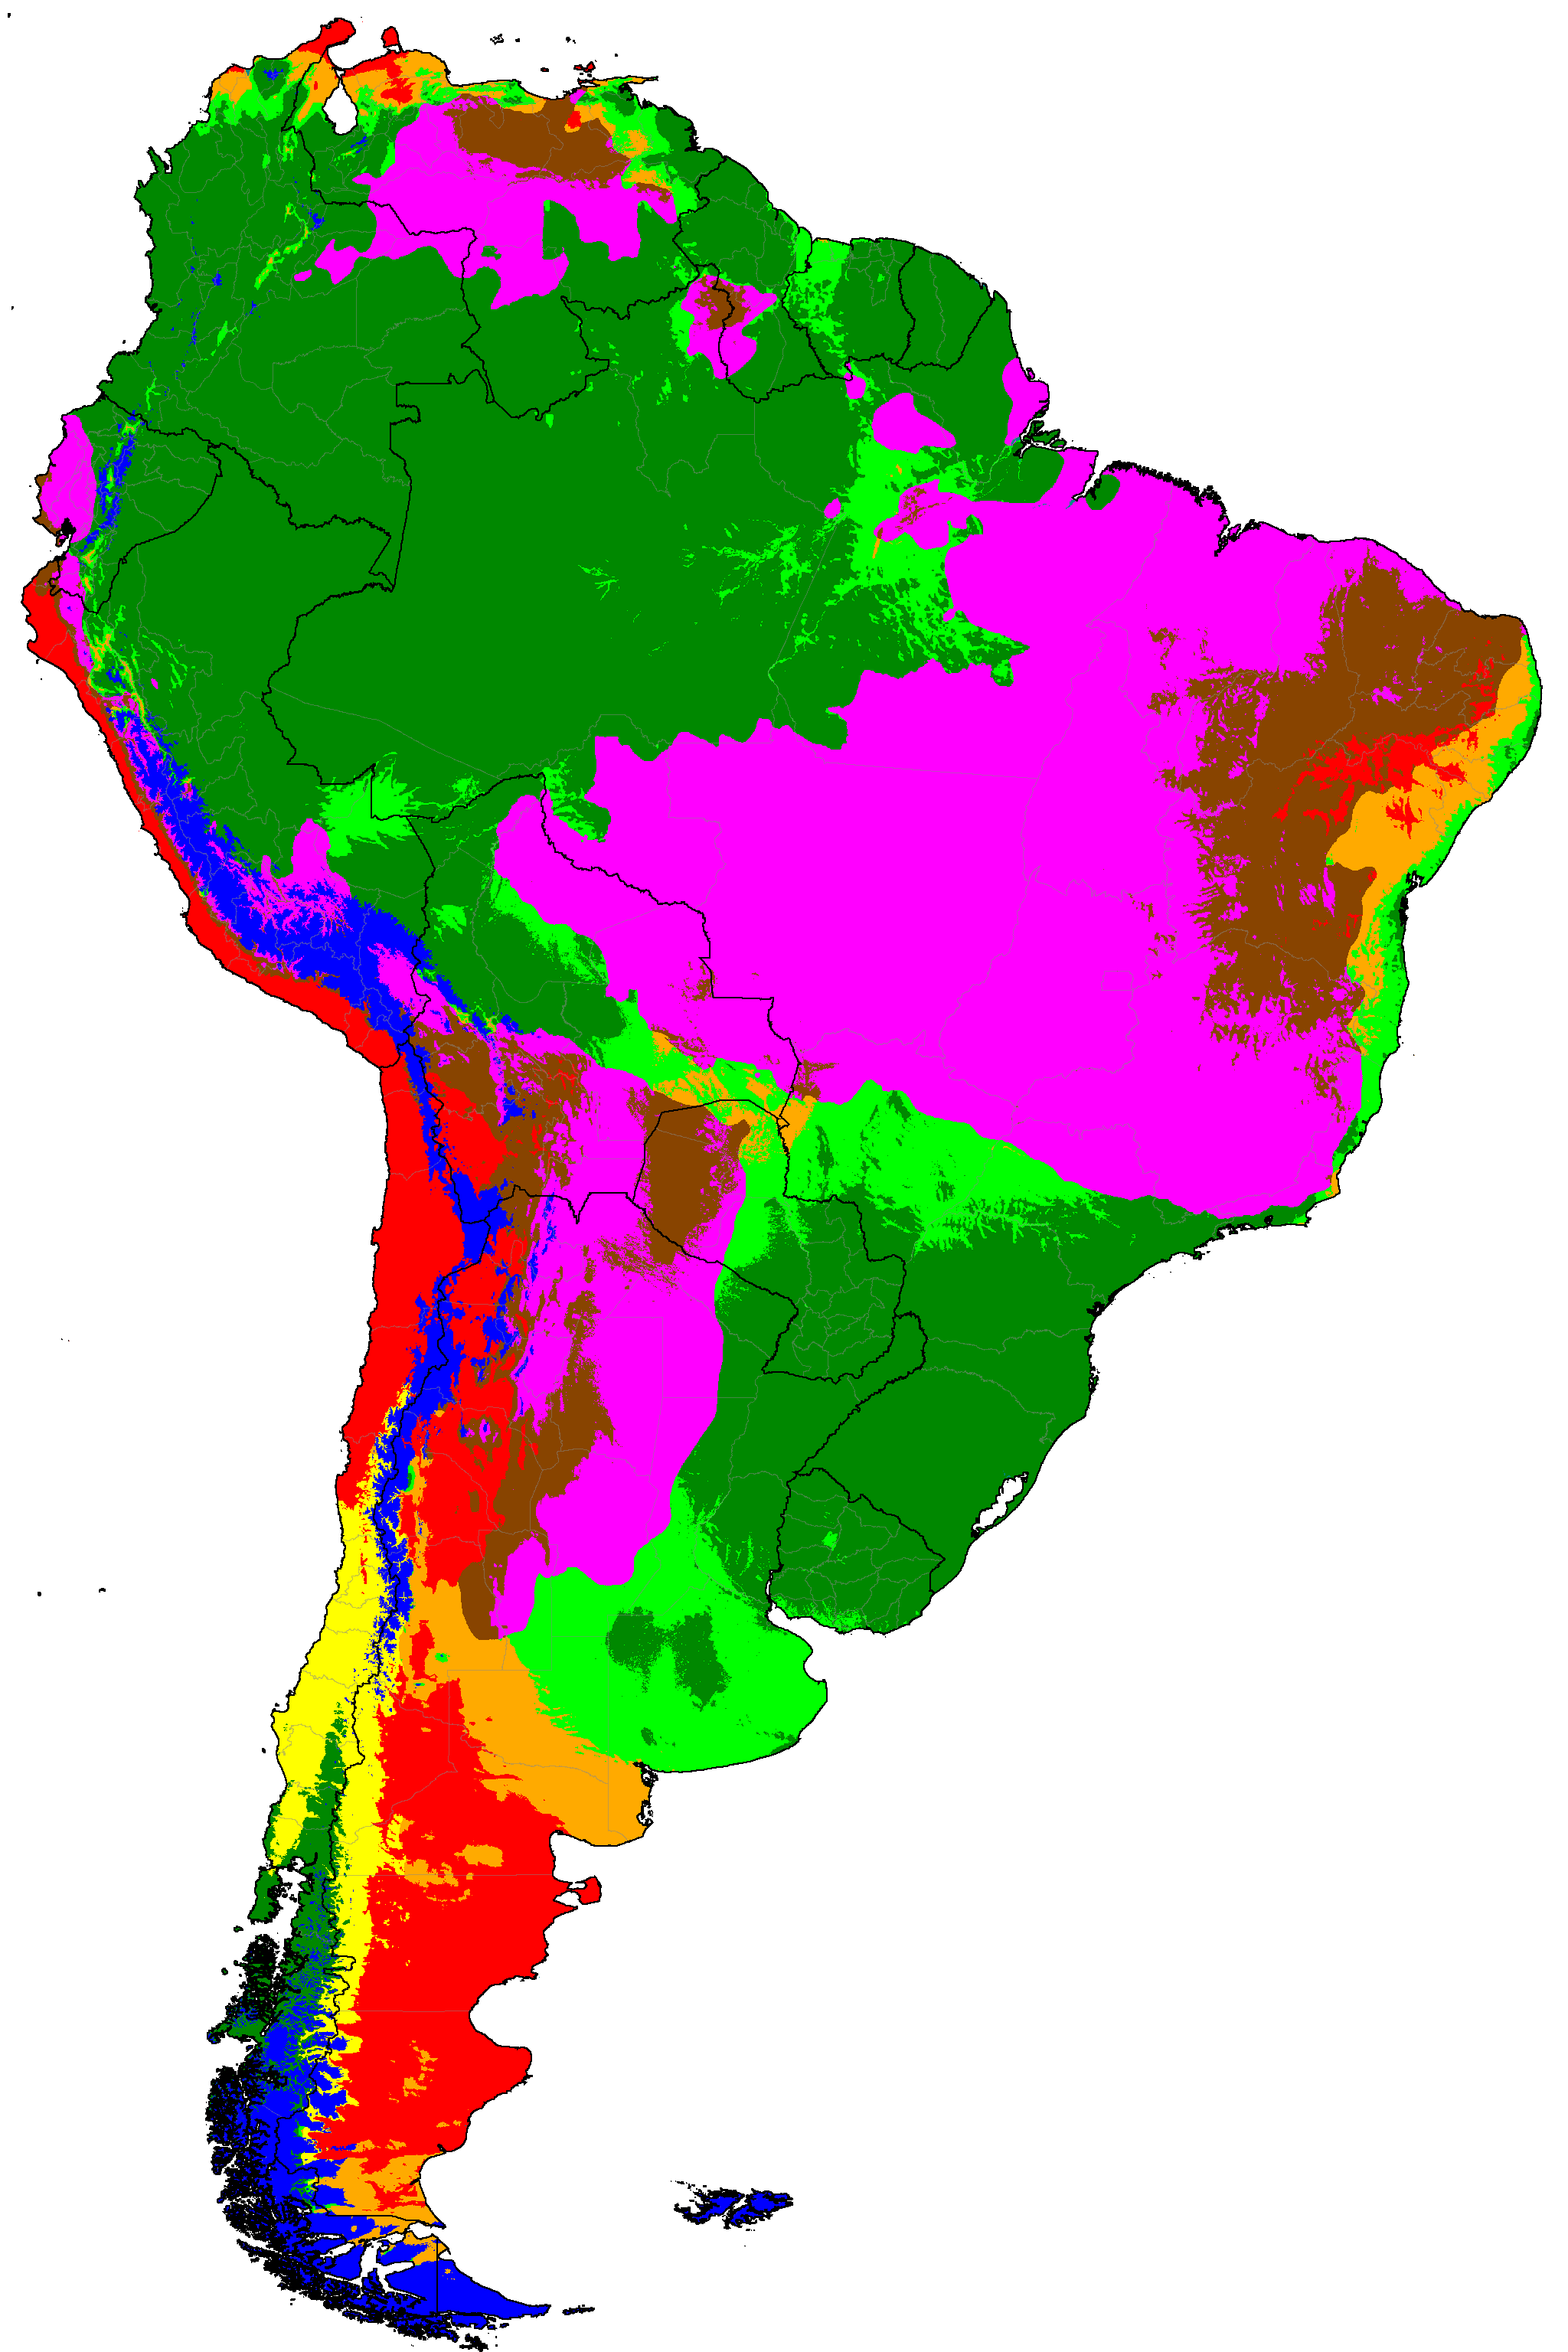
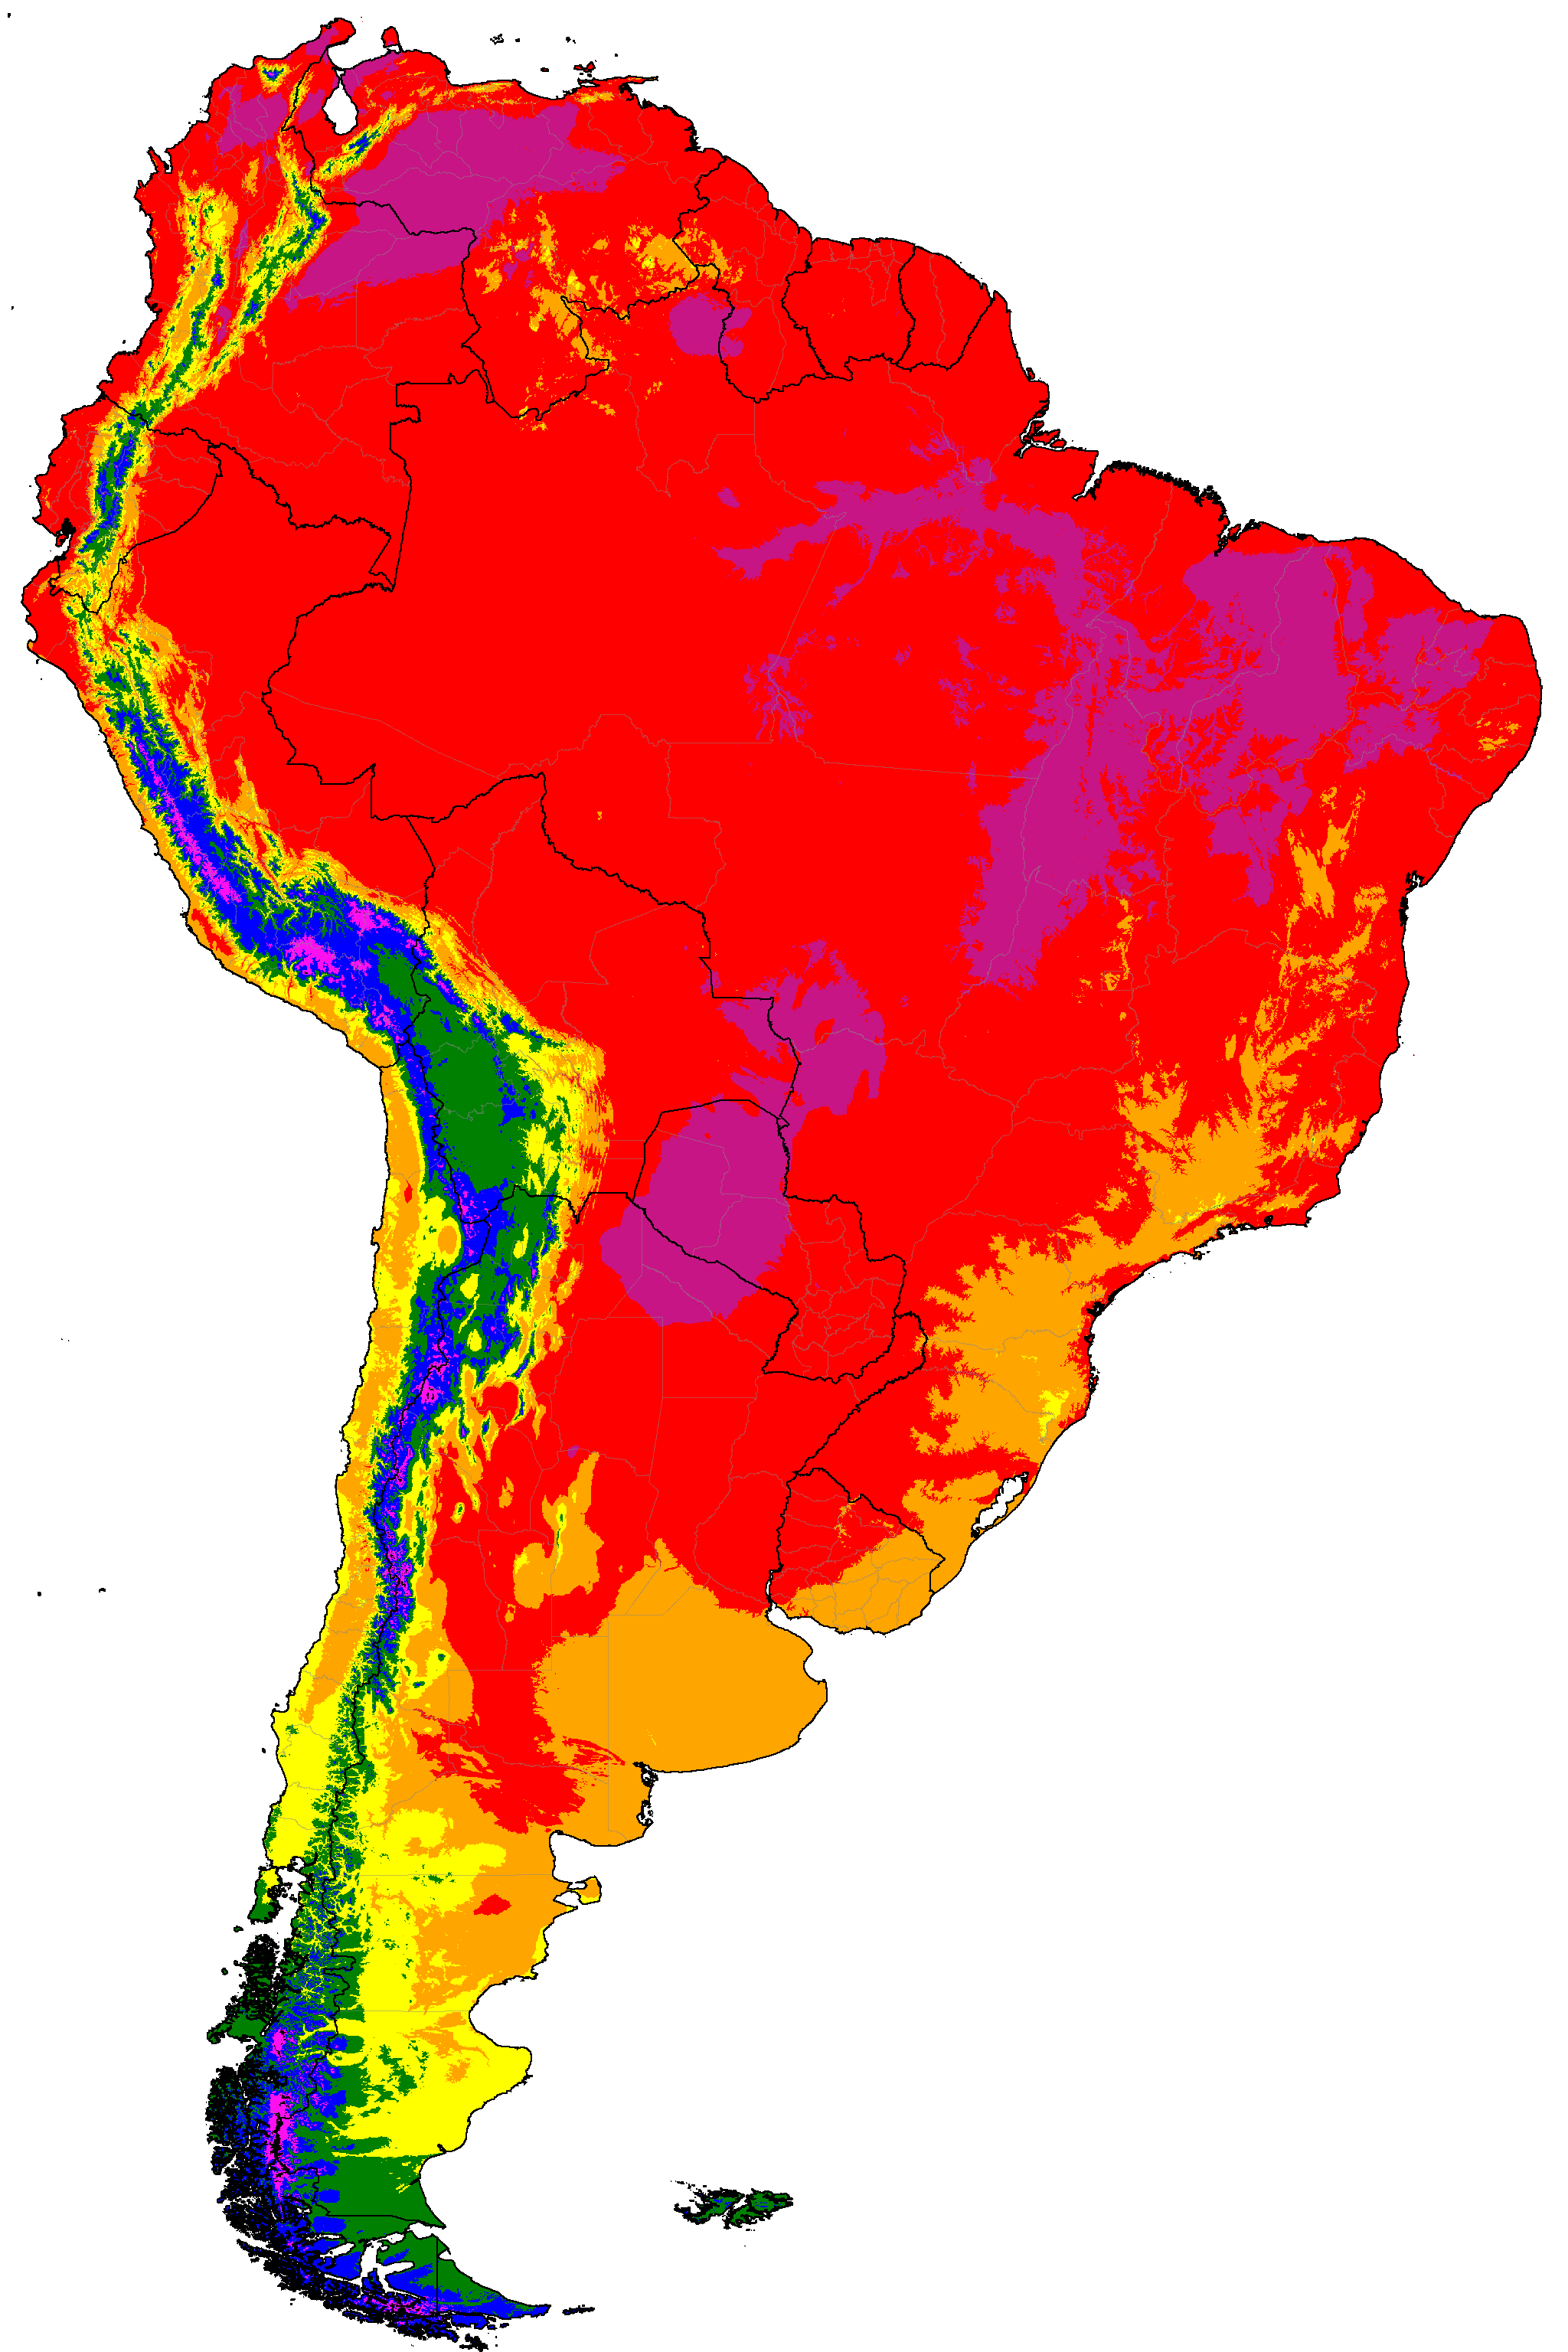
South America distribution of summer categories (projections are SSP5-8.5 high emissions normals)
Africa distribution of summer categories (projections are SSP5-8.5 high emissions normals)
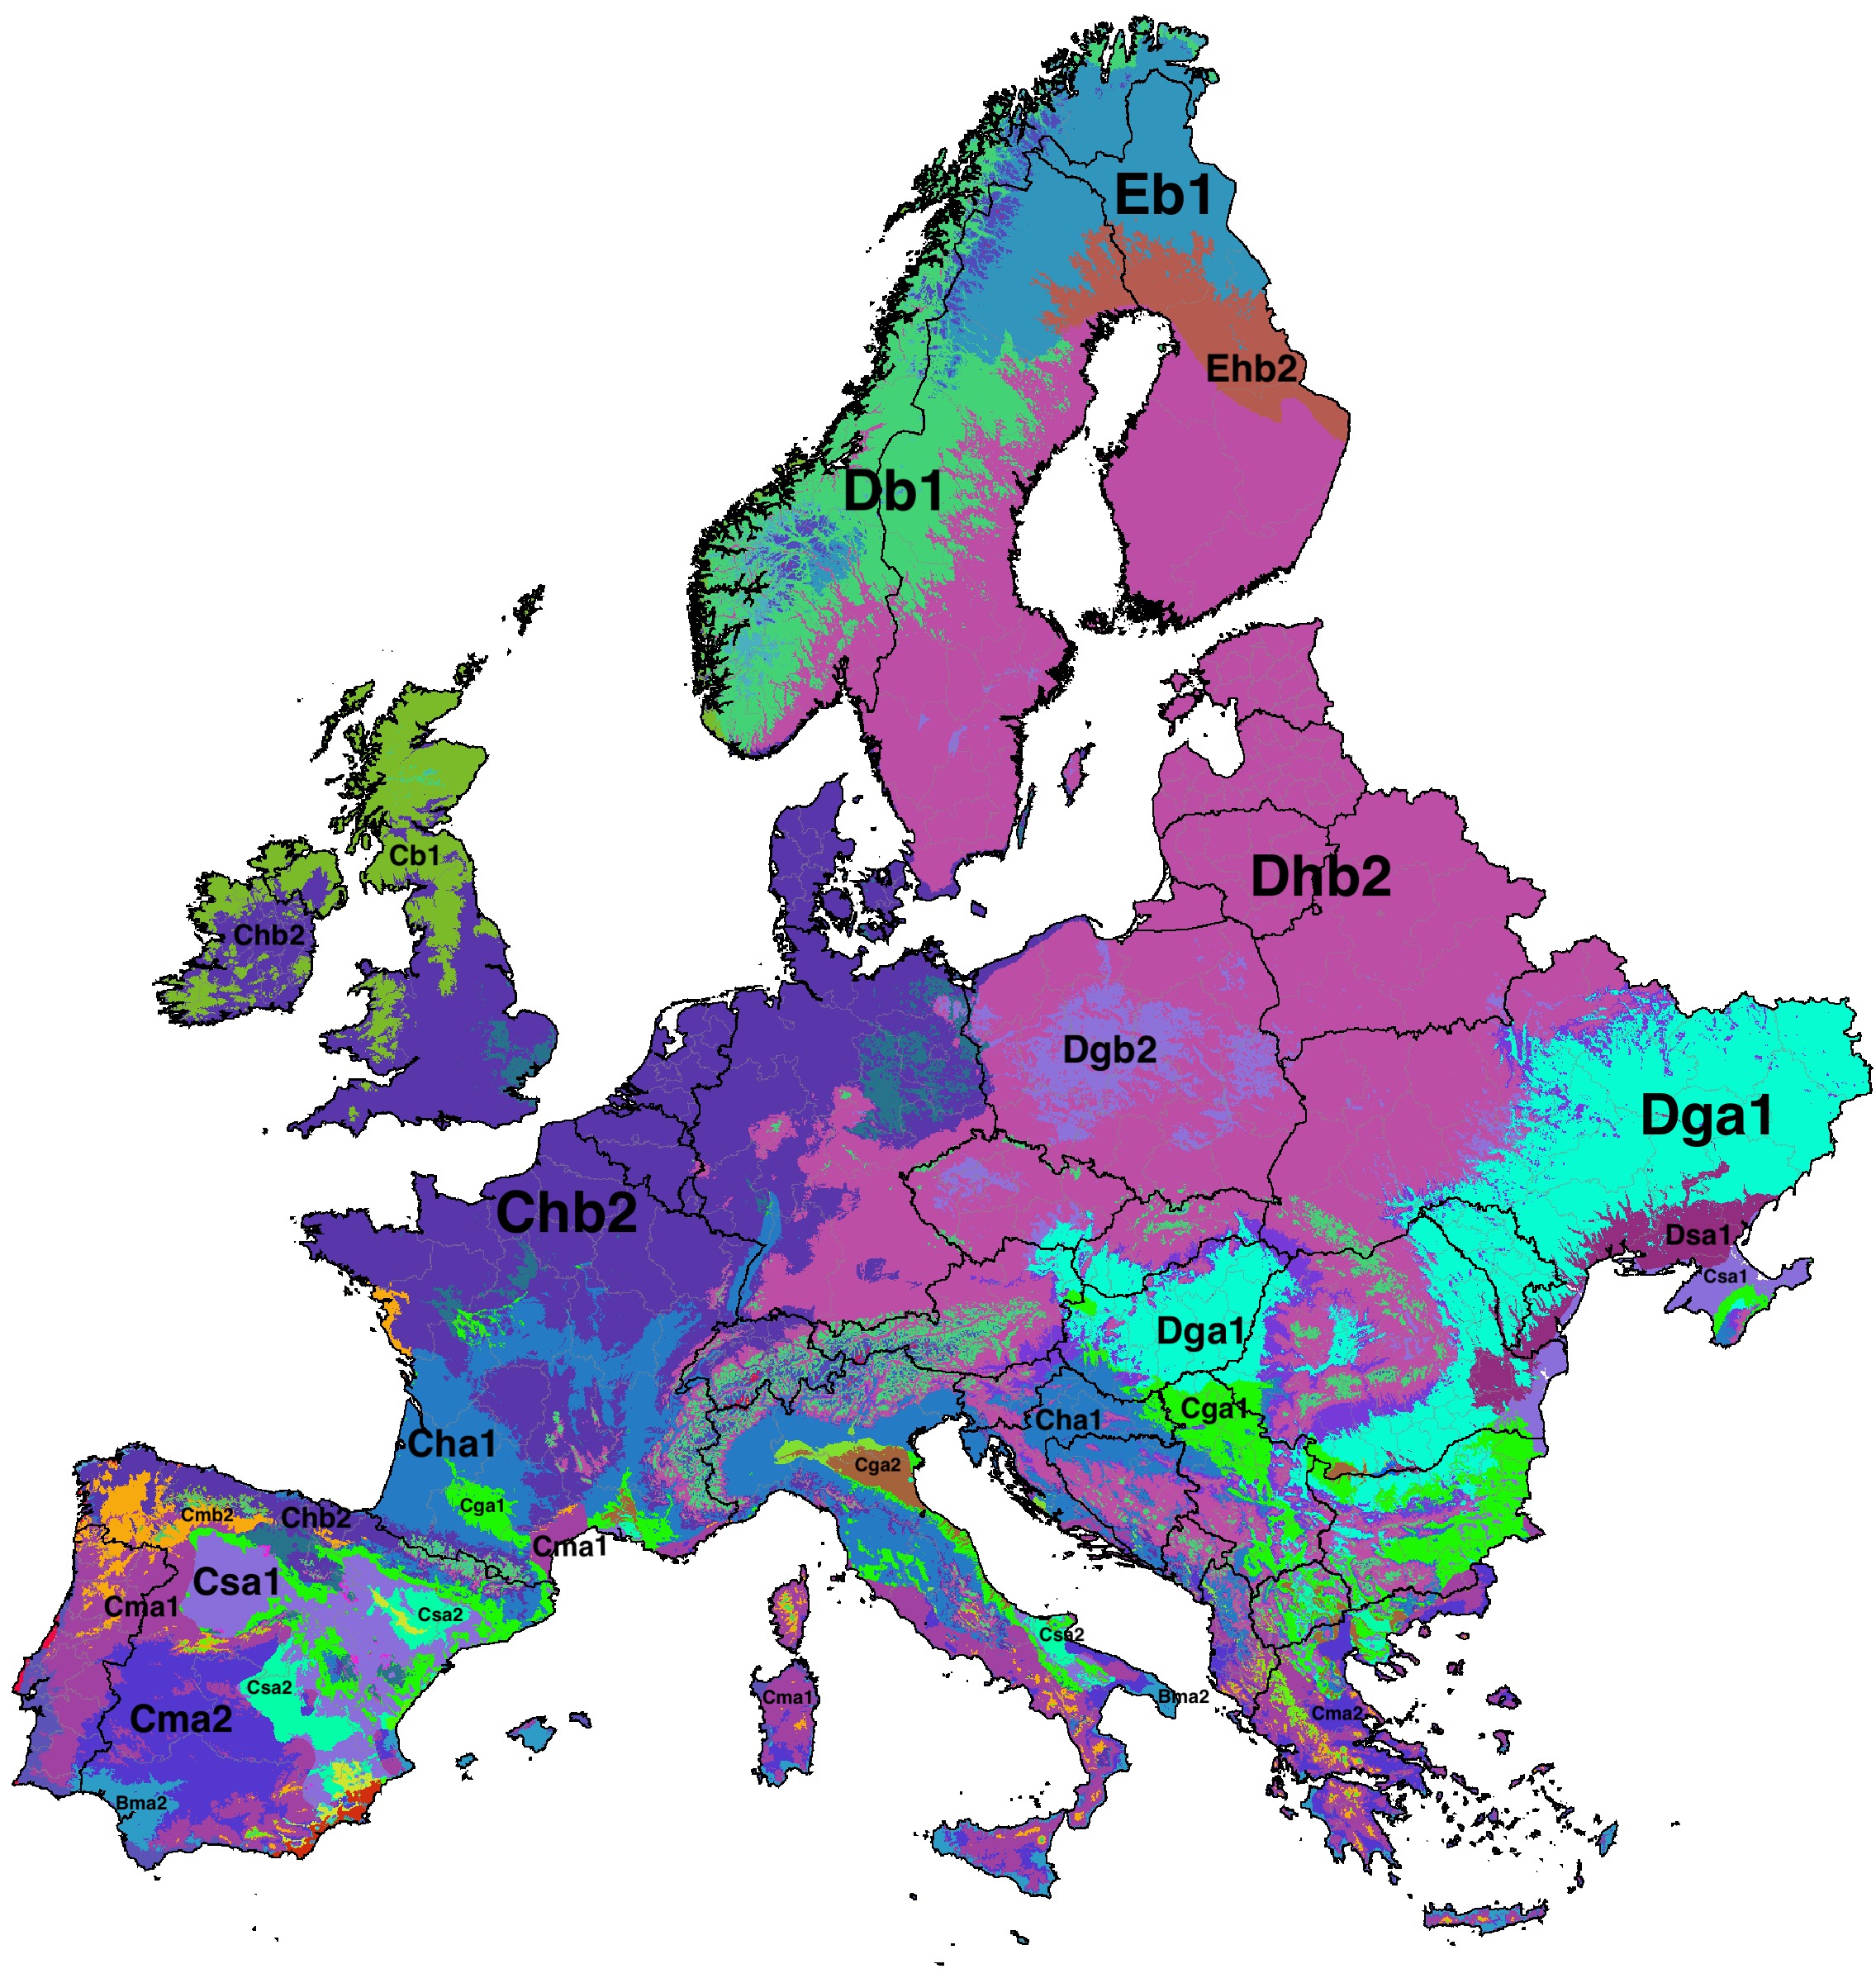
Greenland and Iceland distribution of summer categories (projections are SSP5-8.5 high emissions normals)
Europe distribution of summer categories (projections are SSP5-8.5 high emissions normals)
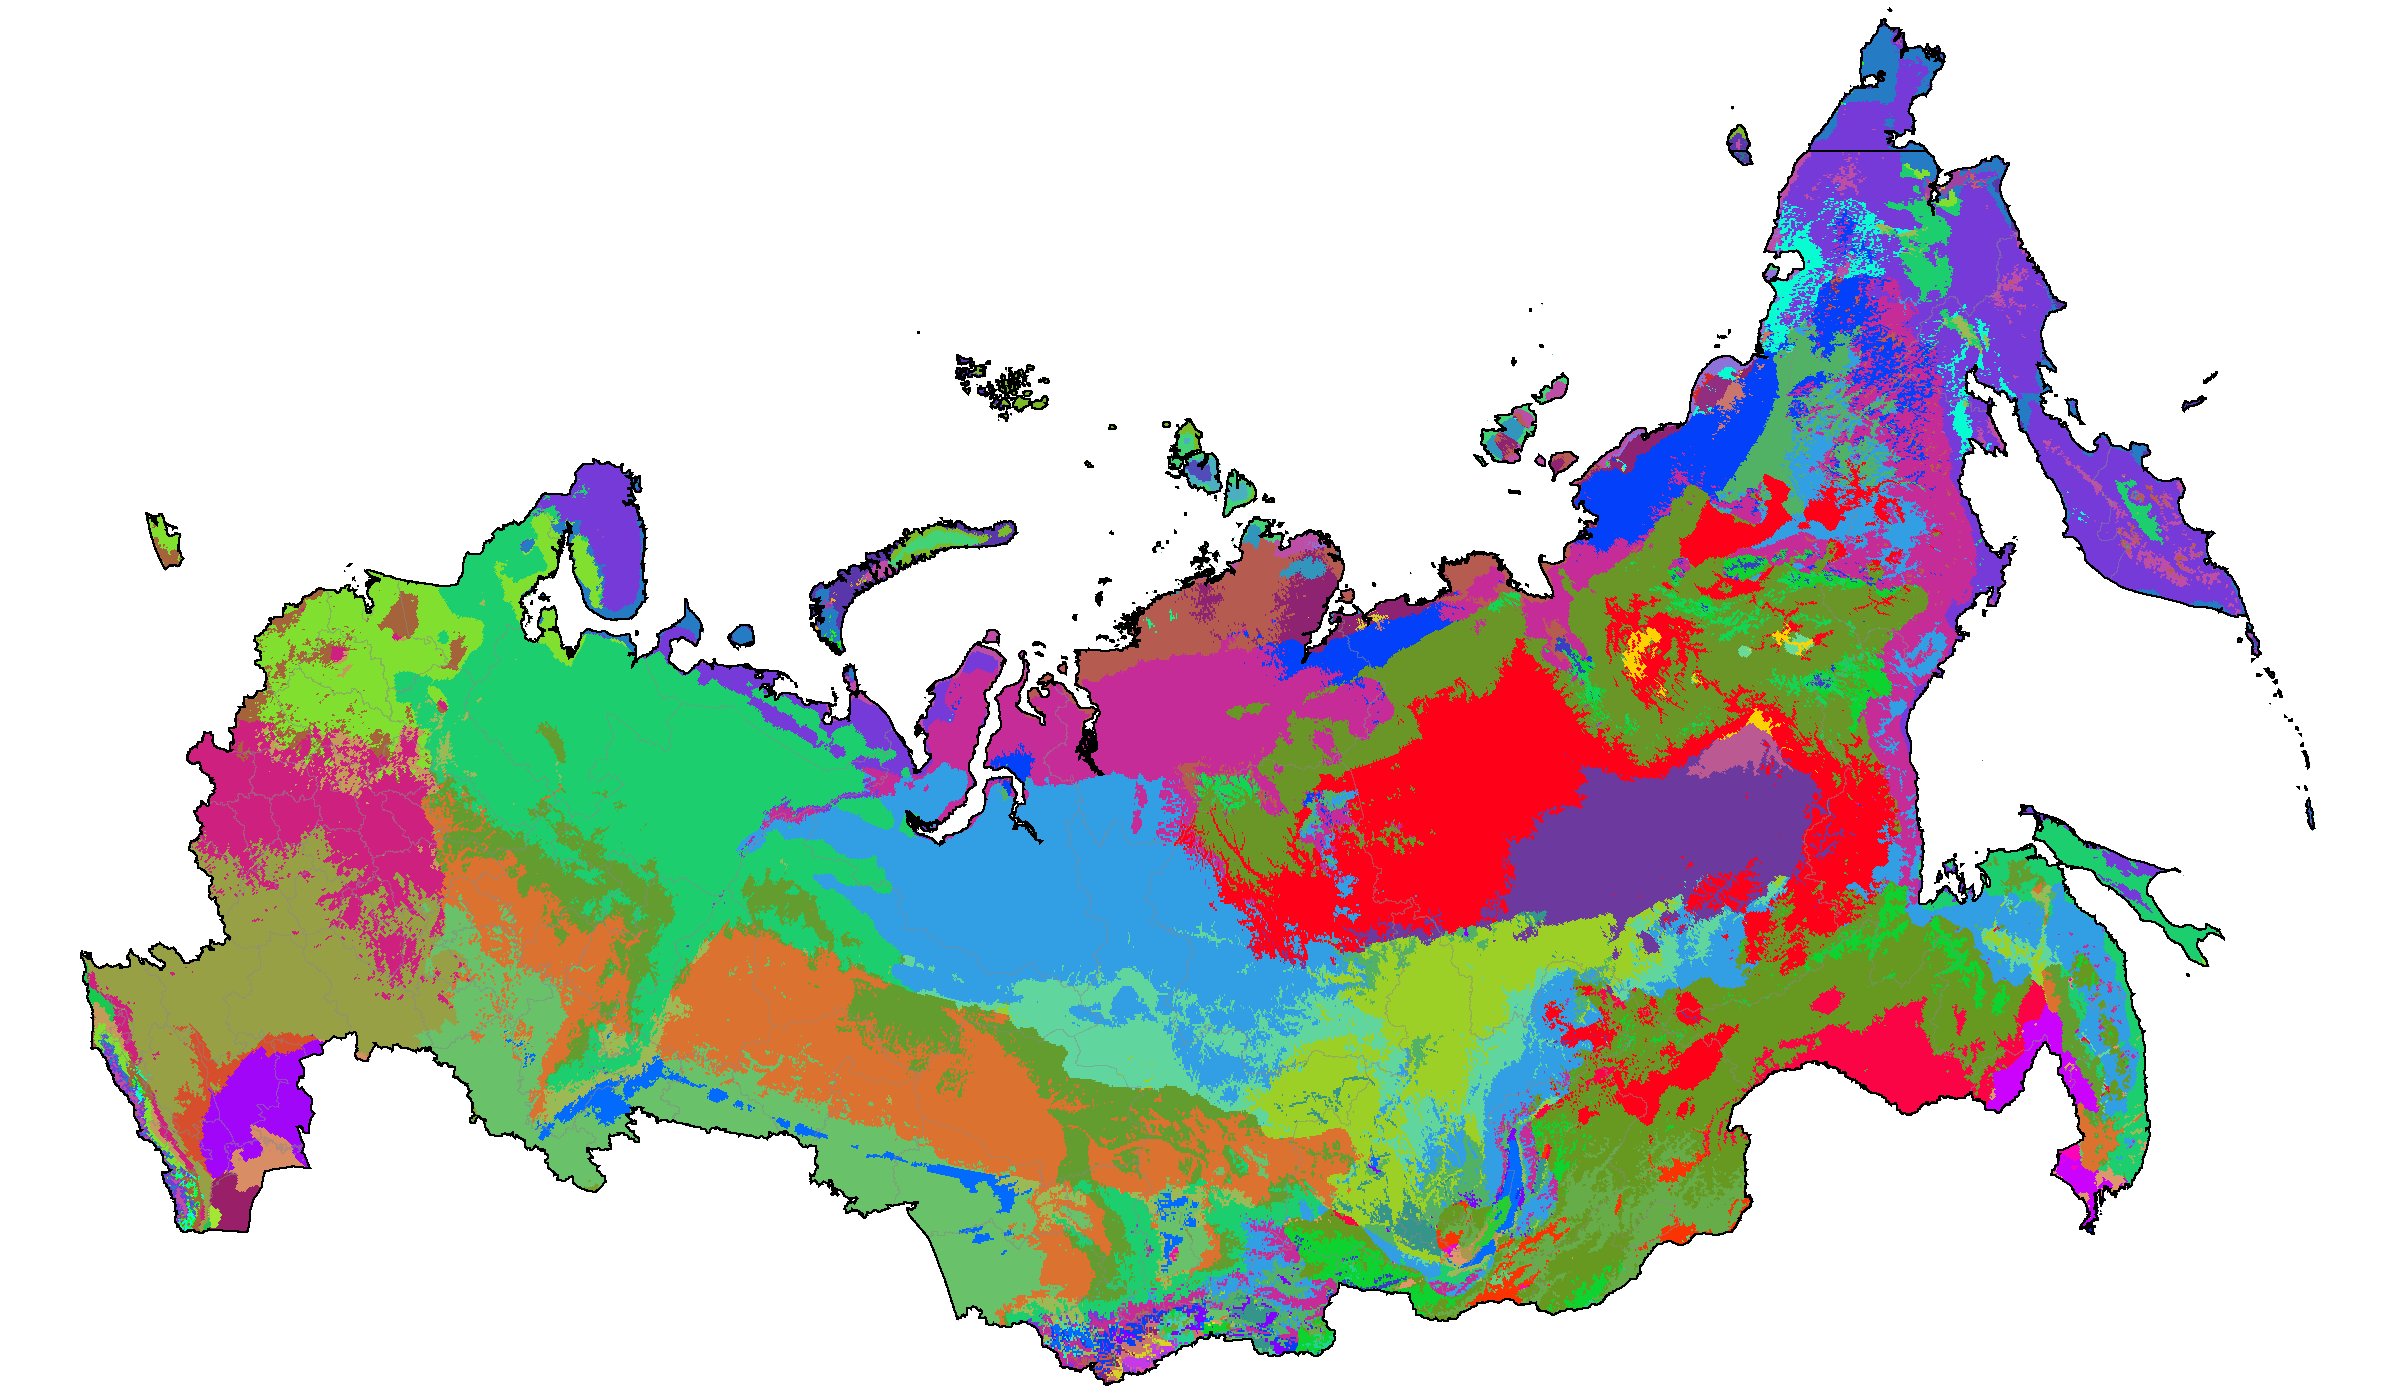
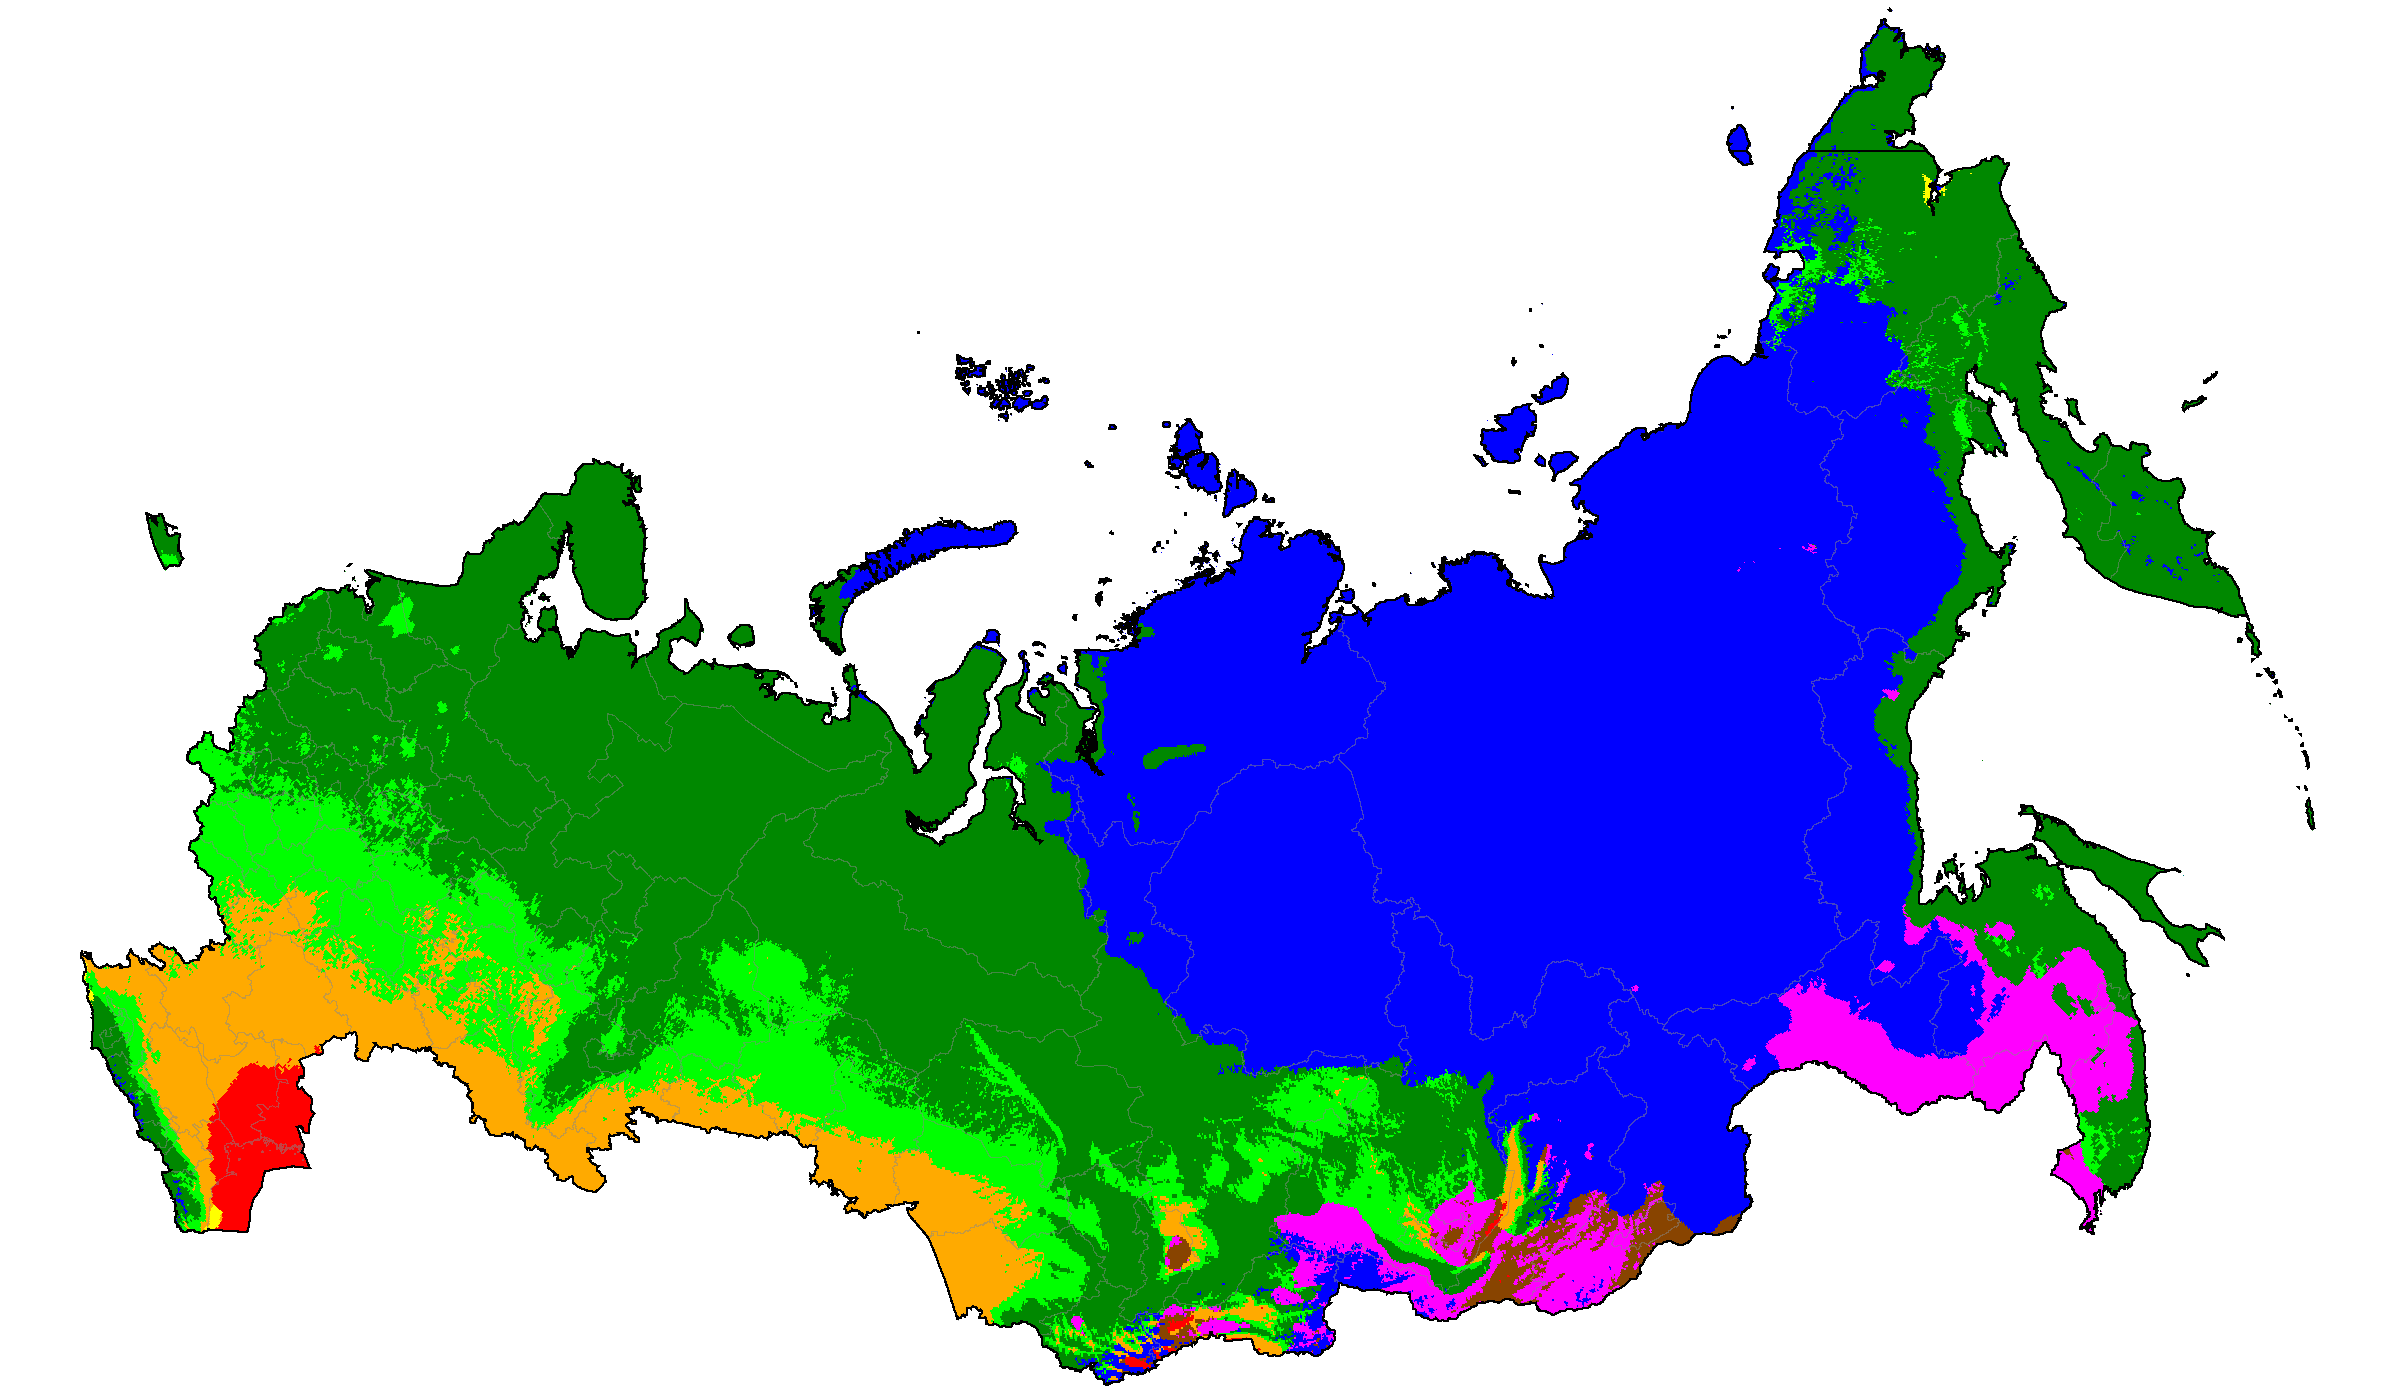
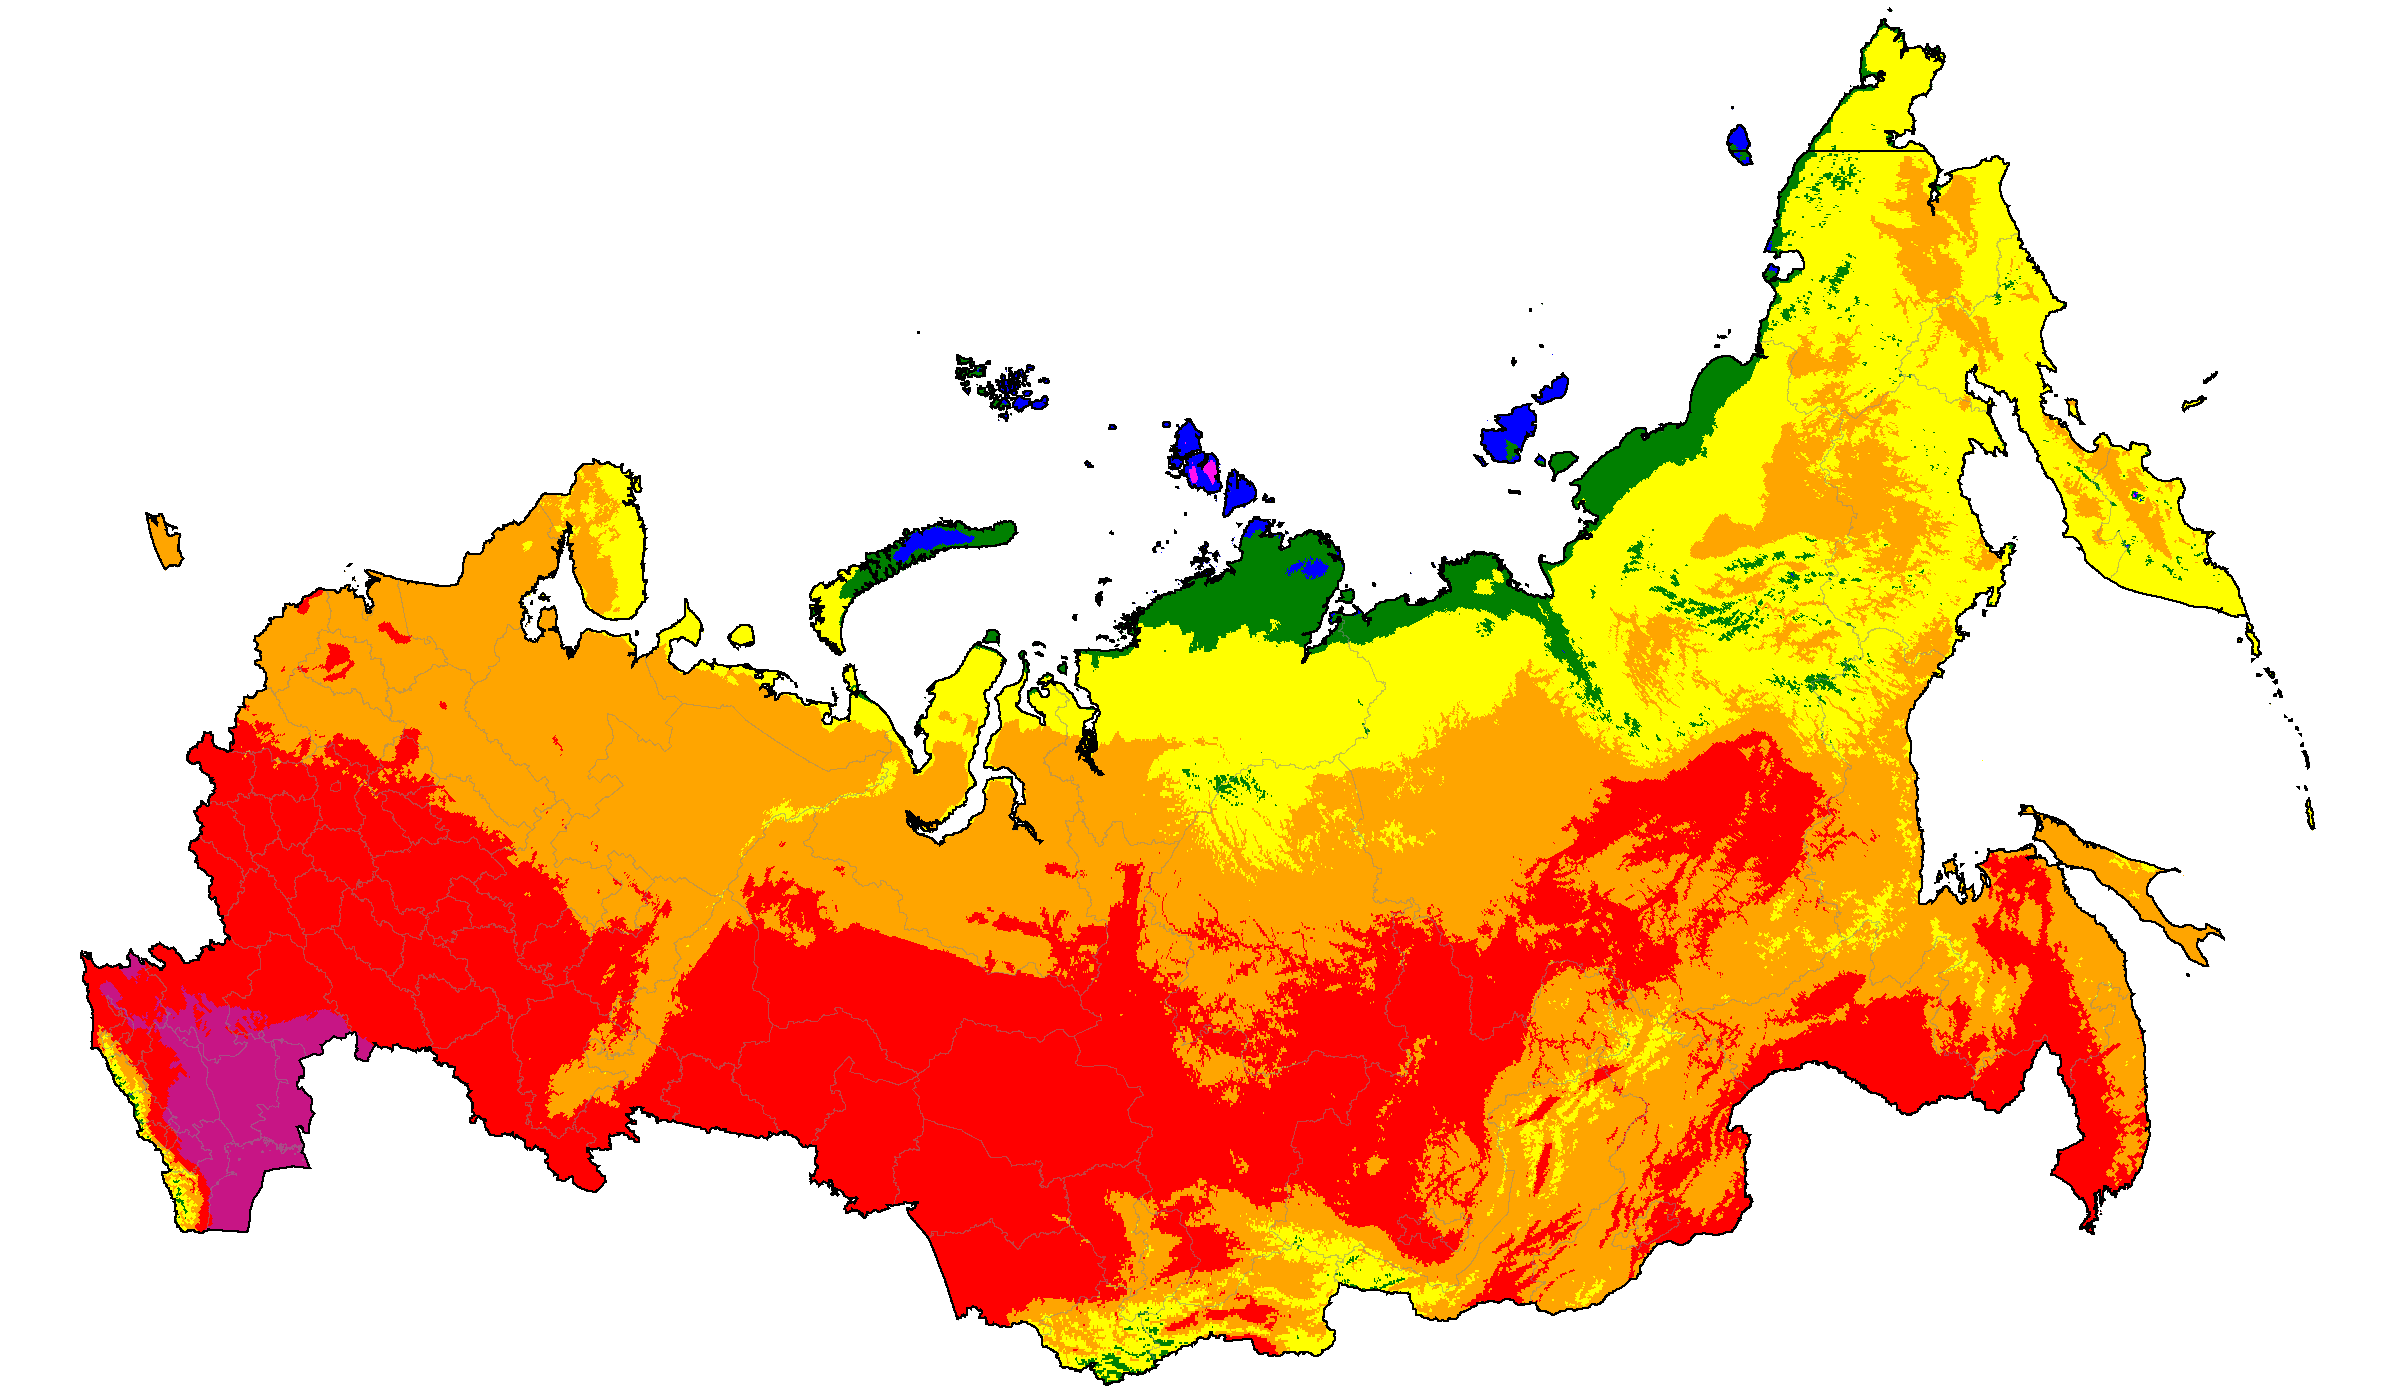
Russia distribution of summer categories (projections are SSP5-8.5 high emissions normals)
Note: The line visible in eastern Russia is a cartographic artifact of the International Date Line (180° meridian), not a political boundary.
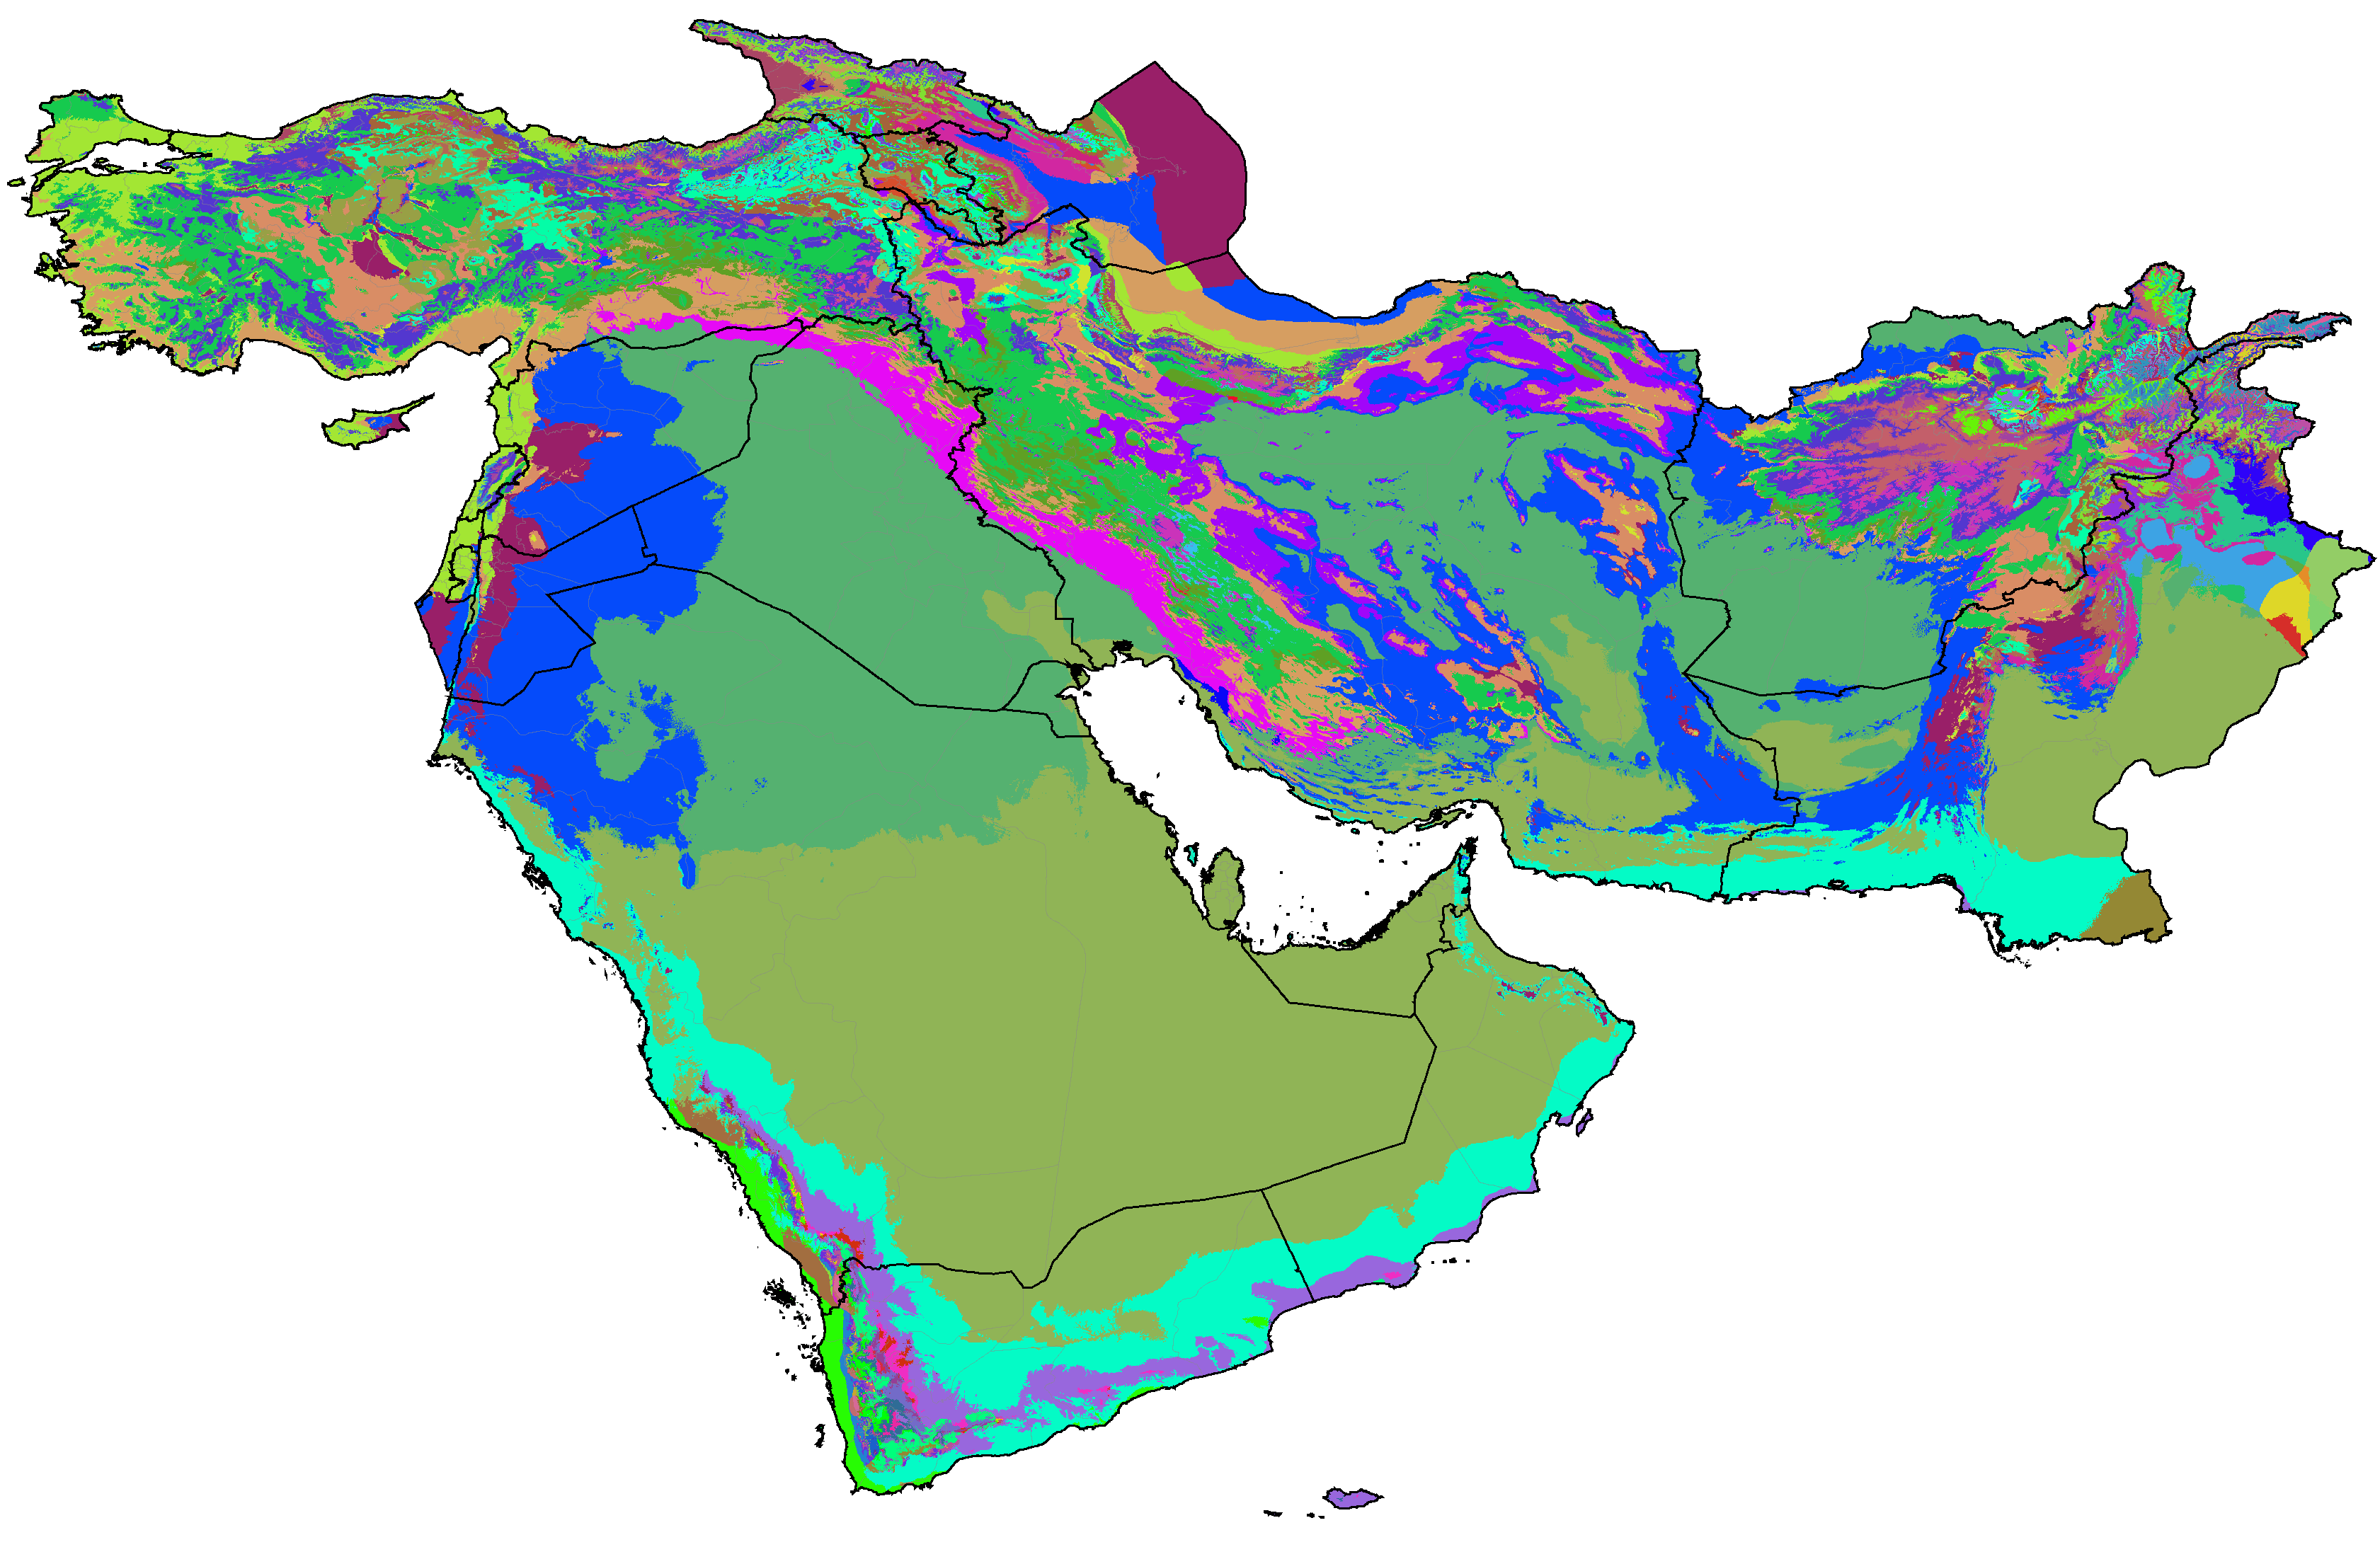
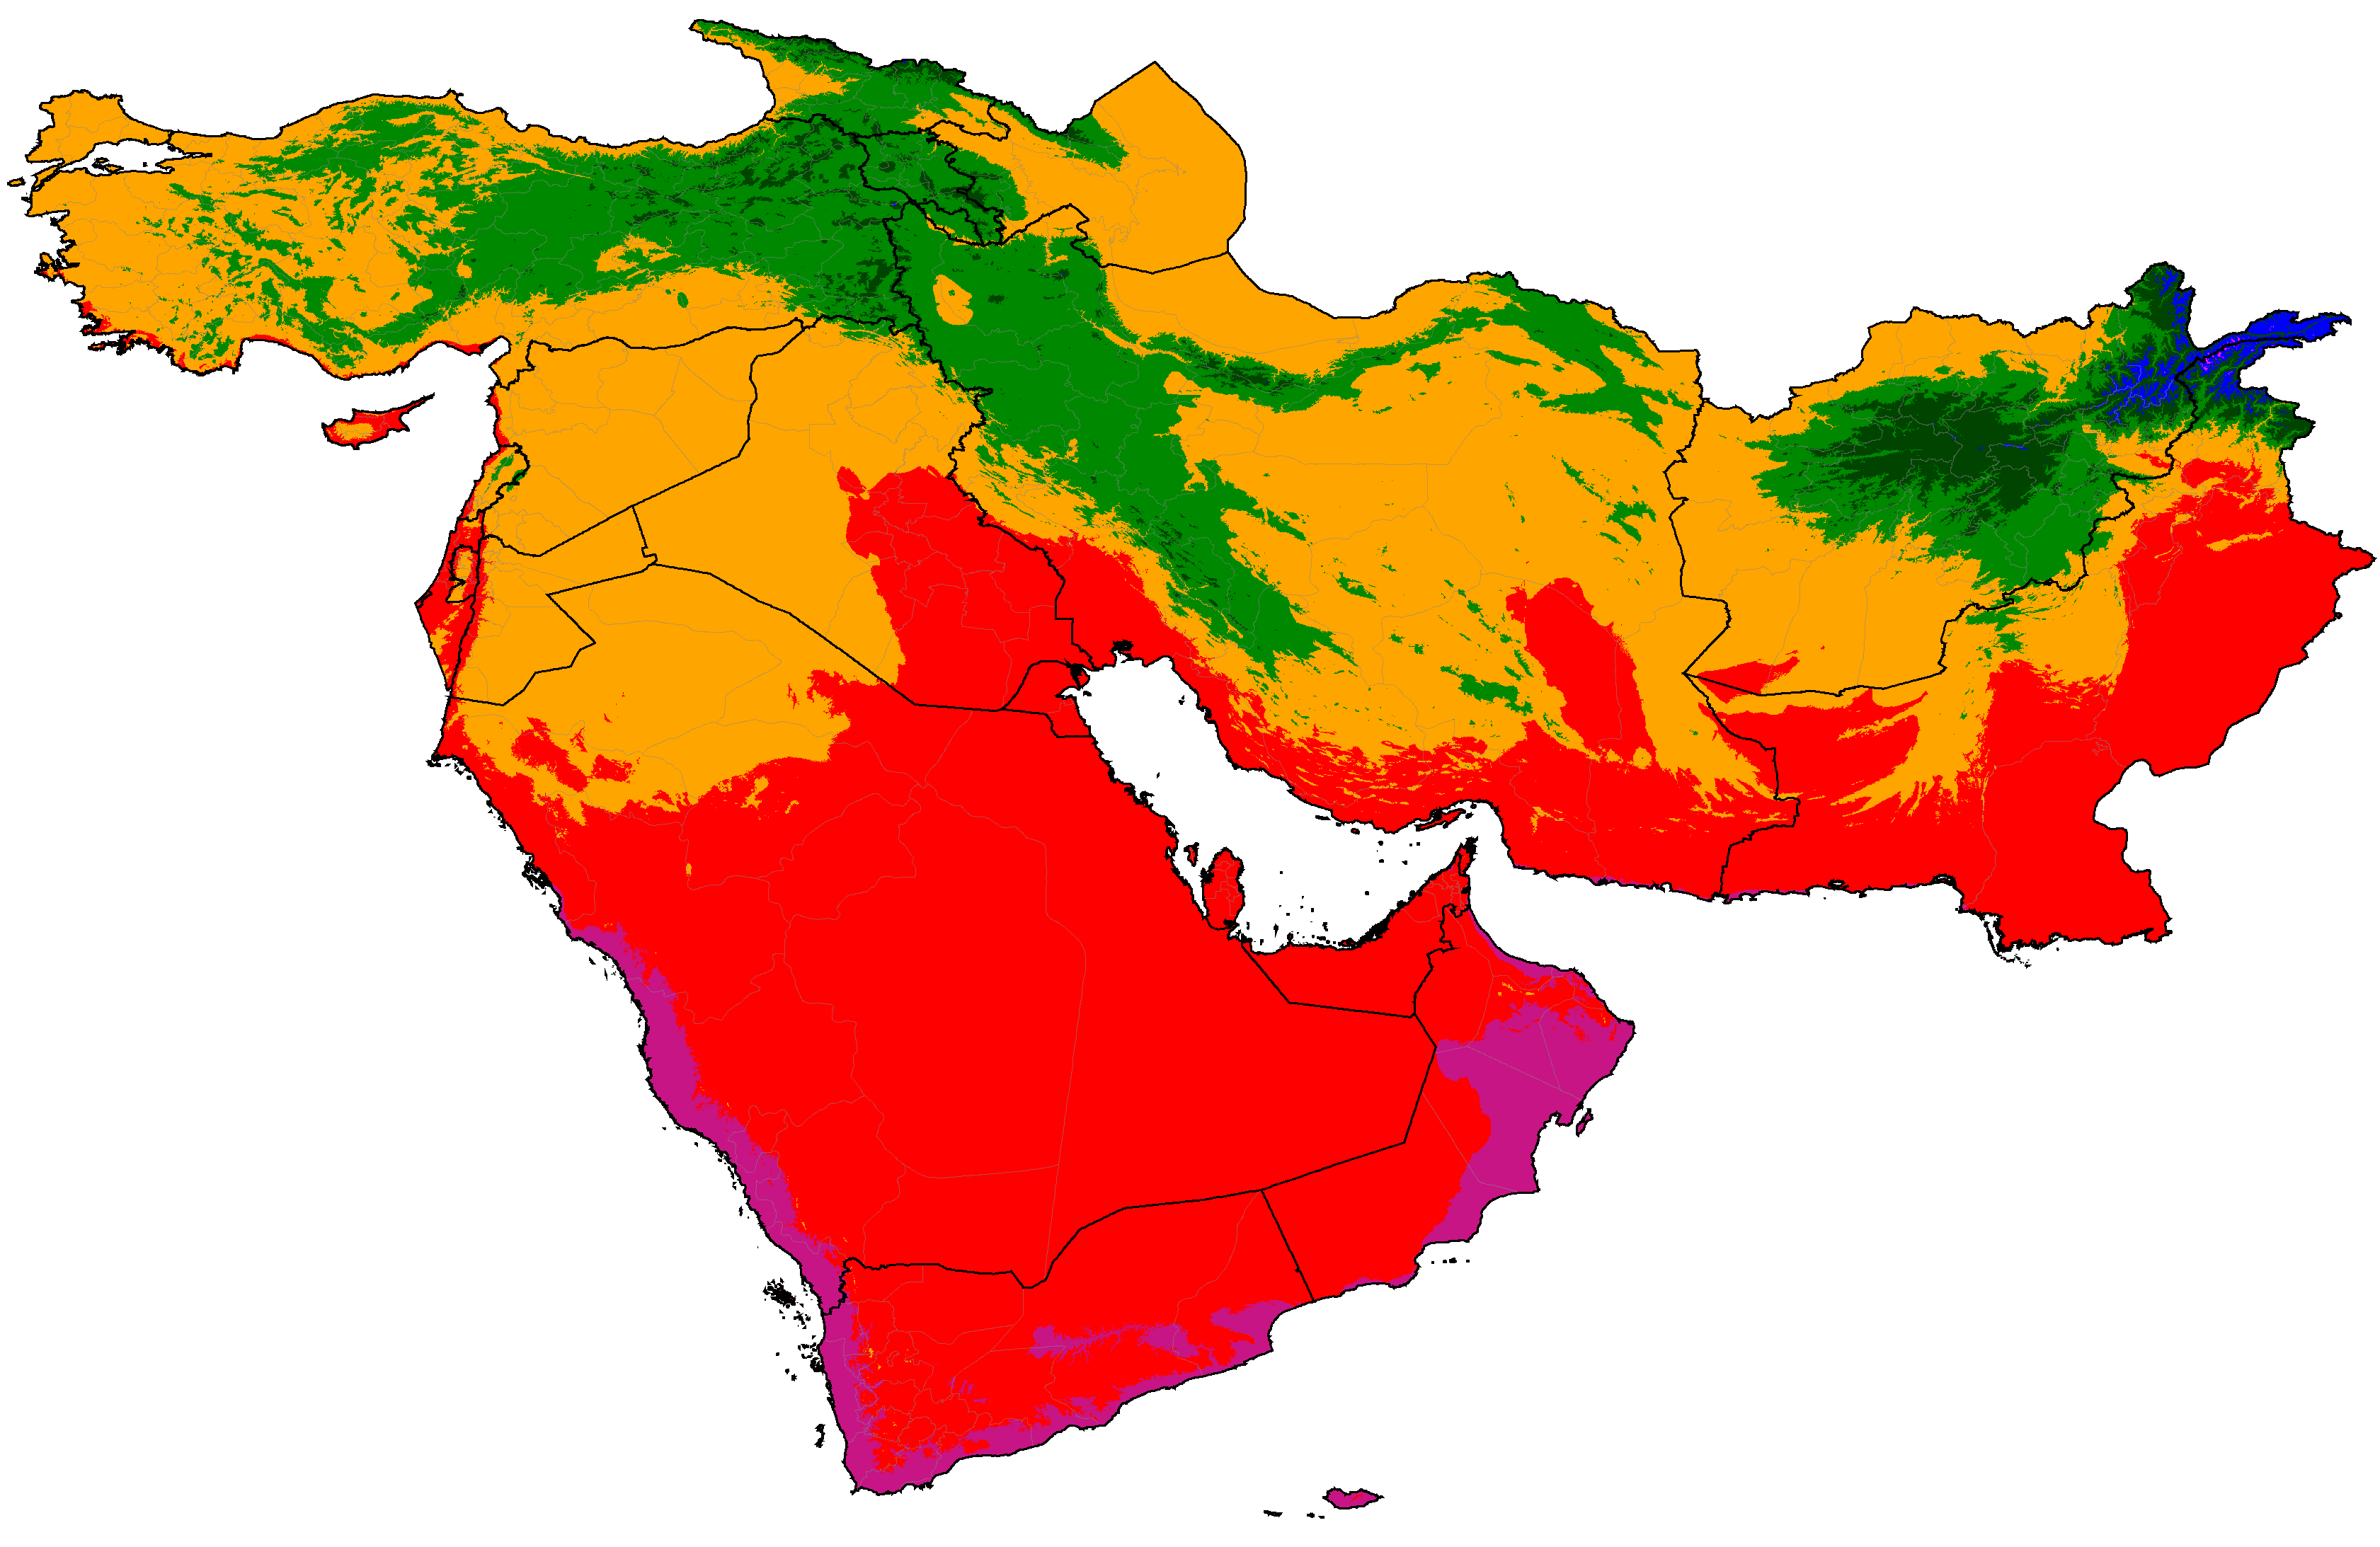
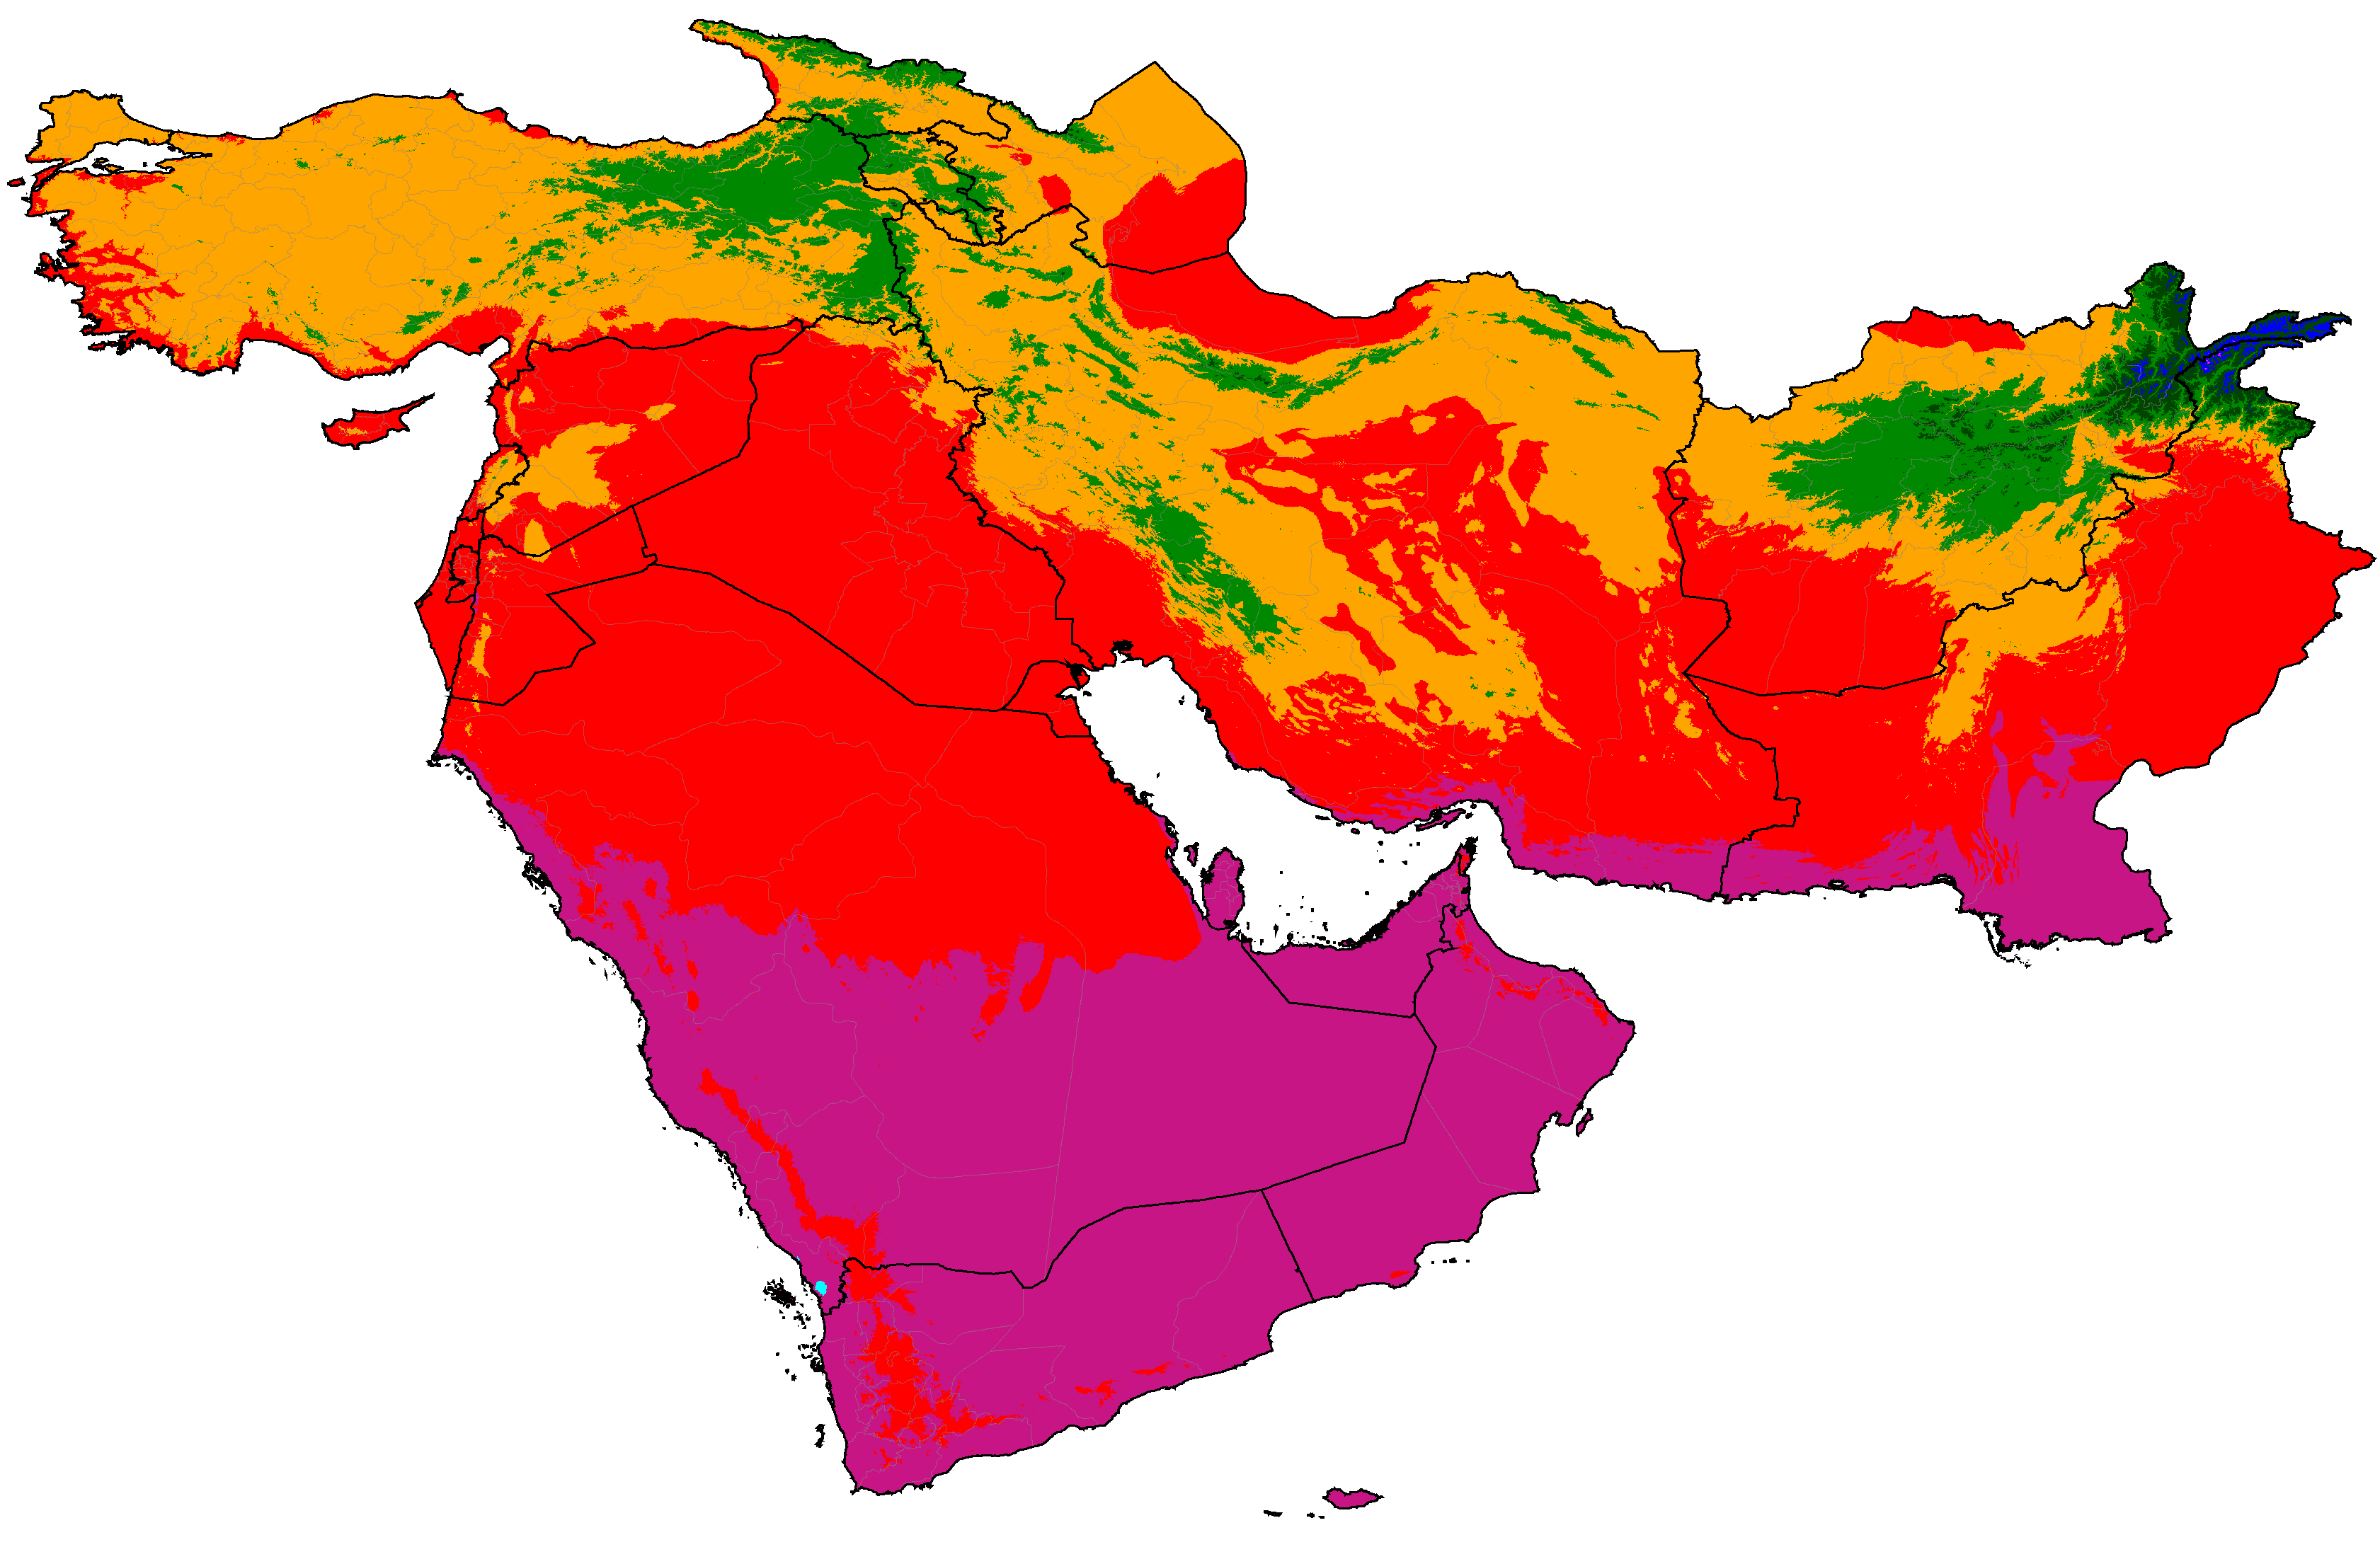
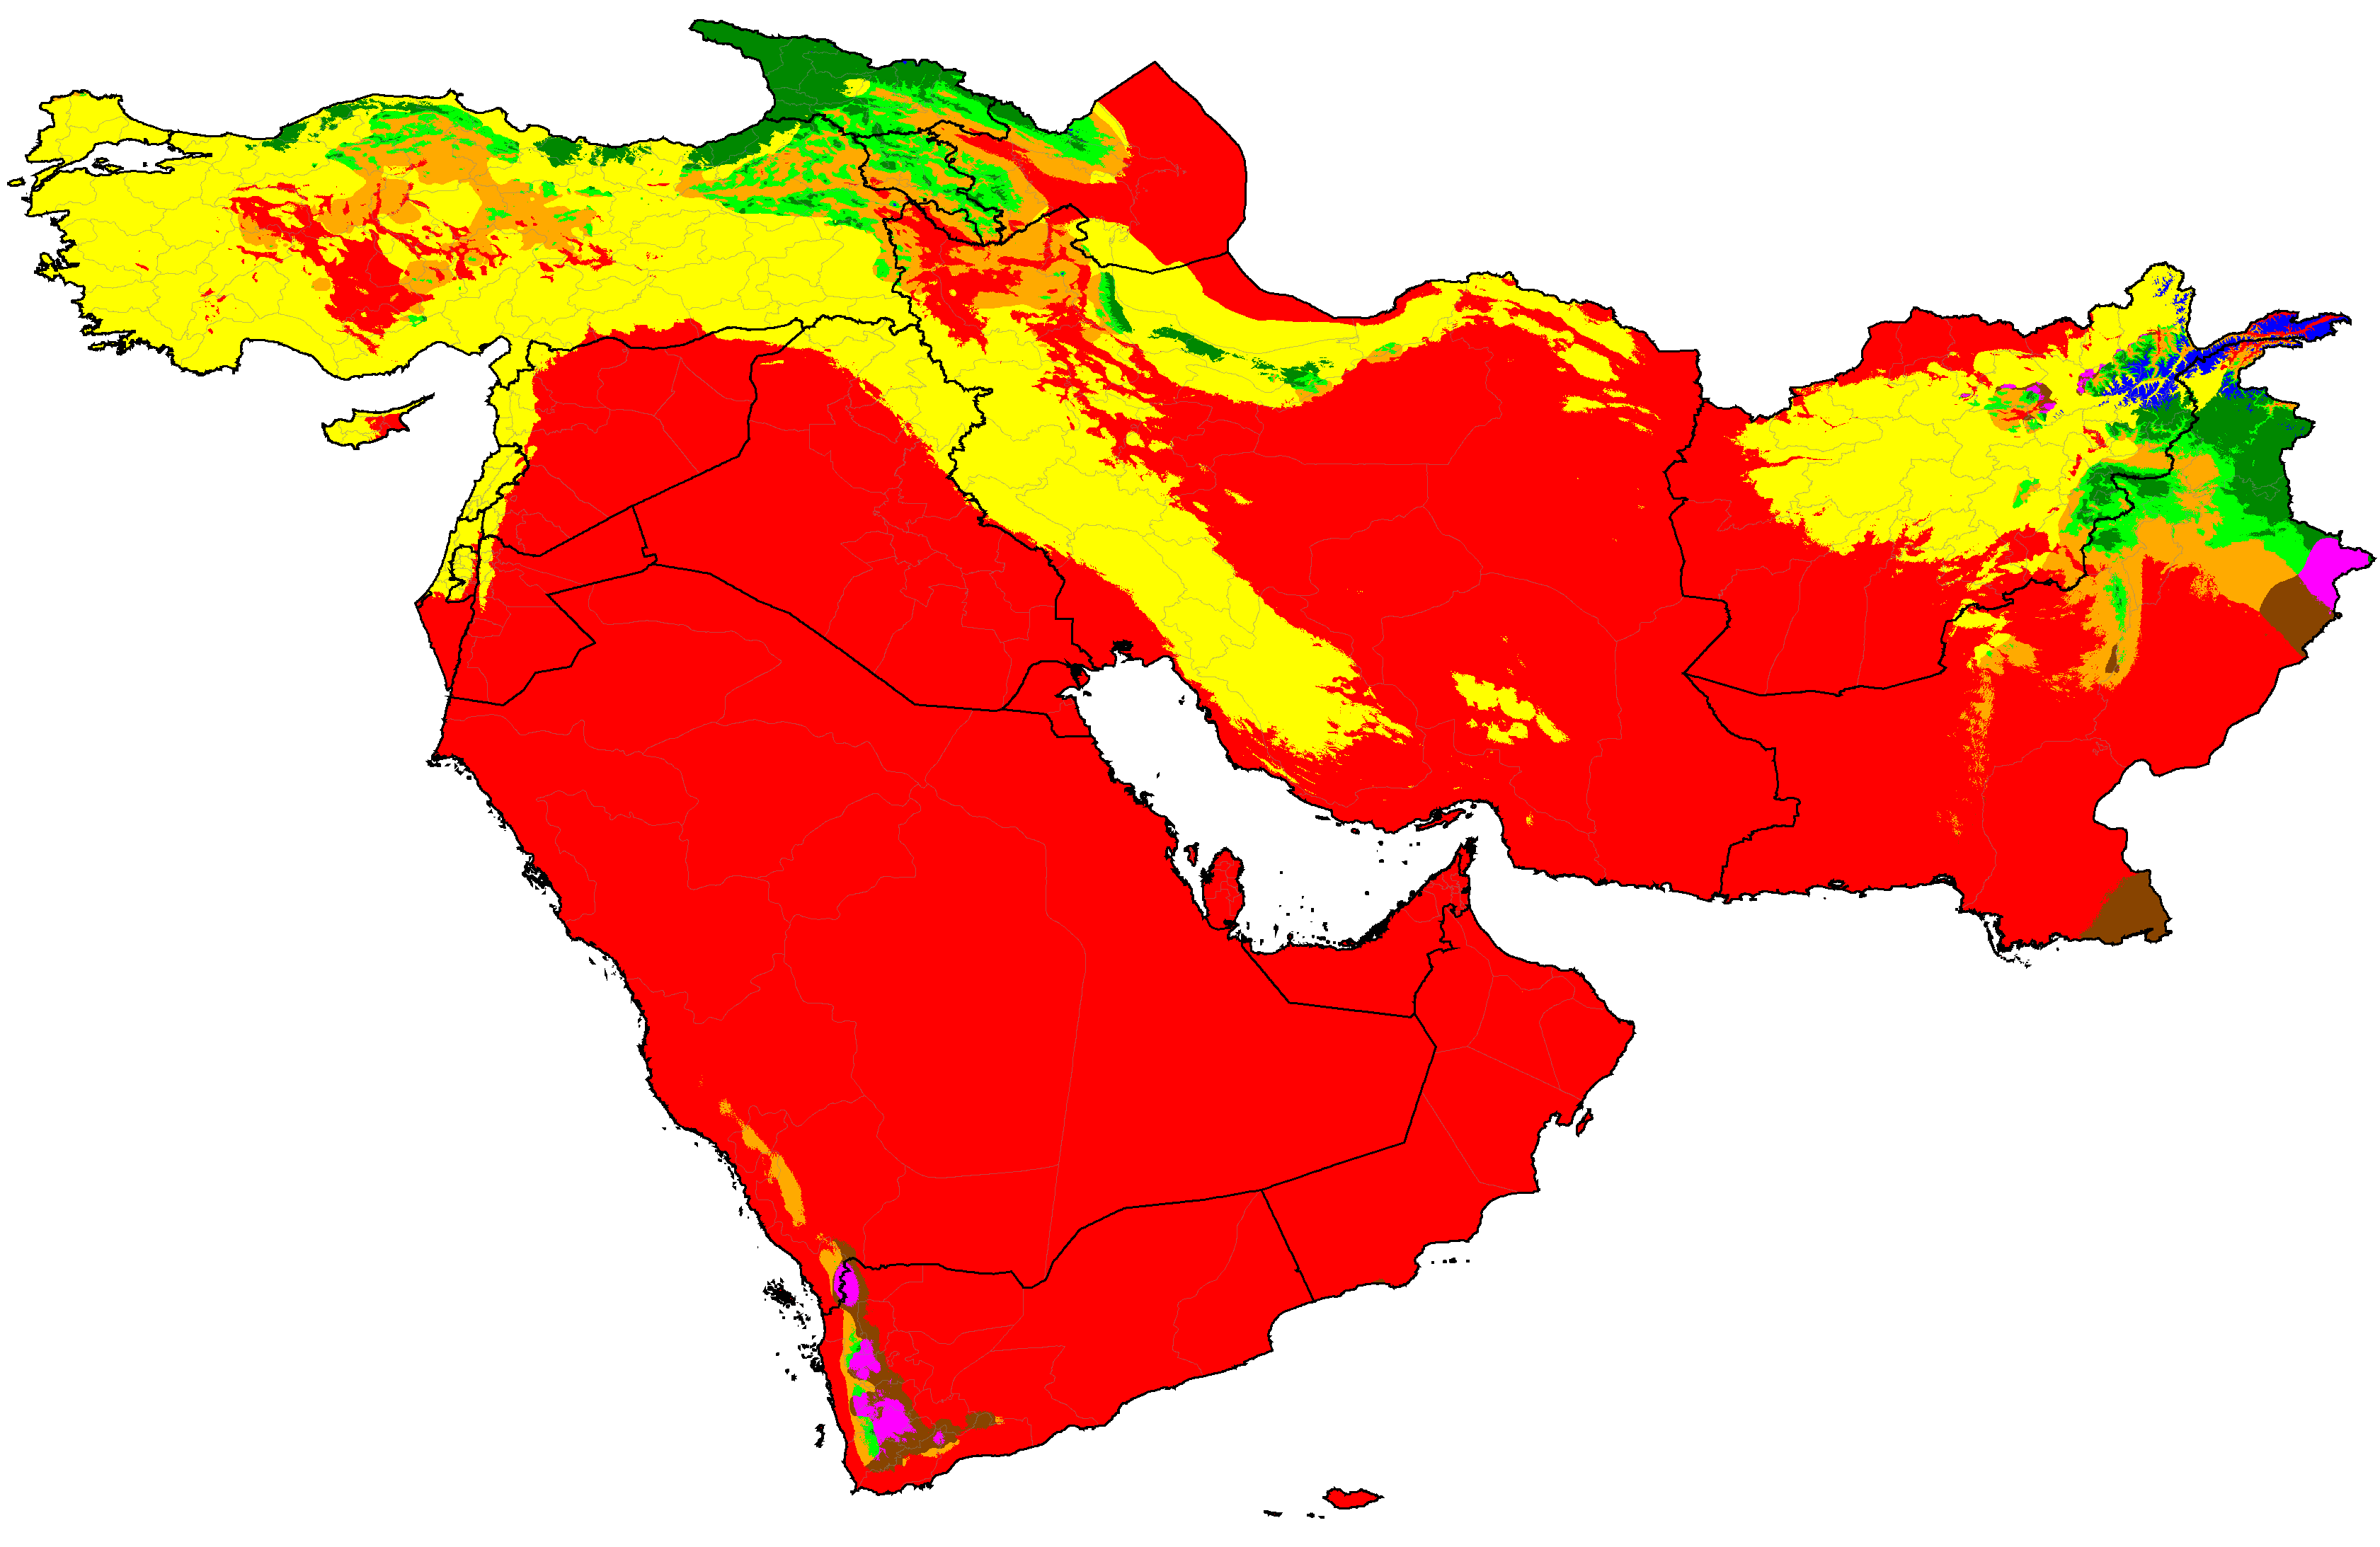
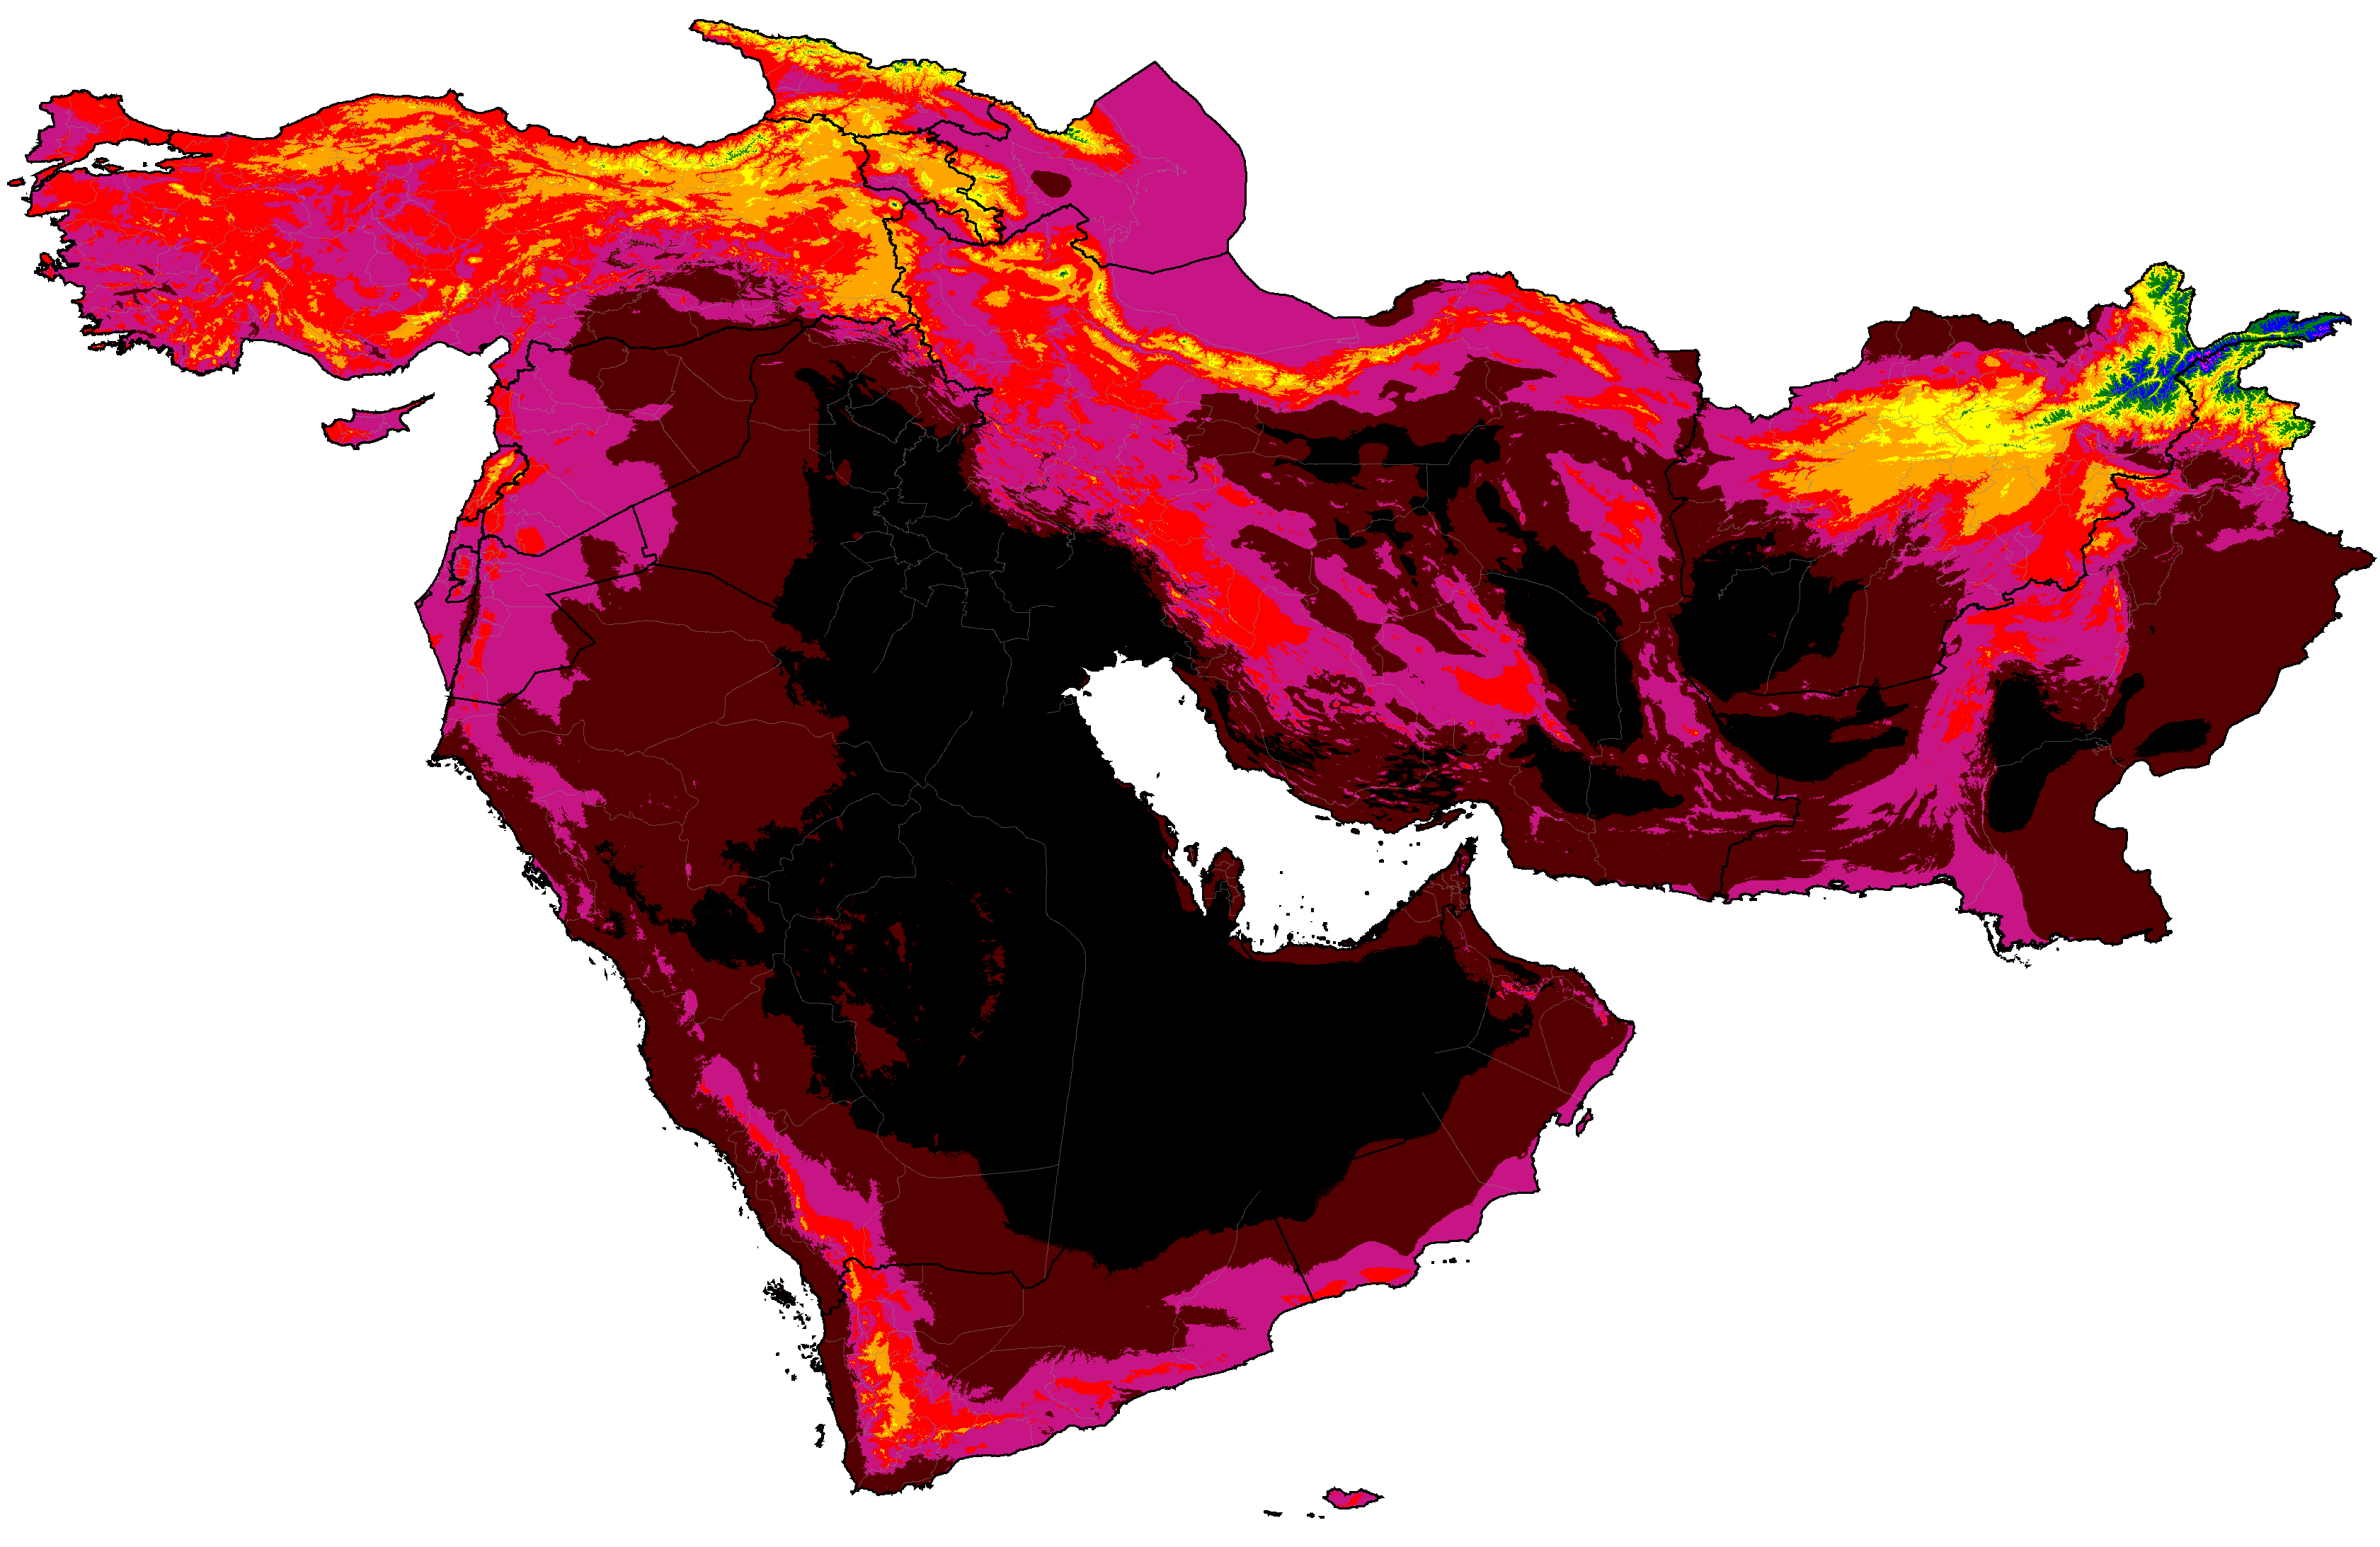
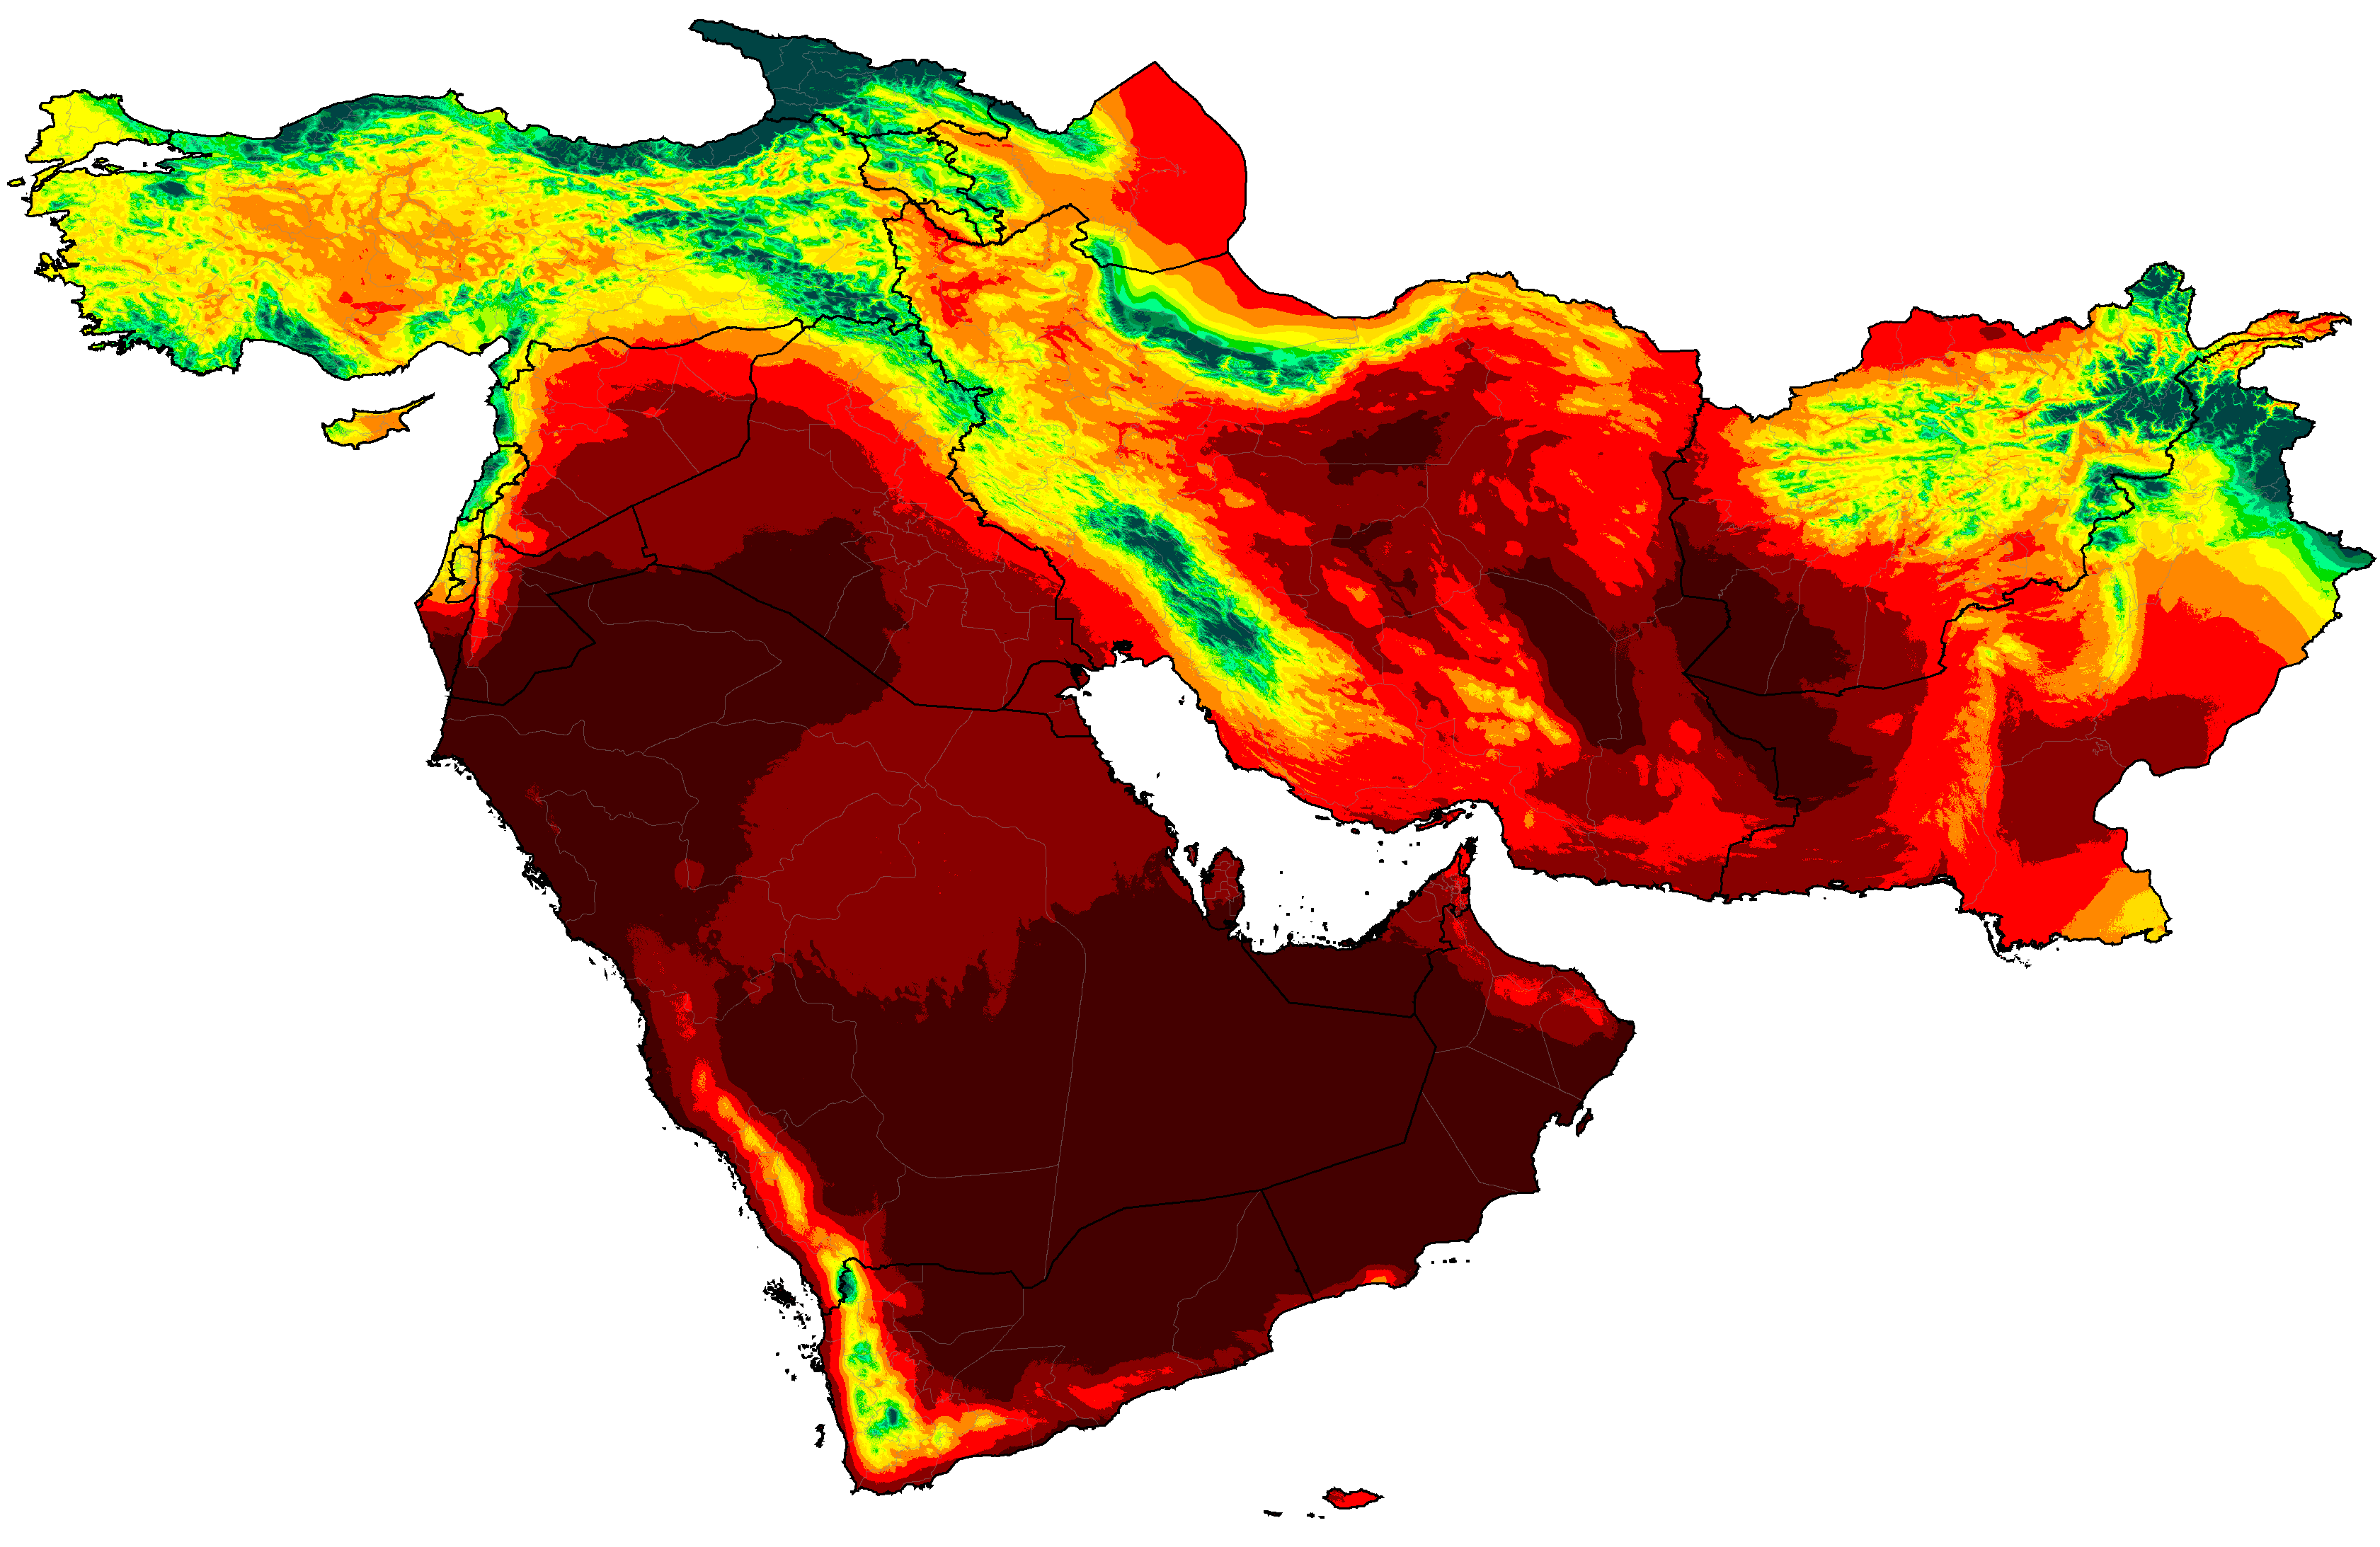
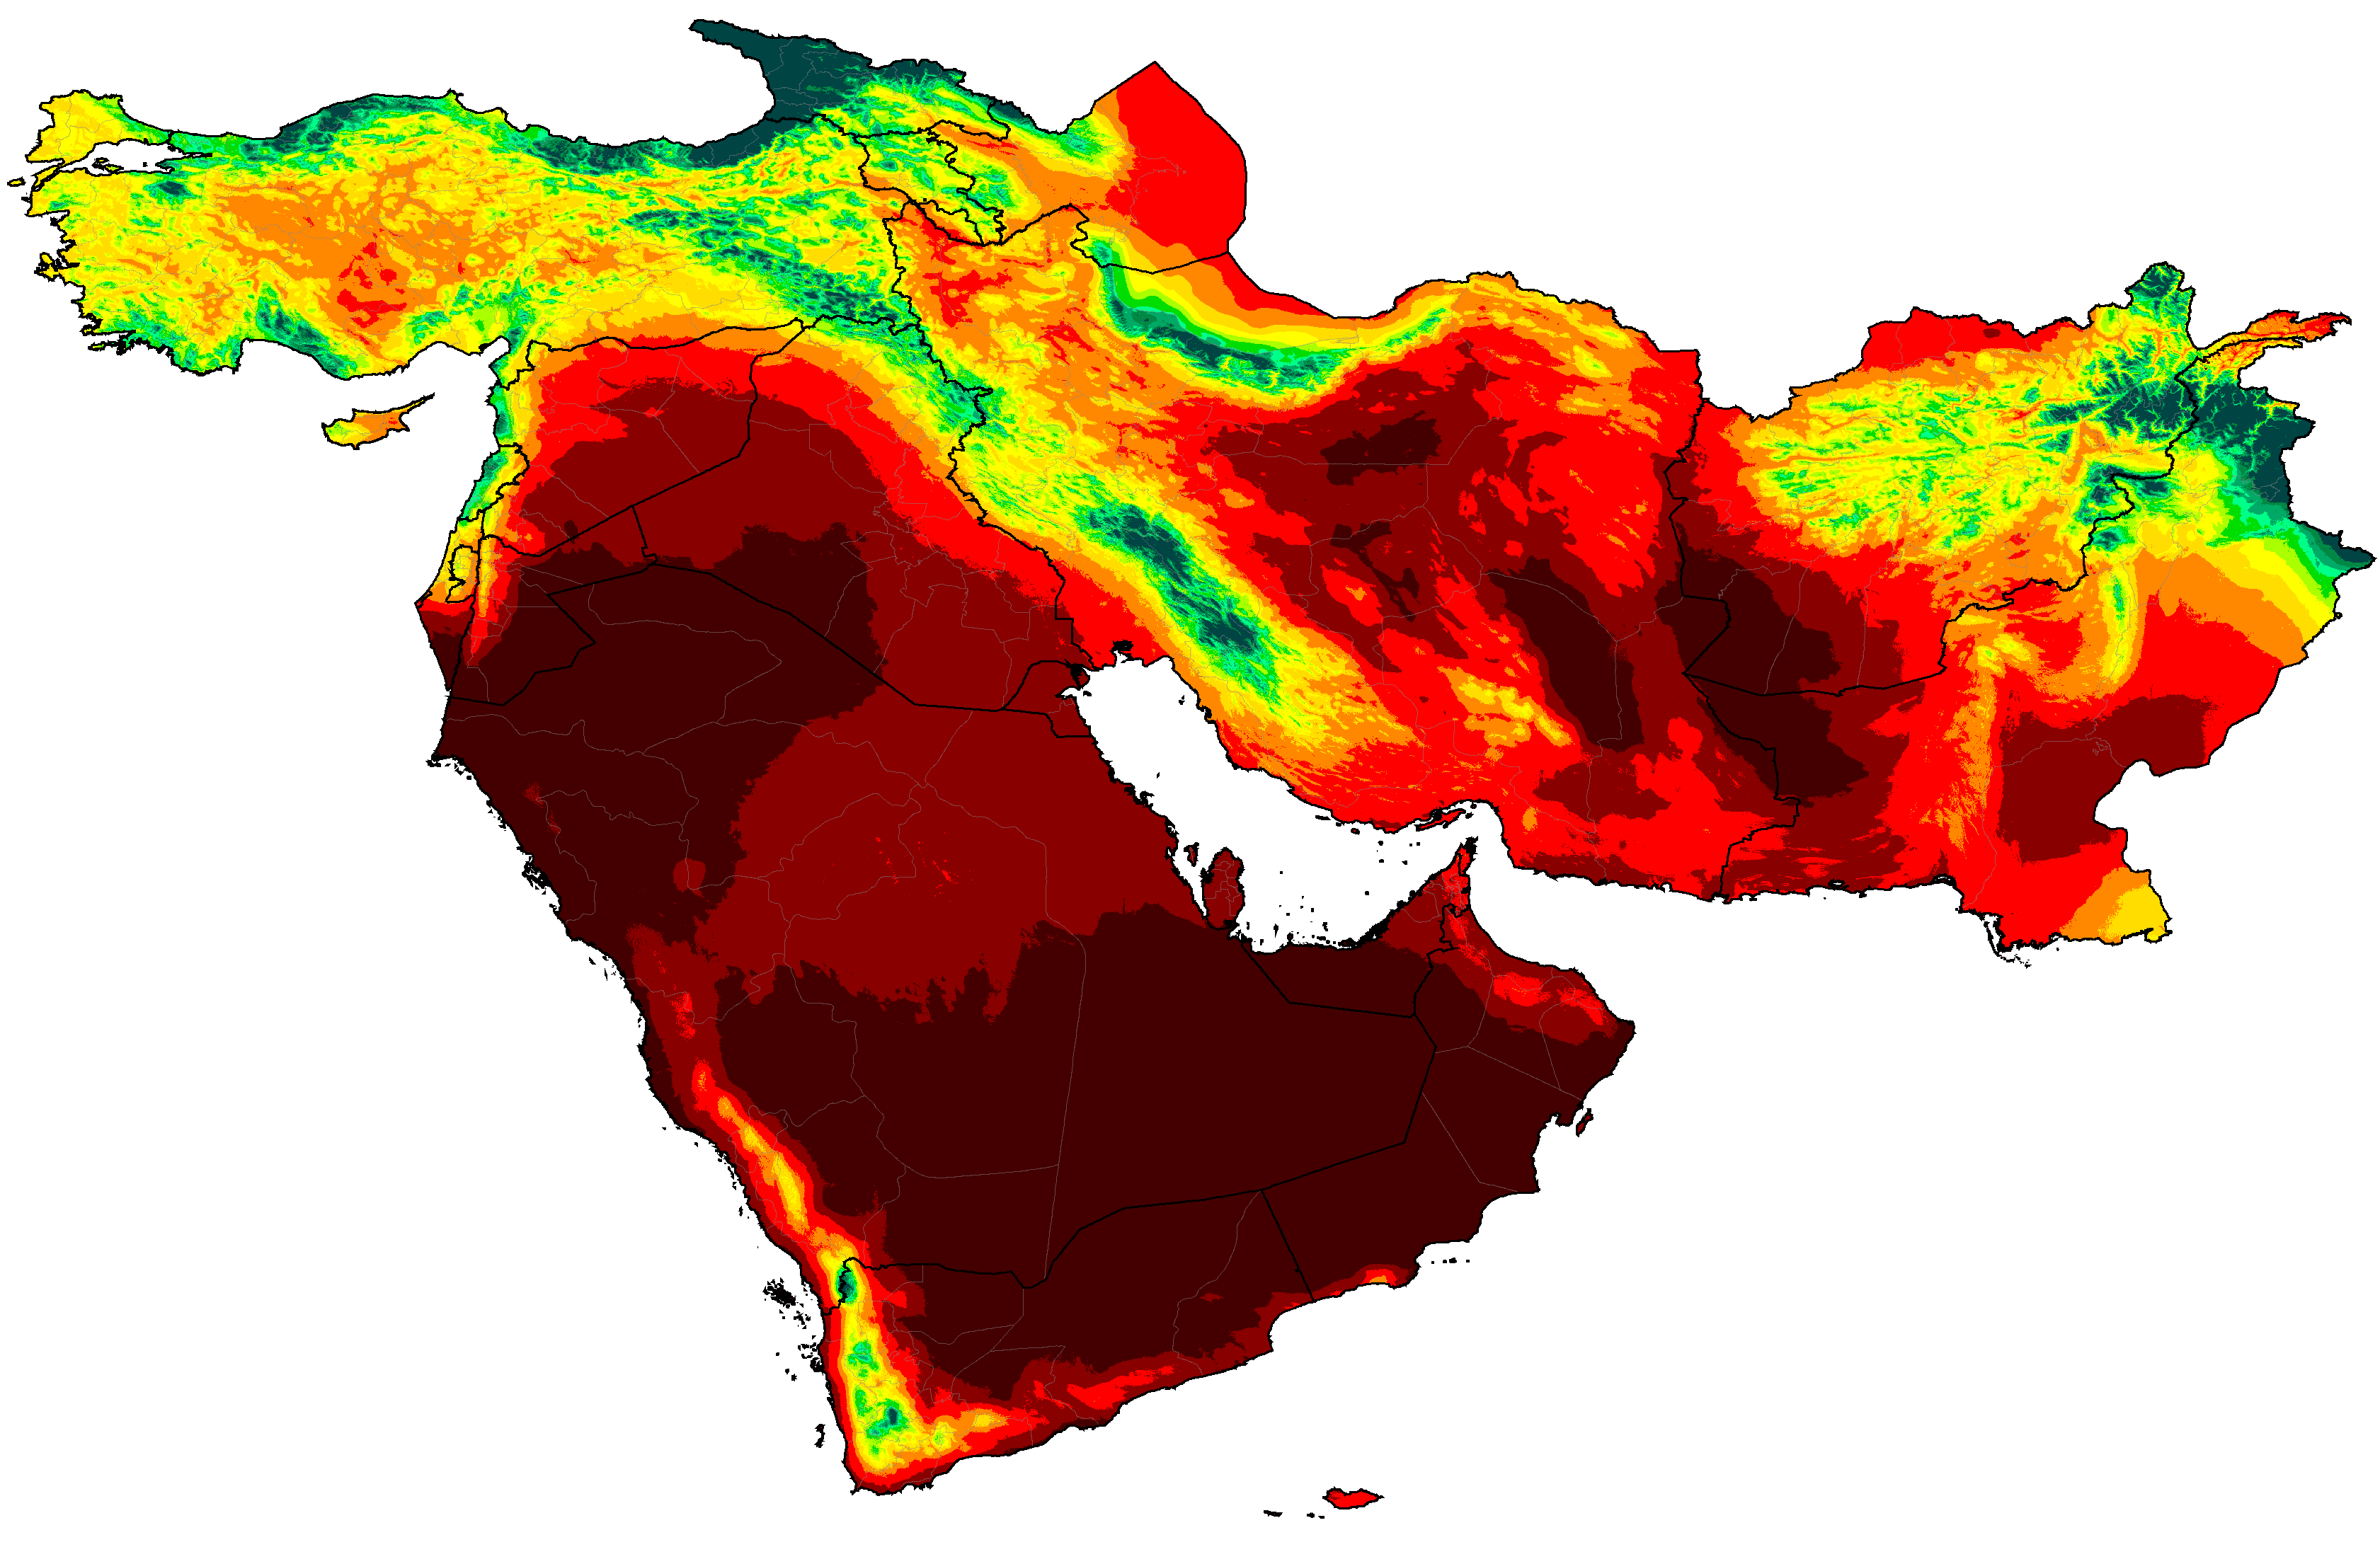
West Asia distribution of summer categories (projections are SSP5-8.5 high emissions normals)
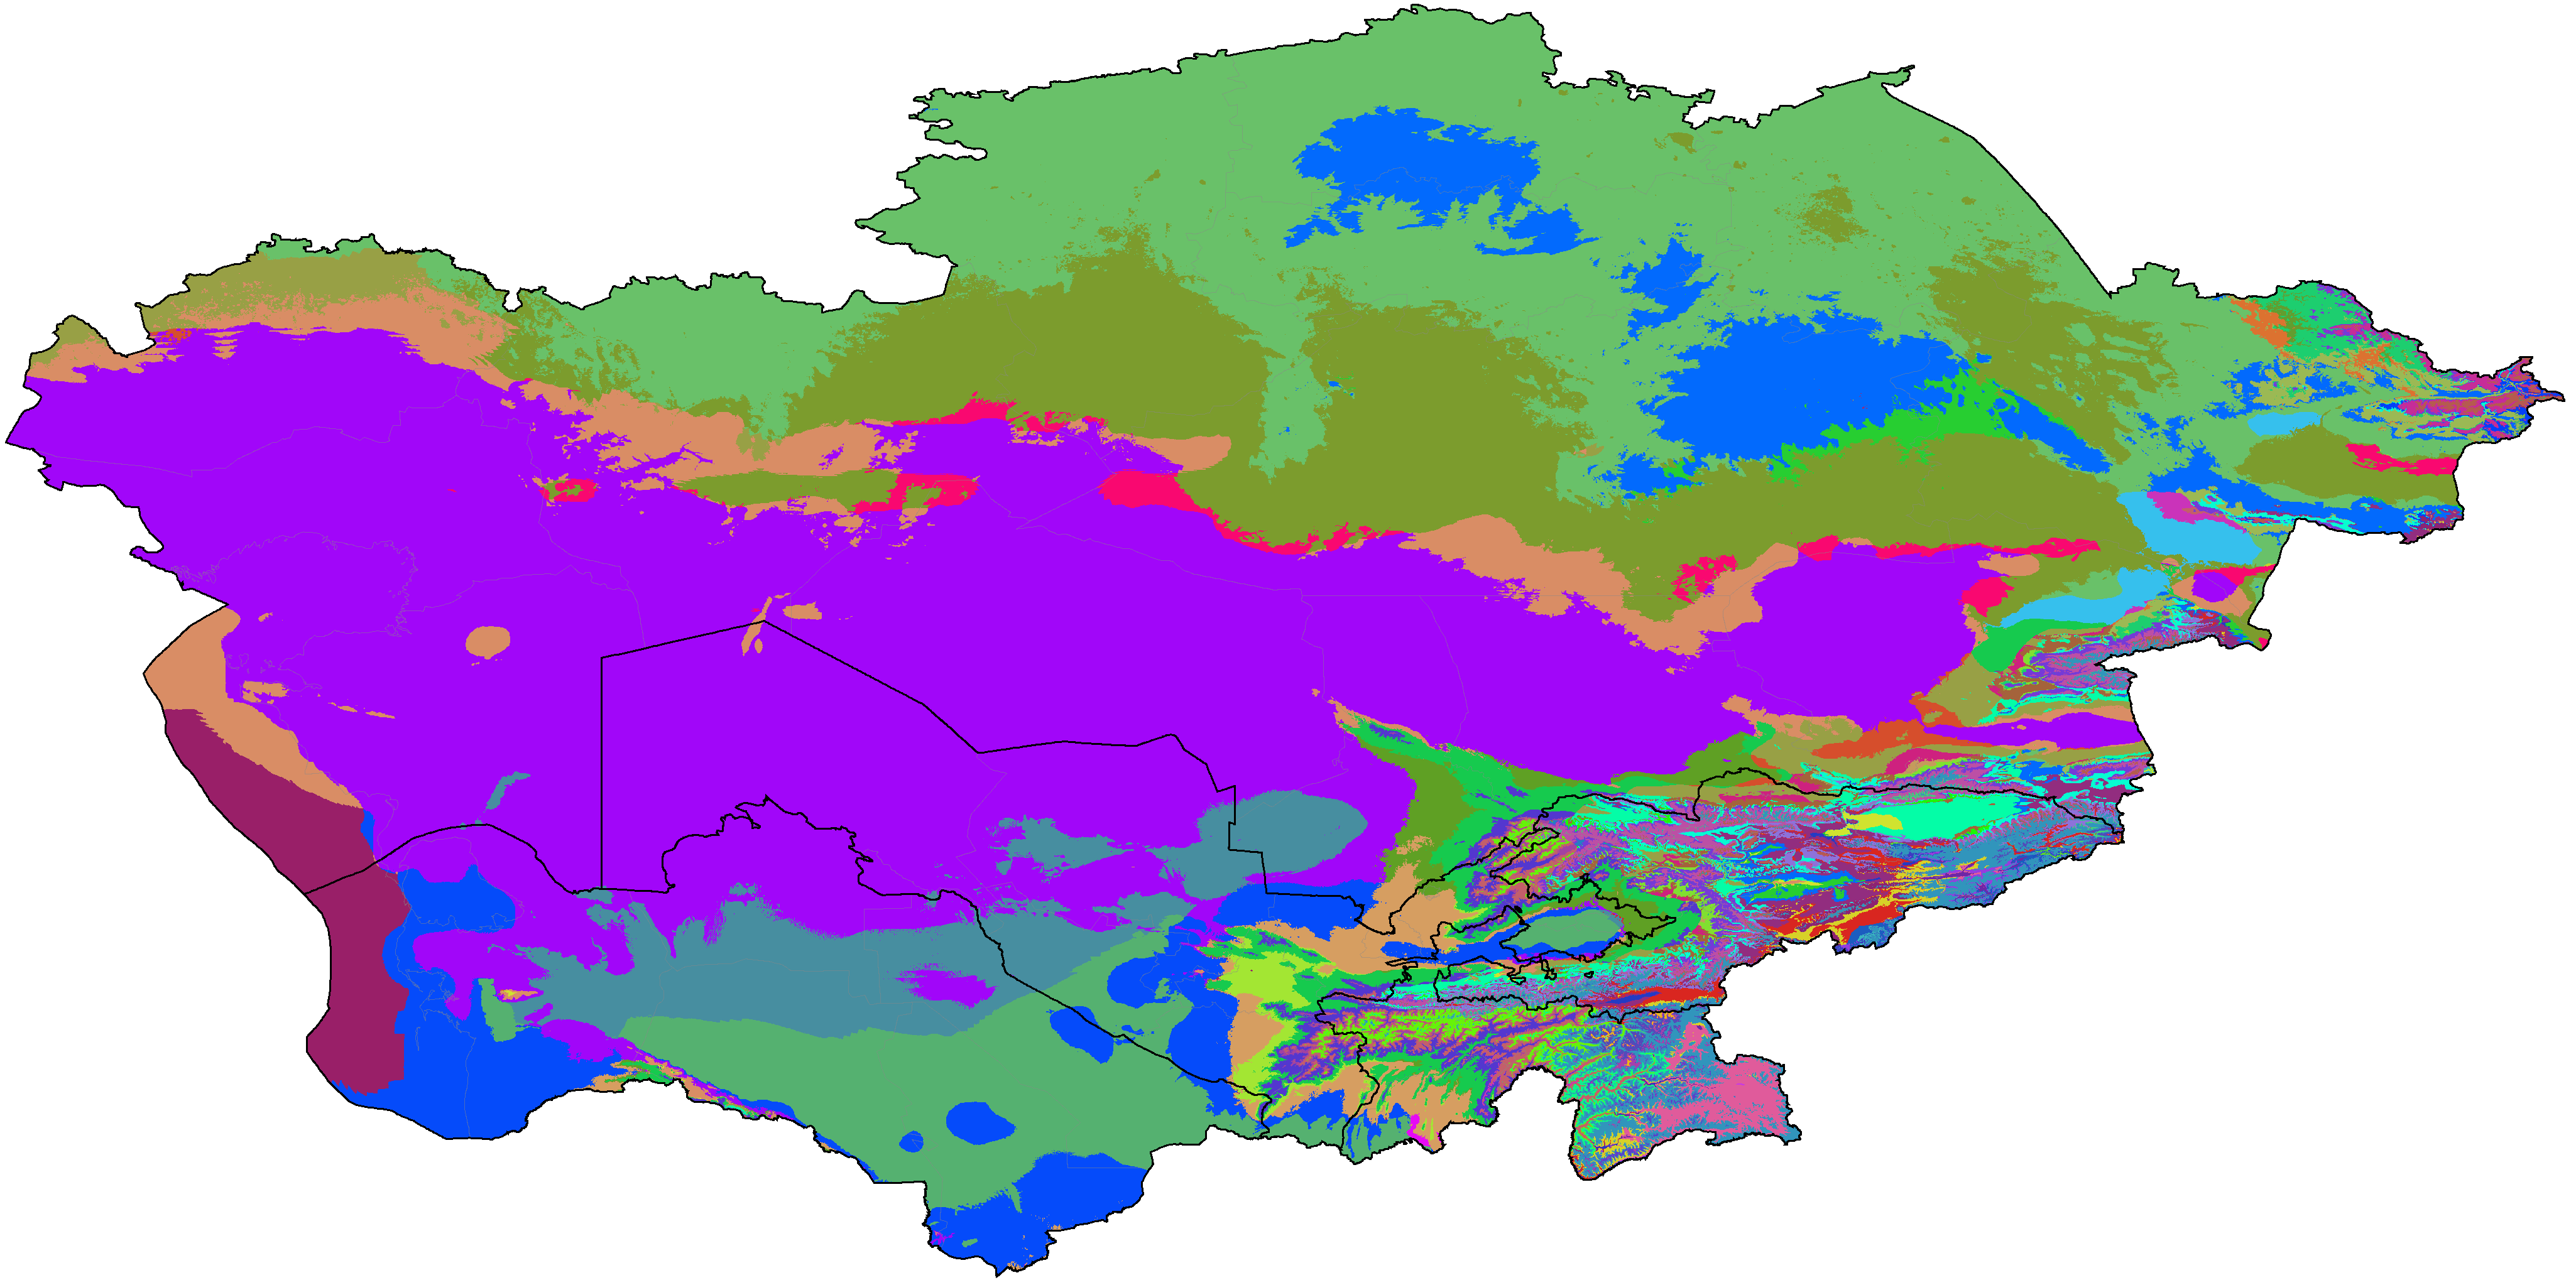
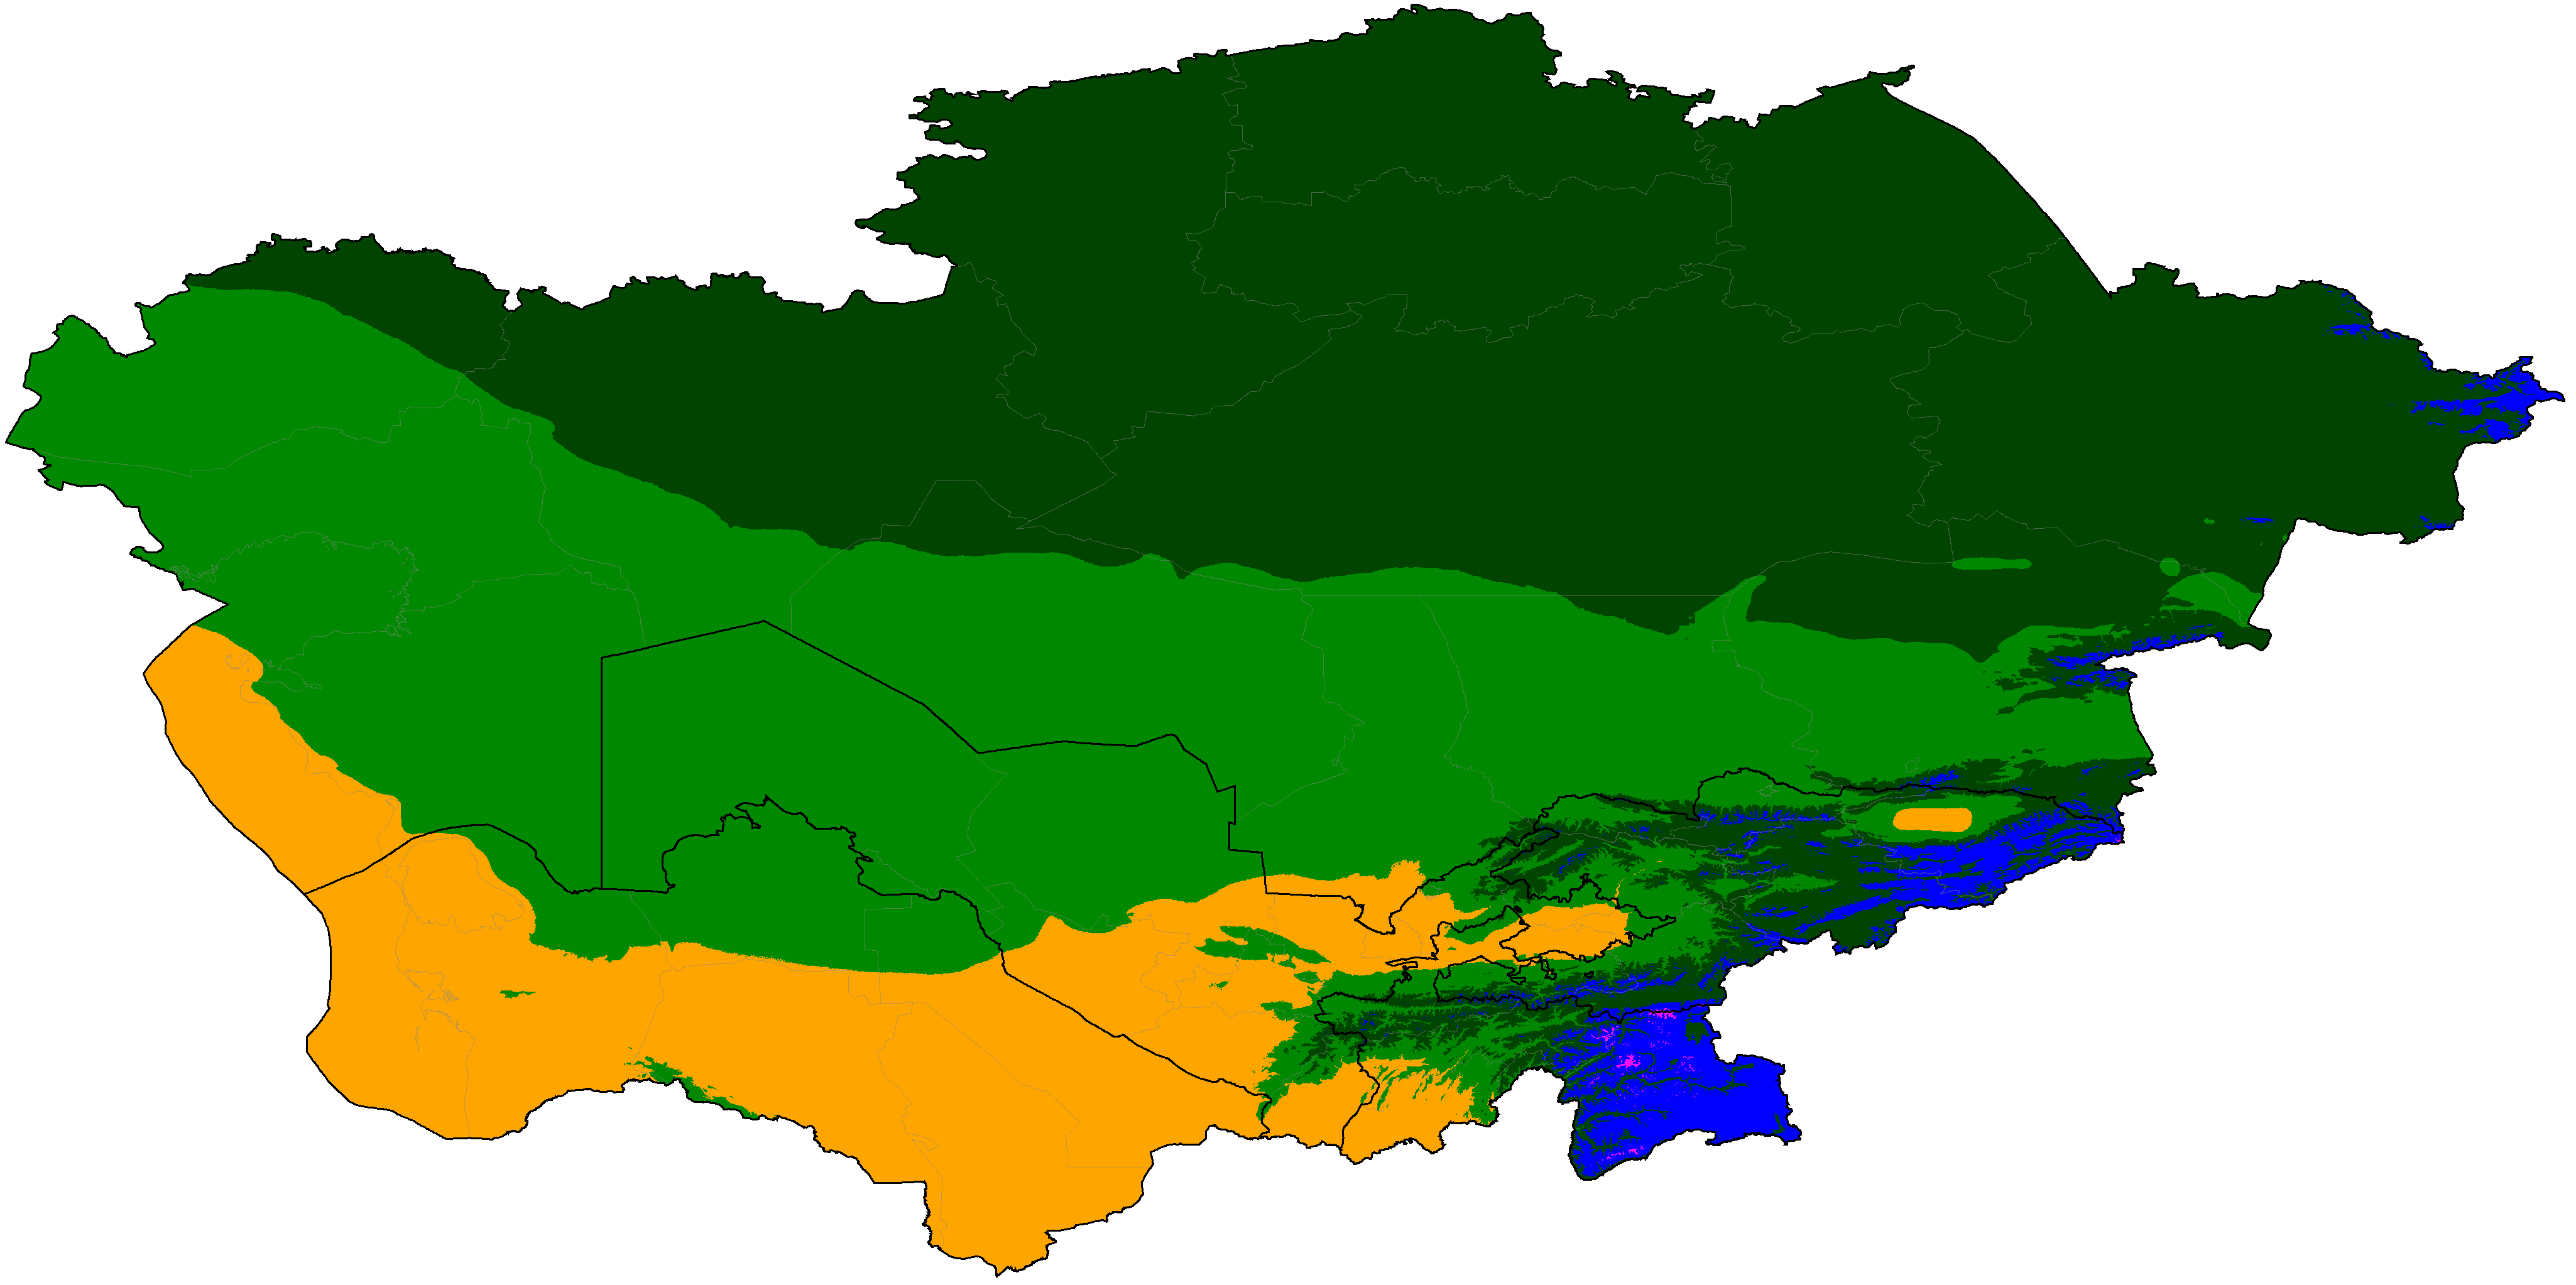
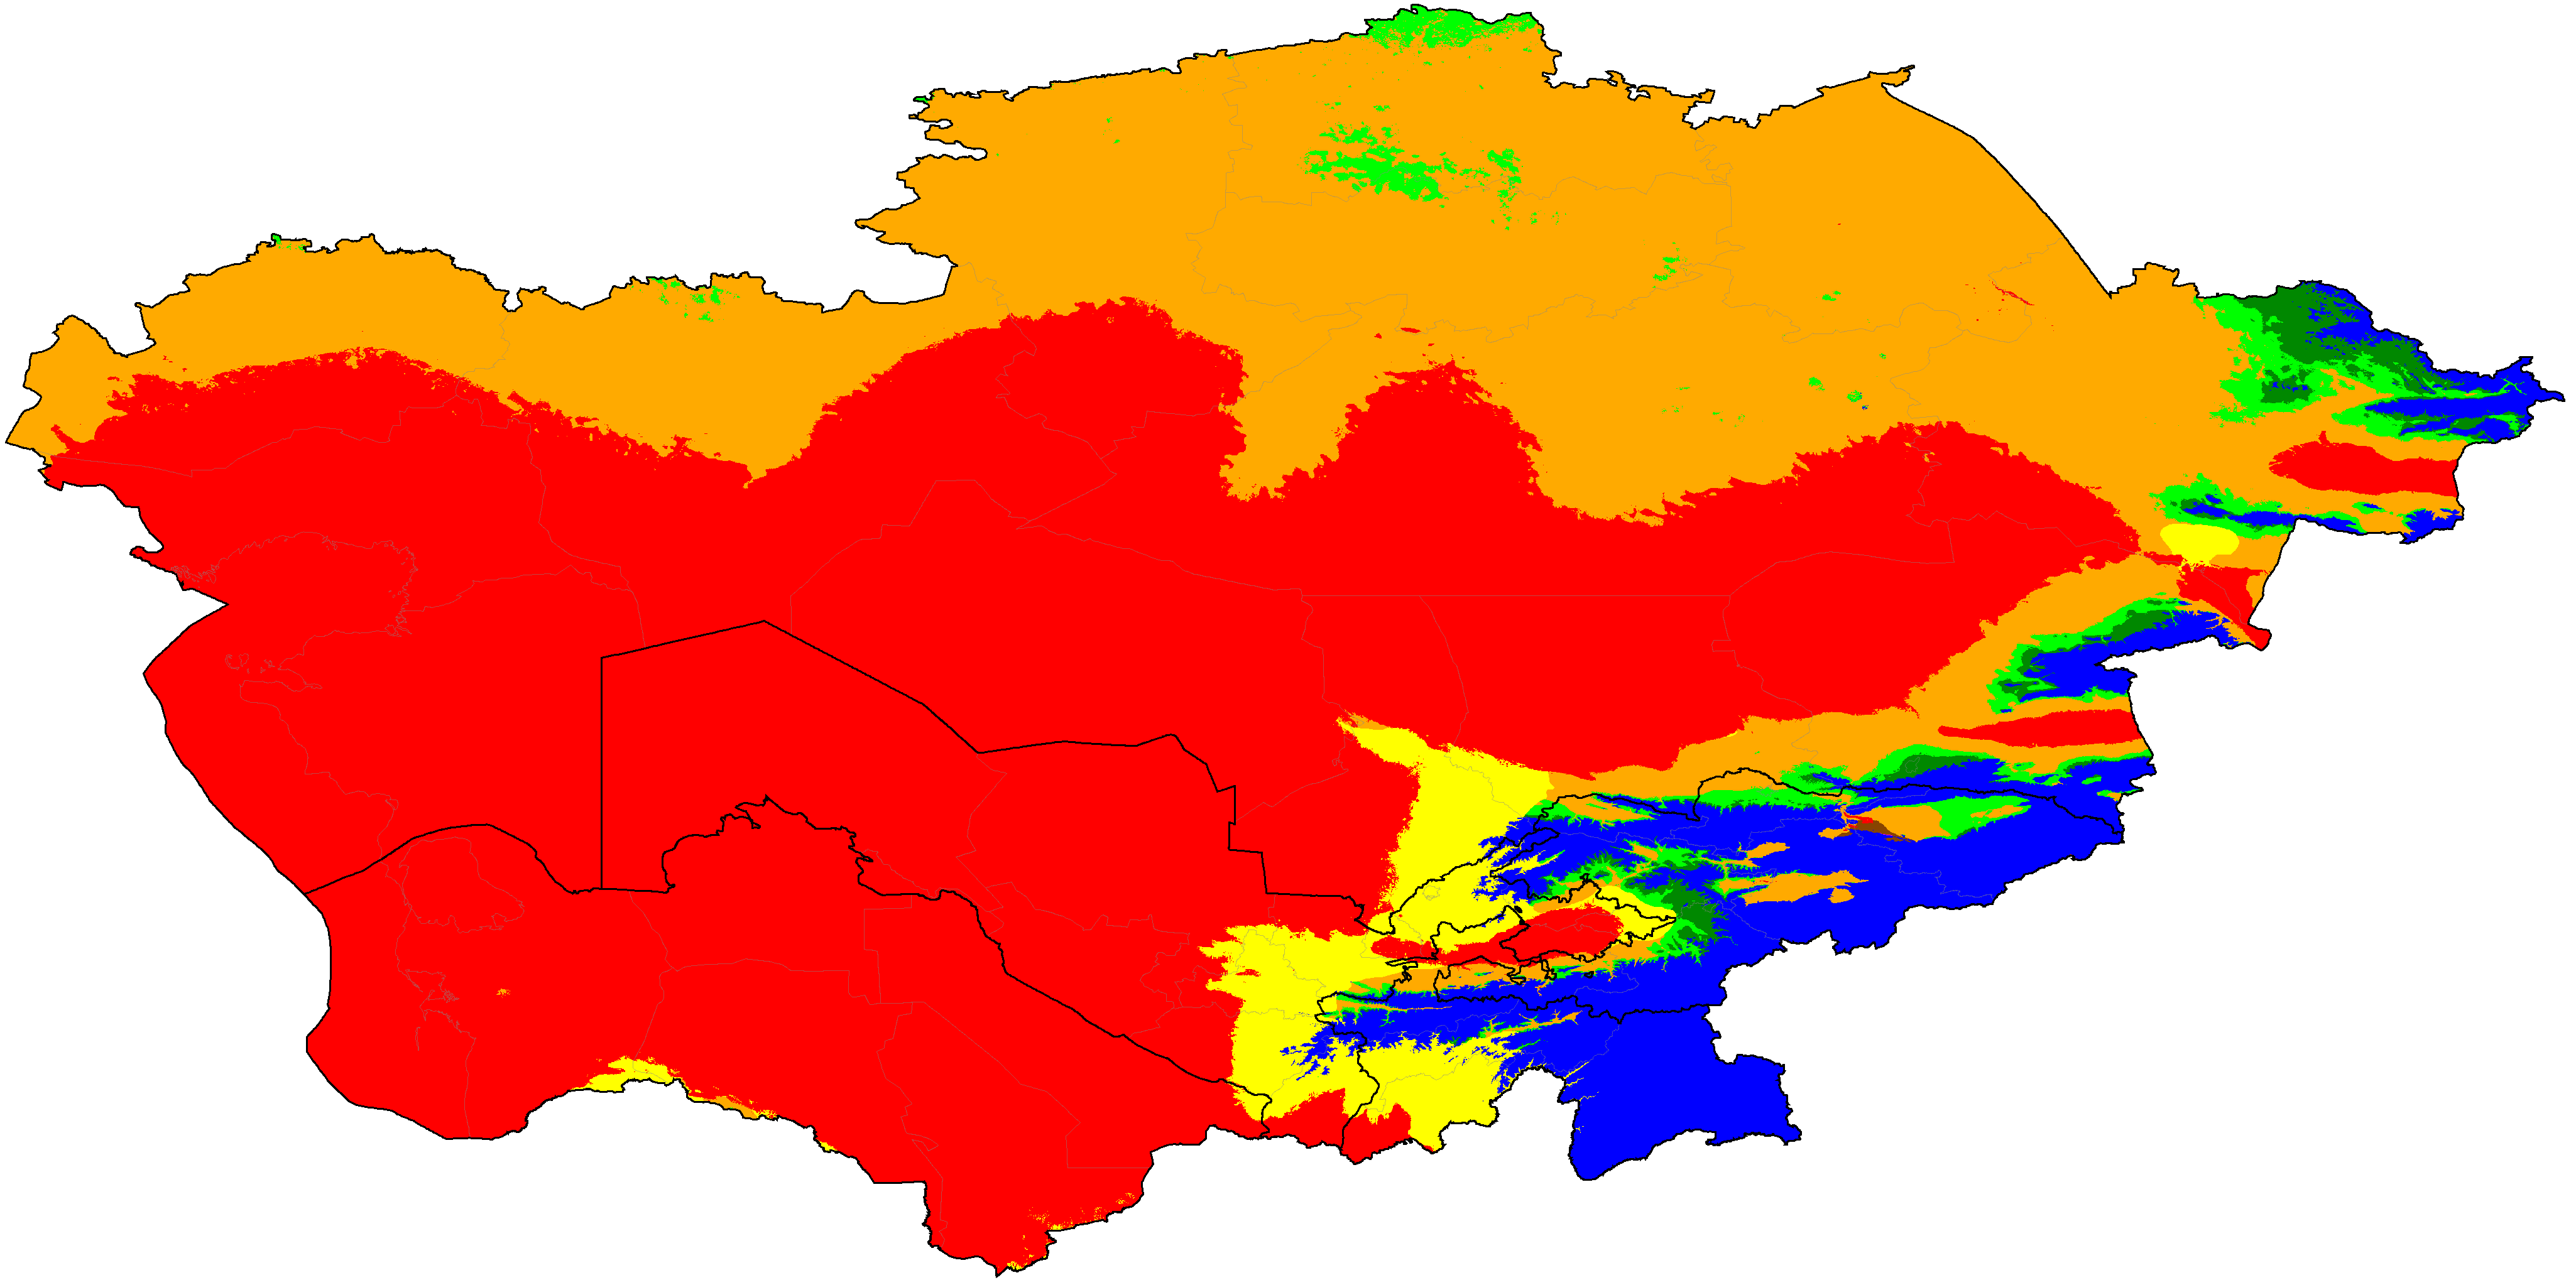
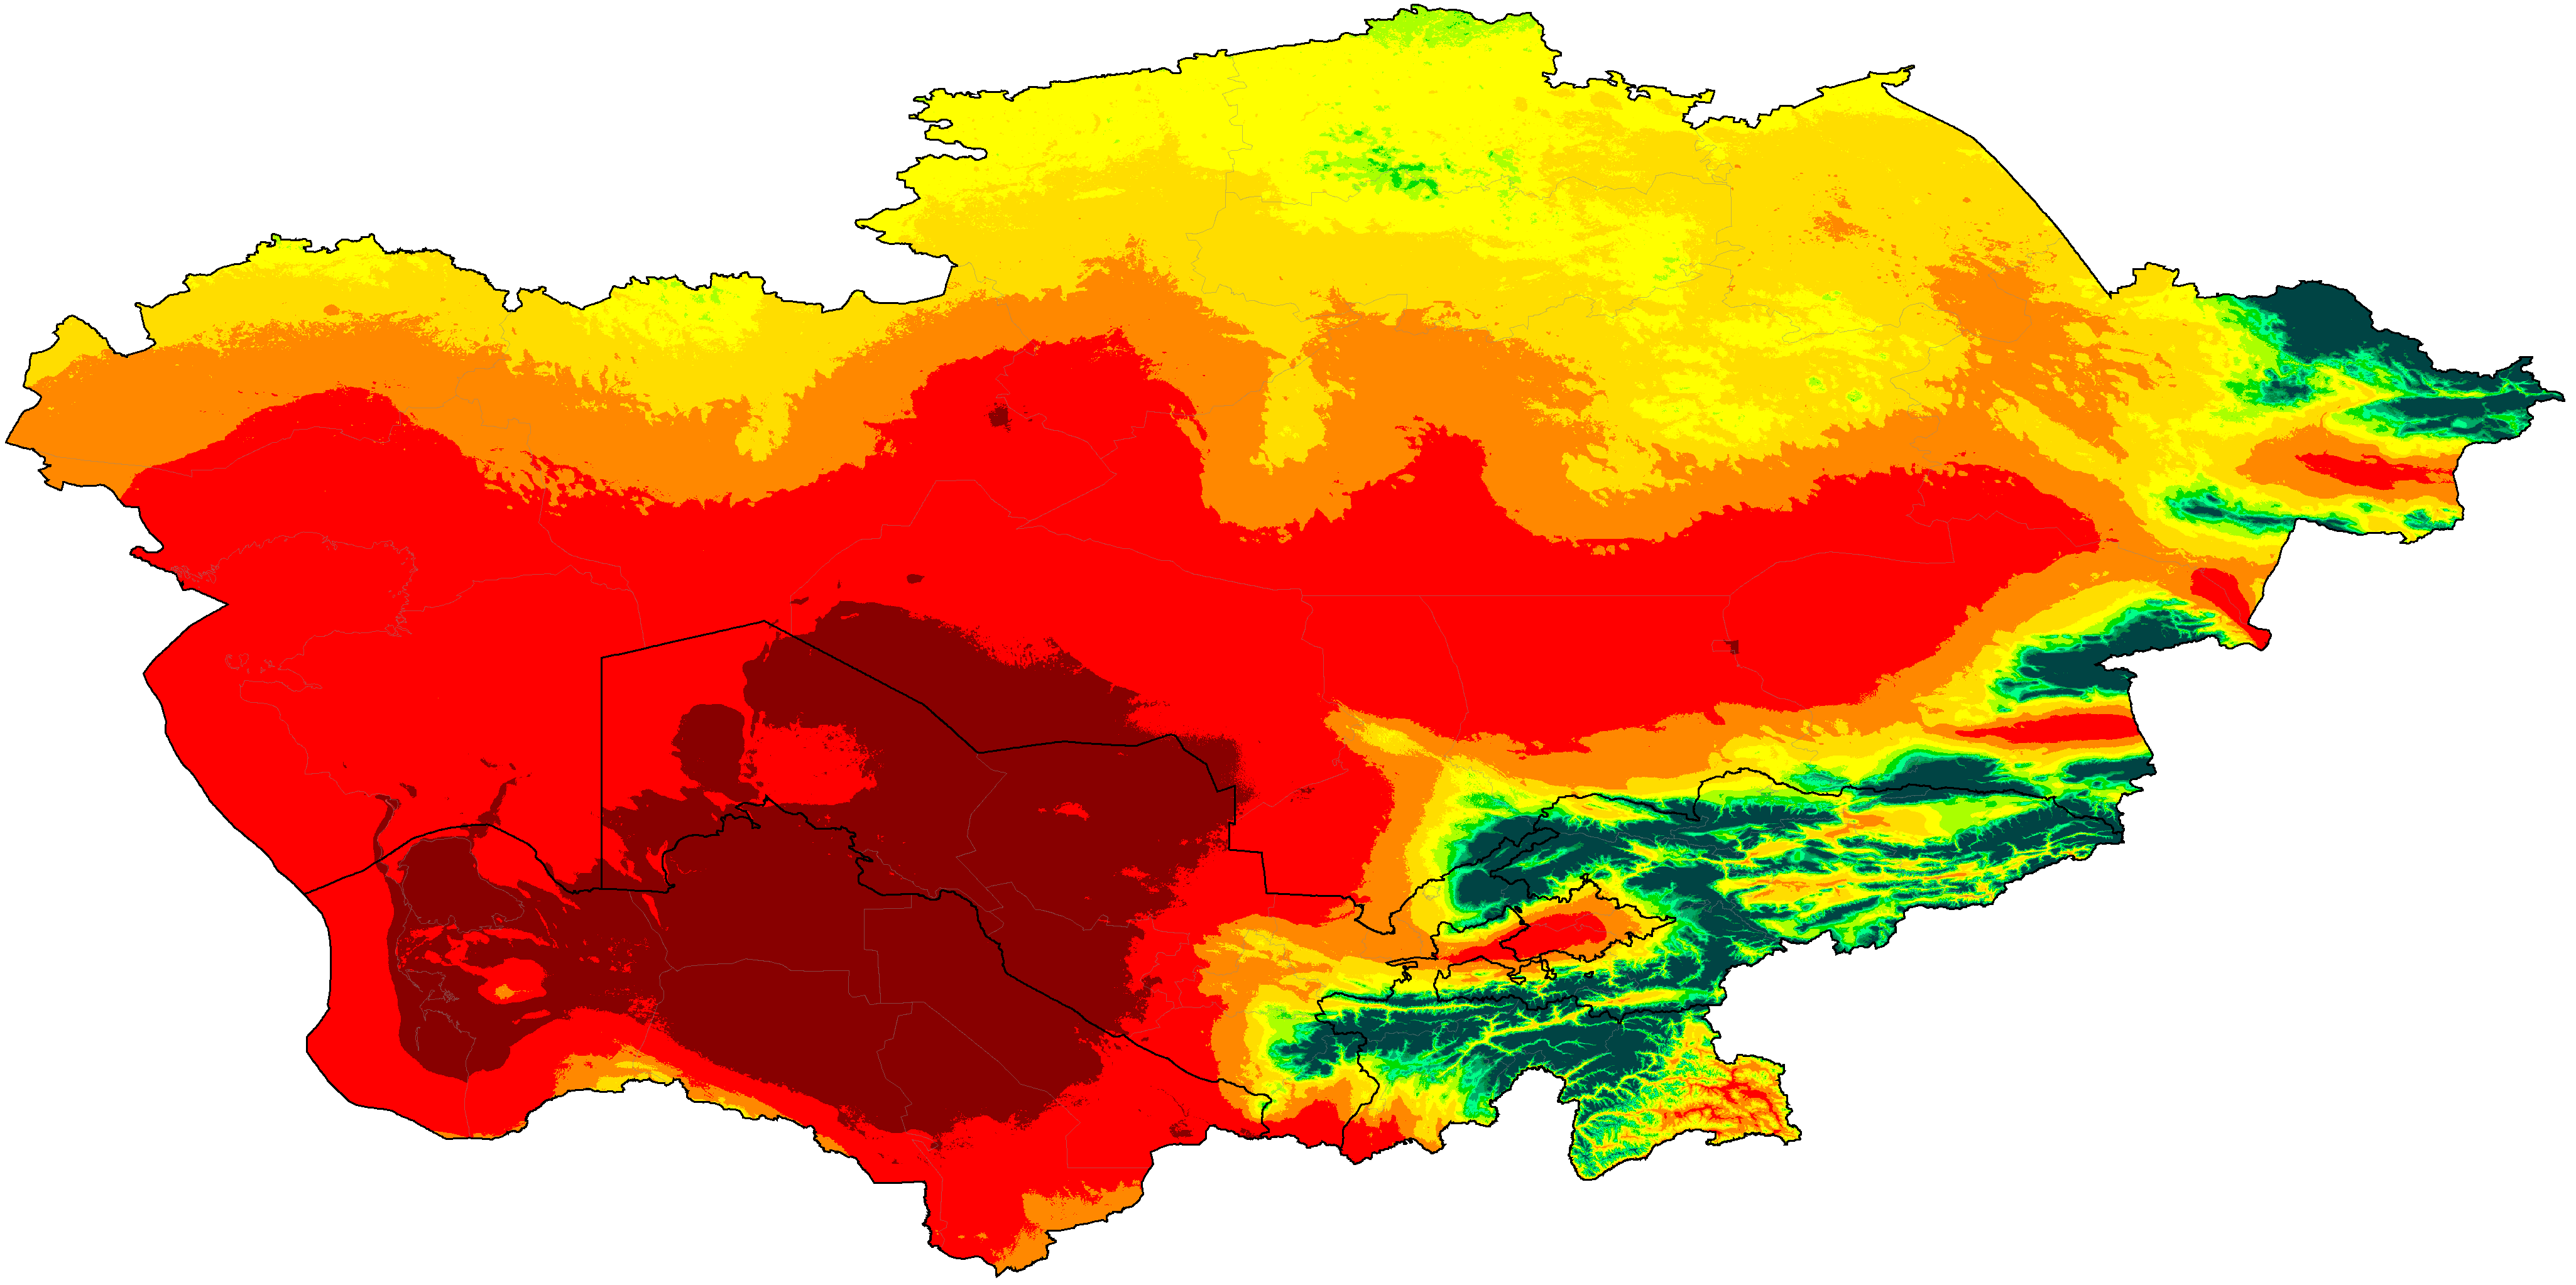
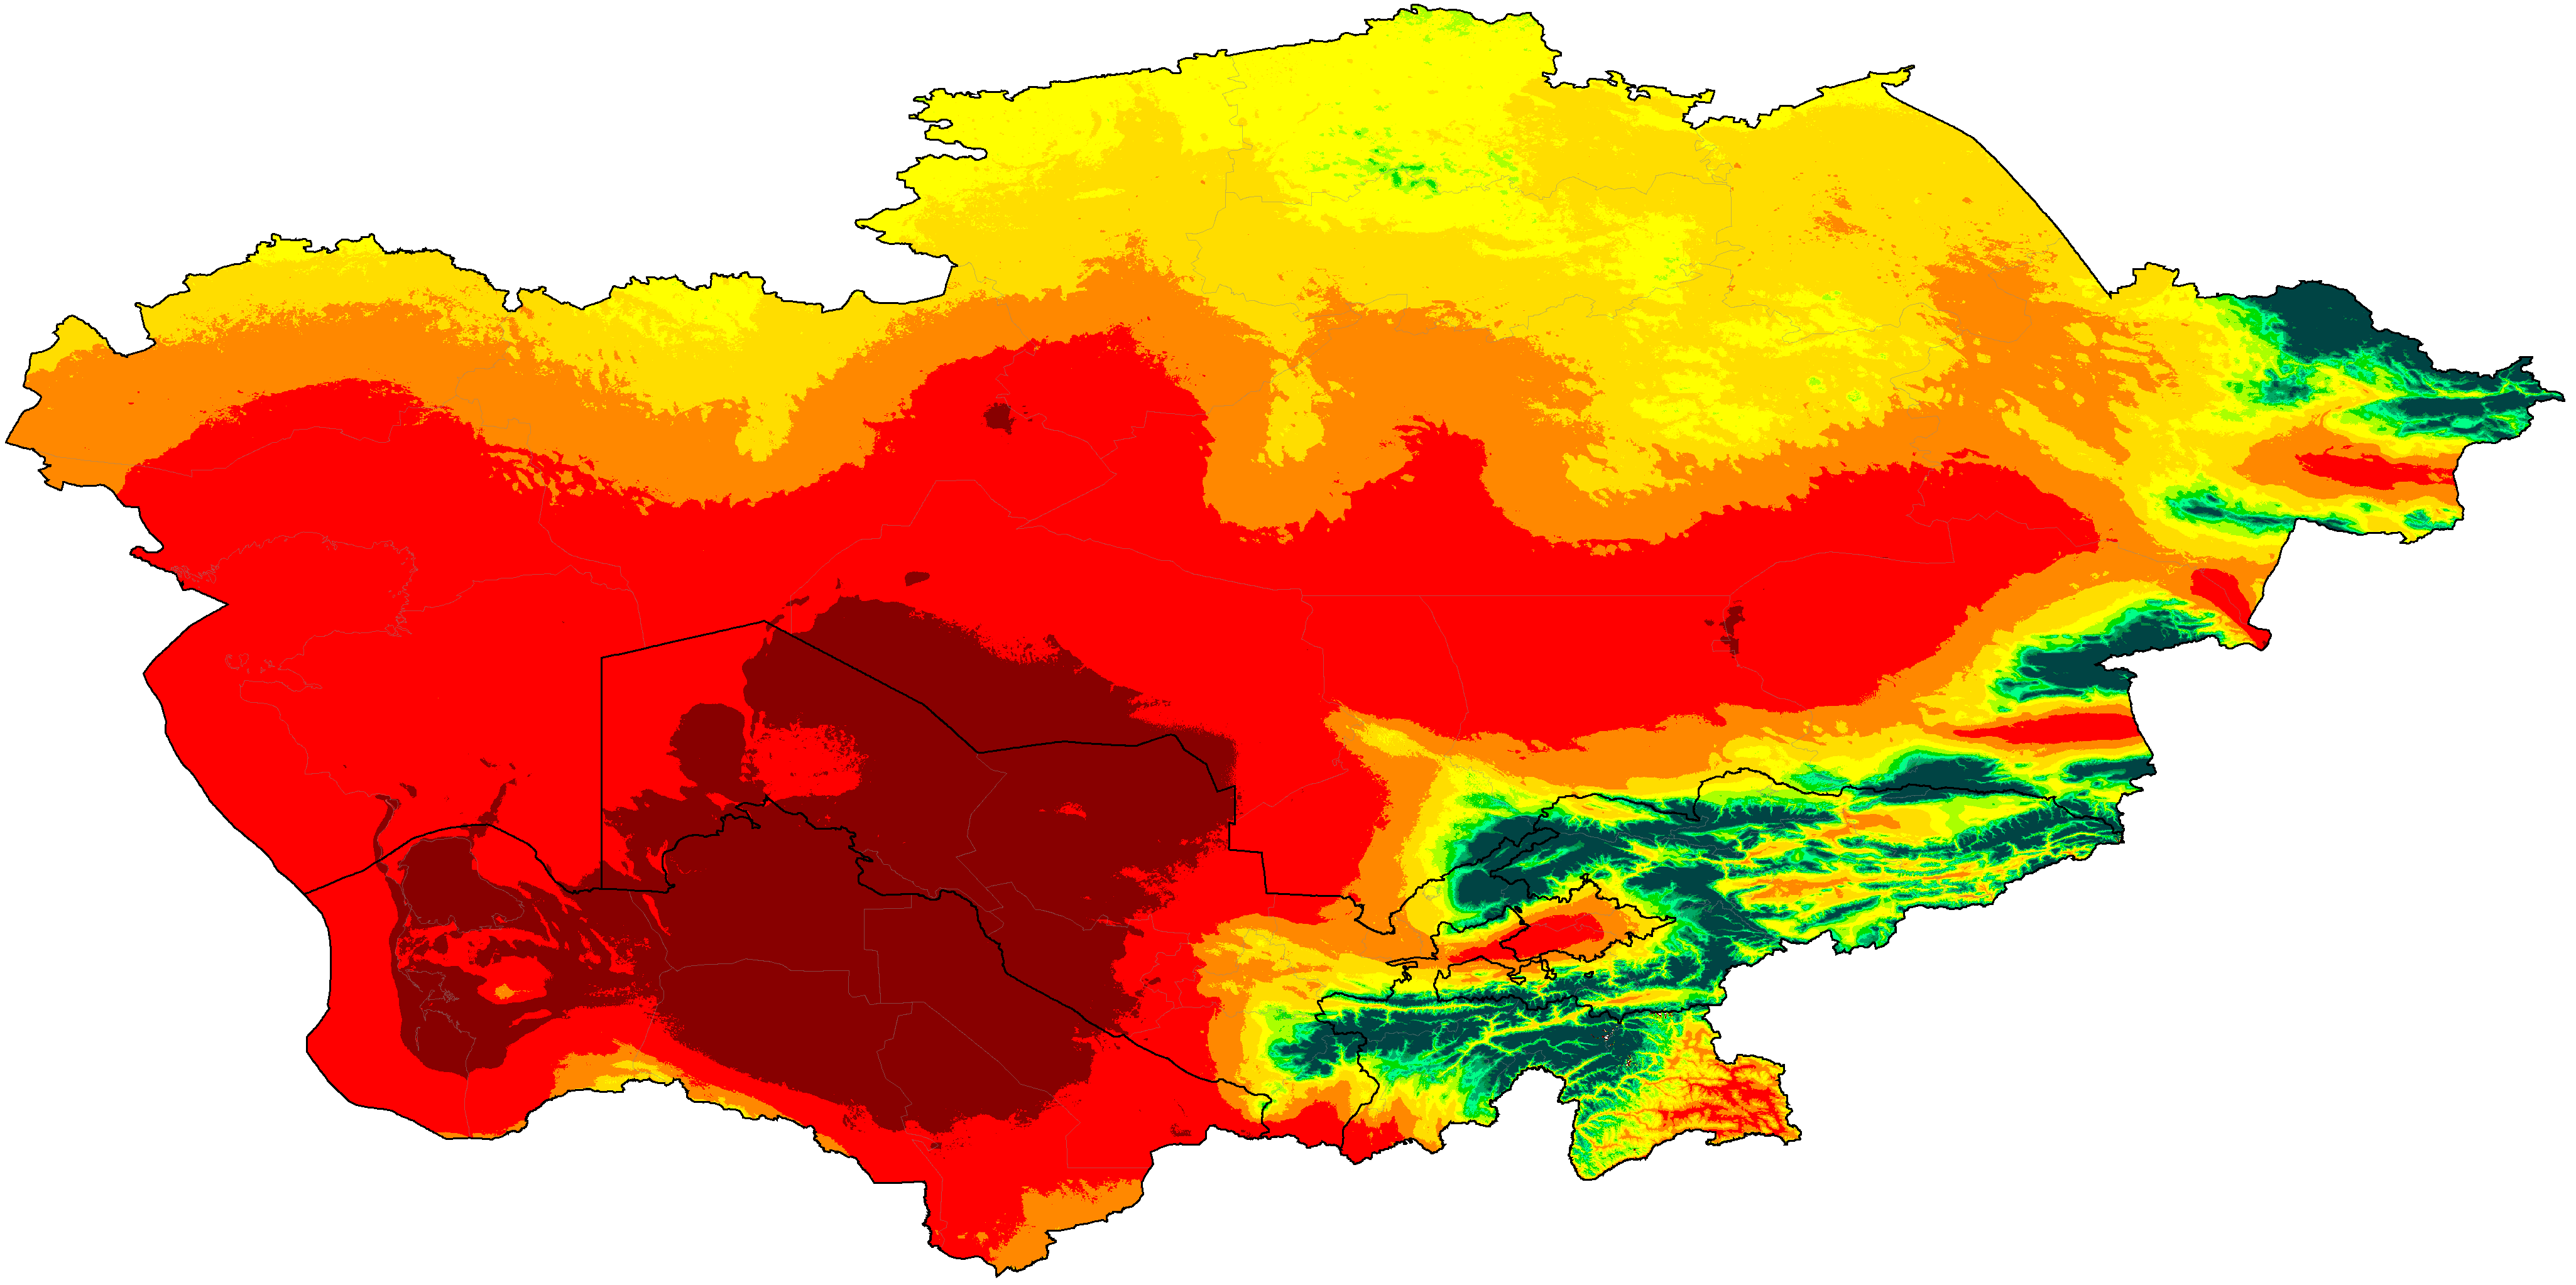
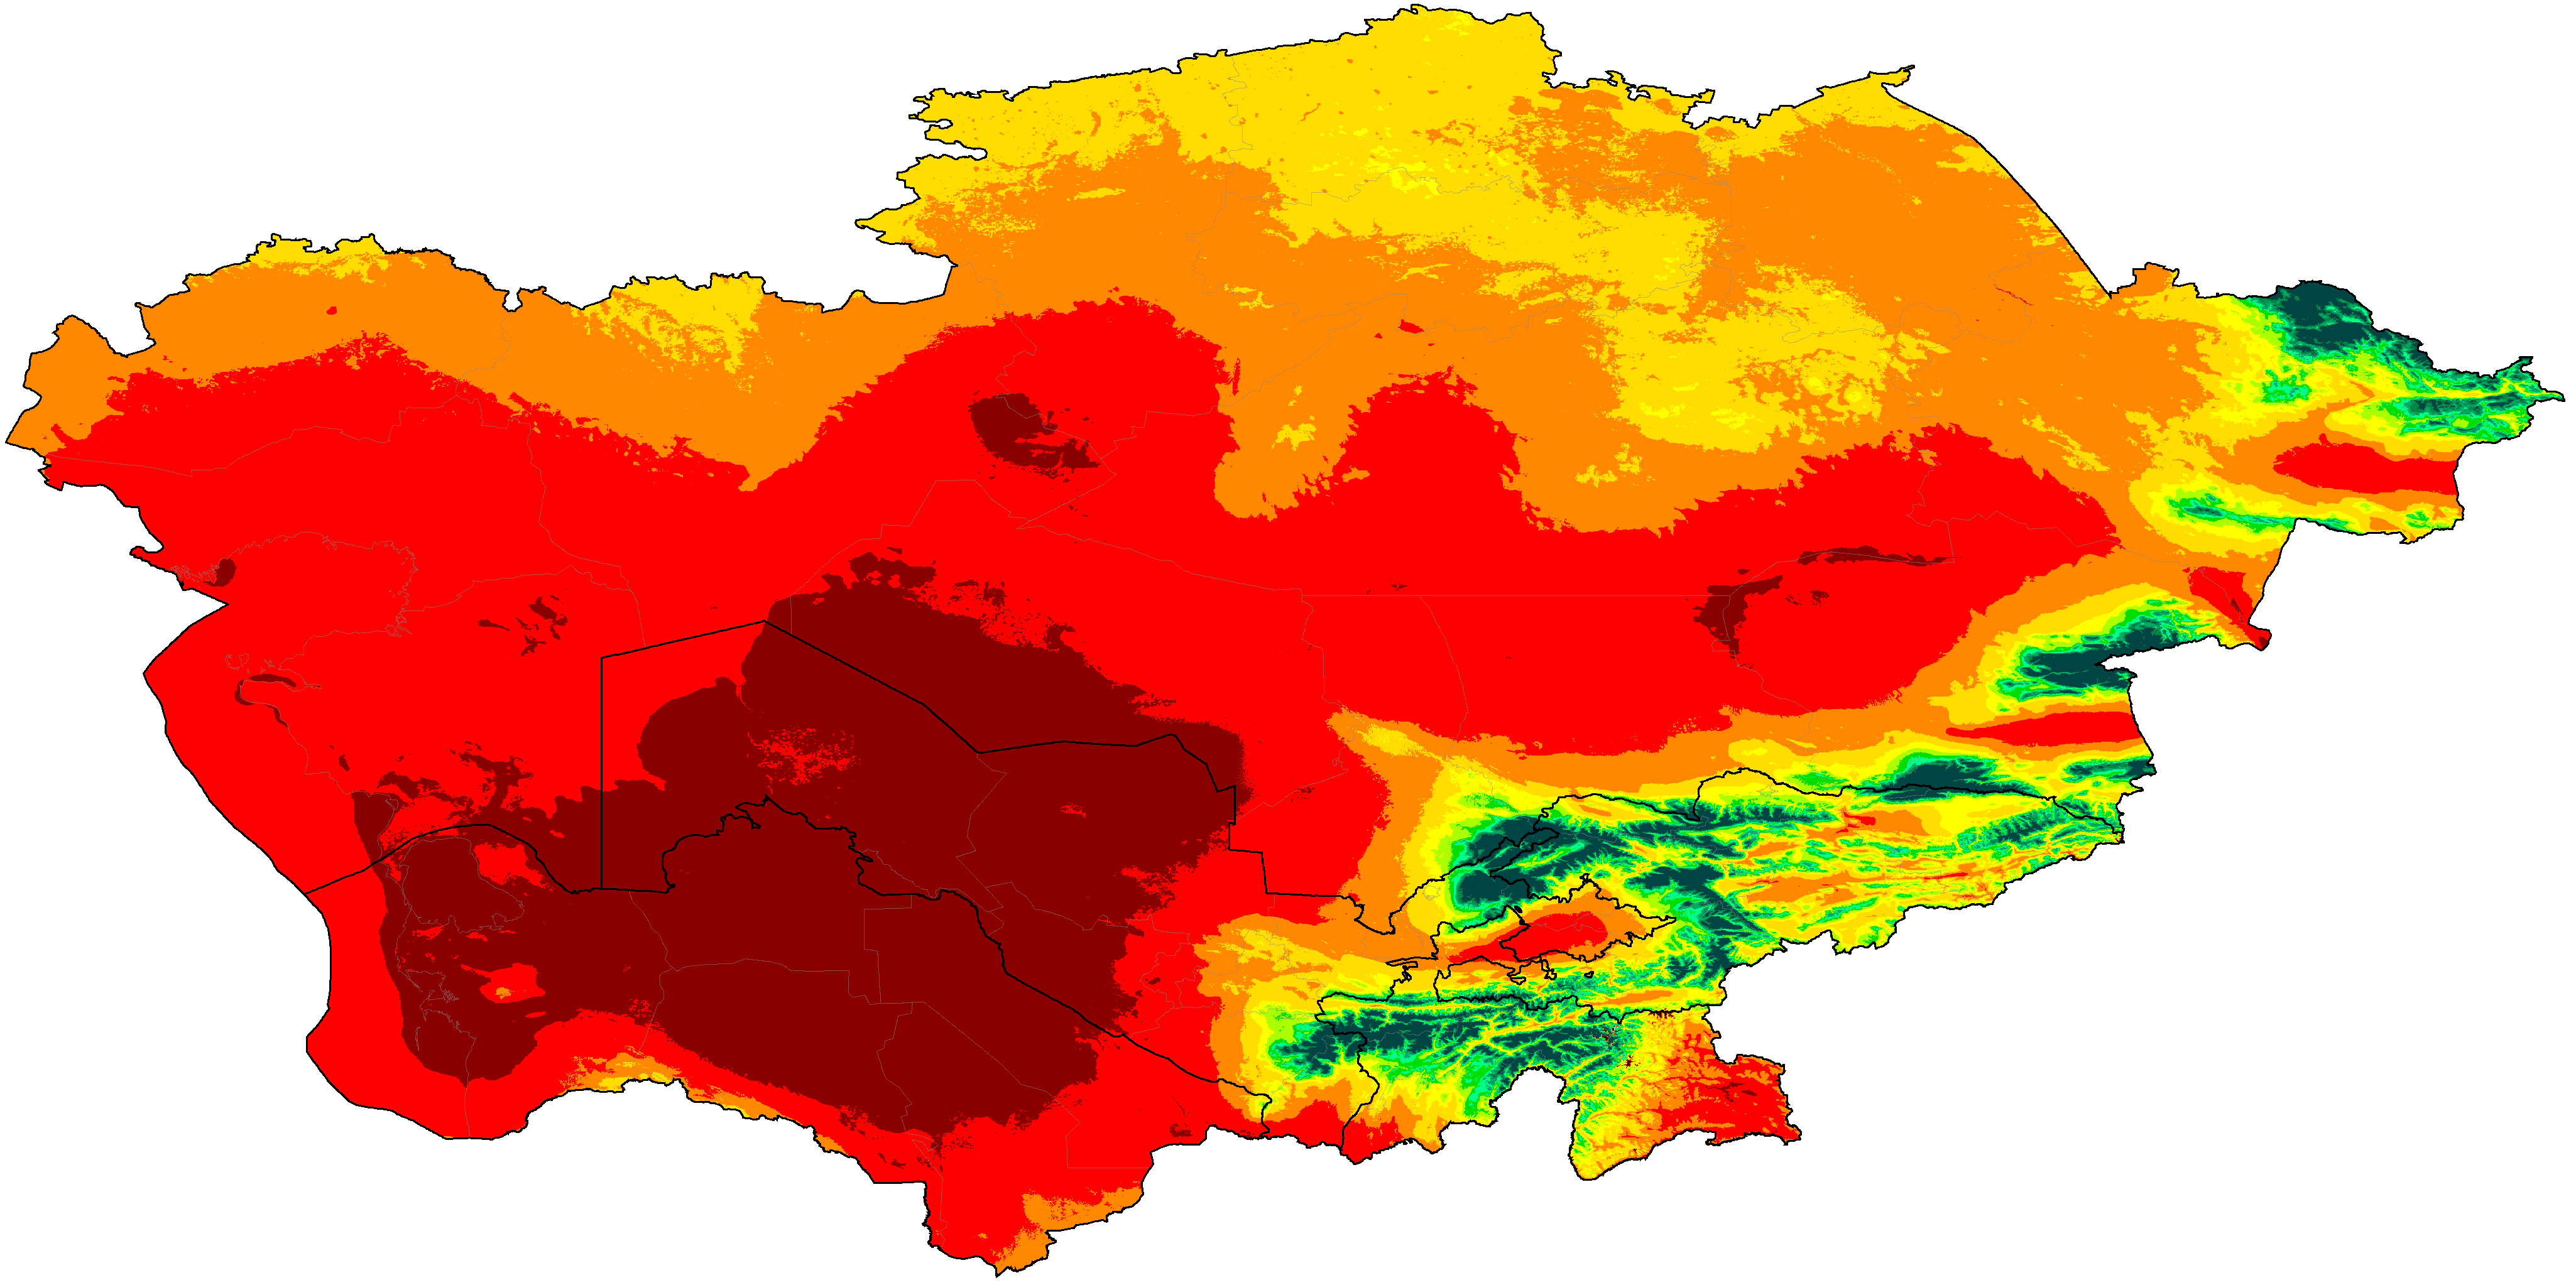
Central Asia distribution of summer categories (projections are SSP5-8.5 high emissions normals)
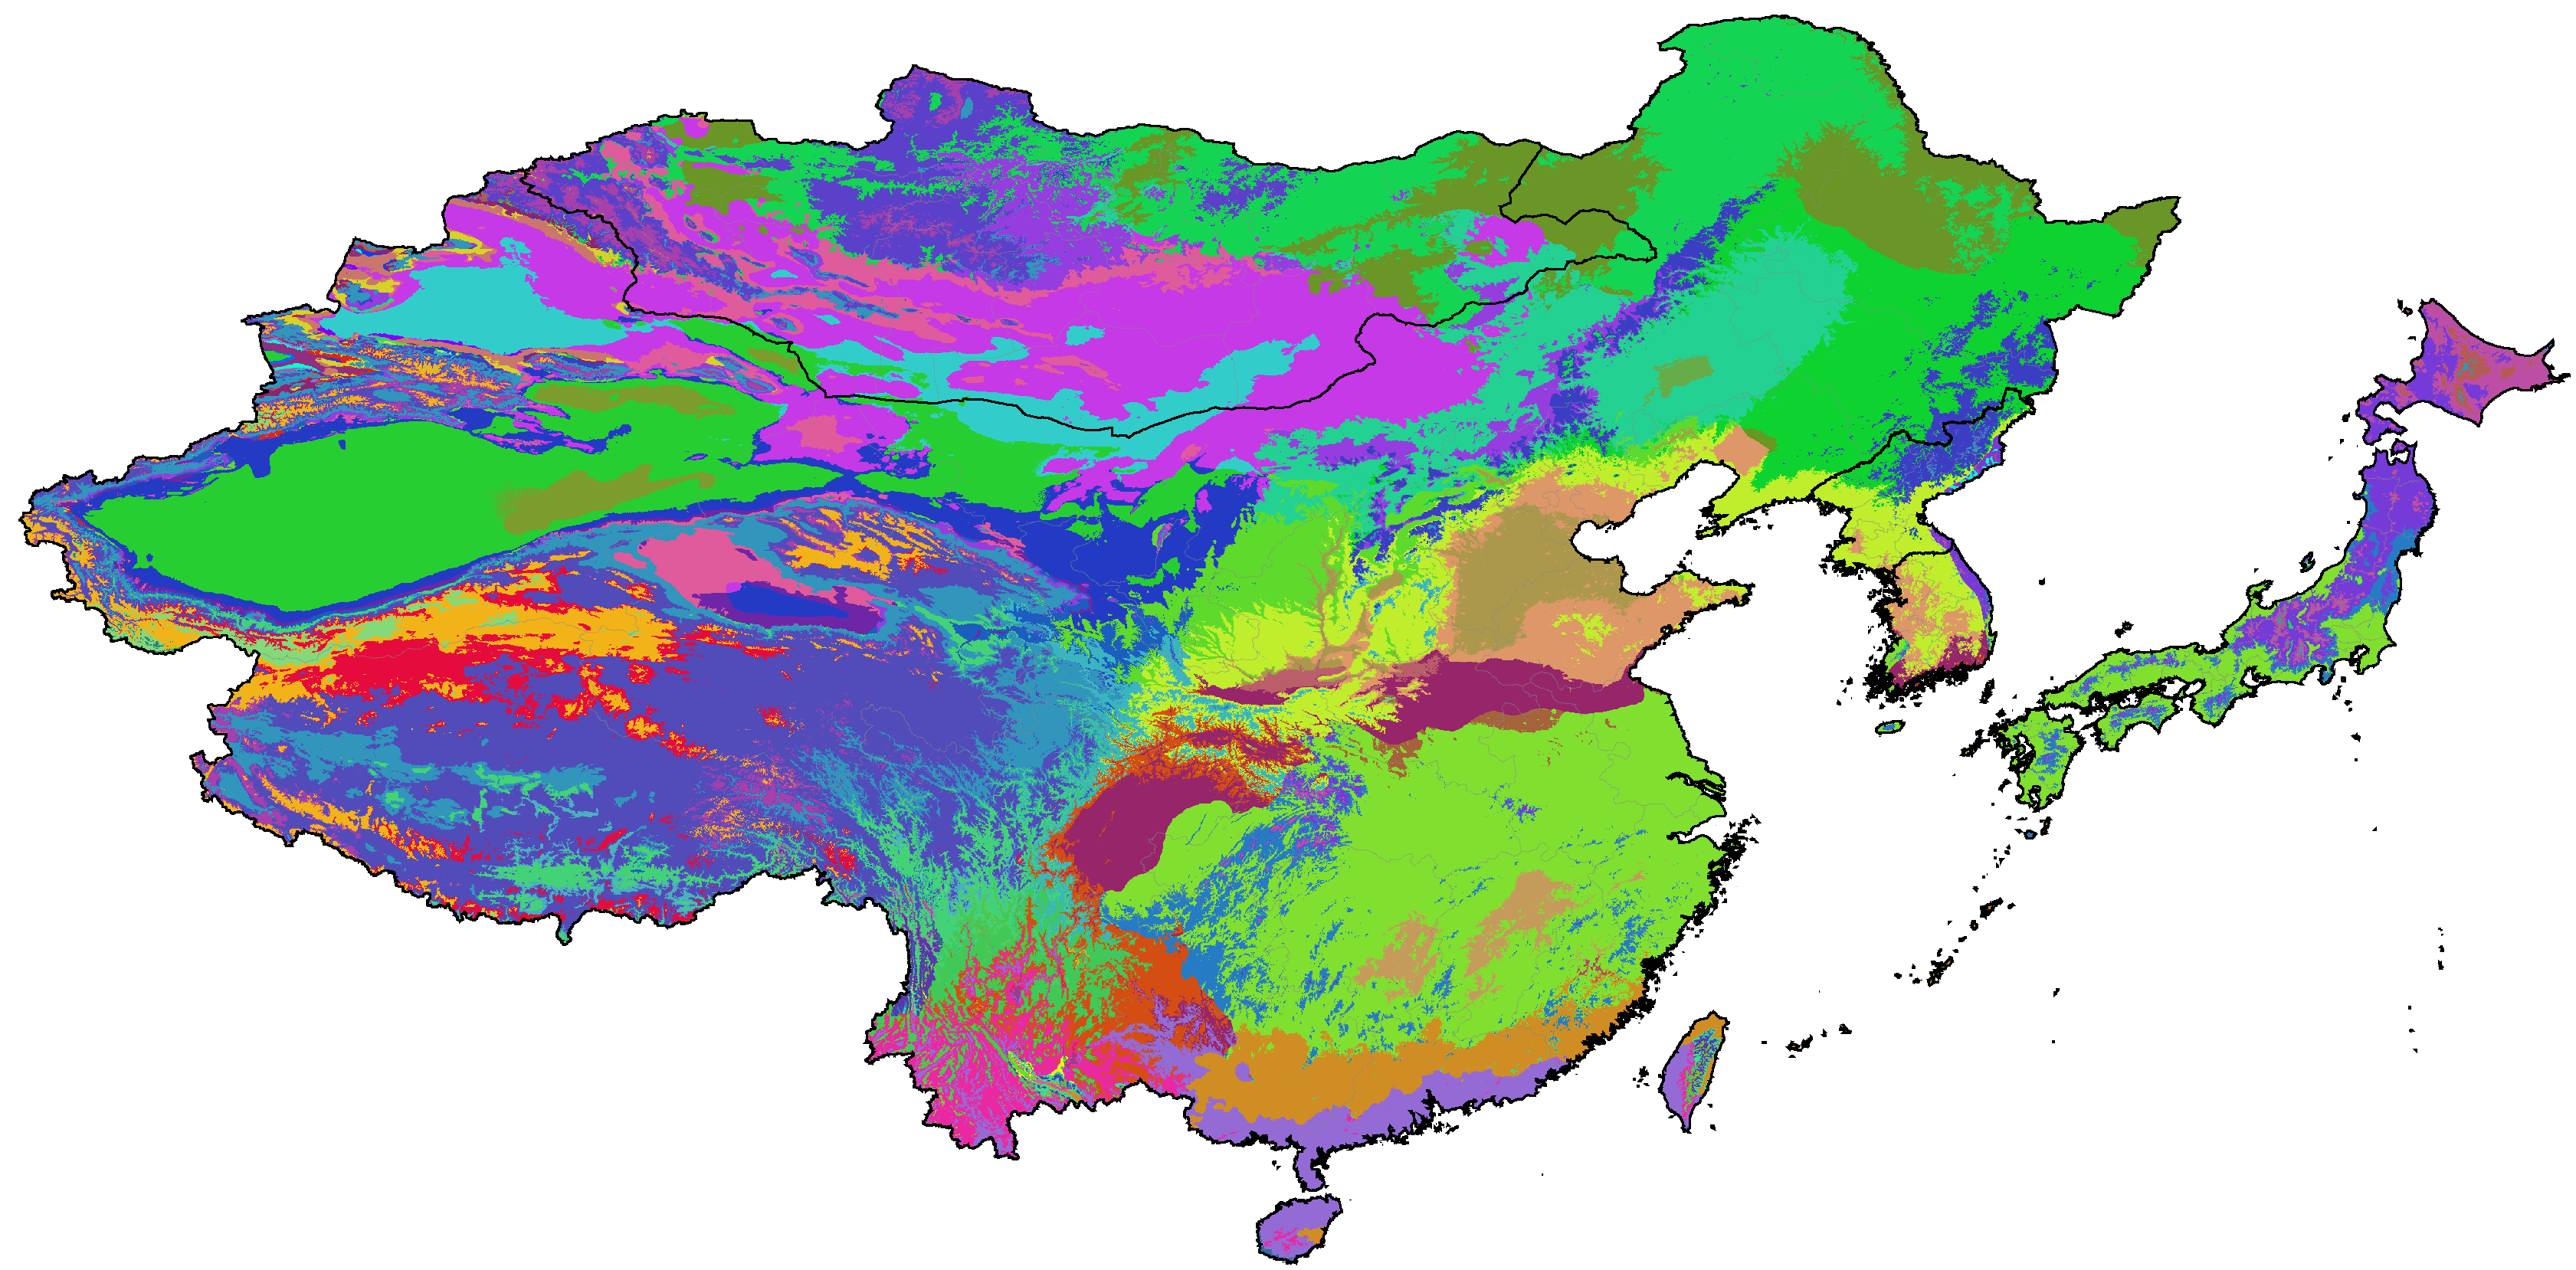
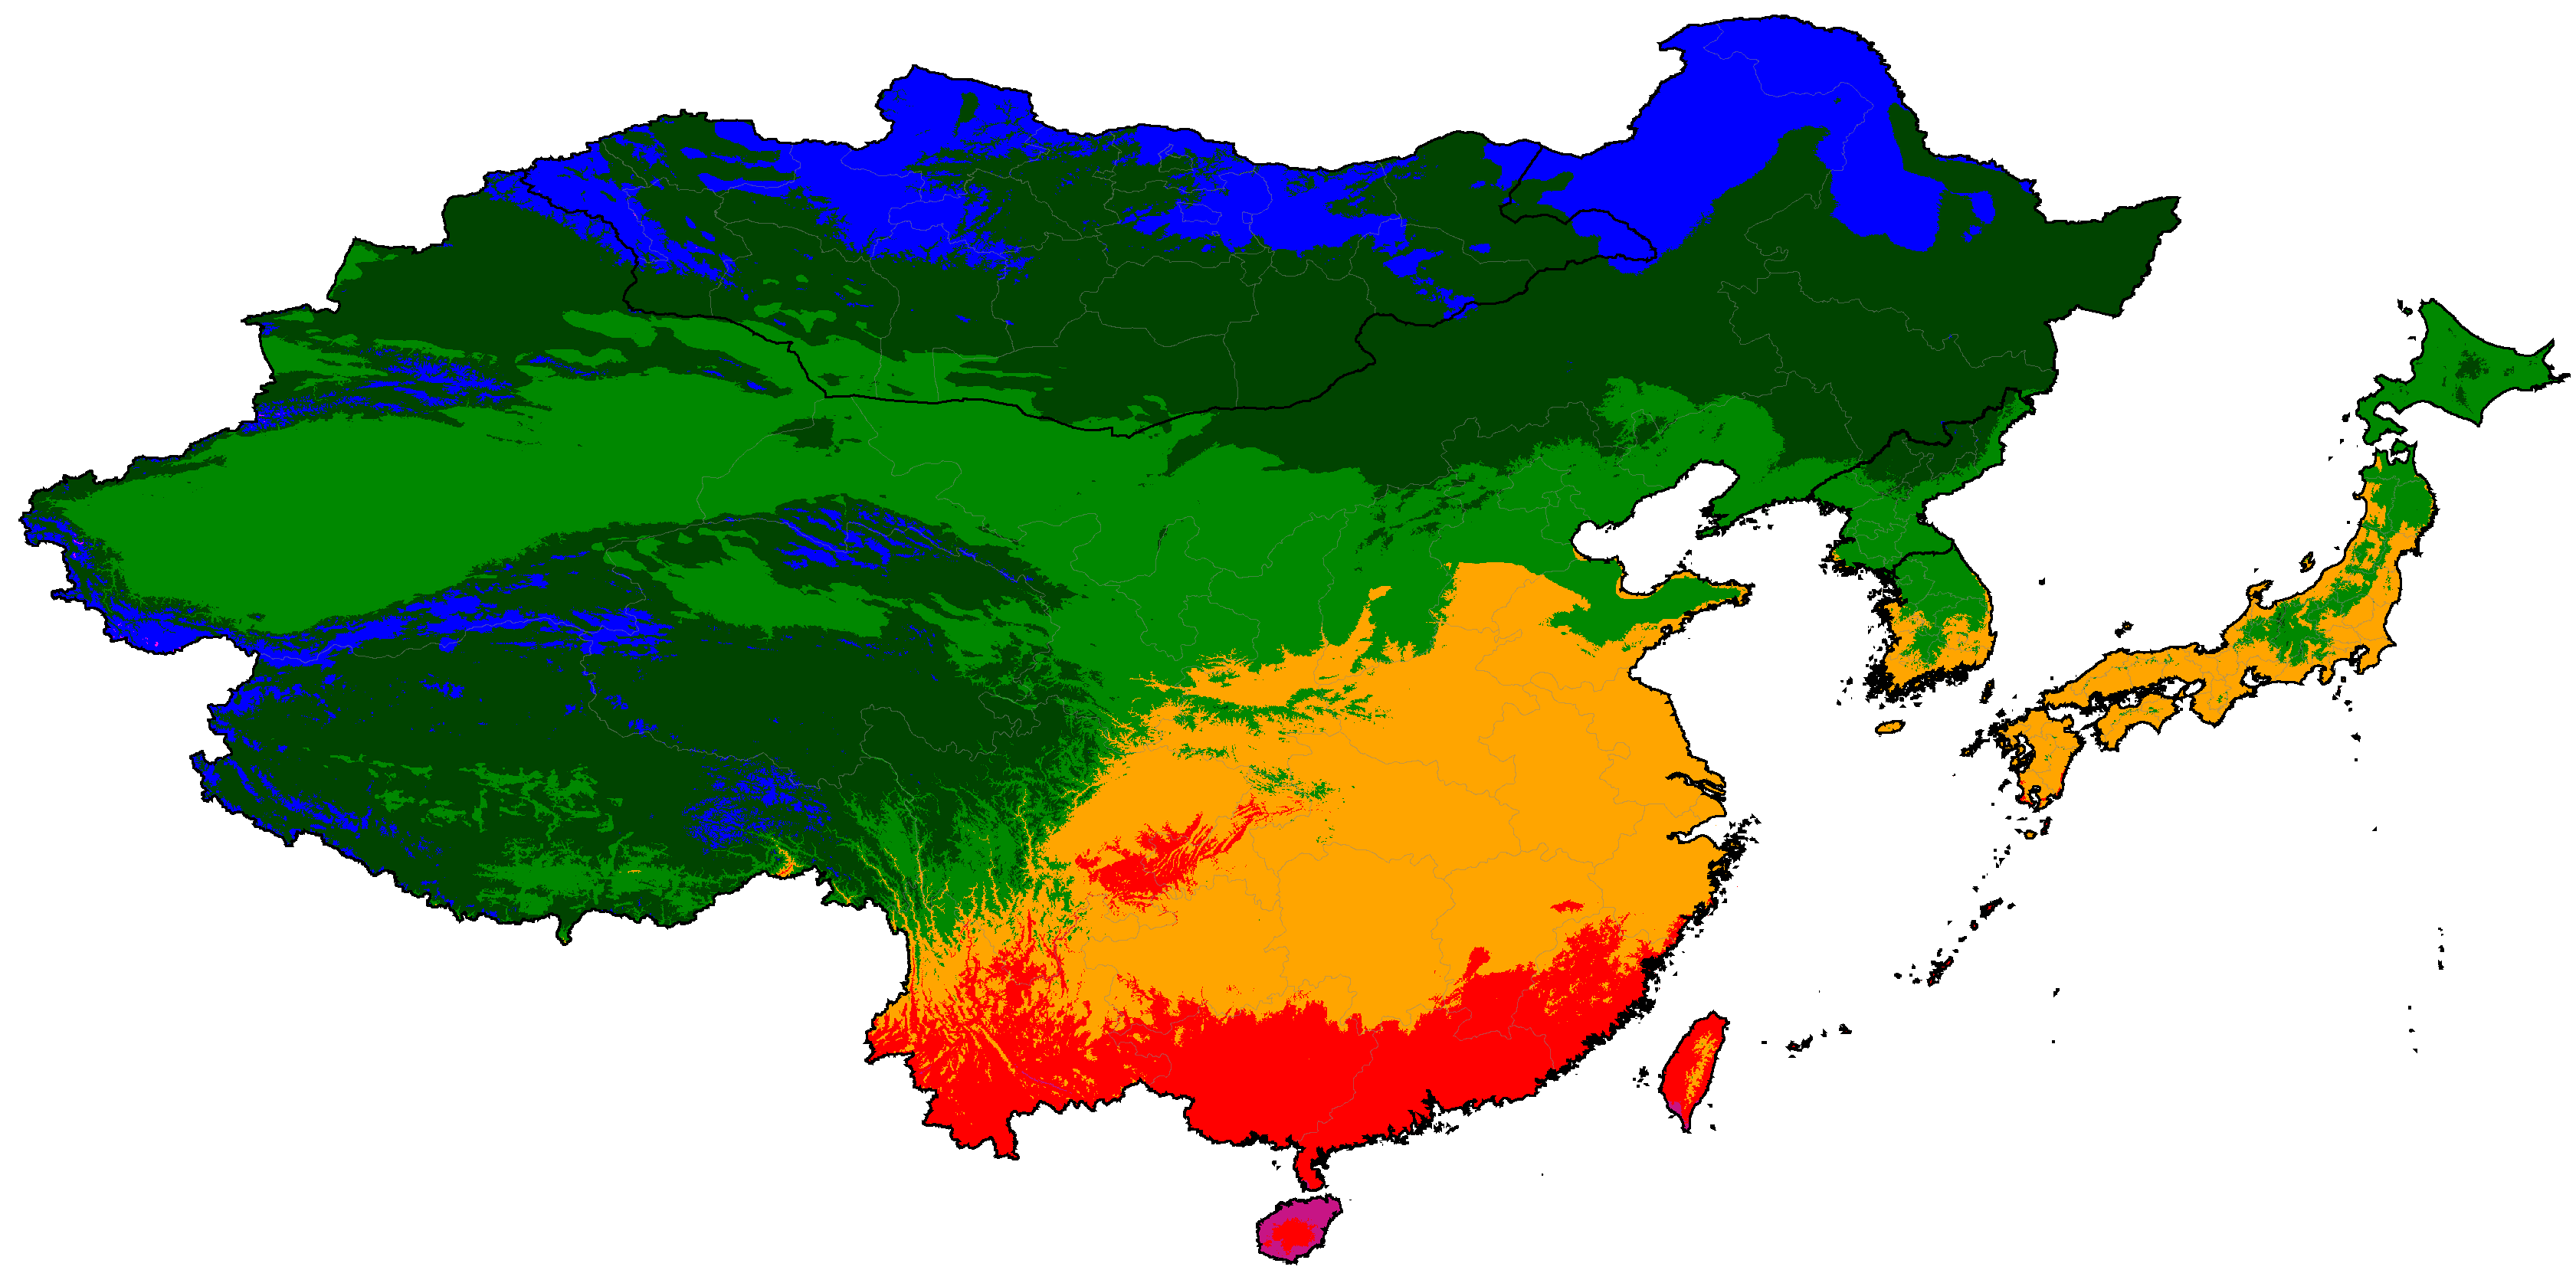
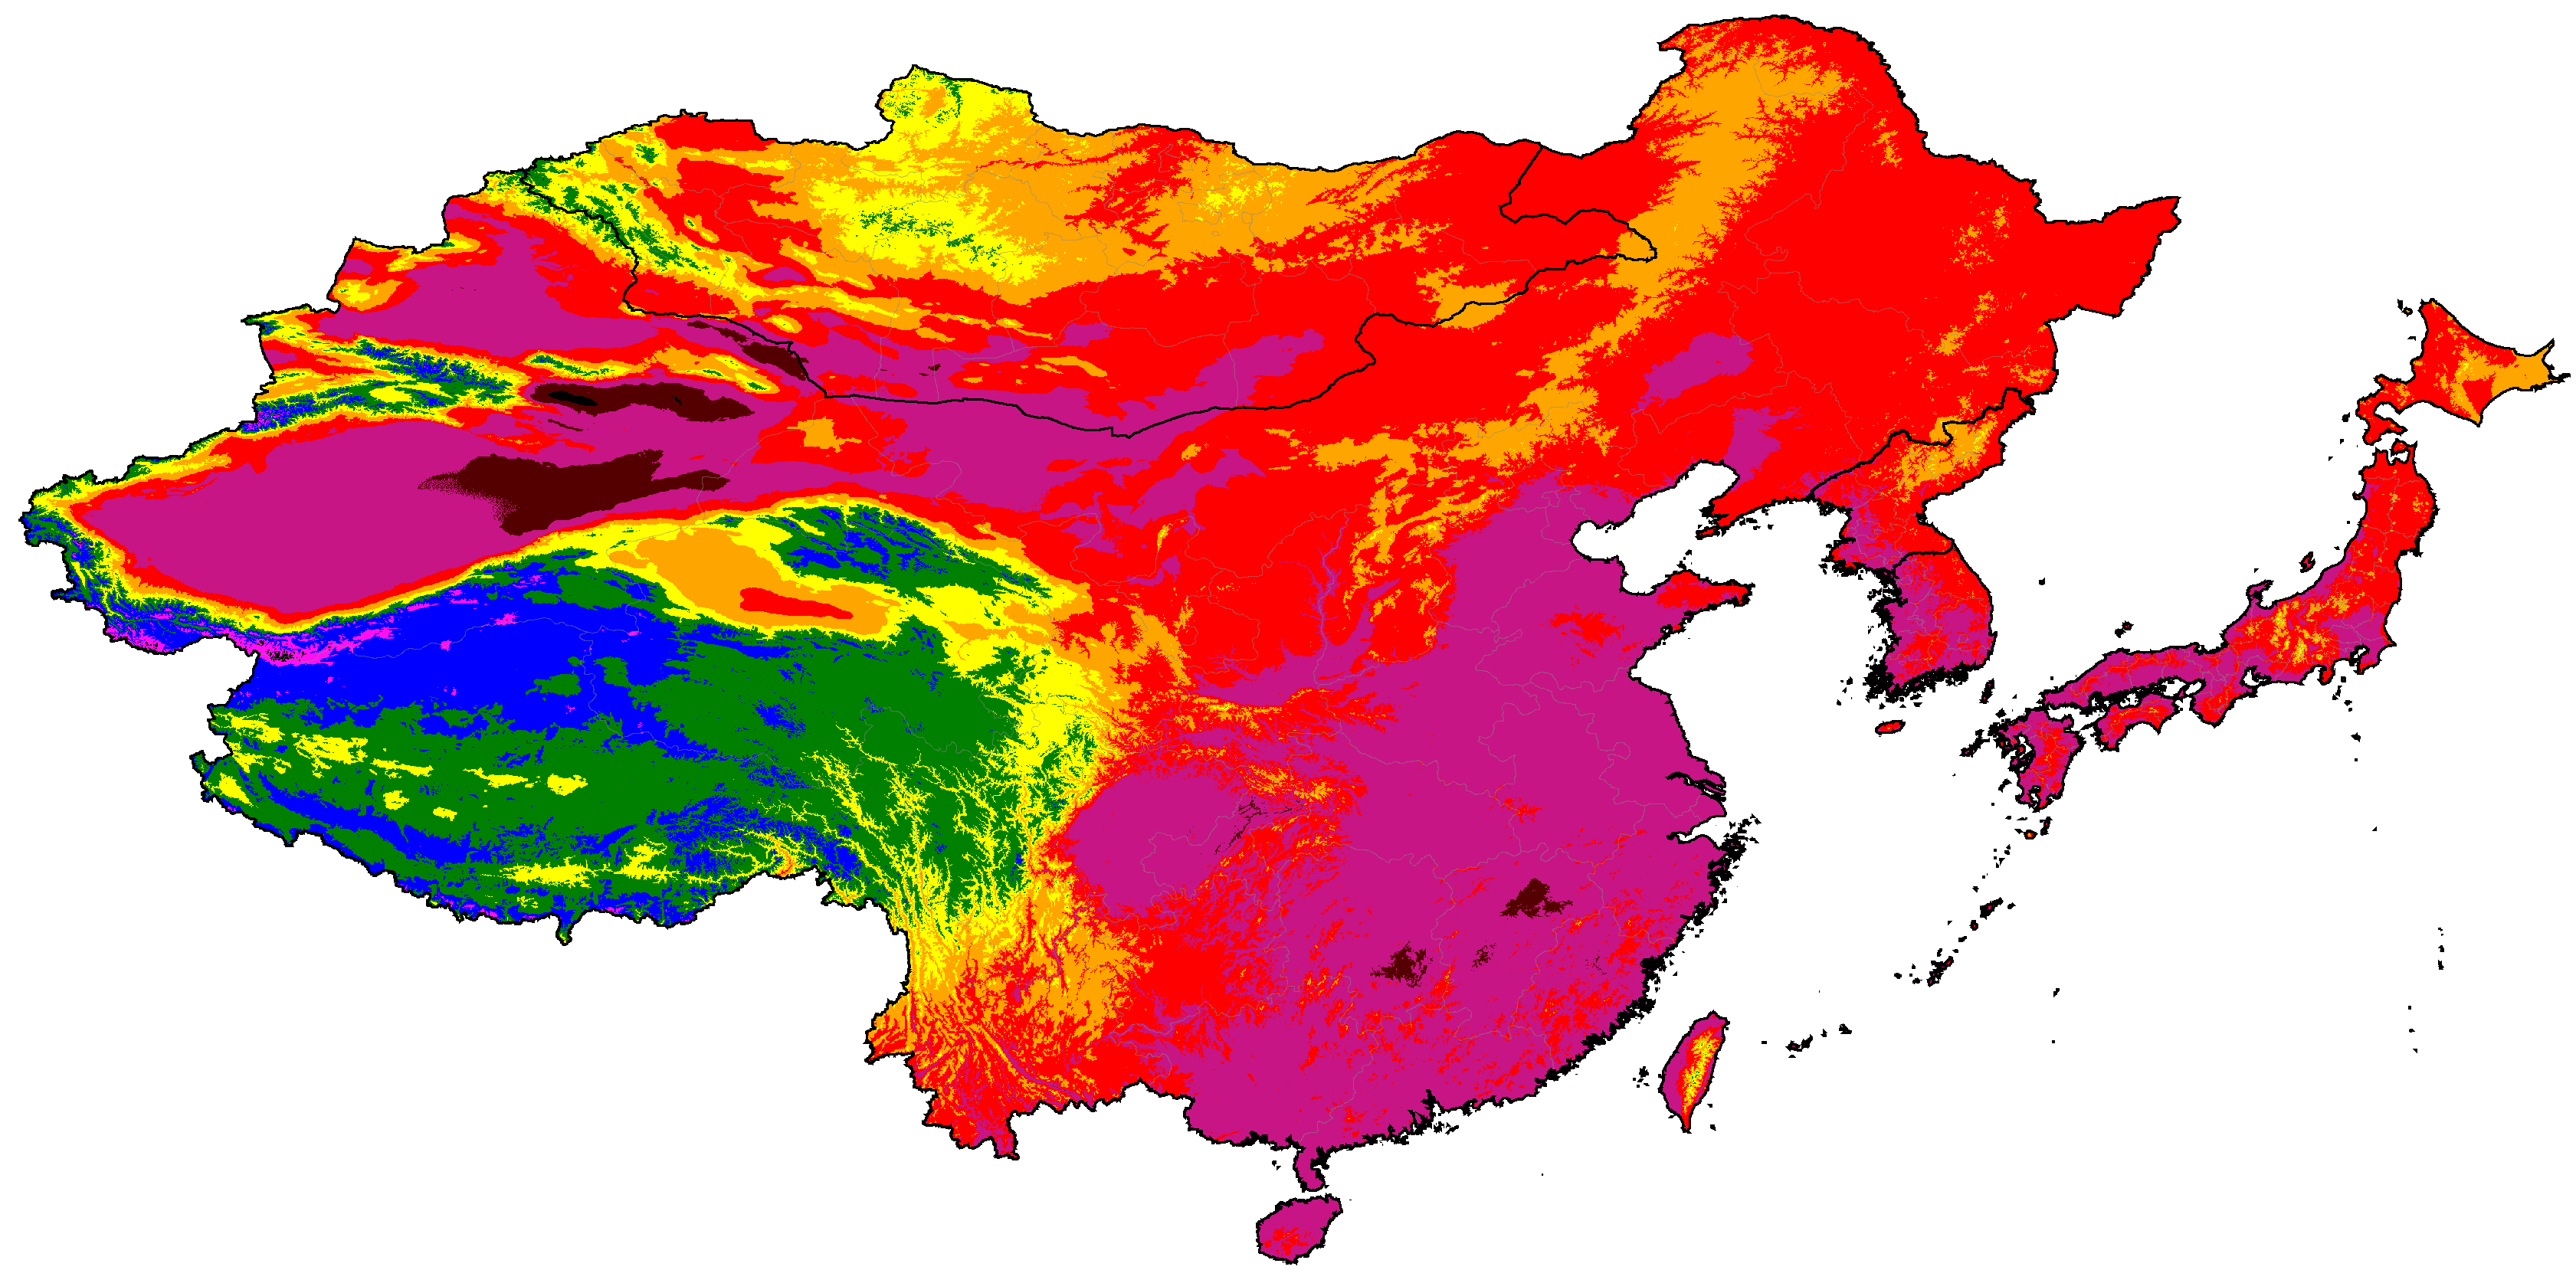
East Asia distribution of summer categories (projections are SSP5-8.5 high emissions normals)
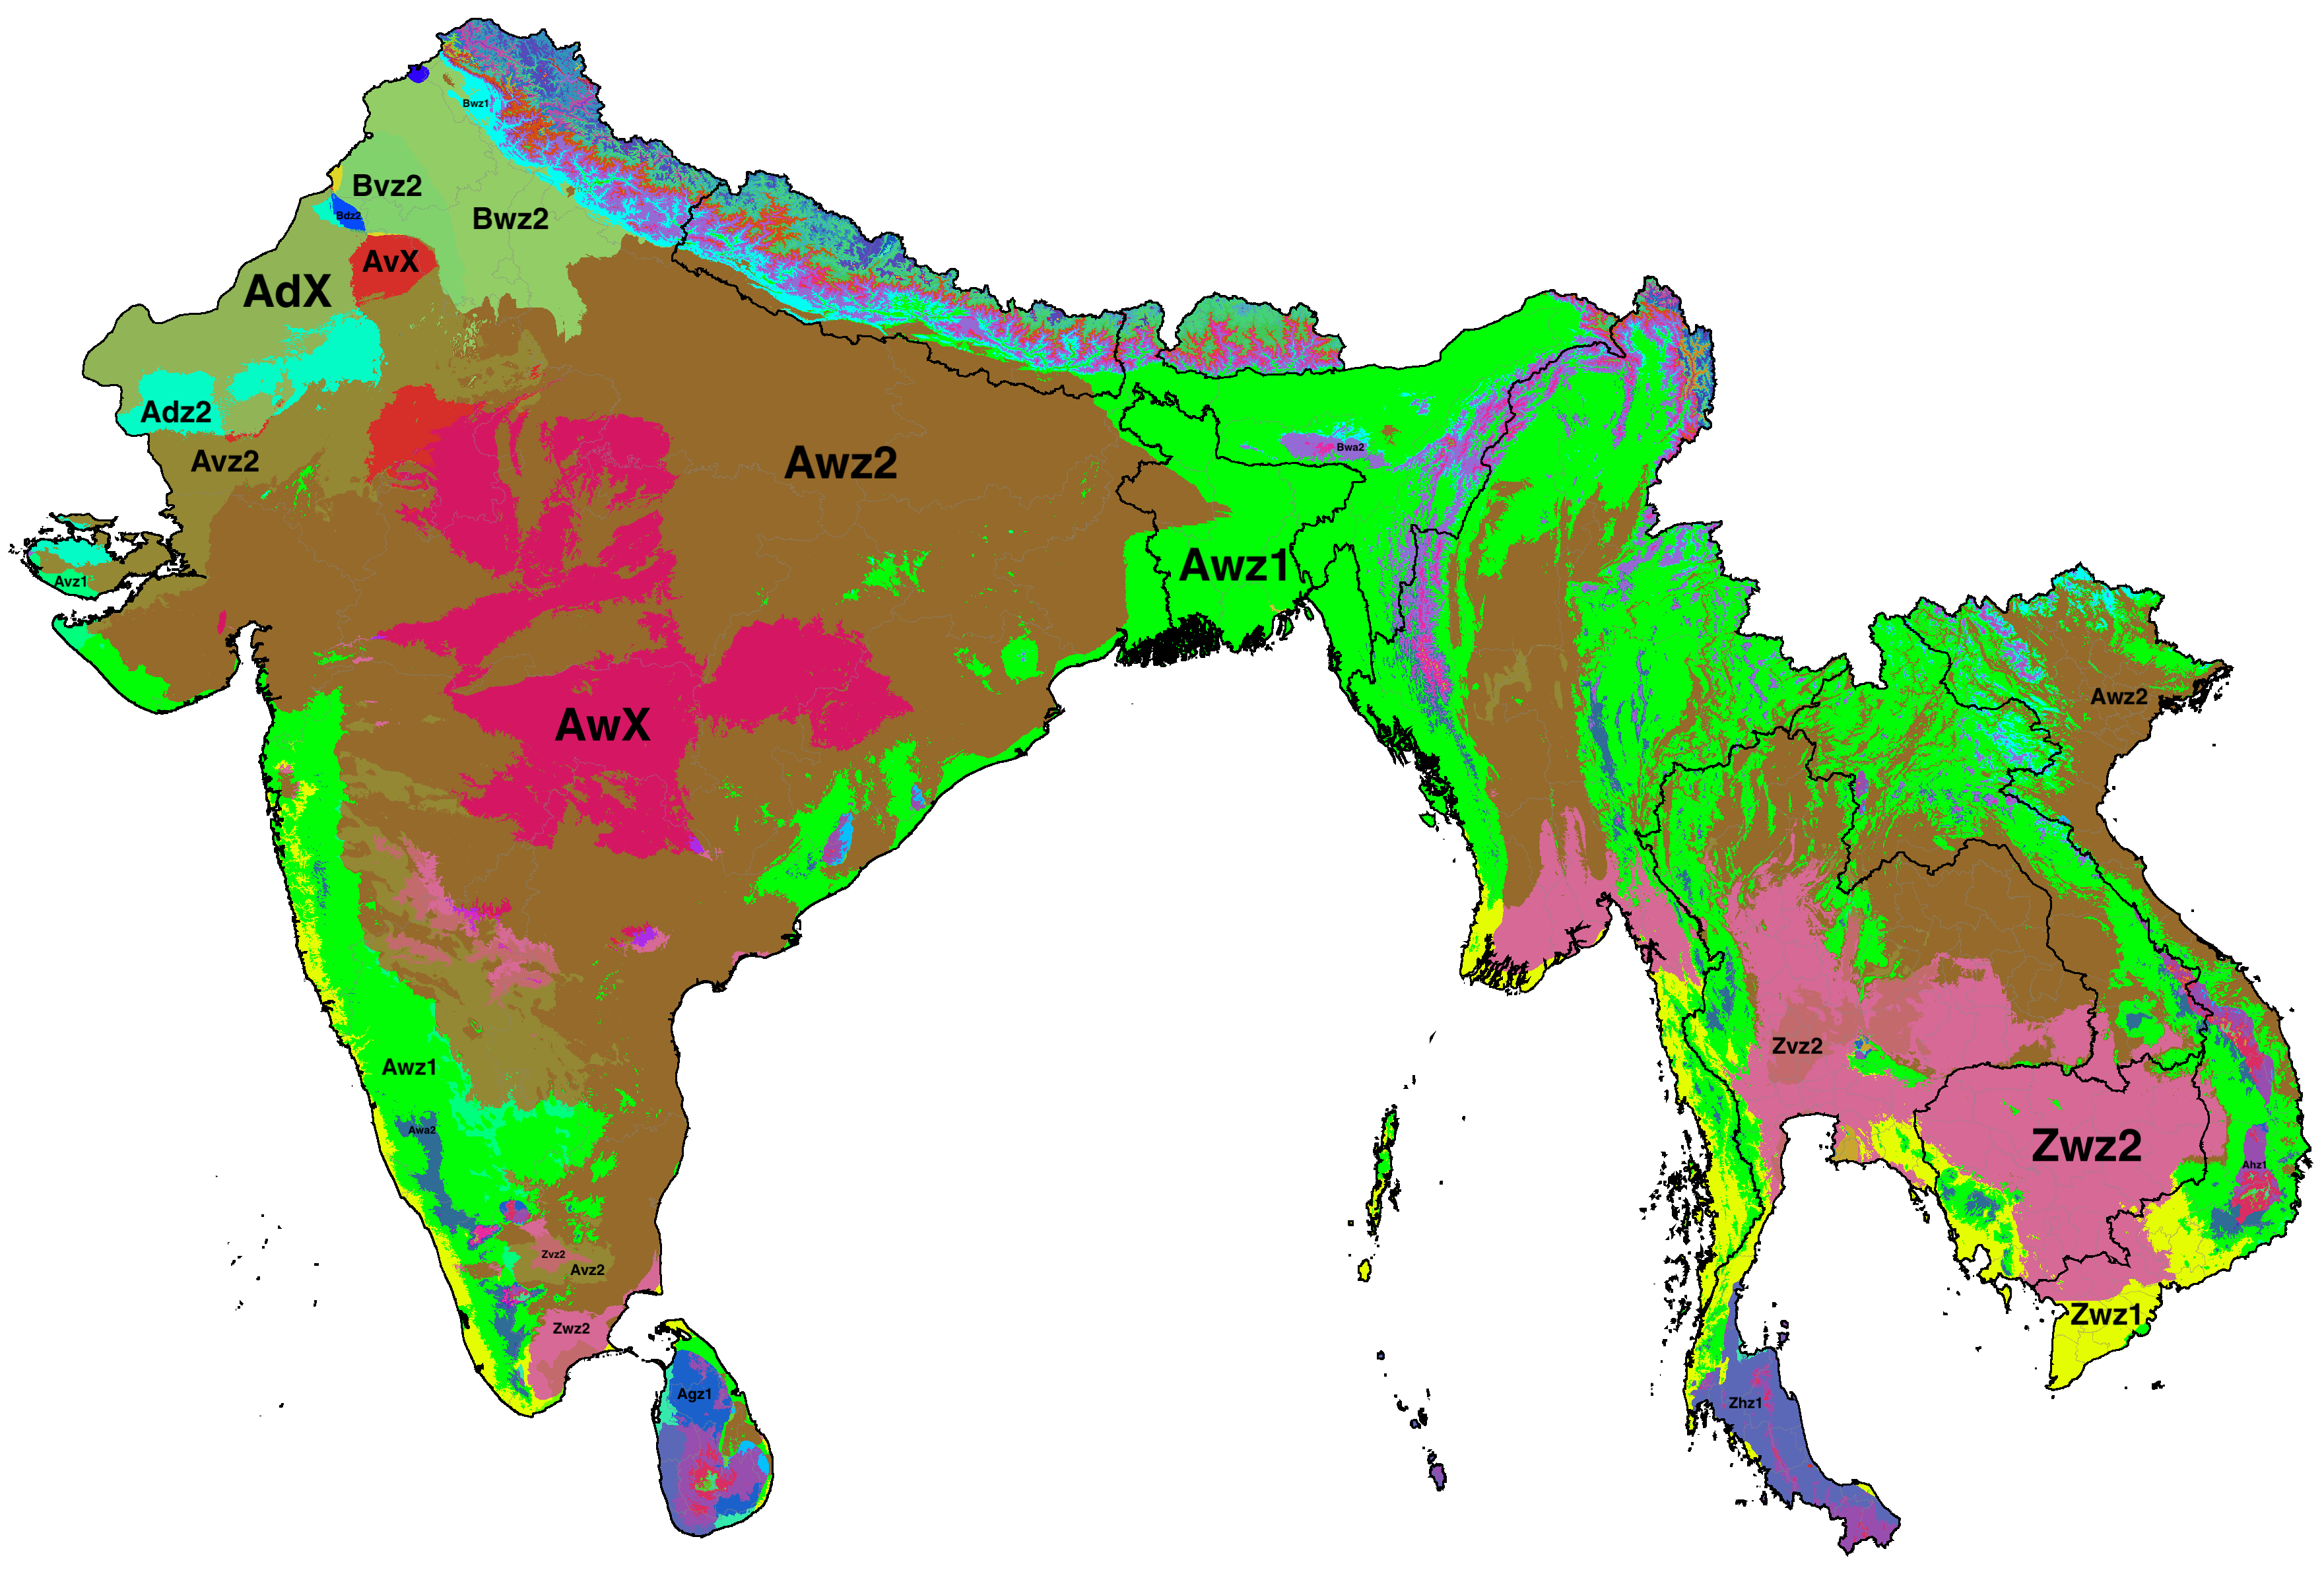
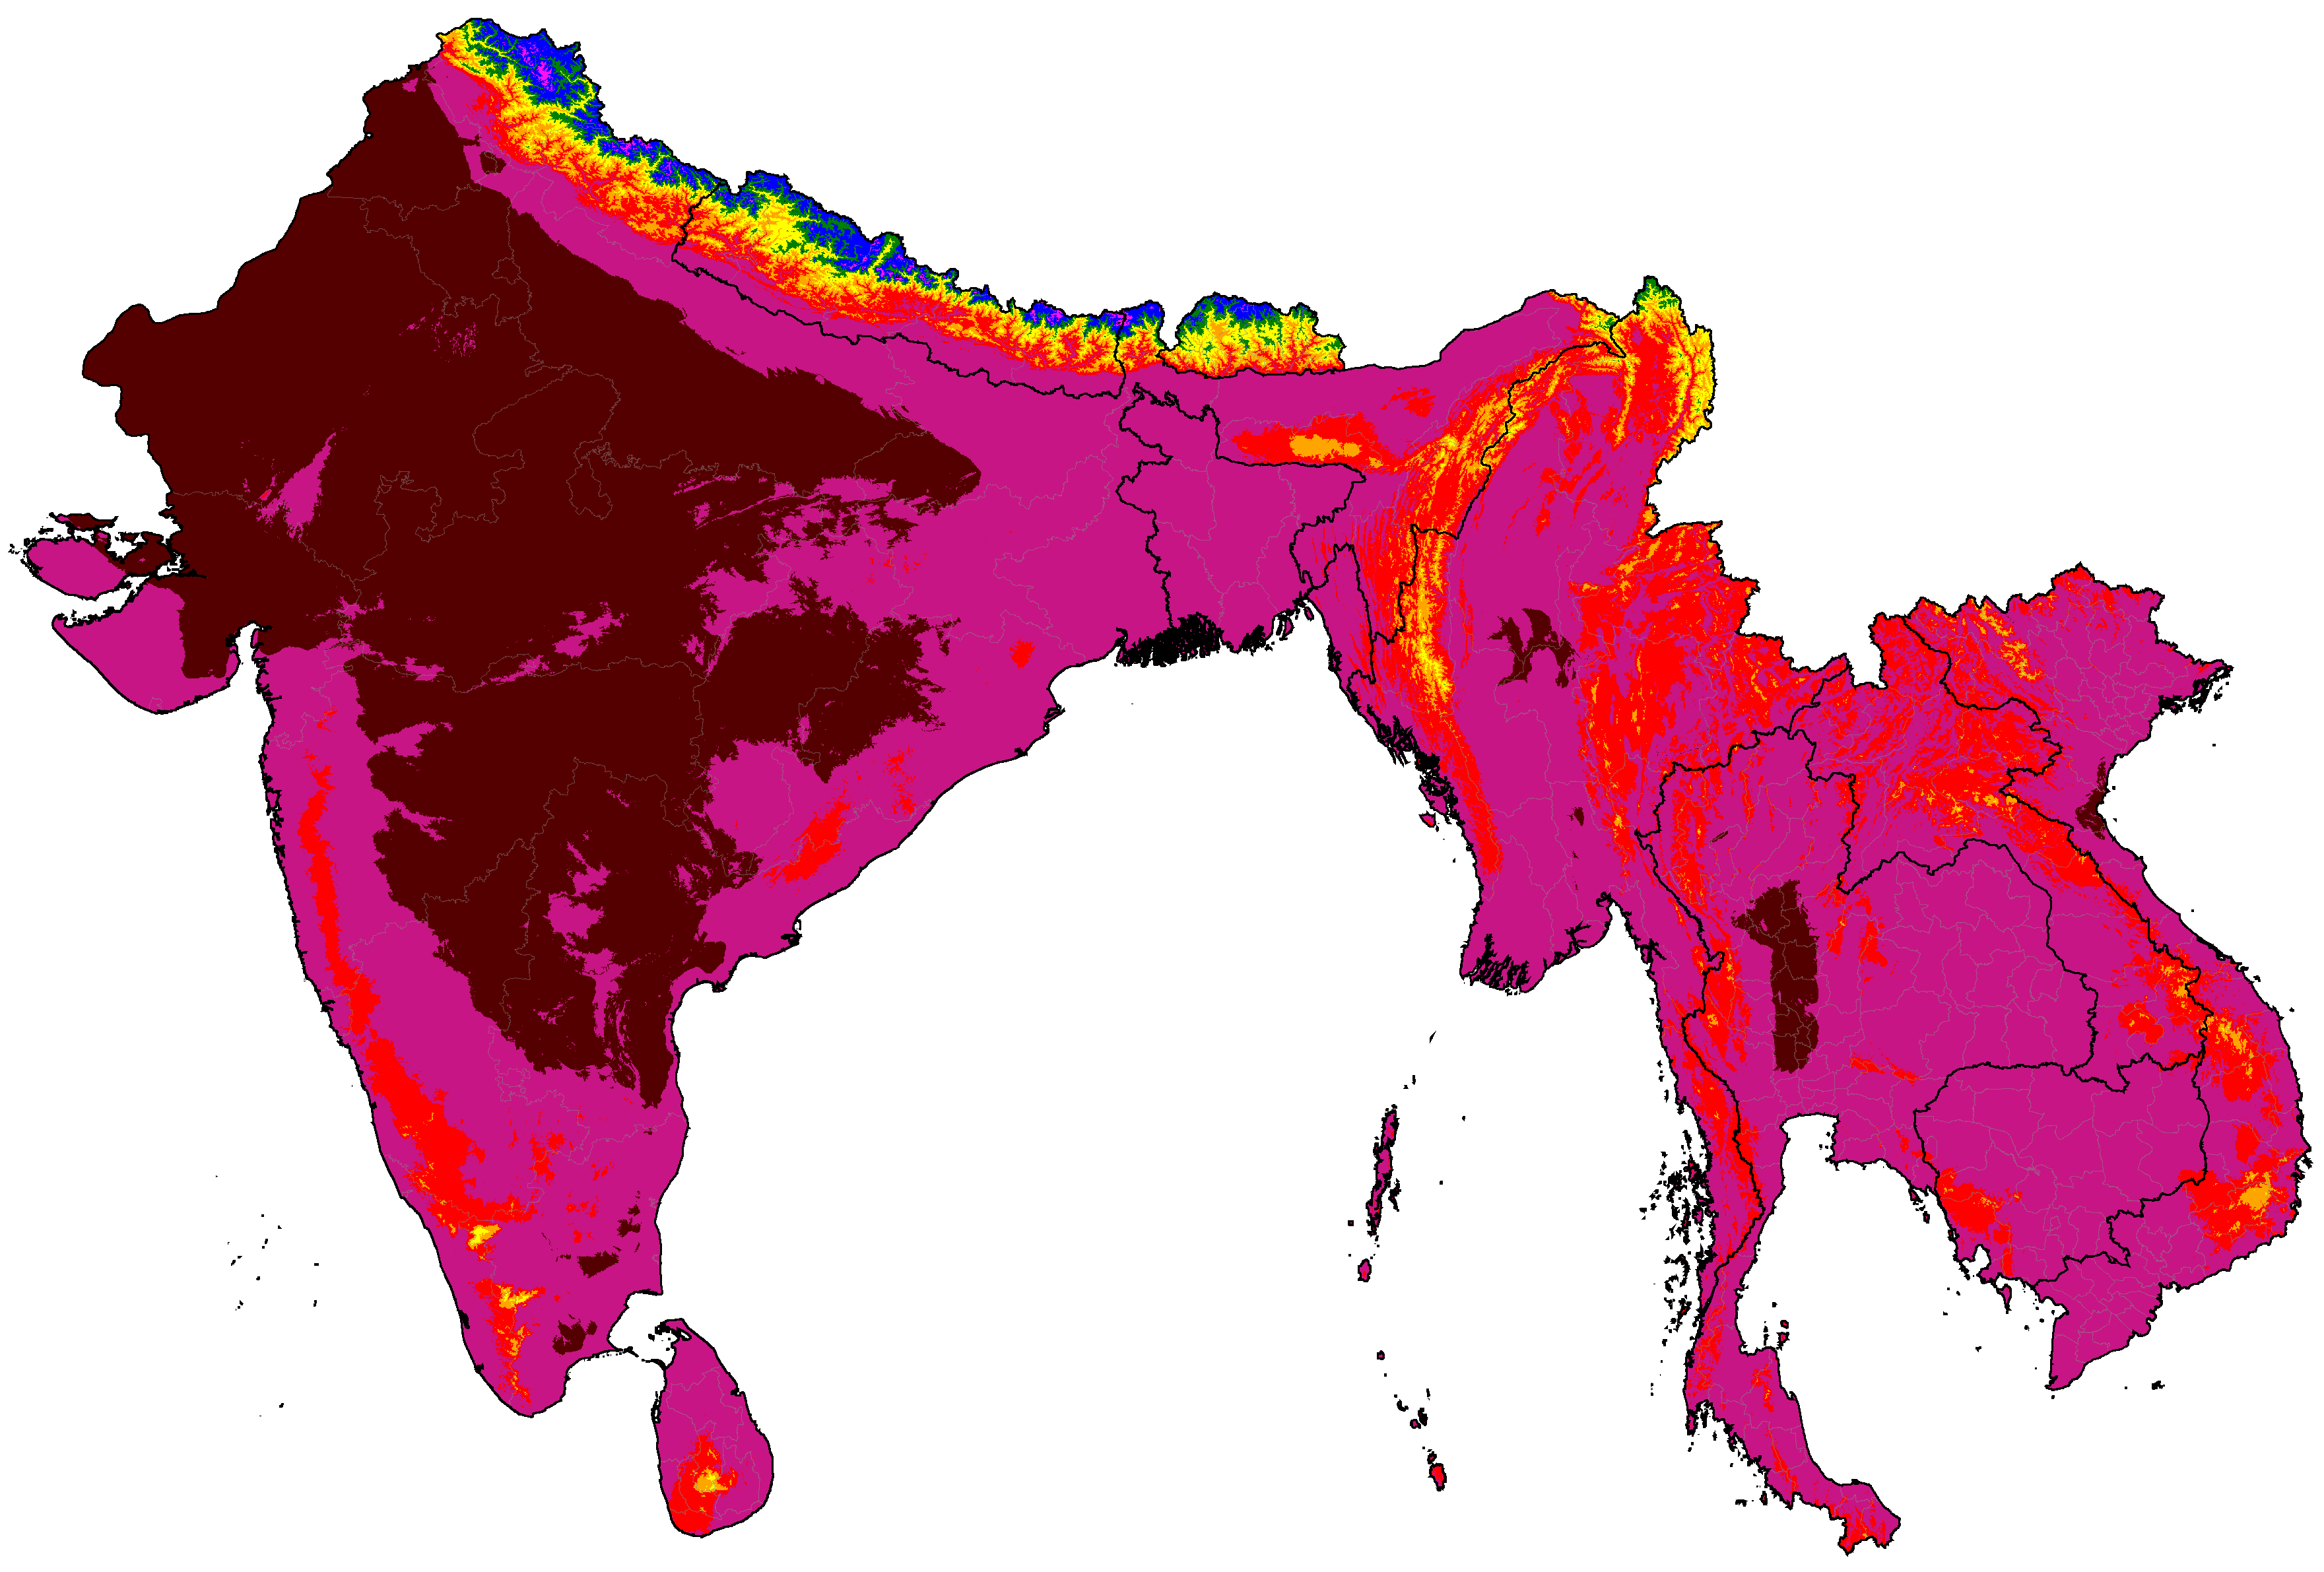
South Asia distribution of summer categories (projections are SSP5-8.5 high emissions normals)
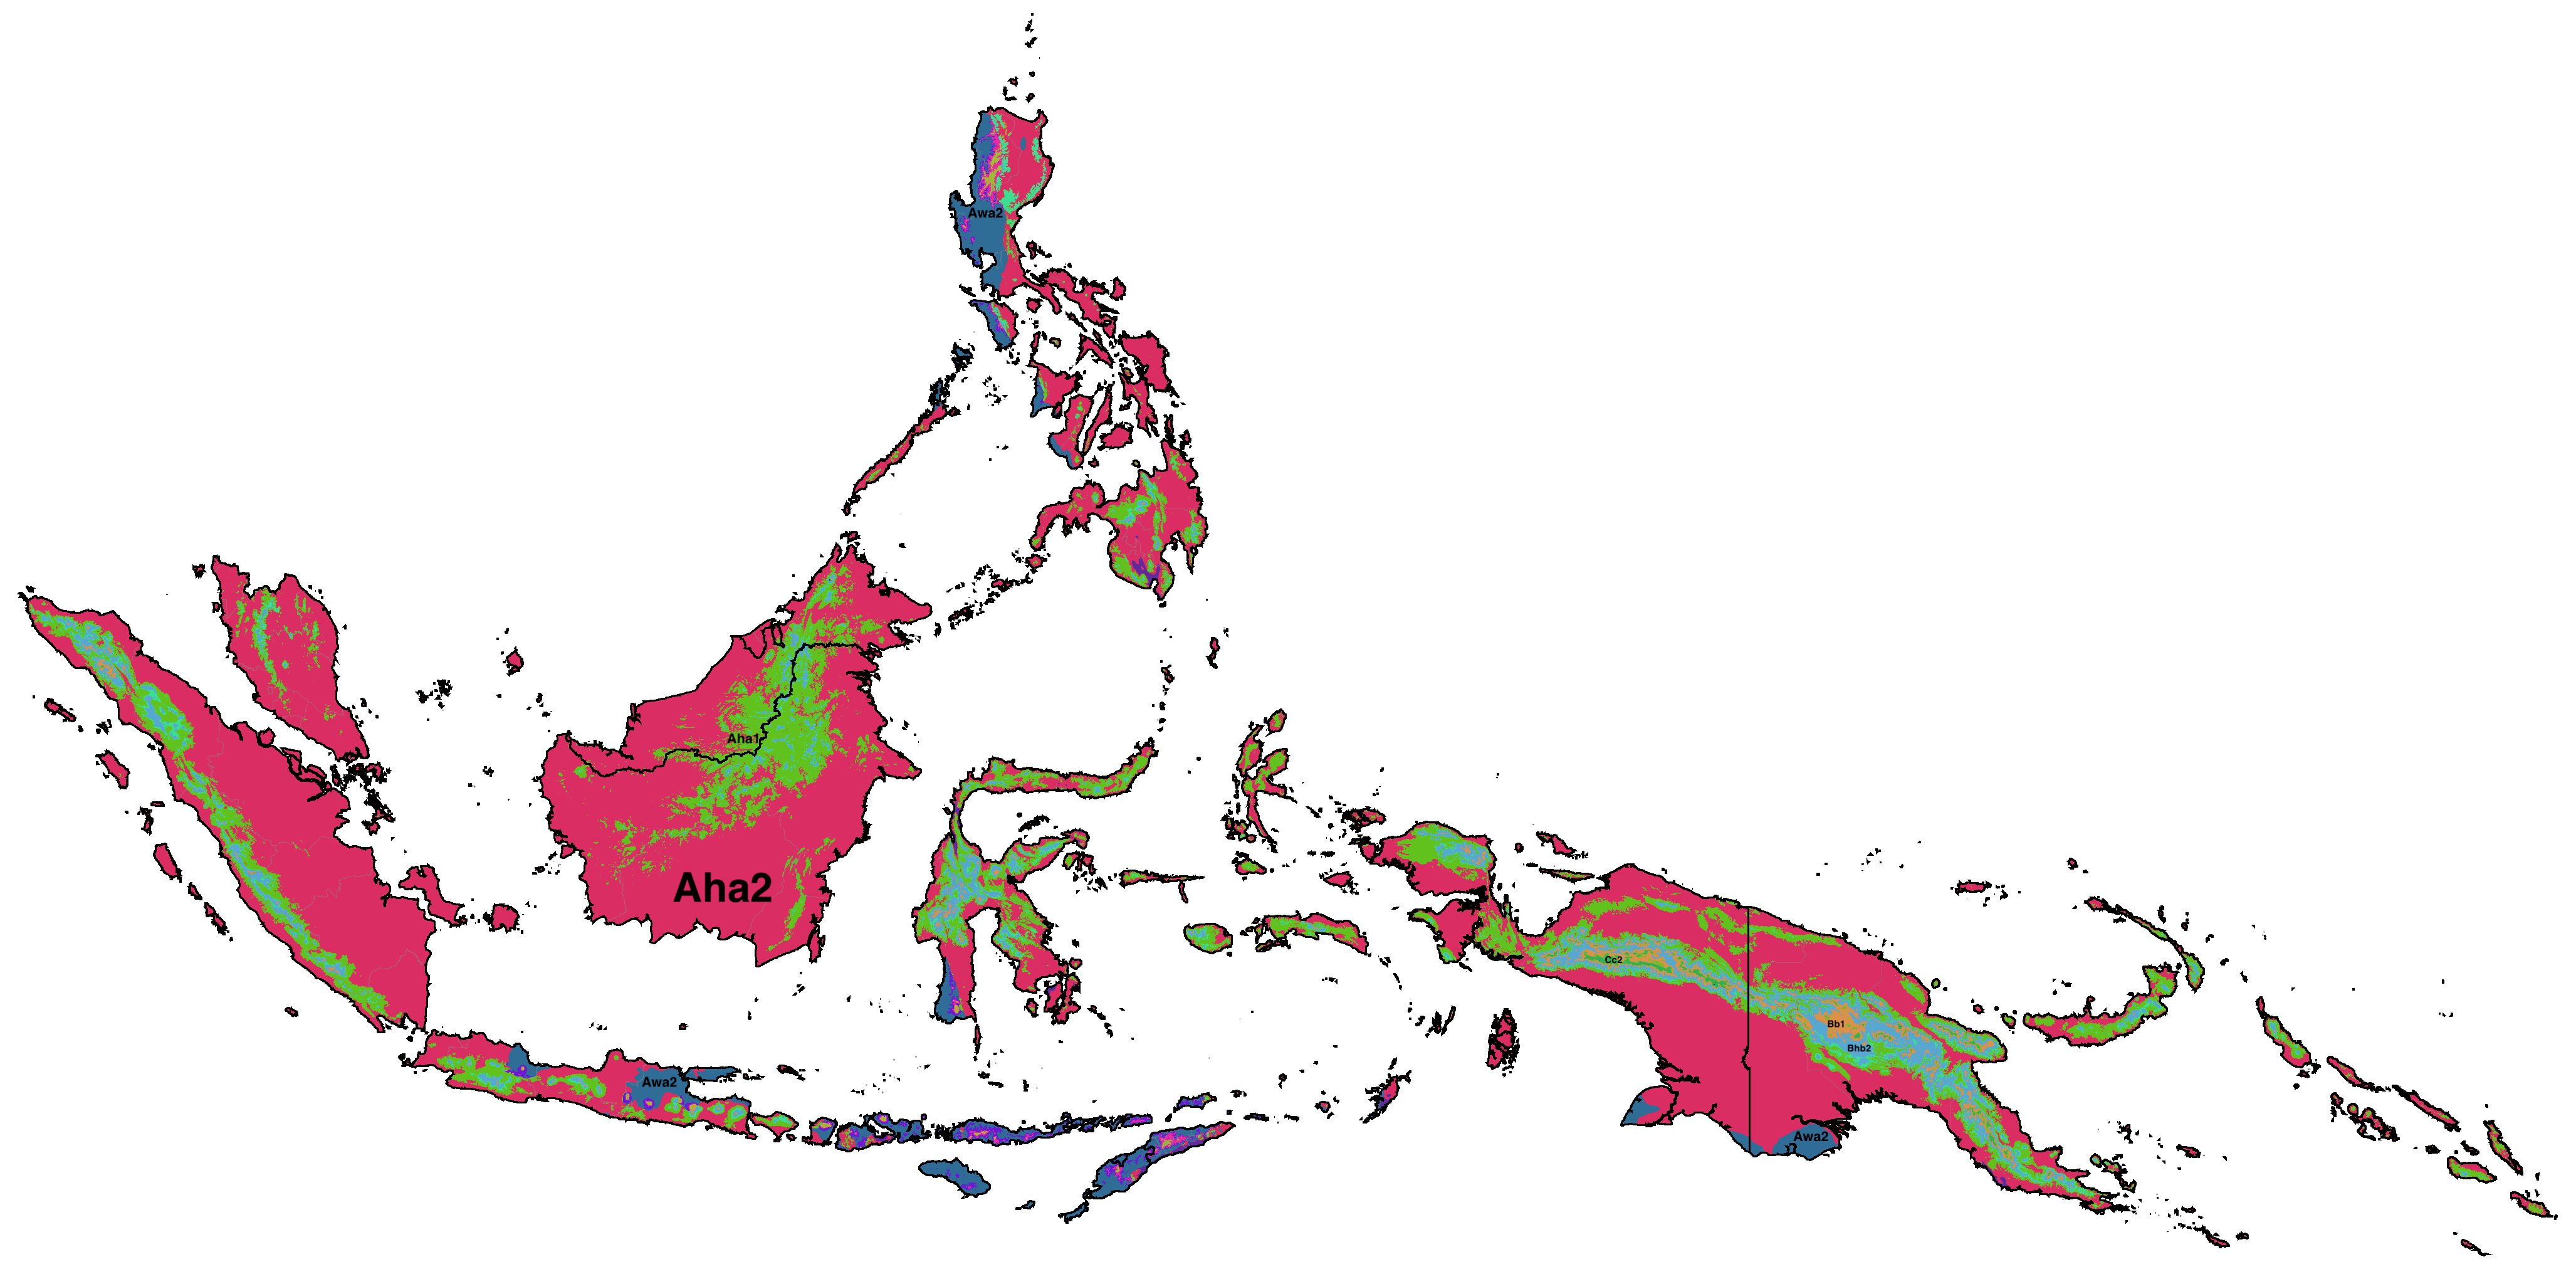
Maritime Southeast Asia distribution of summer categories (projections are SSP5-8.5 high emissions normals)
The following division of P/PET ratios is not part of my classification system but is simply provided for informational purposes.
Precipitation divided by Potential Evapotranspiration (P/PET) maps are shown here for all regional locations where we have data.
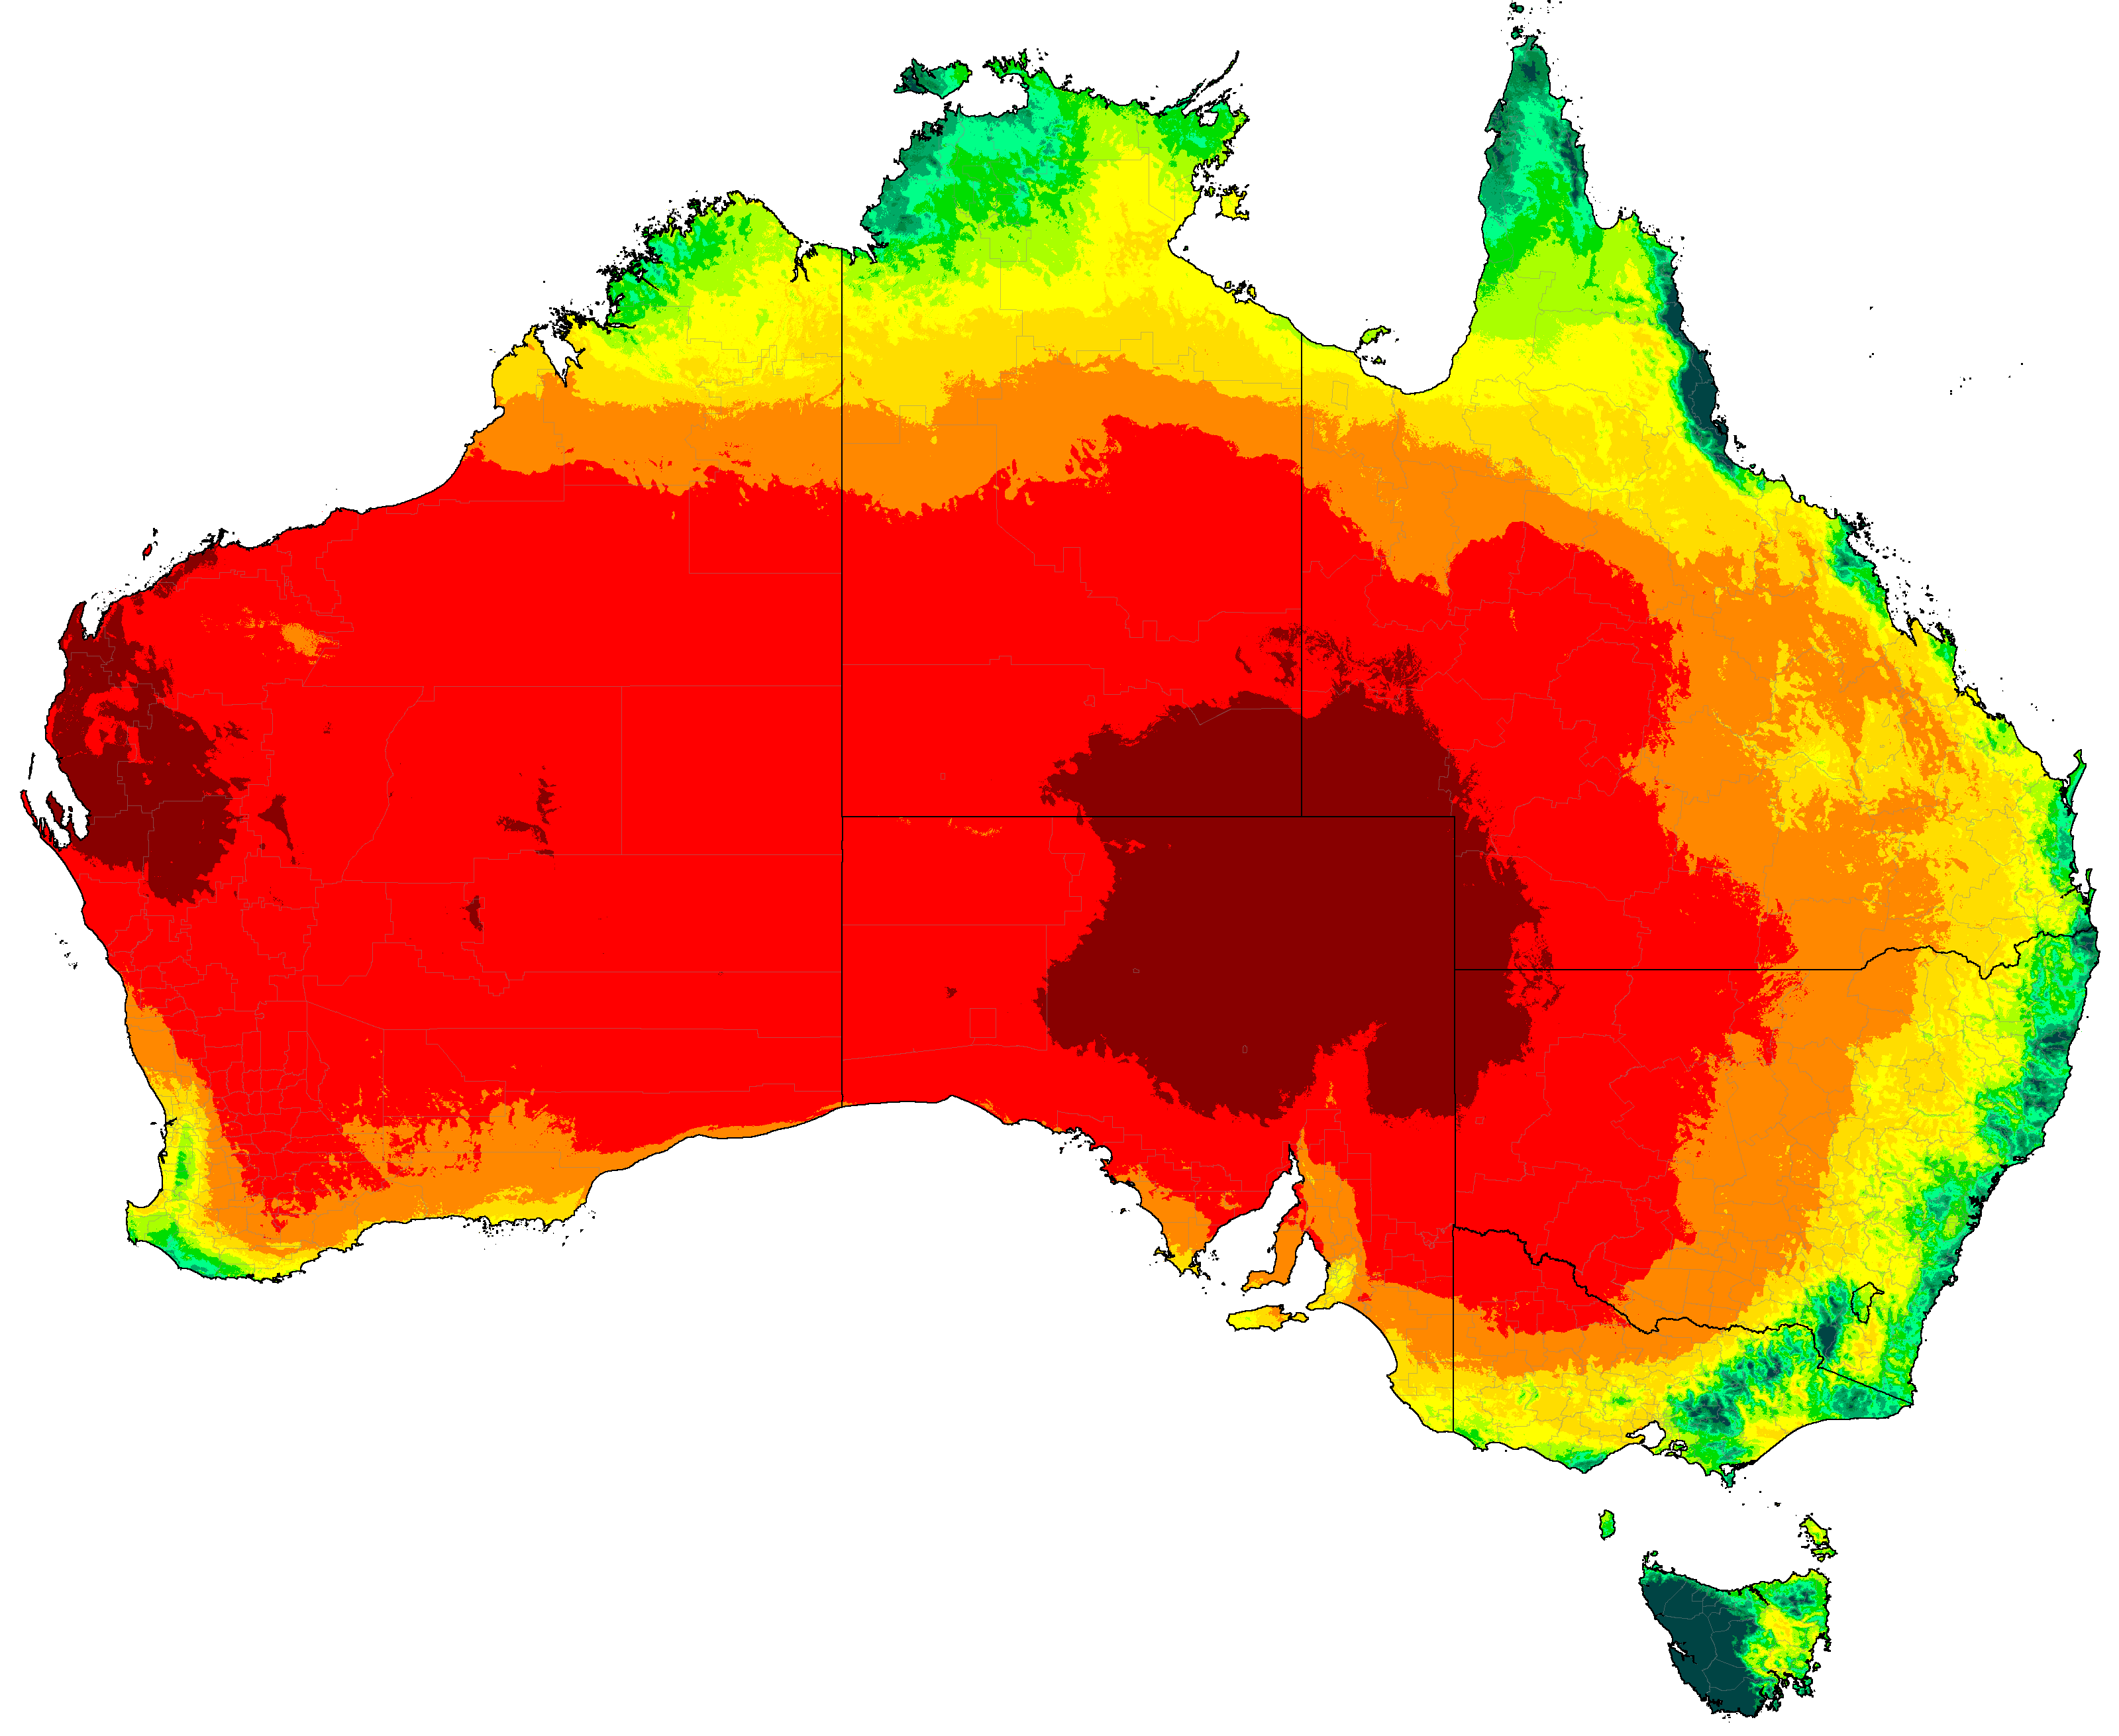
Australia distribution of P/PET (projections are SSP5-8.5 high emissions normals)
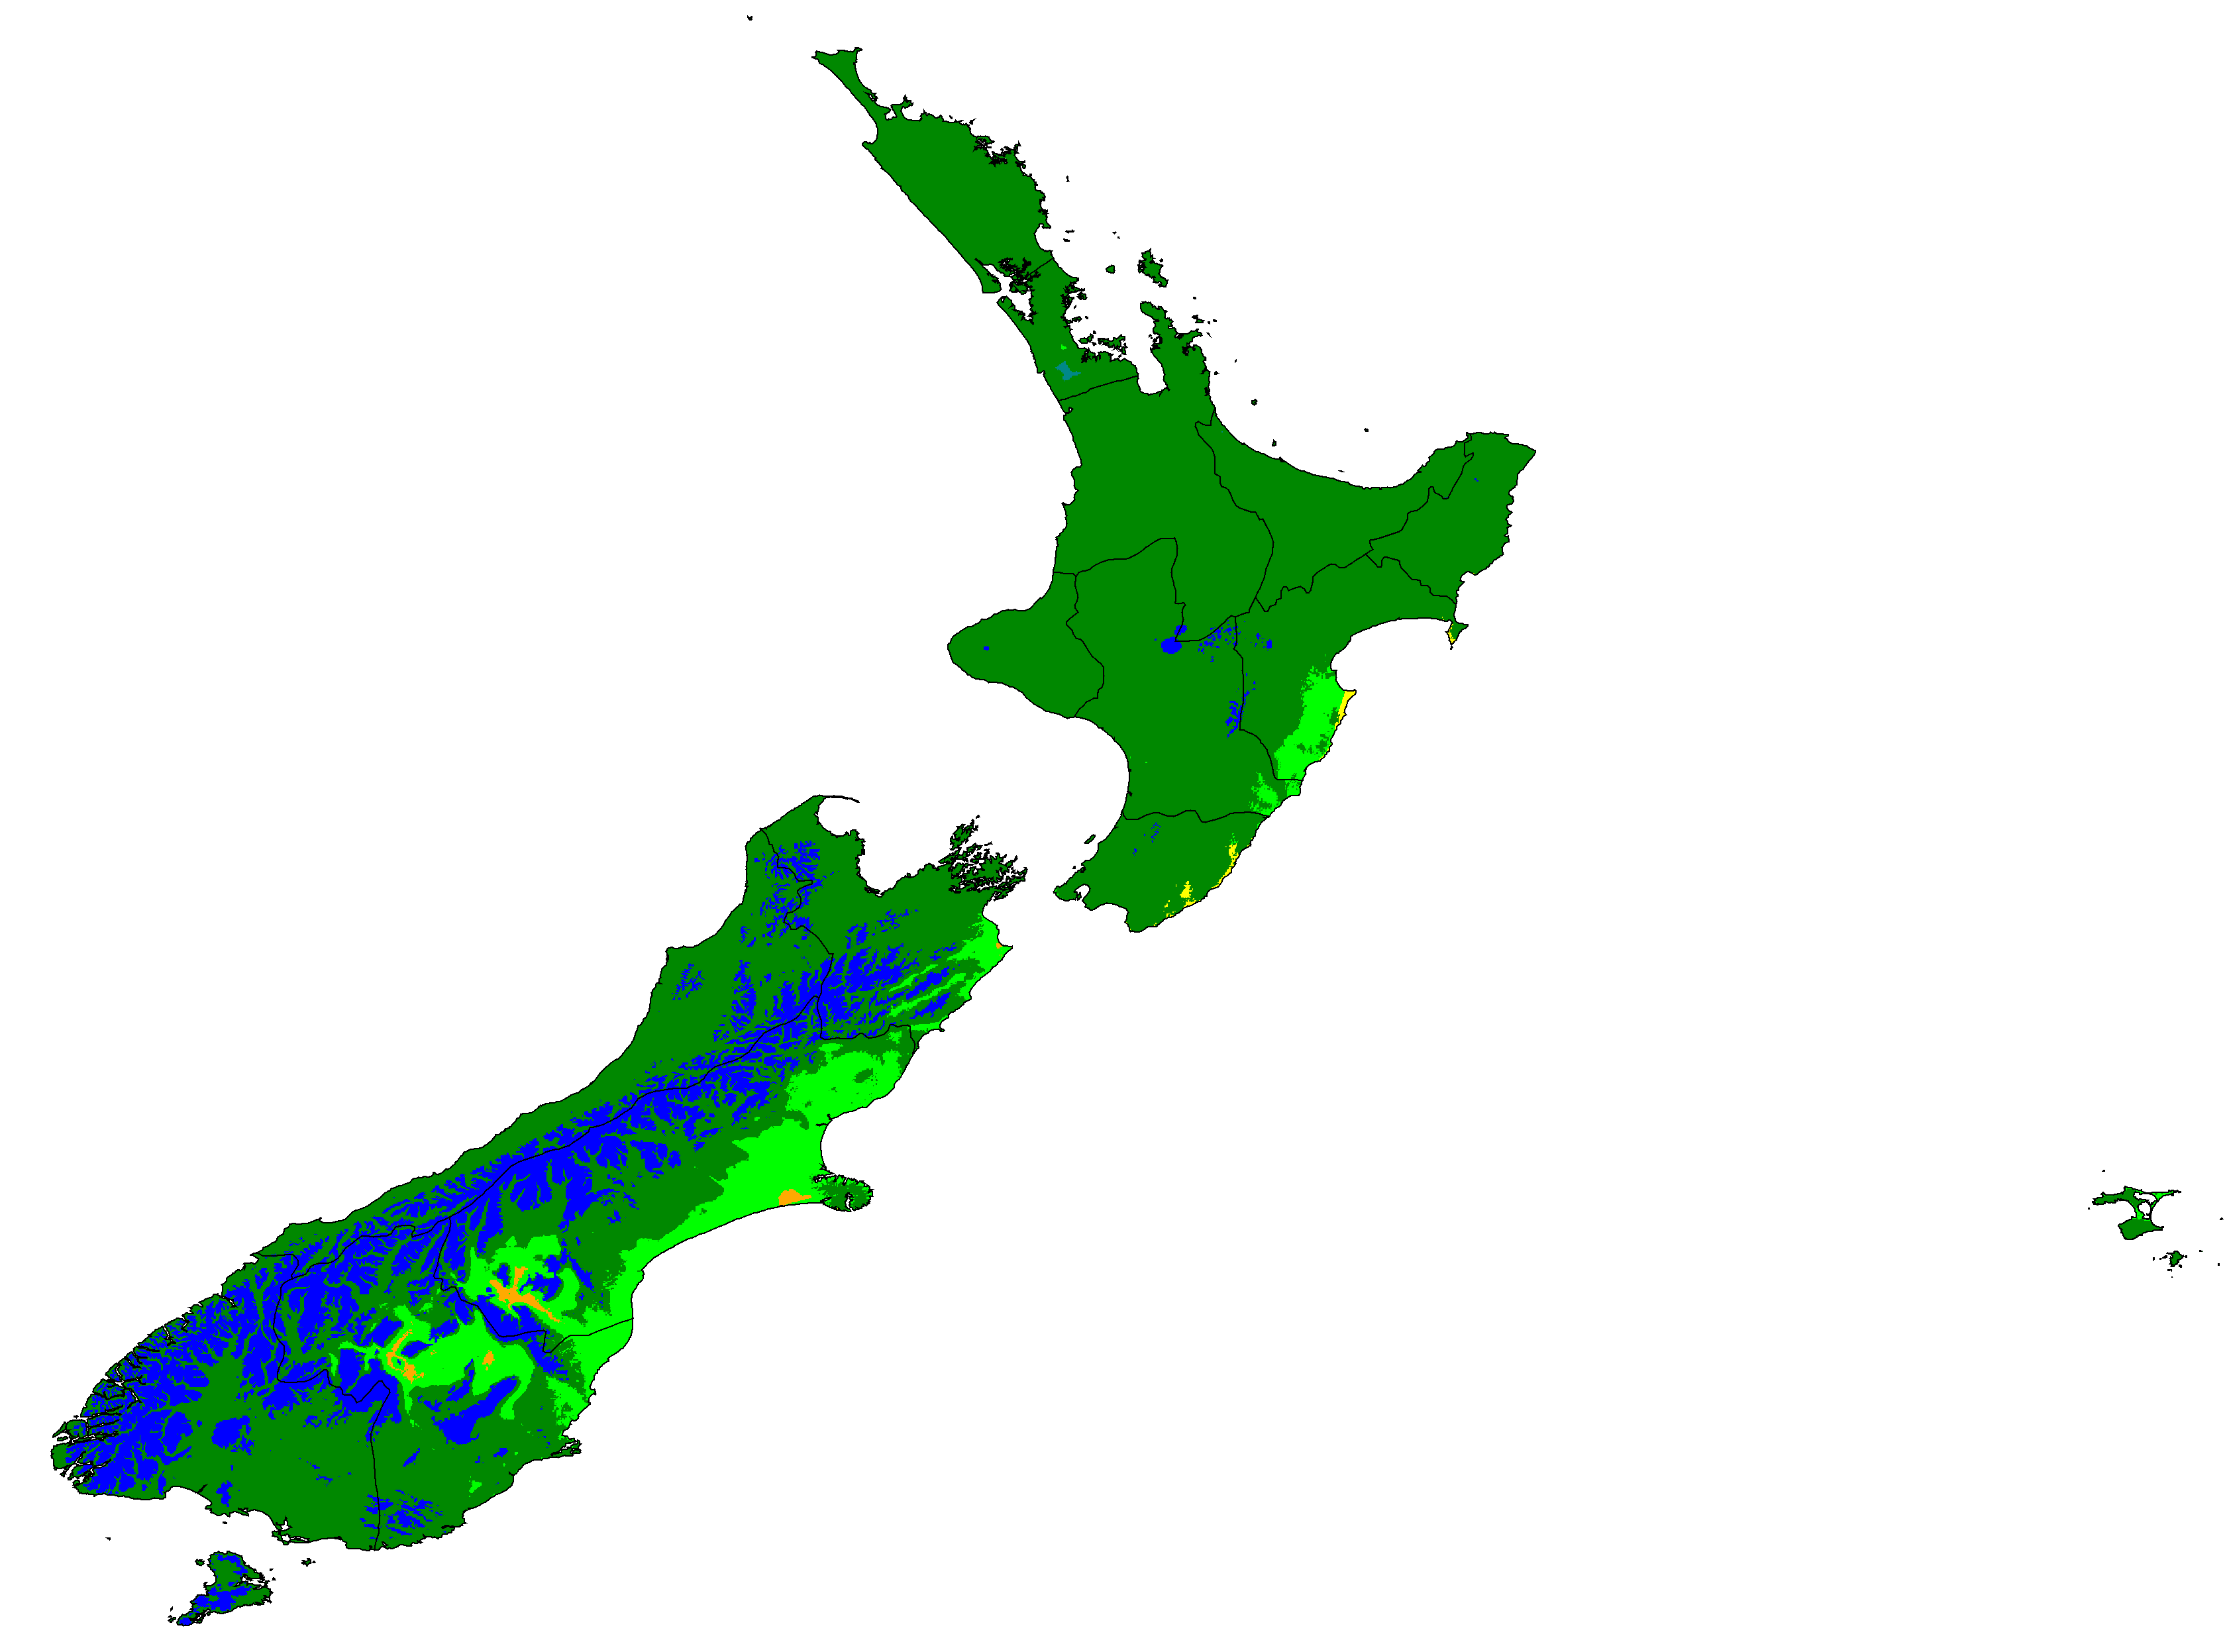
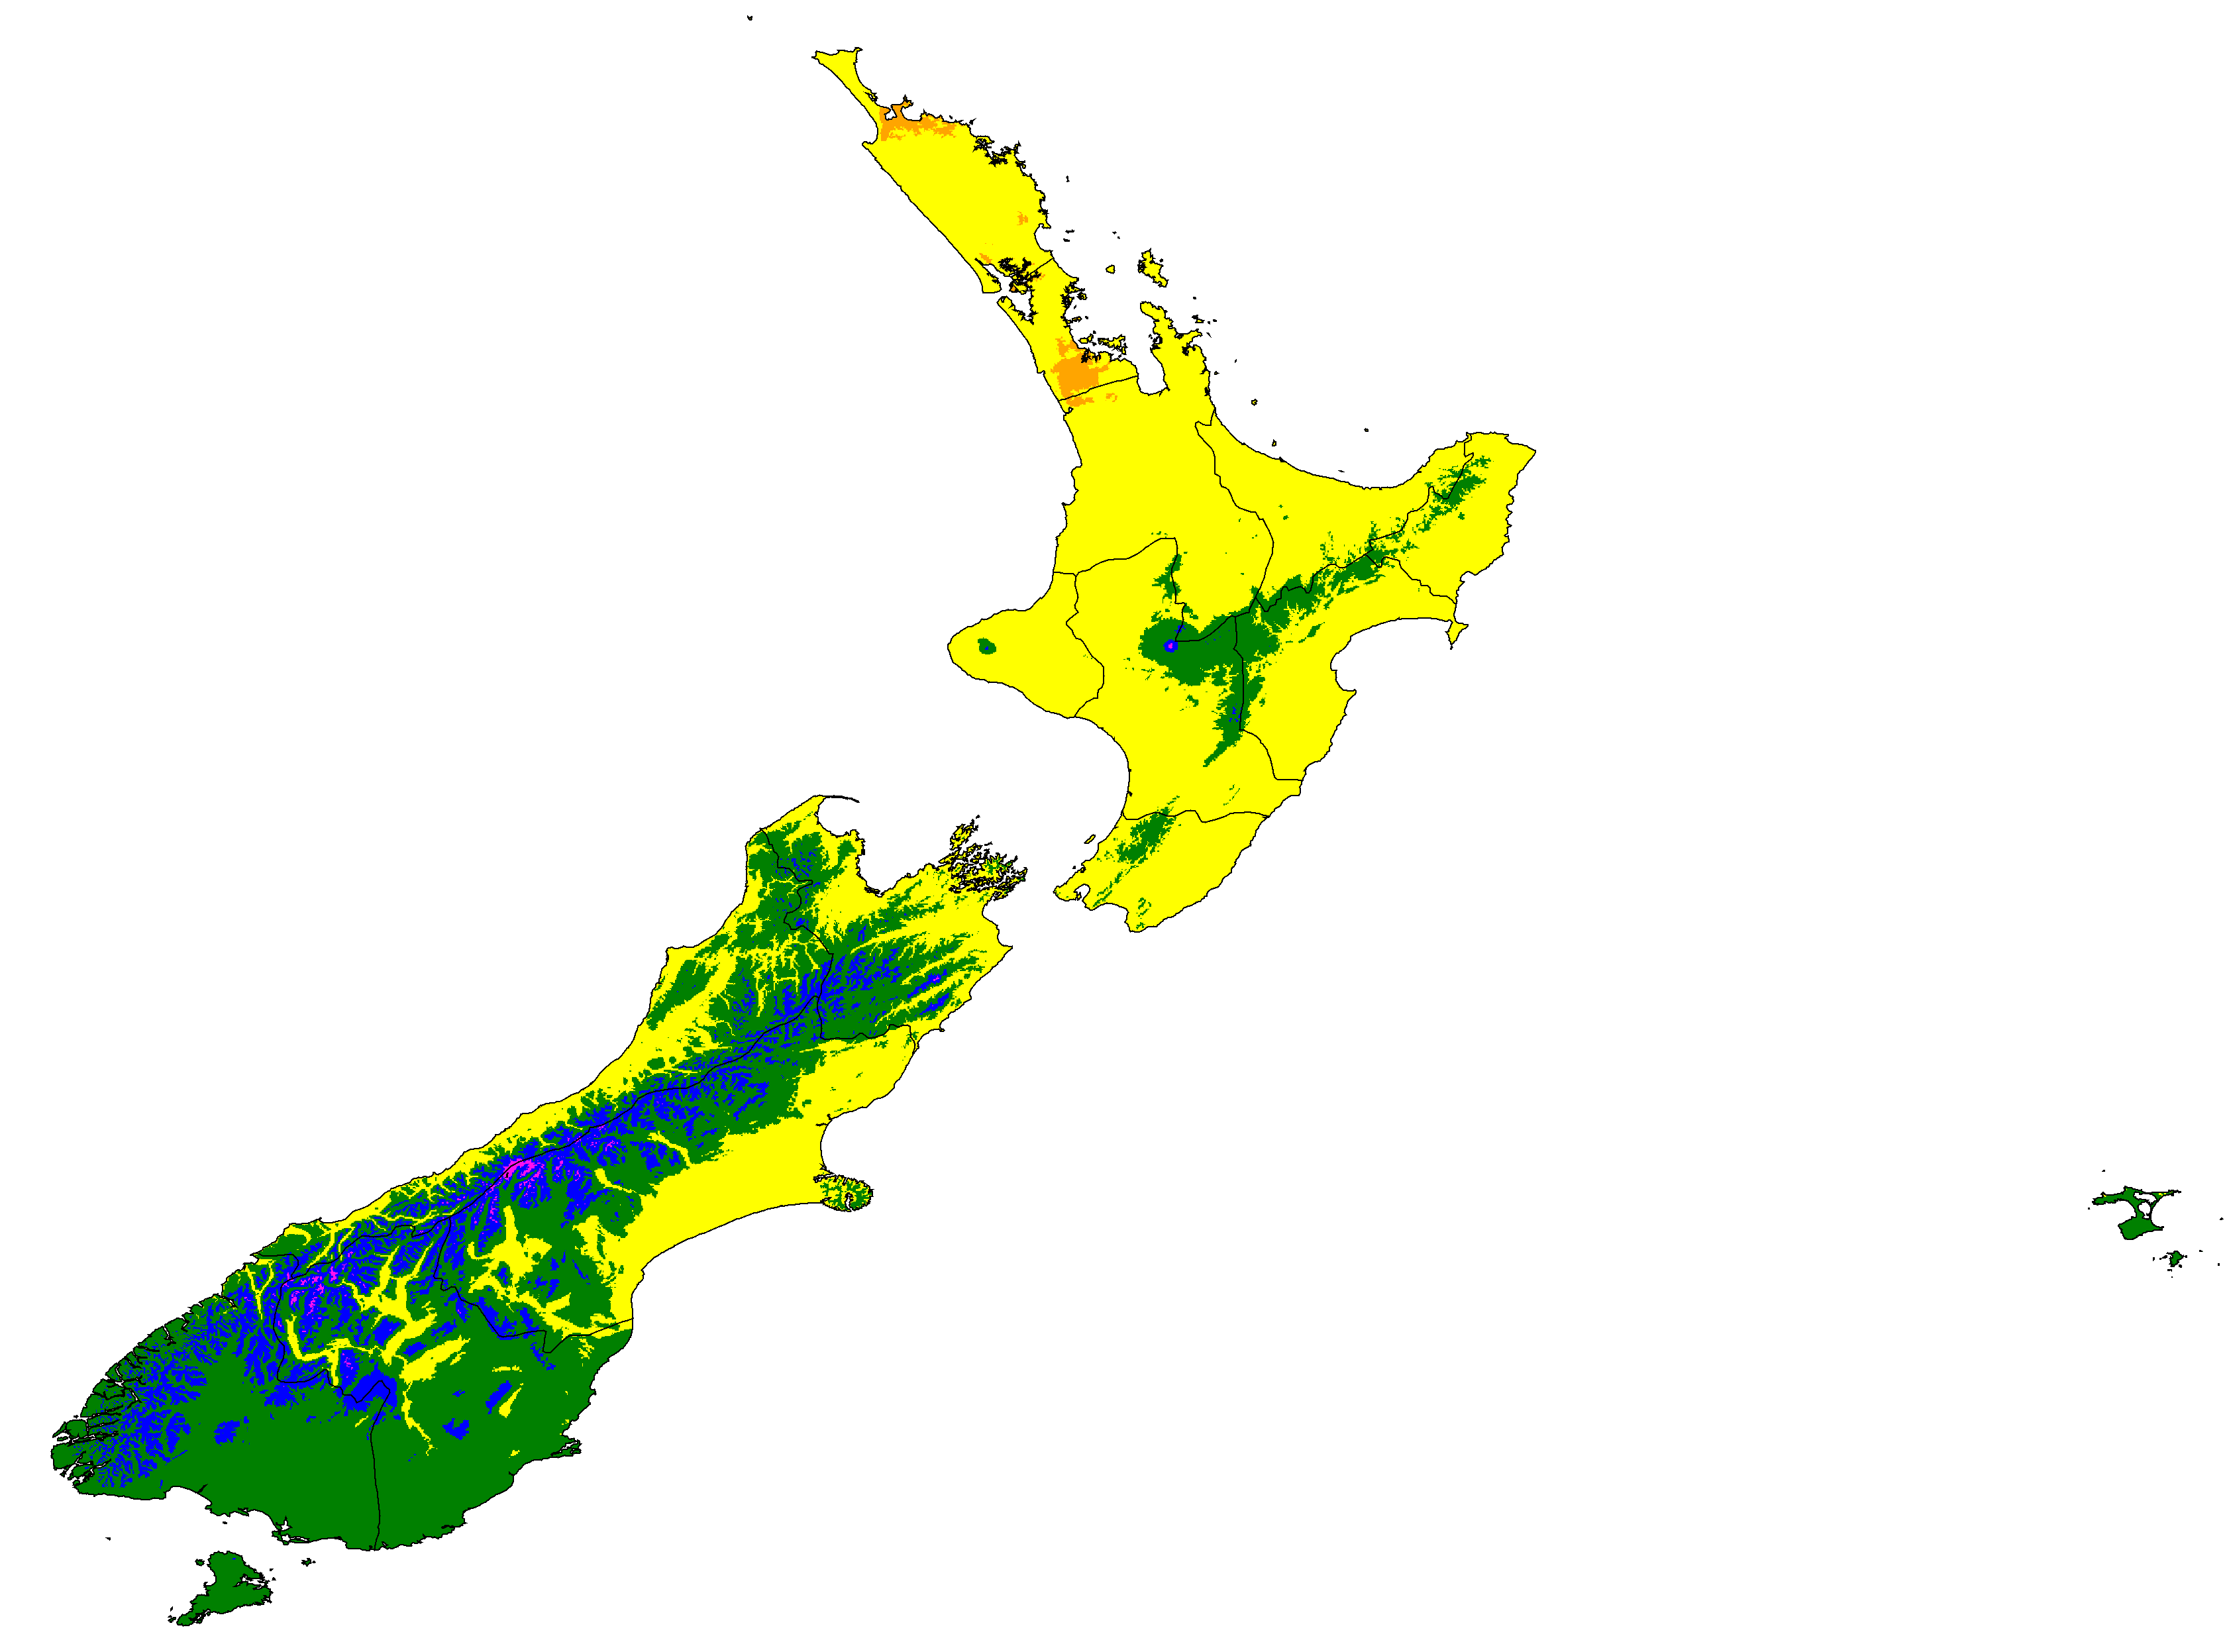
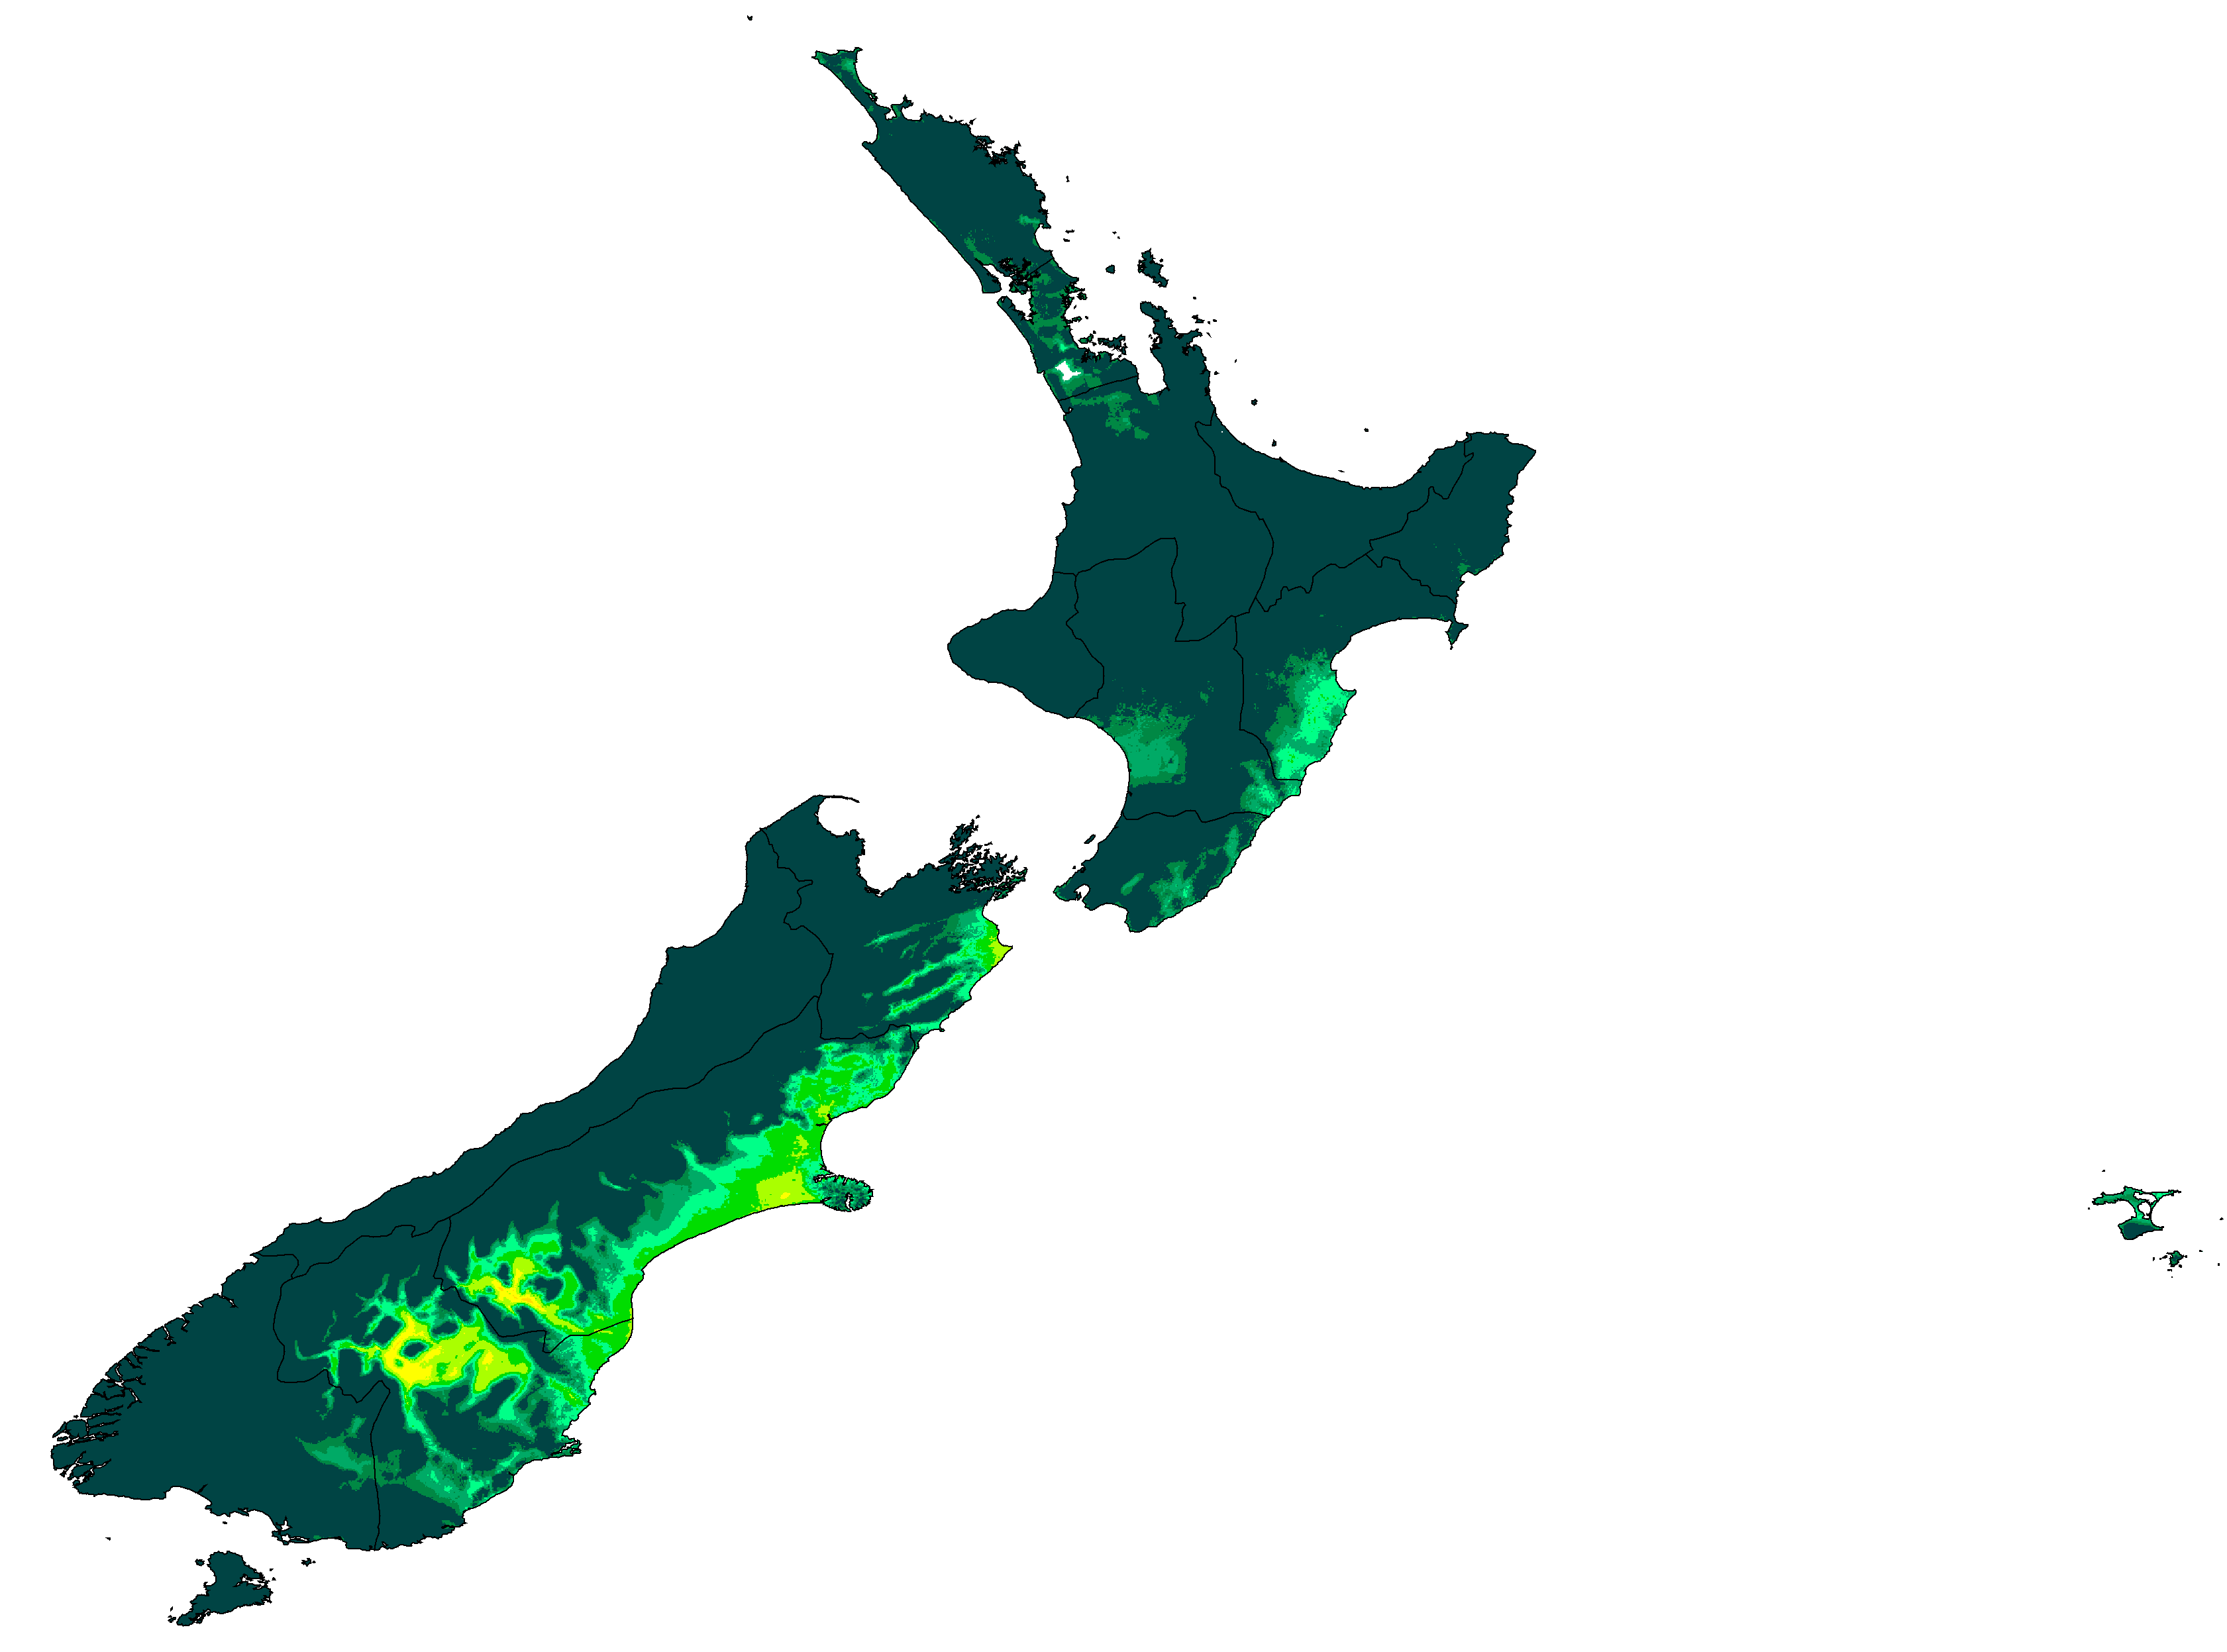
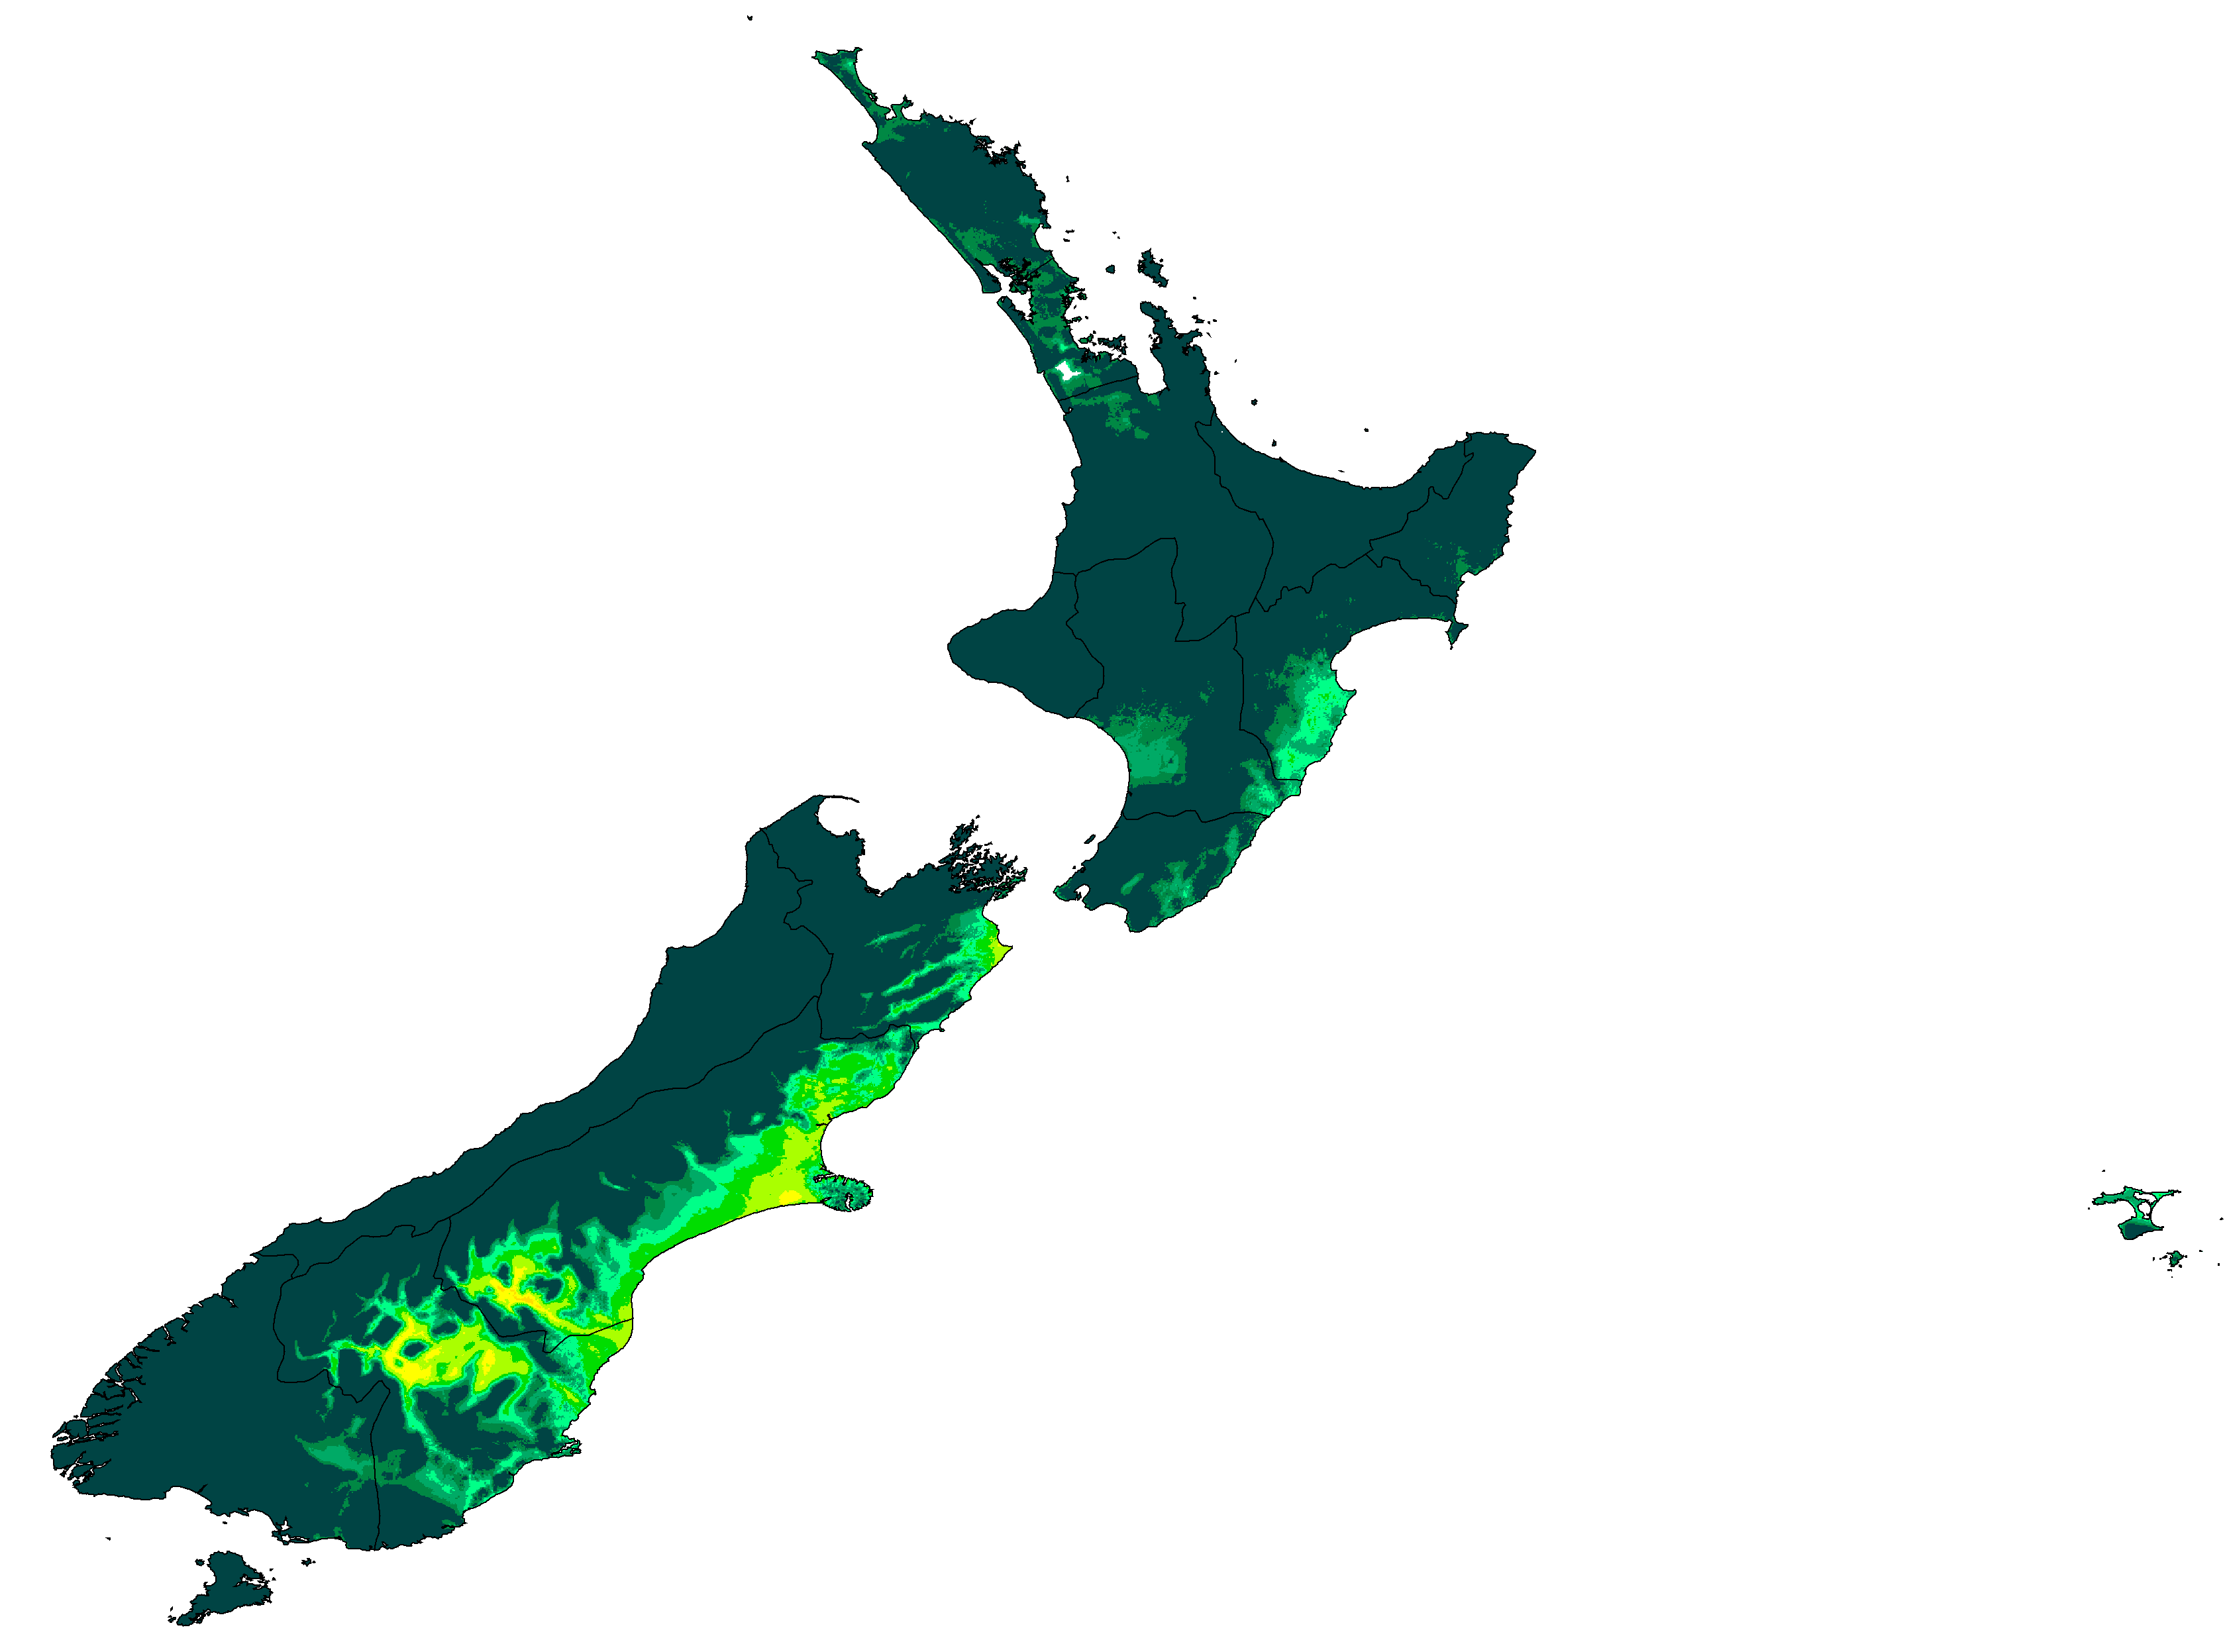
New Zealand distribution of P/PET (projections are SSP5-8.5 high emissions normals)

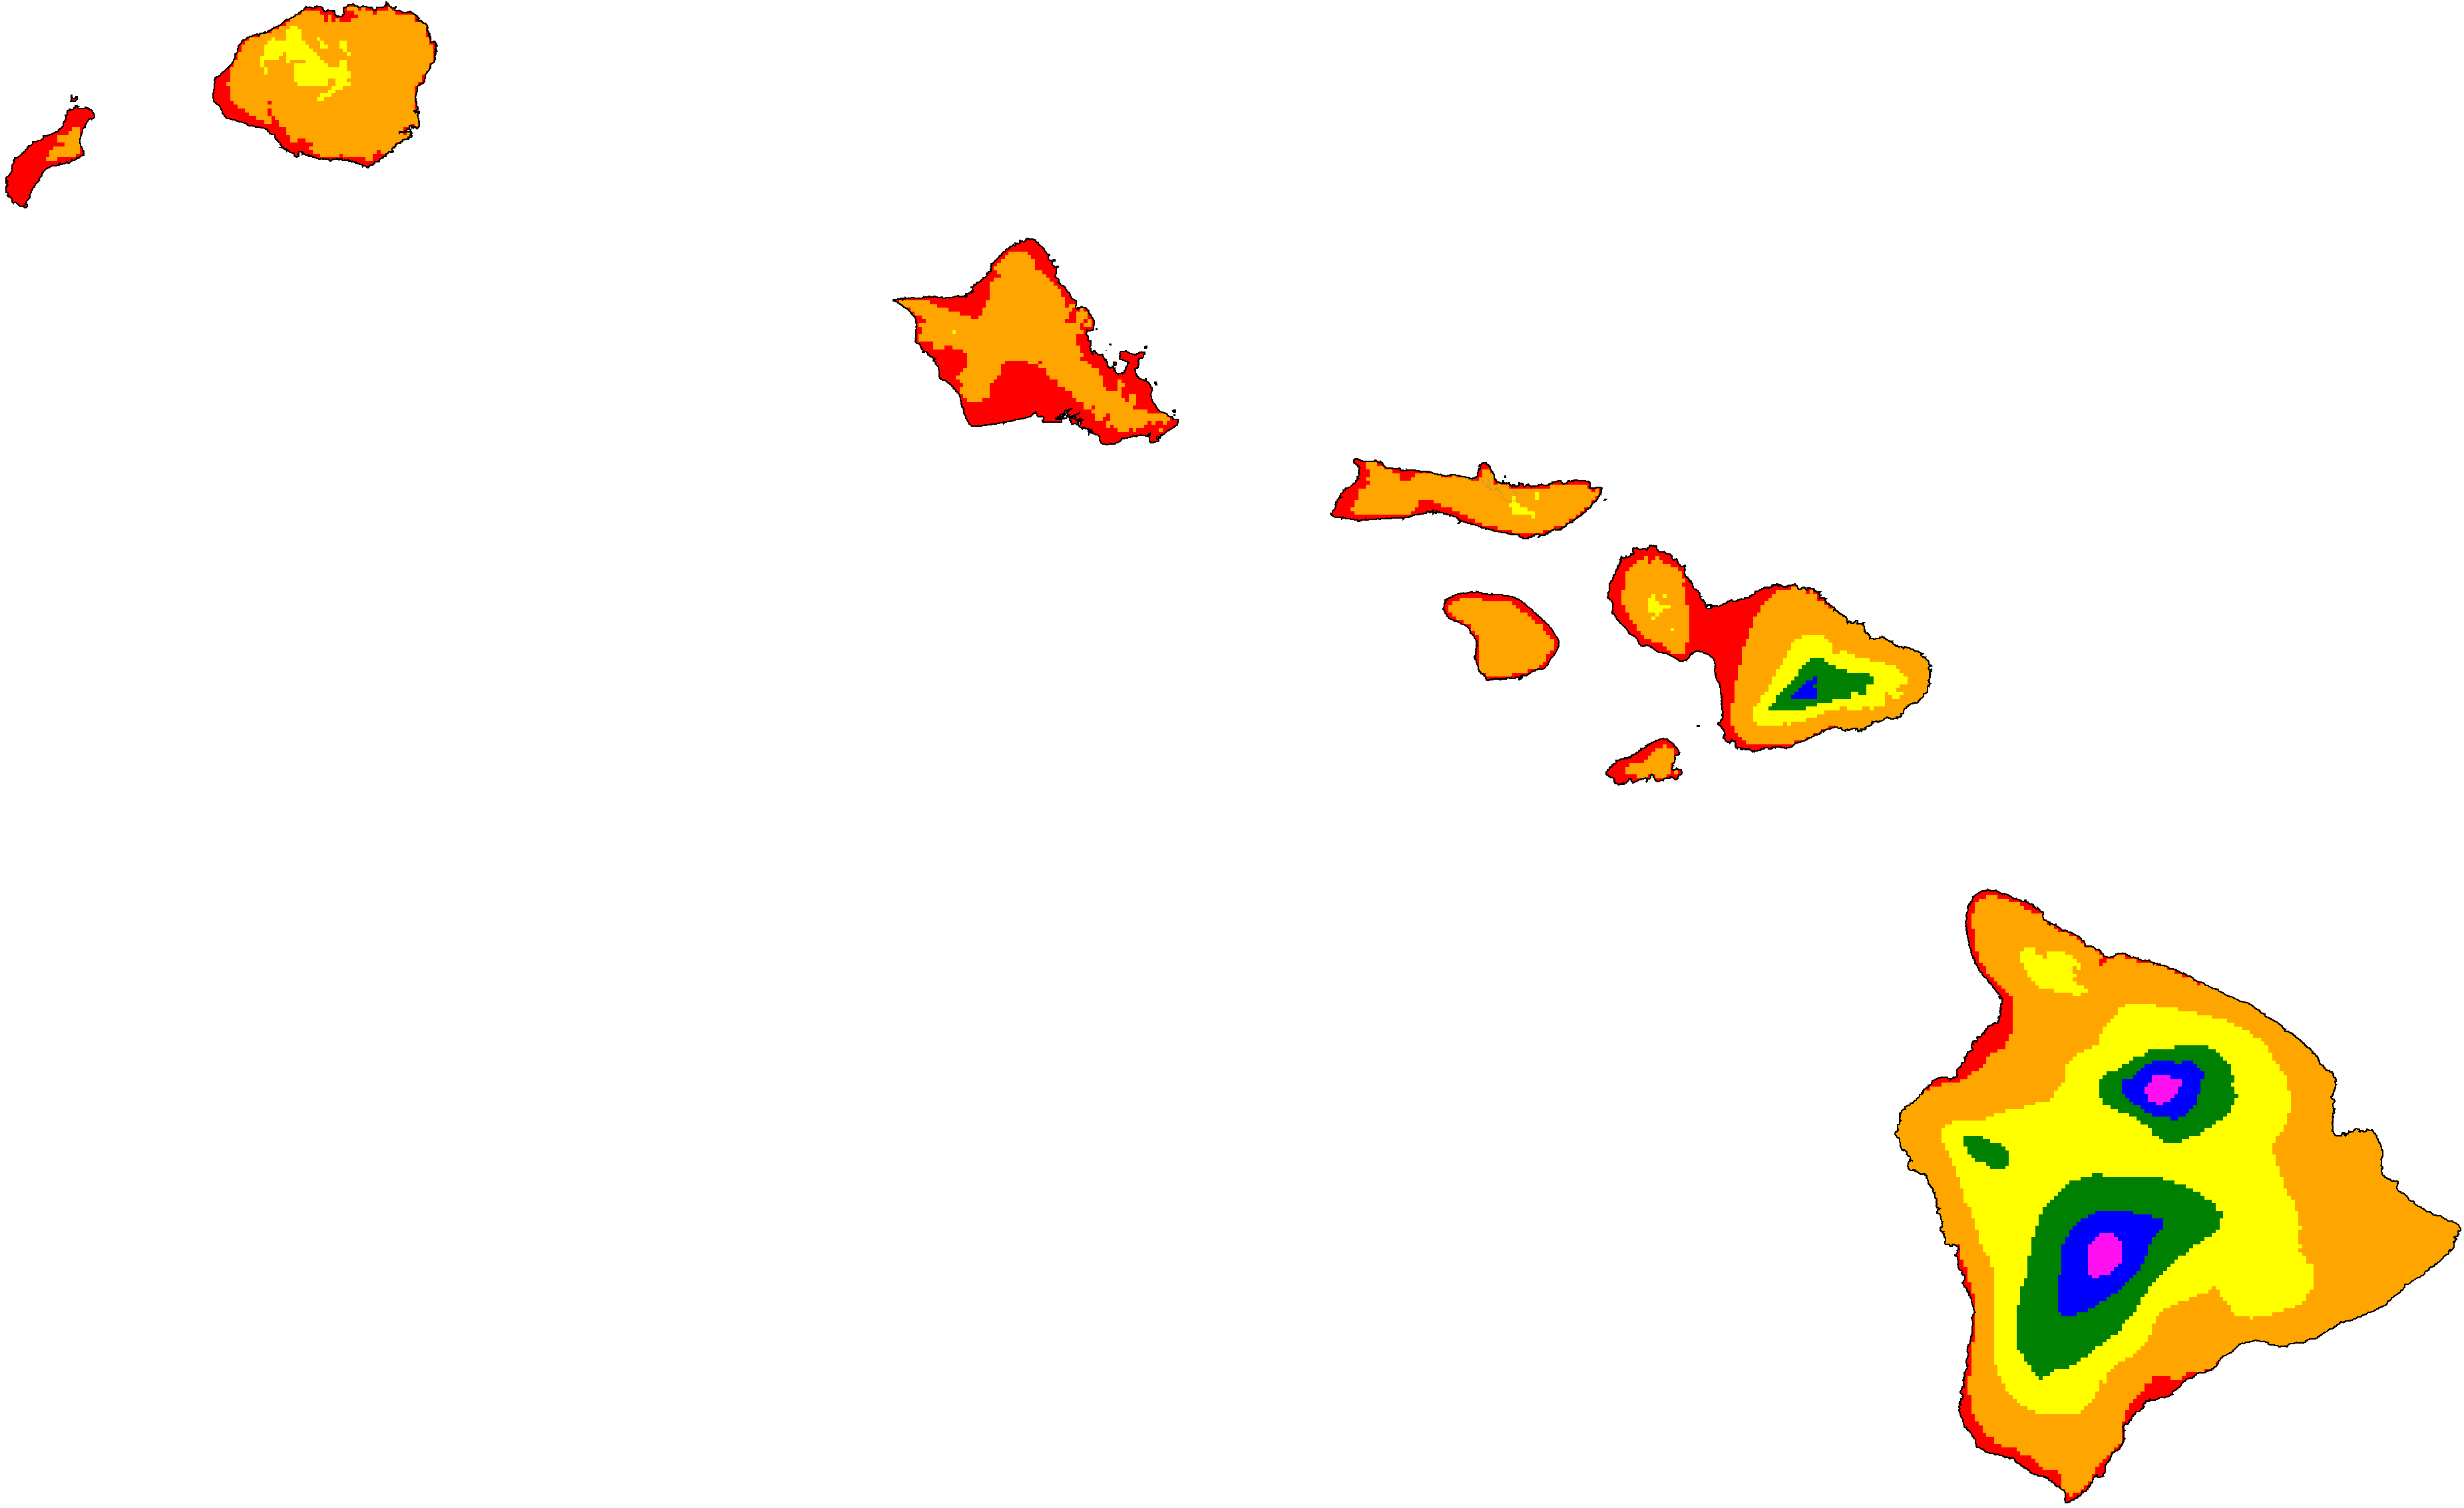
Hawaii distribution of P/PET (projections are SSP5-8.5 high emissions normals)


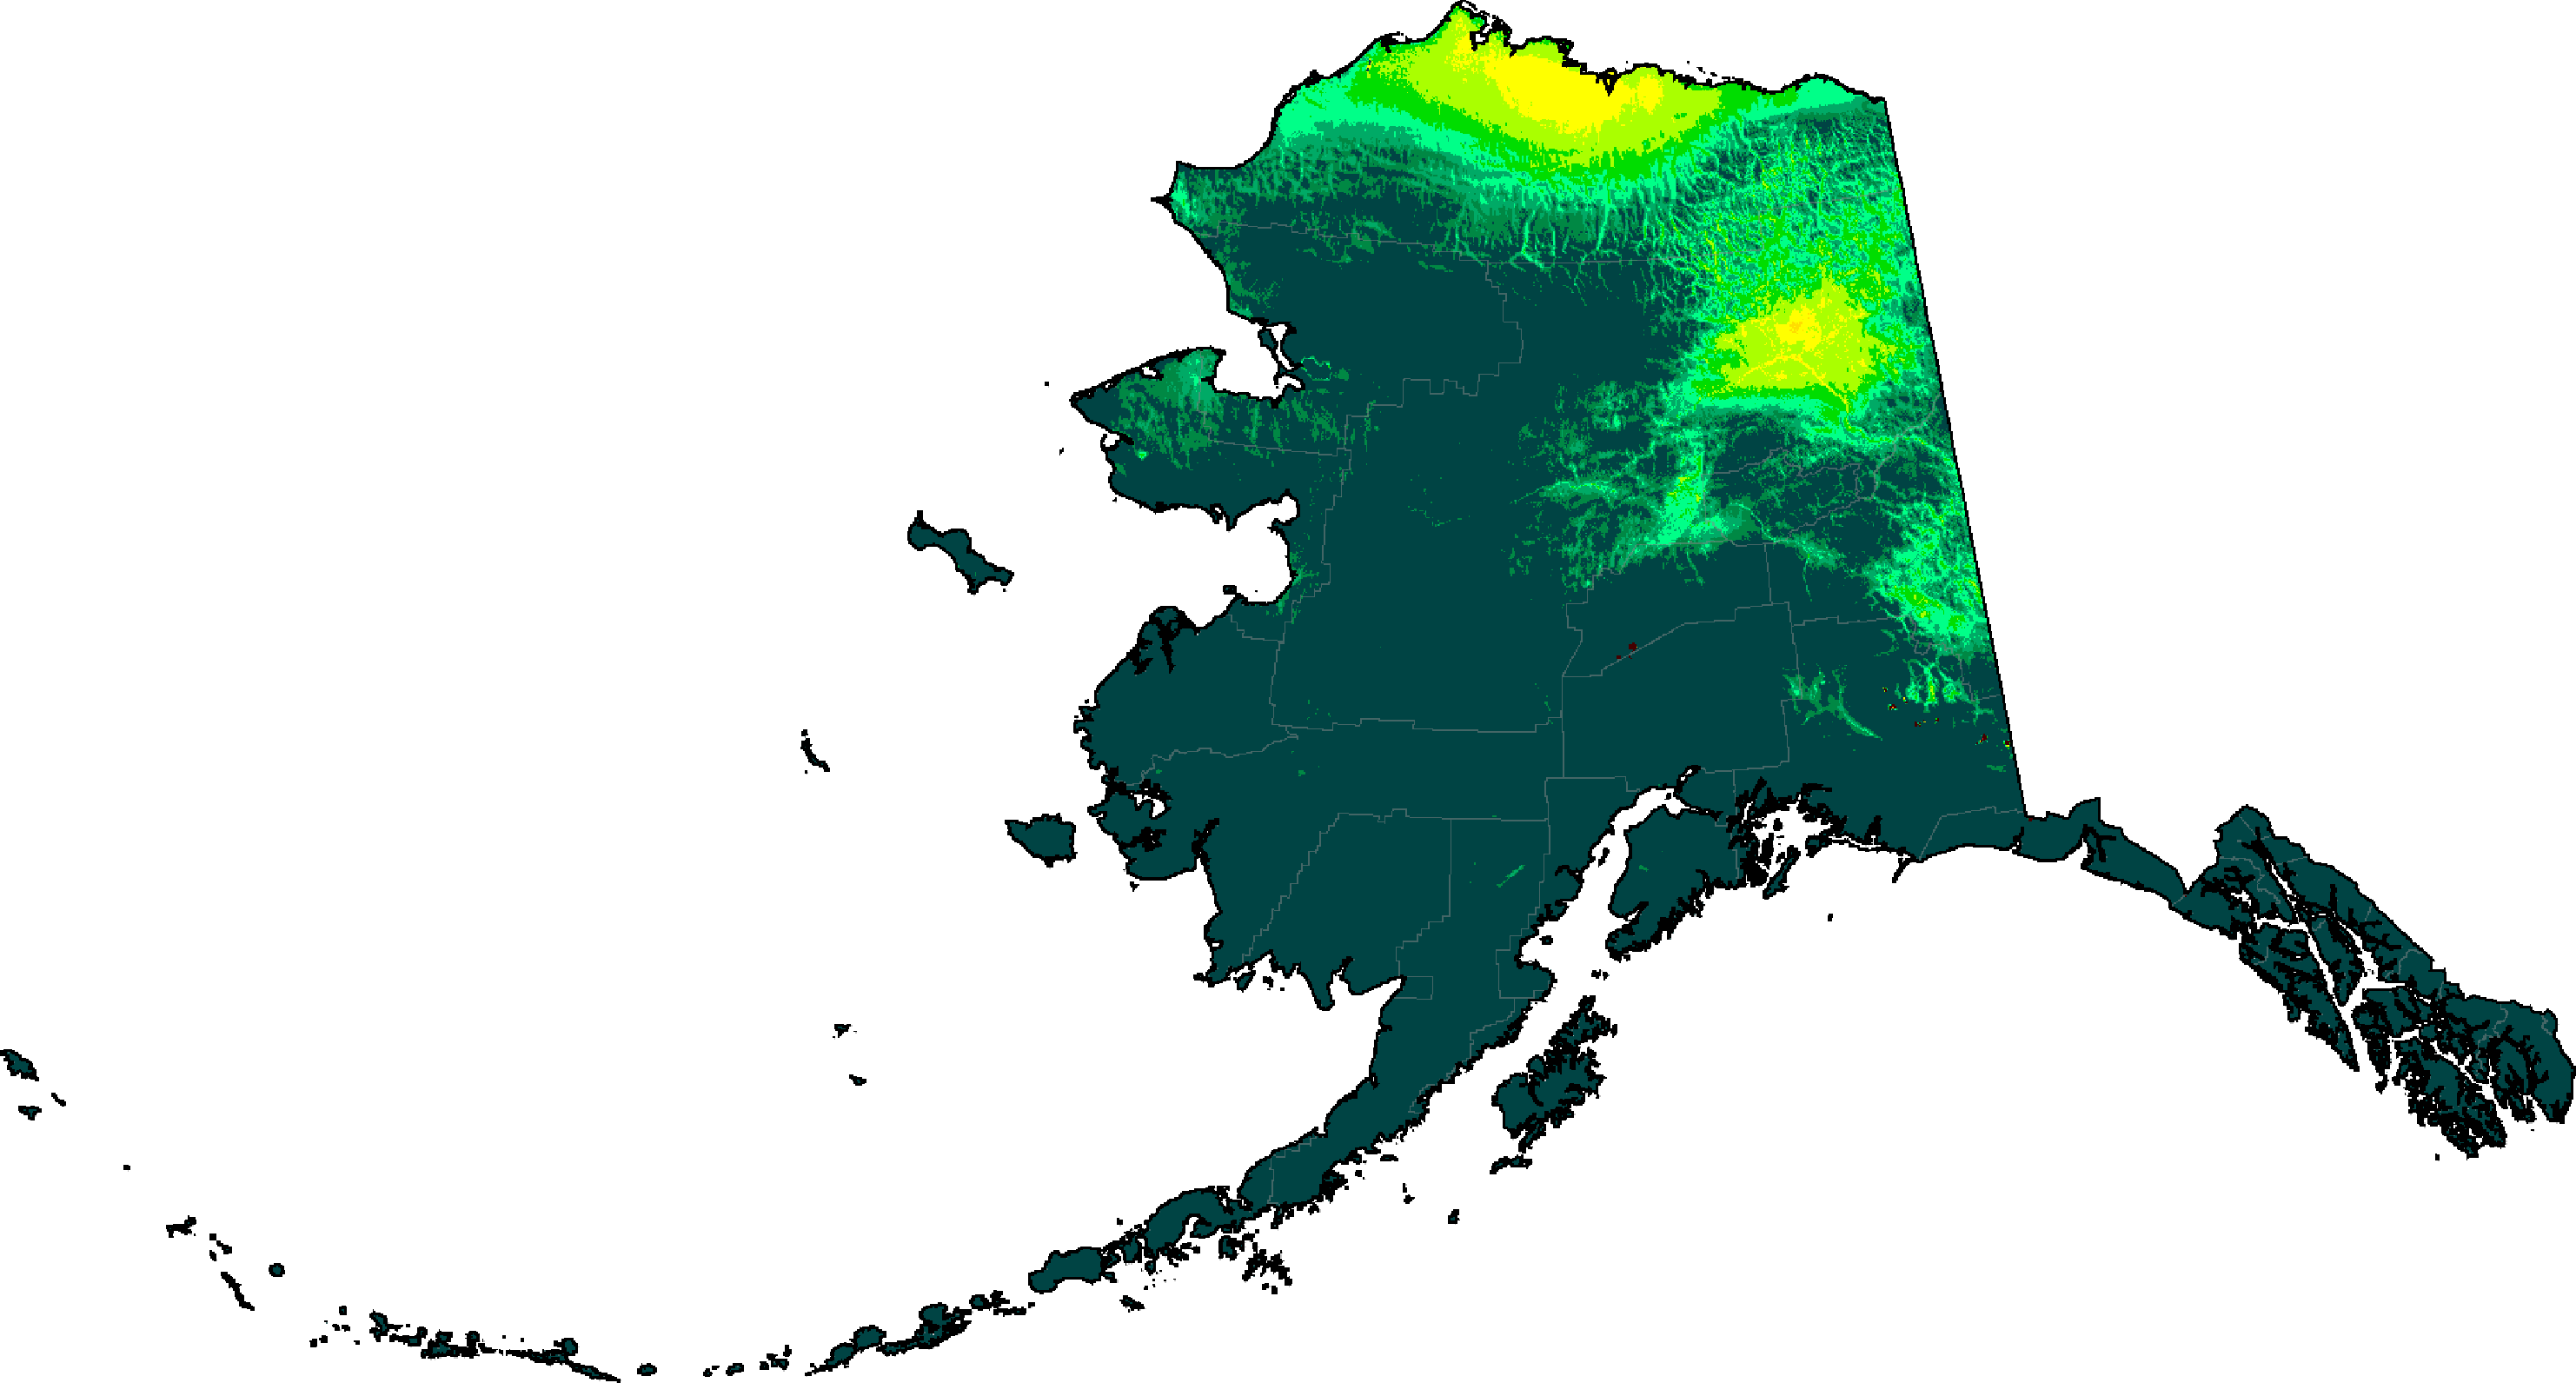
Alaska distribution of P/PET (projections are SSP5-8.5 high emissions normals)
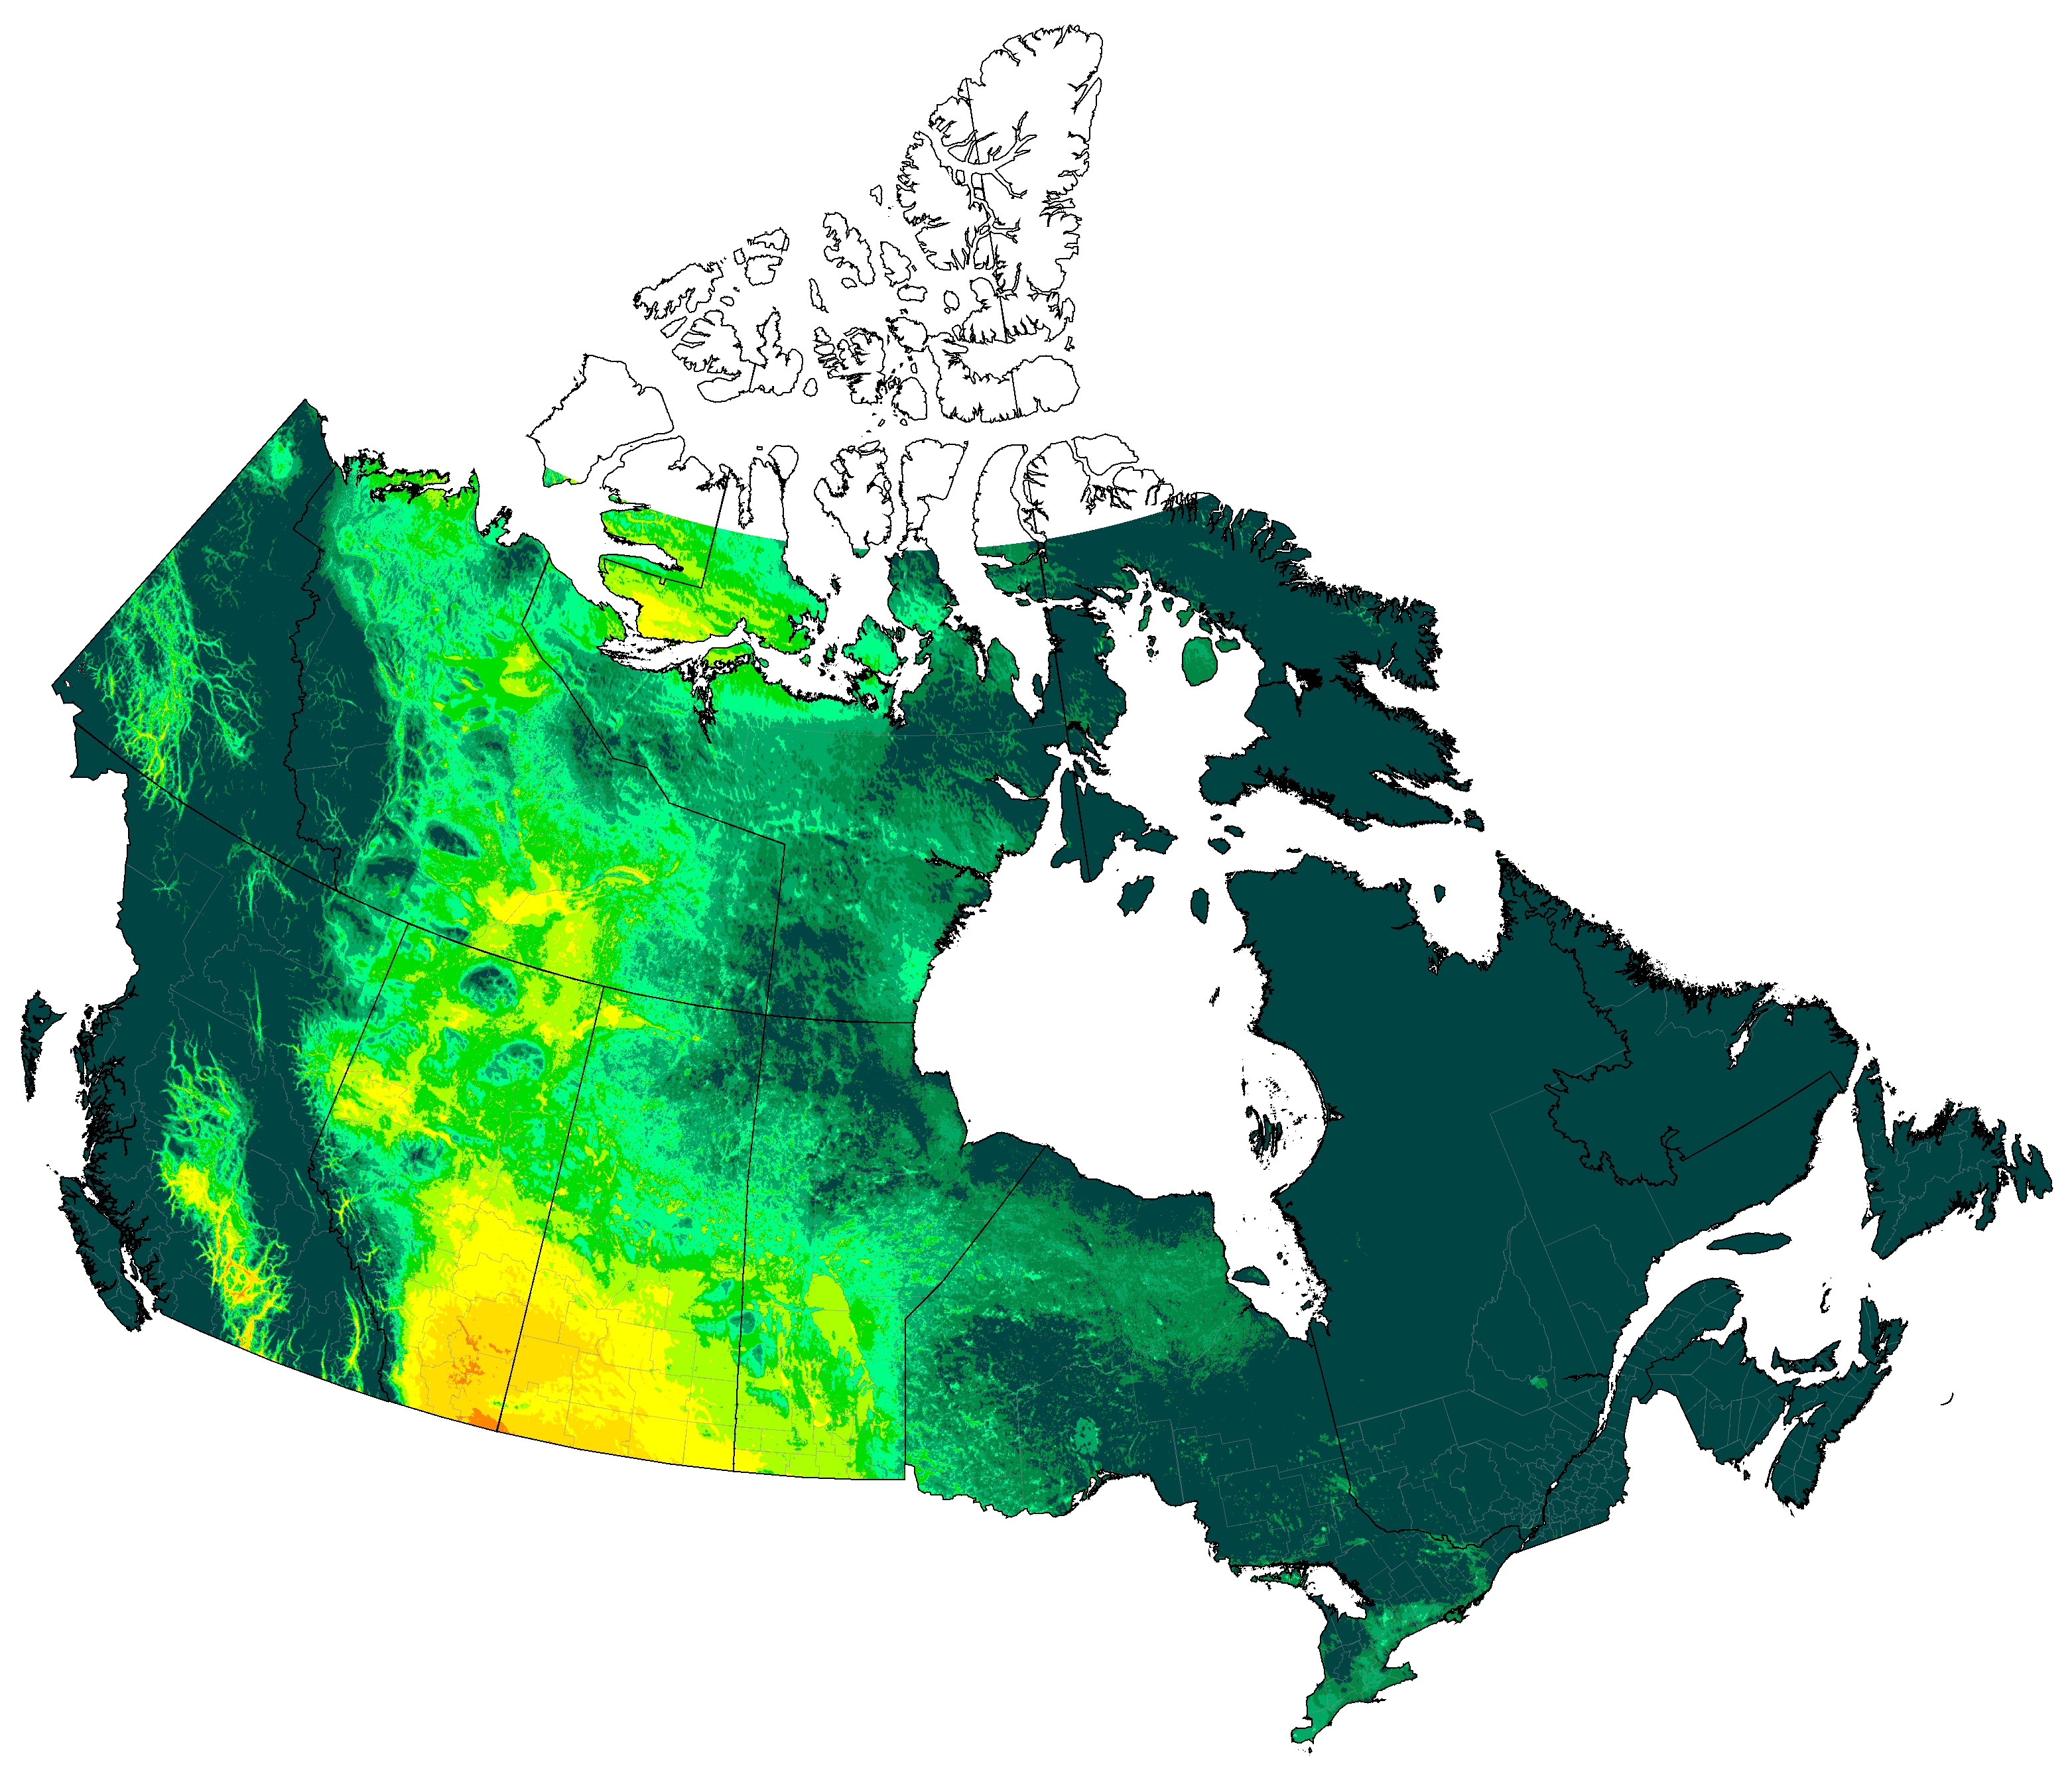
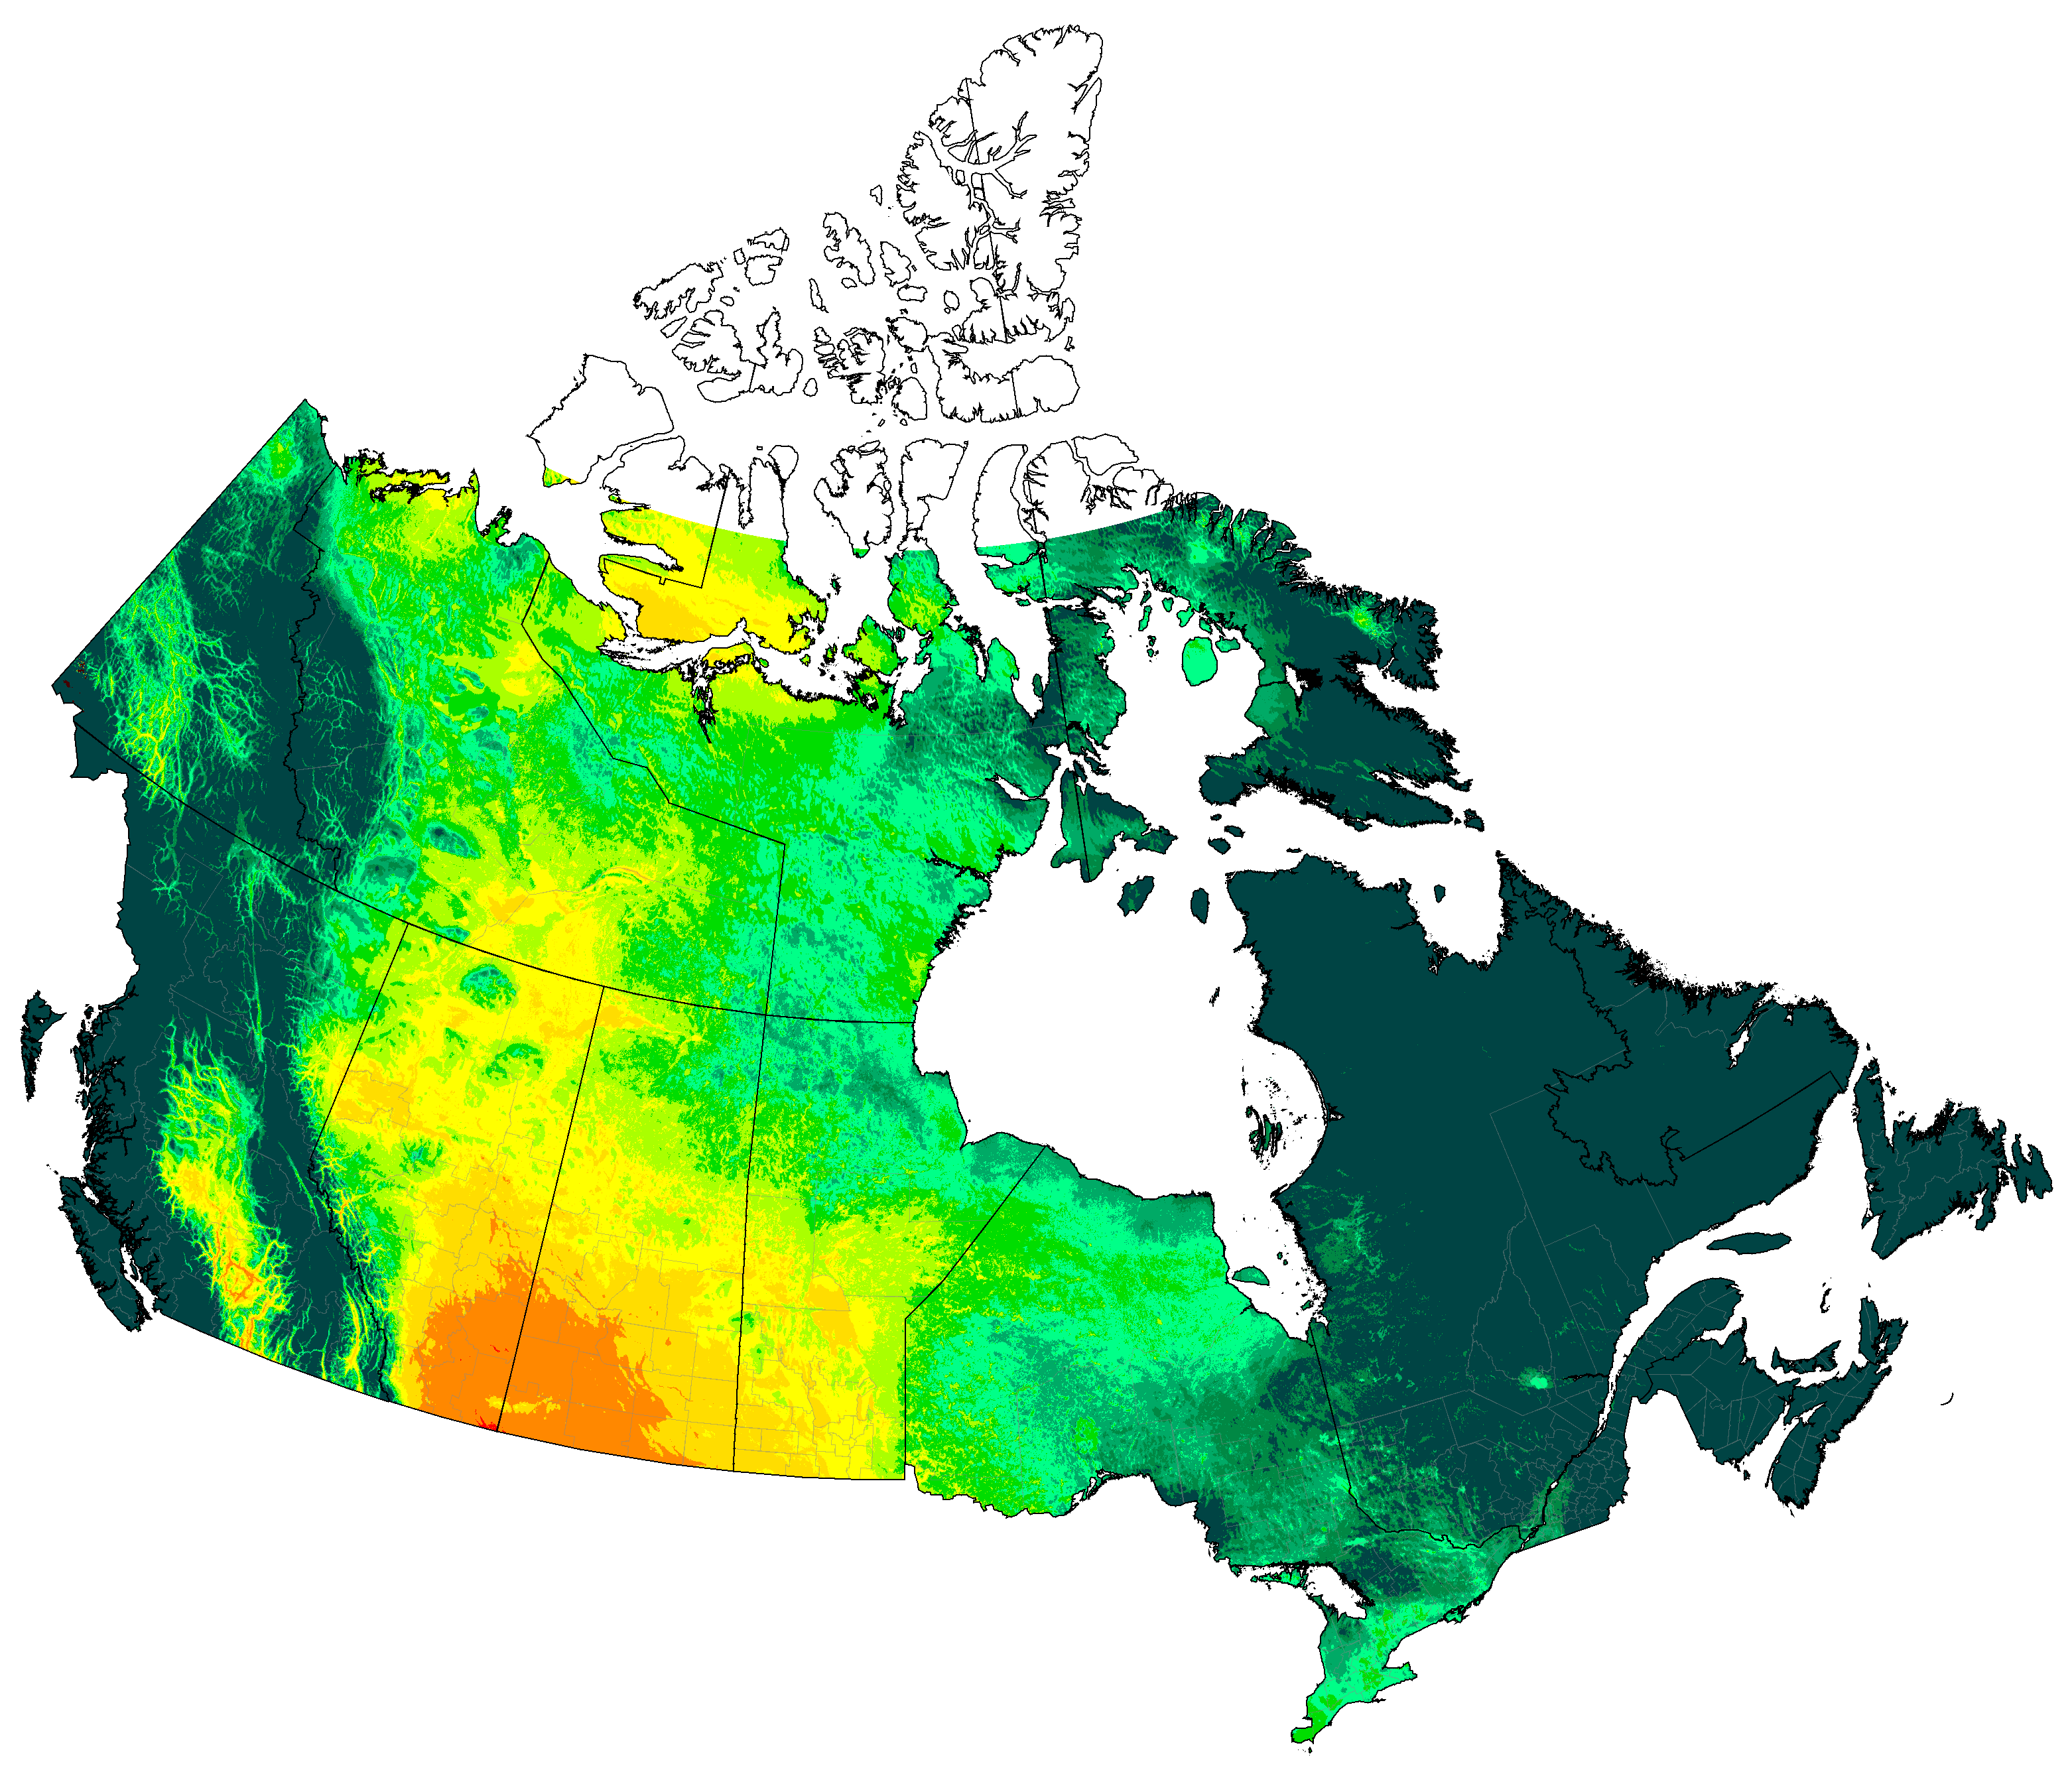
Canada distribution of P/PET (projections are SSP5-8.5 high emissions normals)
Note: The vertical line in the middle of Nunavut is a cartographic artifact, not a political boundary.
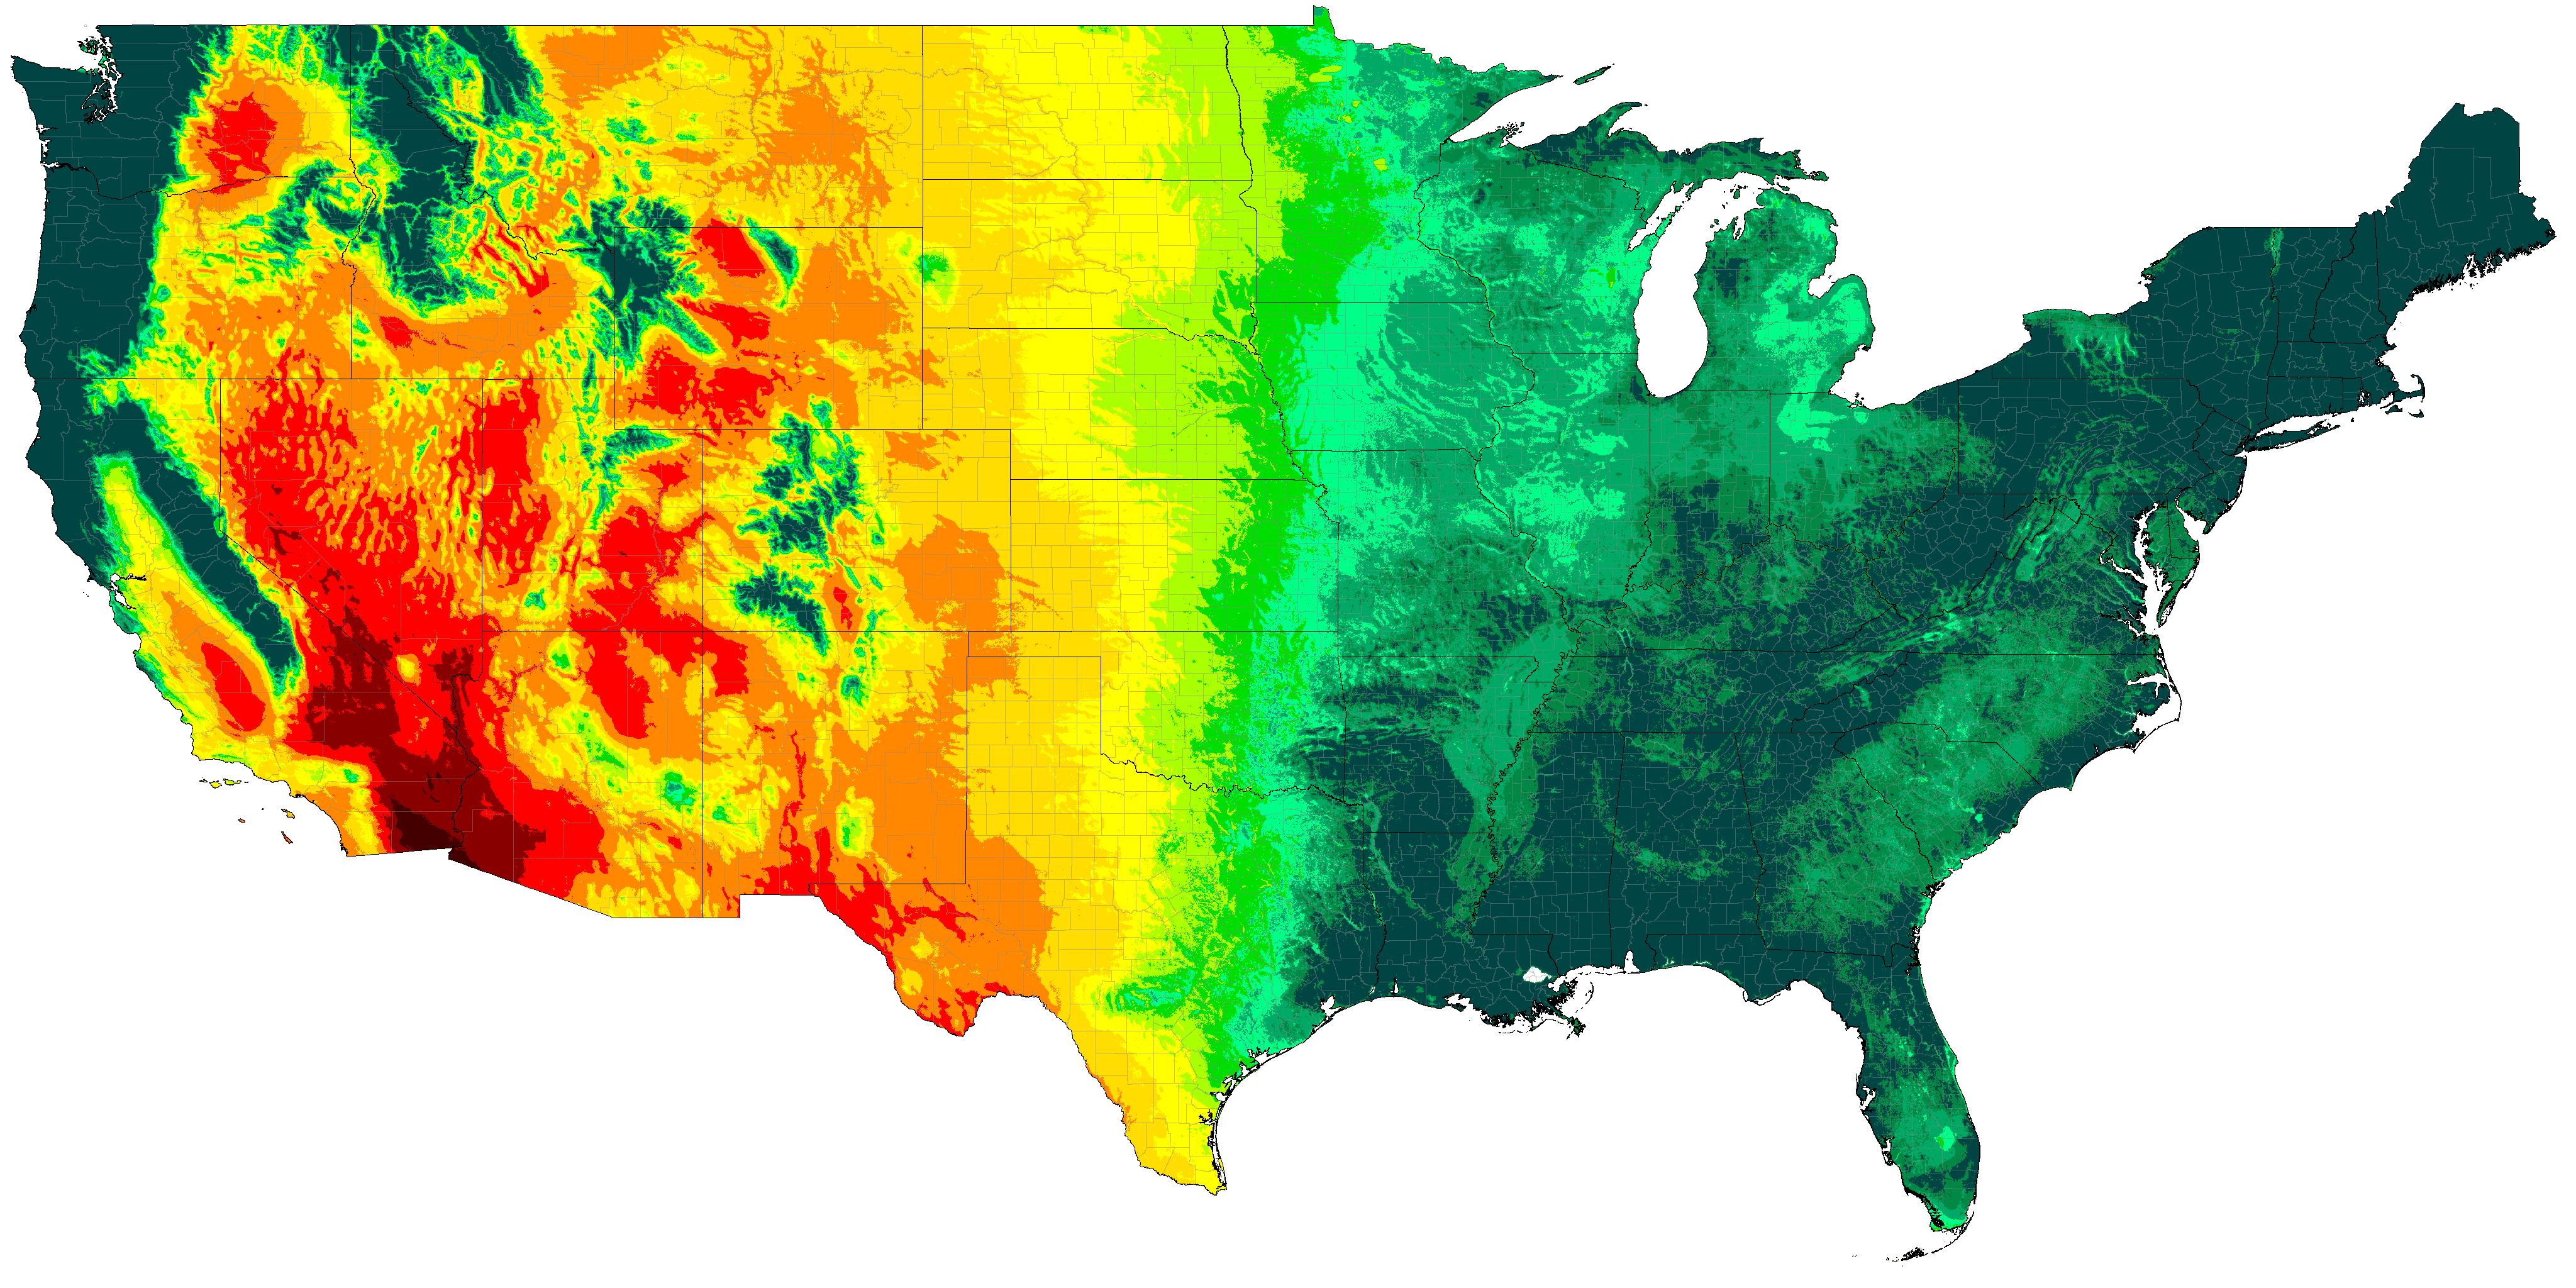
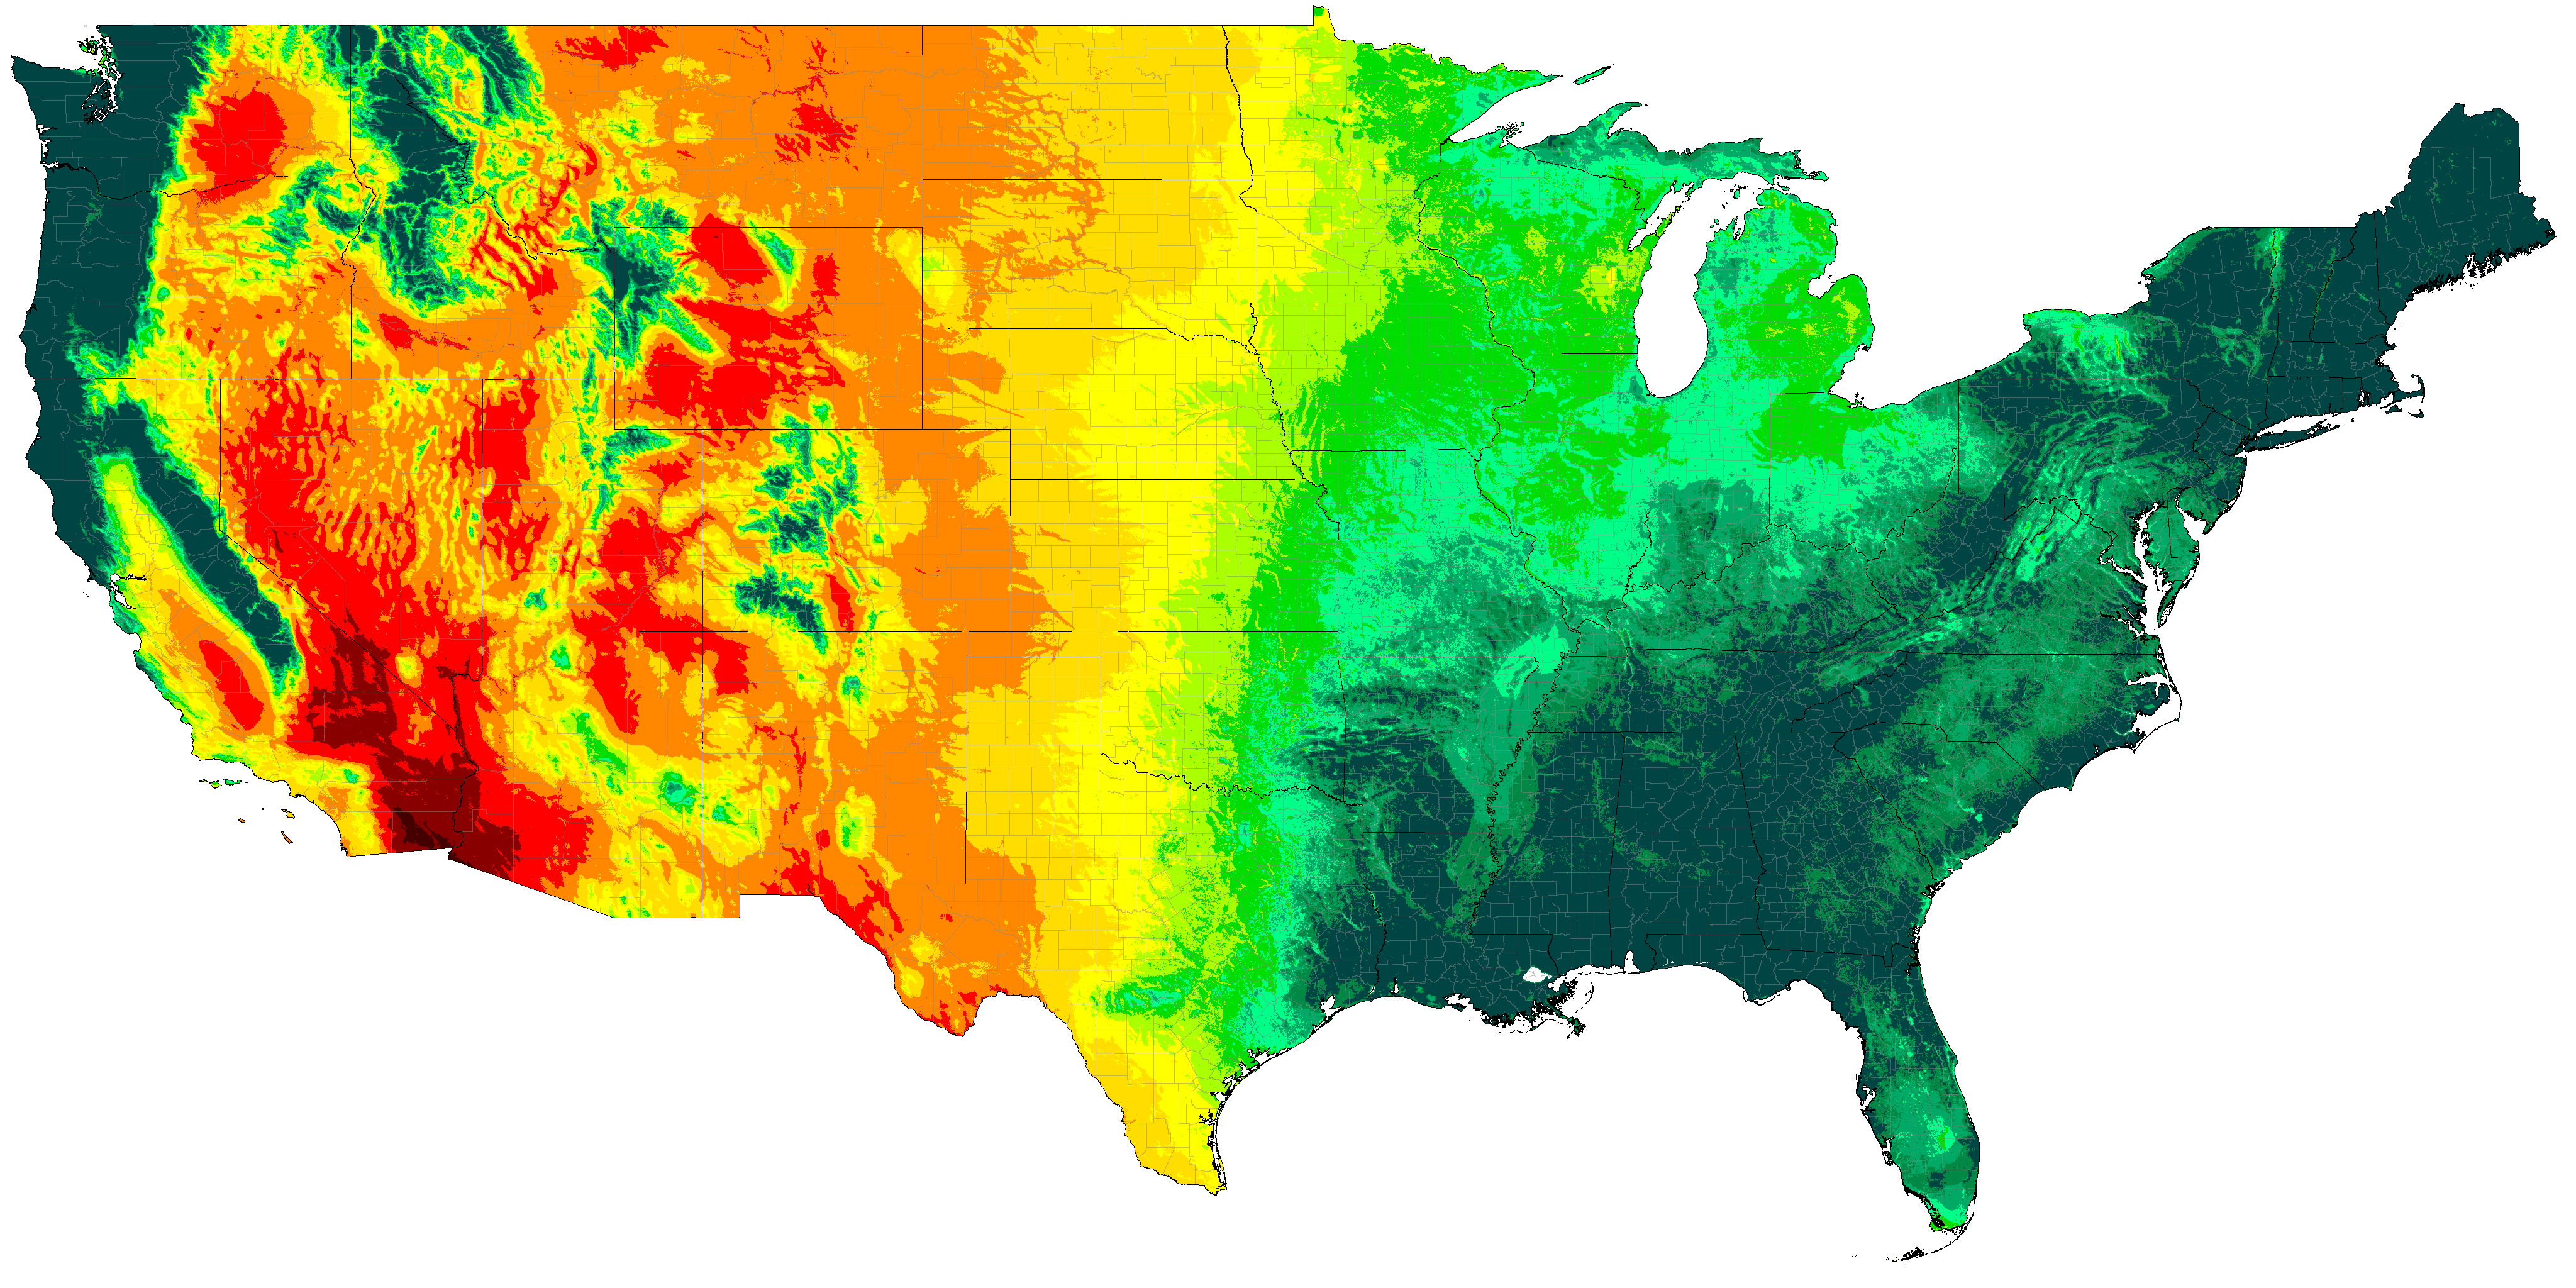
Contiguous United States distribution of P/PET (projections are SSP5-8.5 high emissions normals)
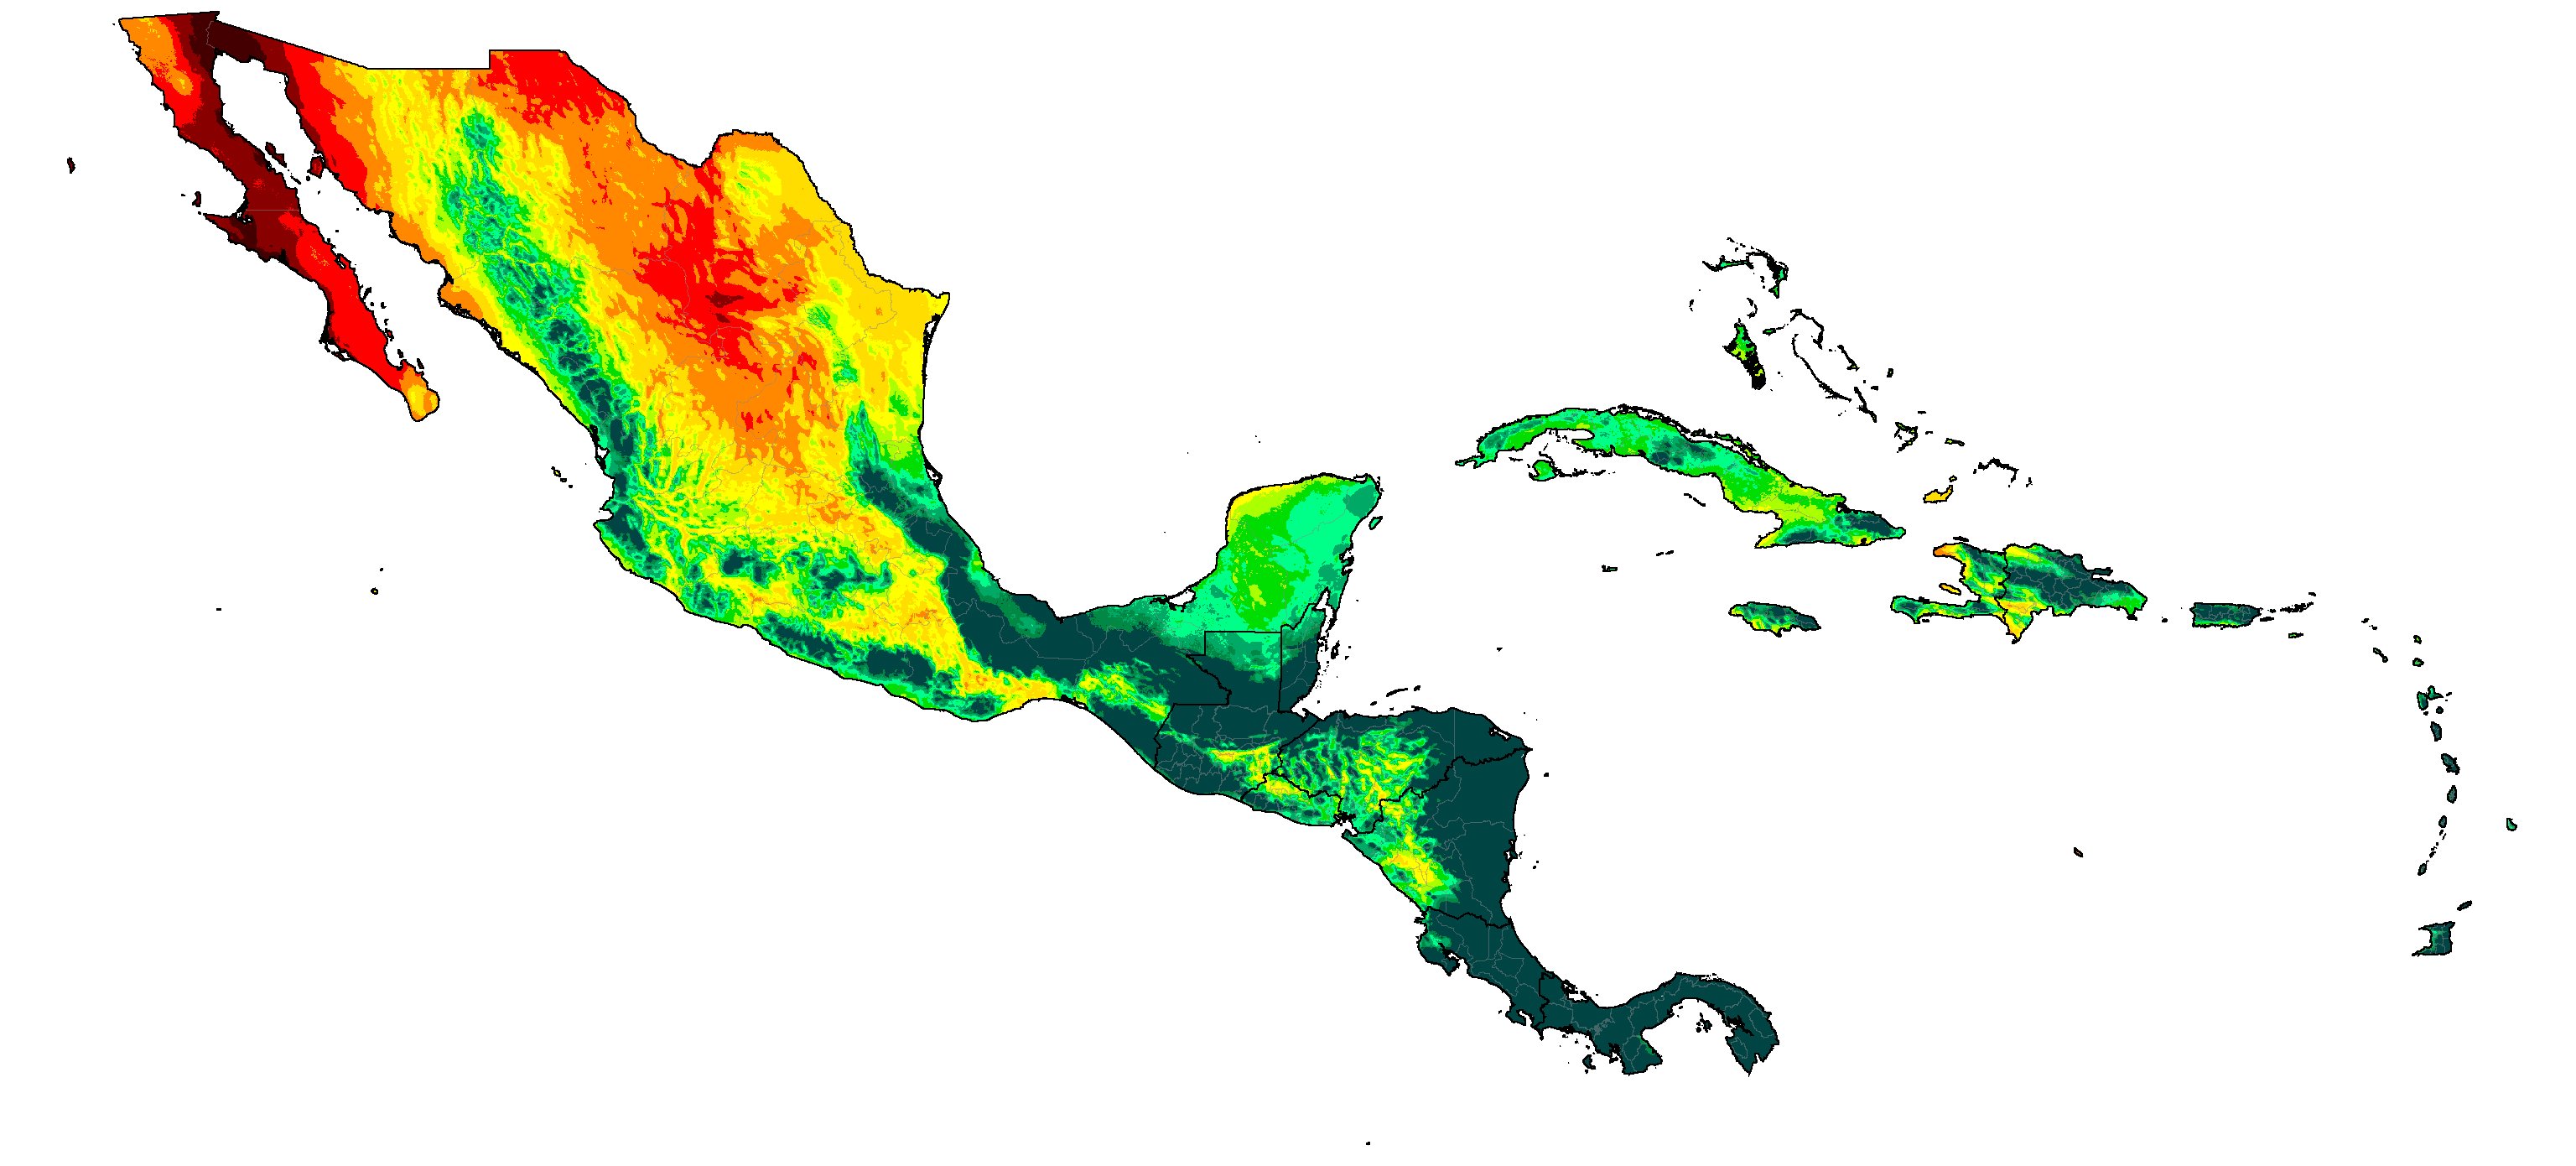
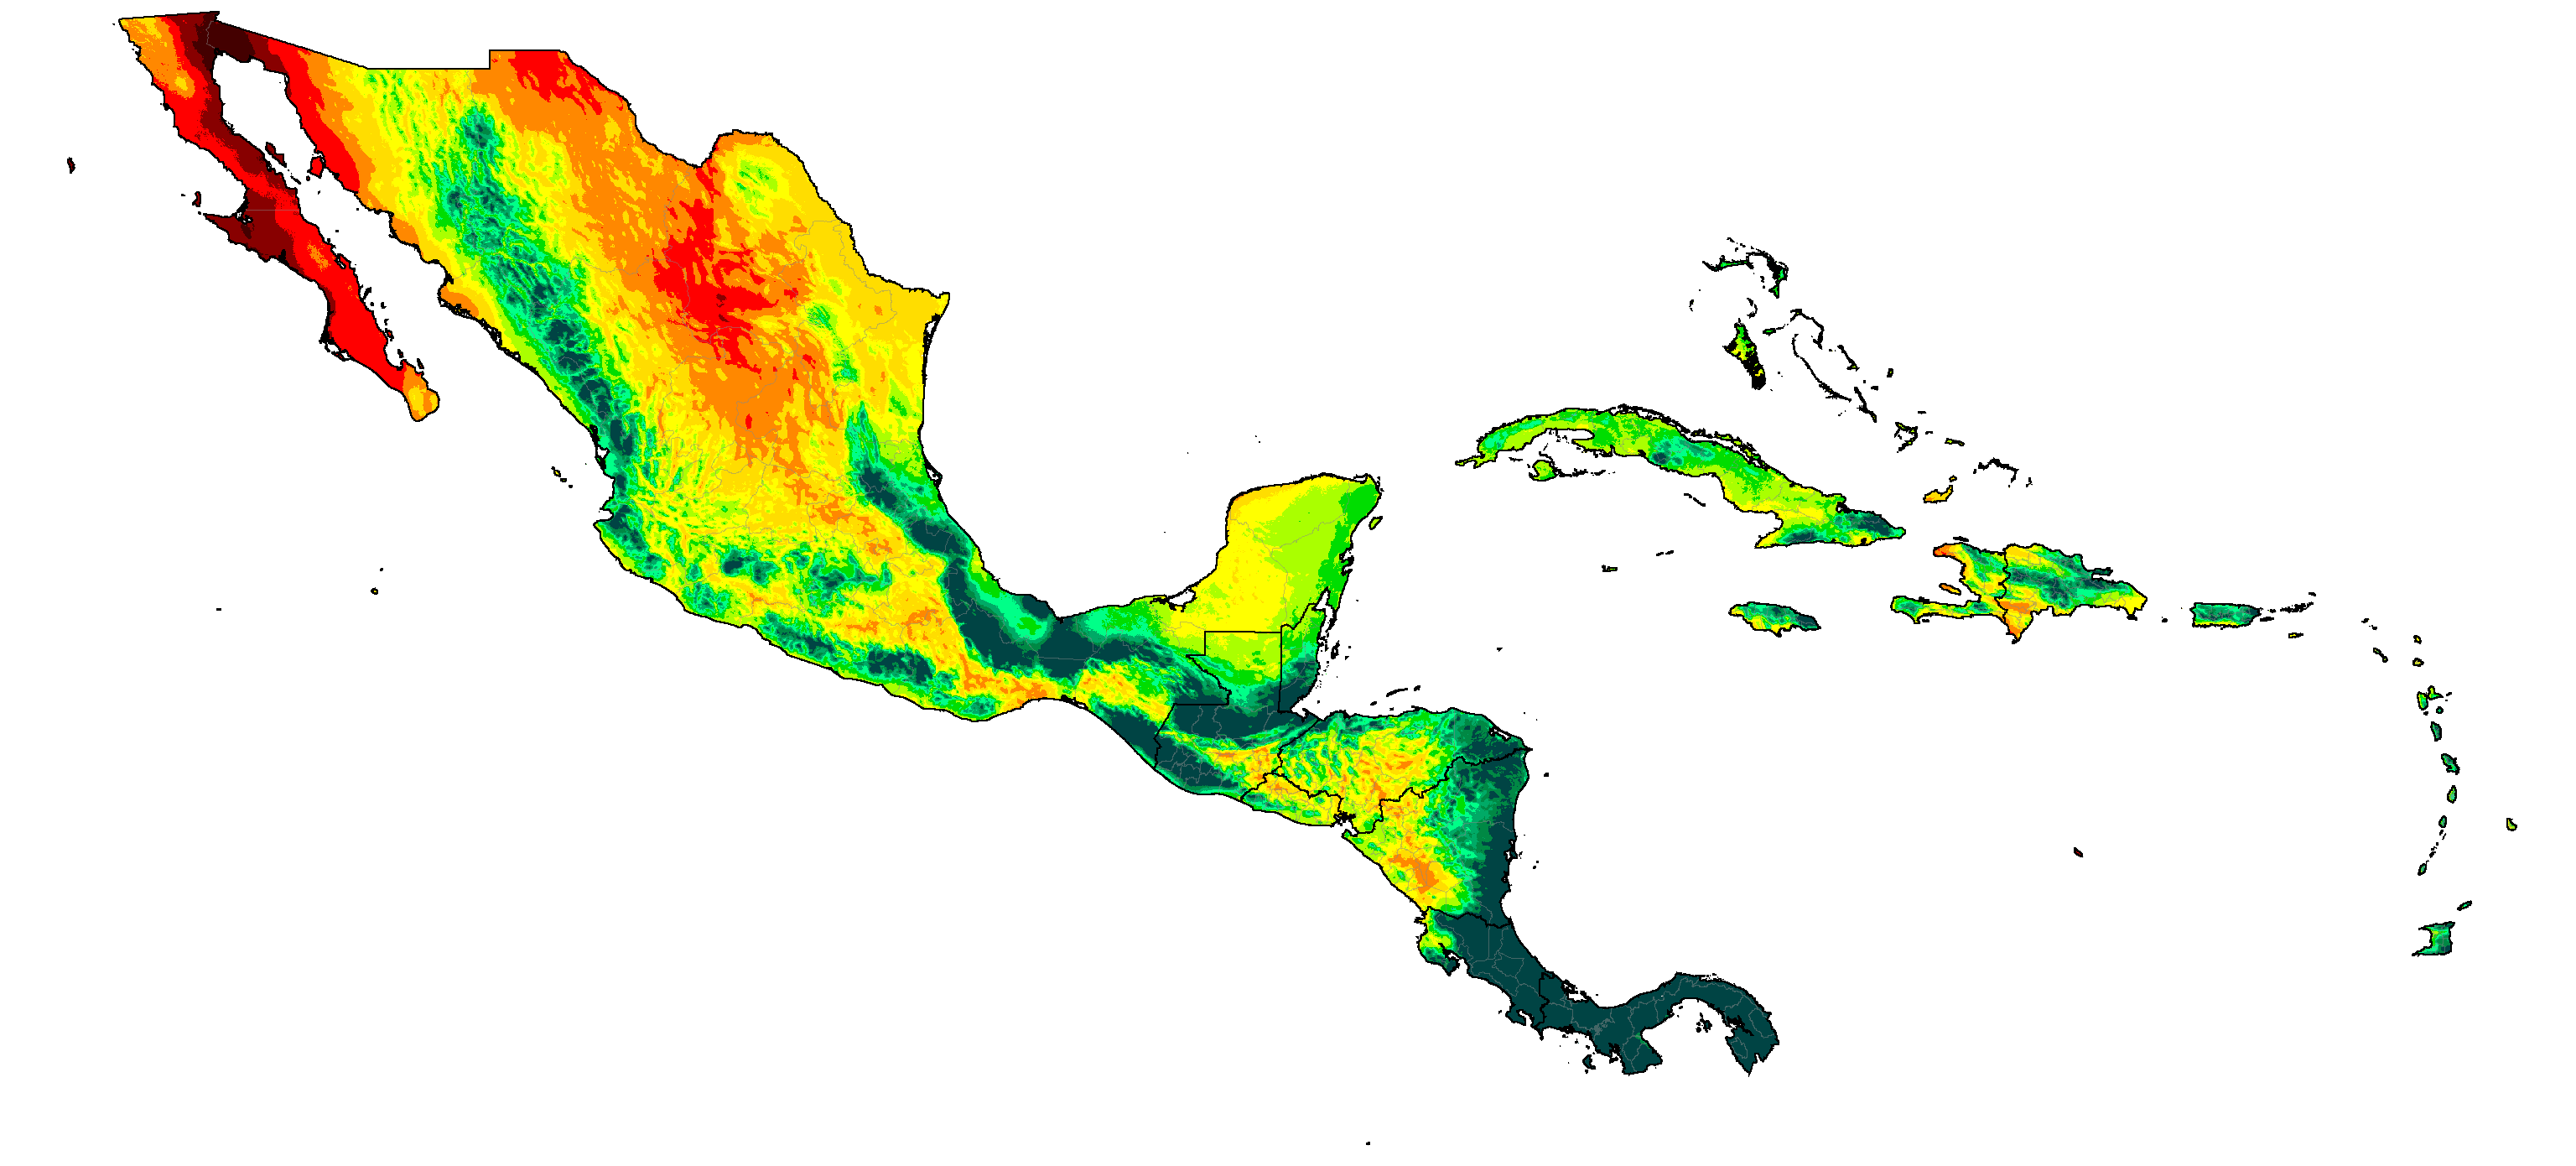
Mexico, Central America & the Carribean distribution of P/PET (projections are SSP5-8.5 high emissions normals)
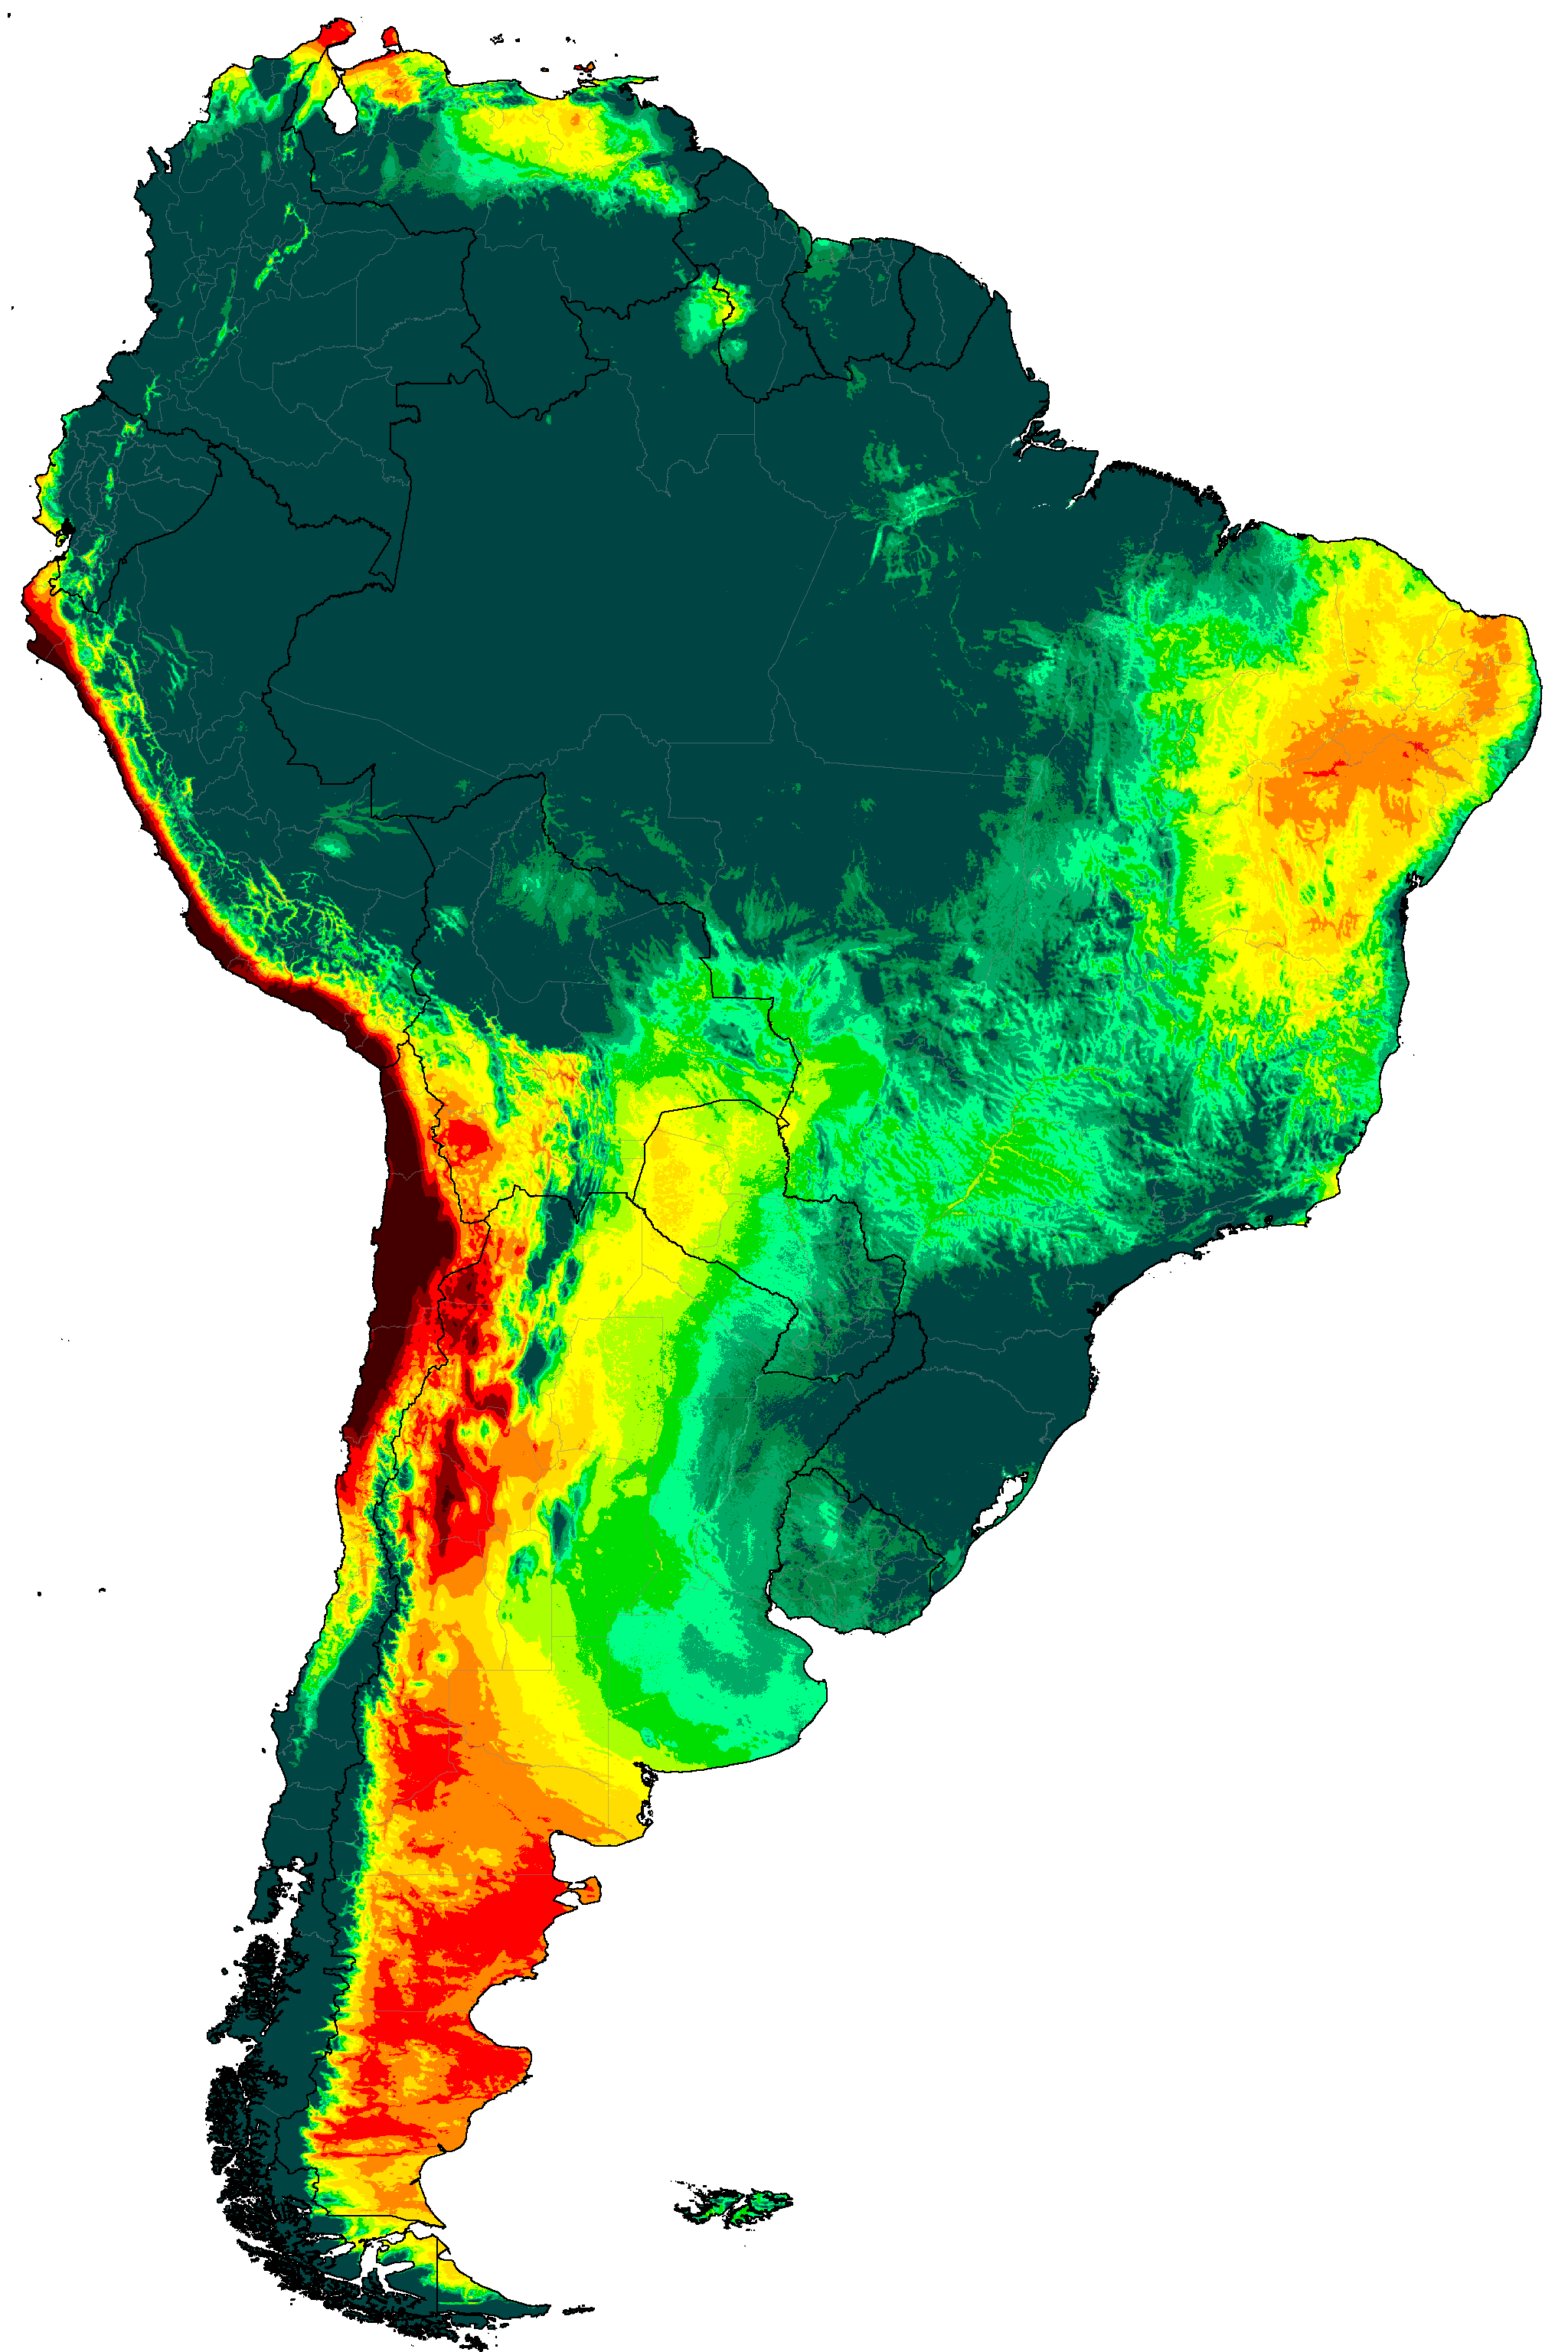
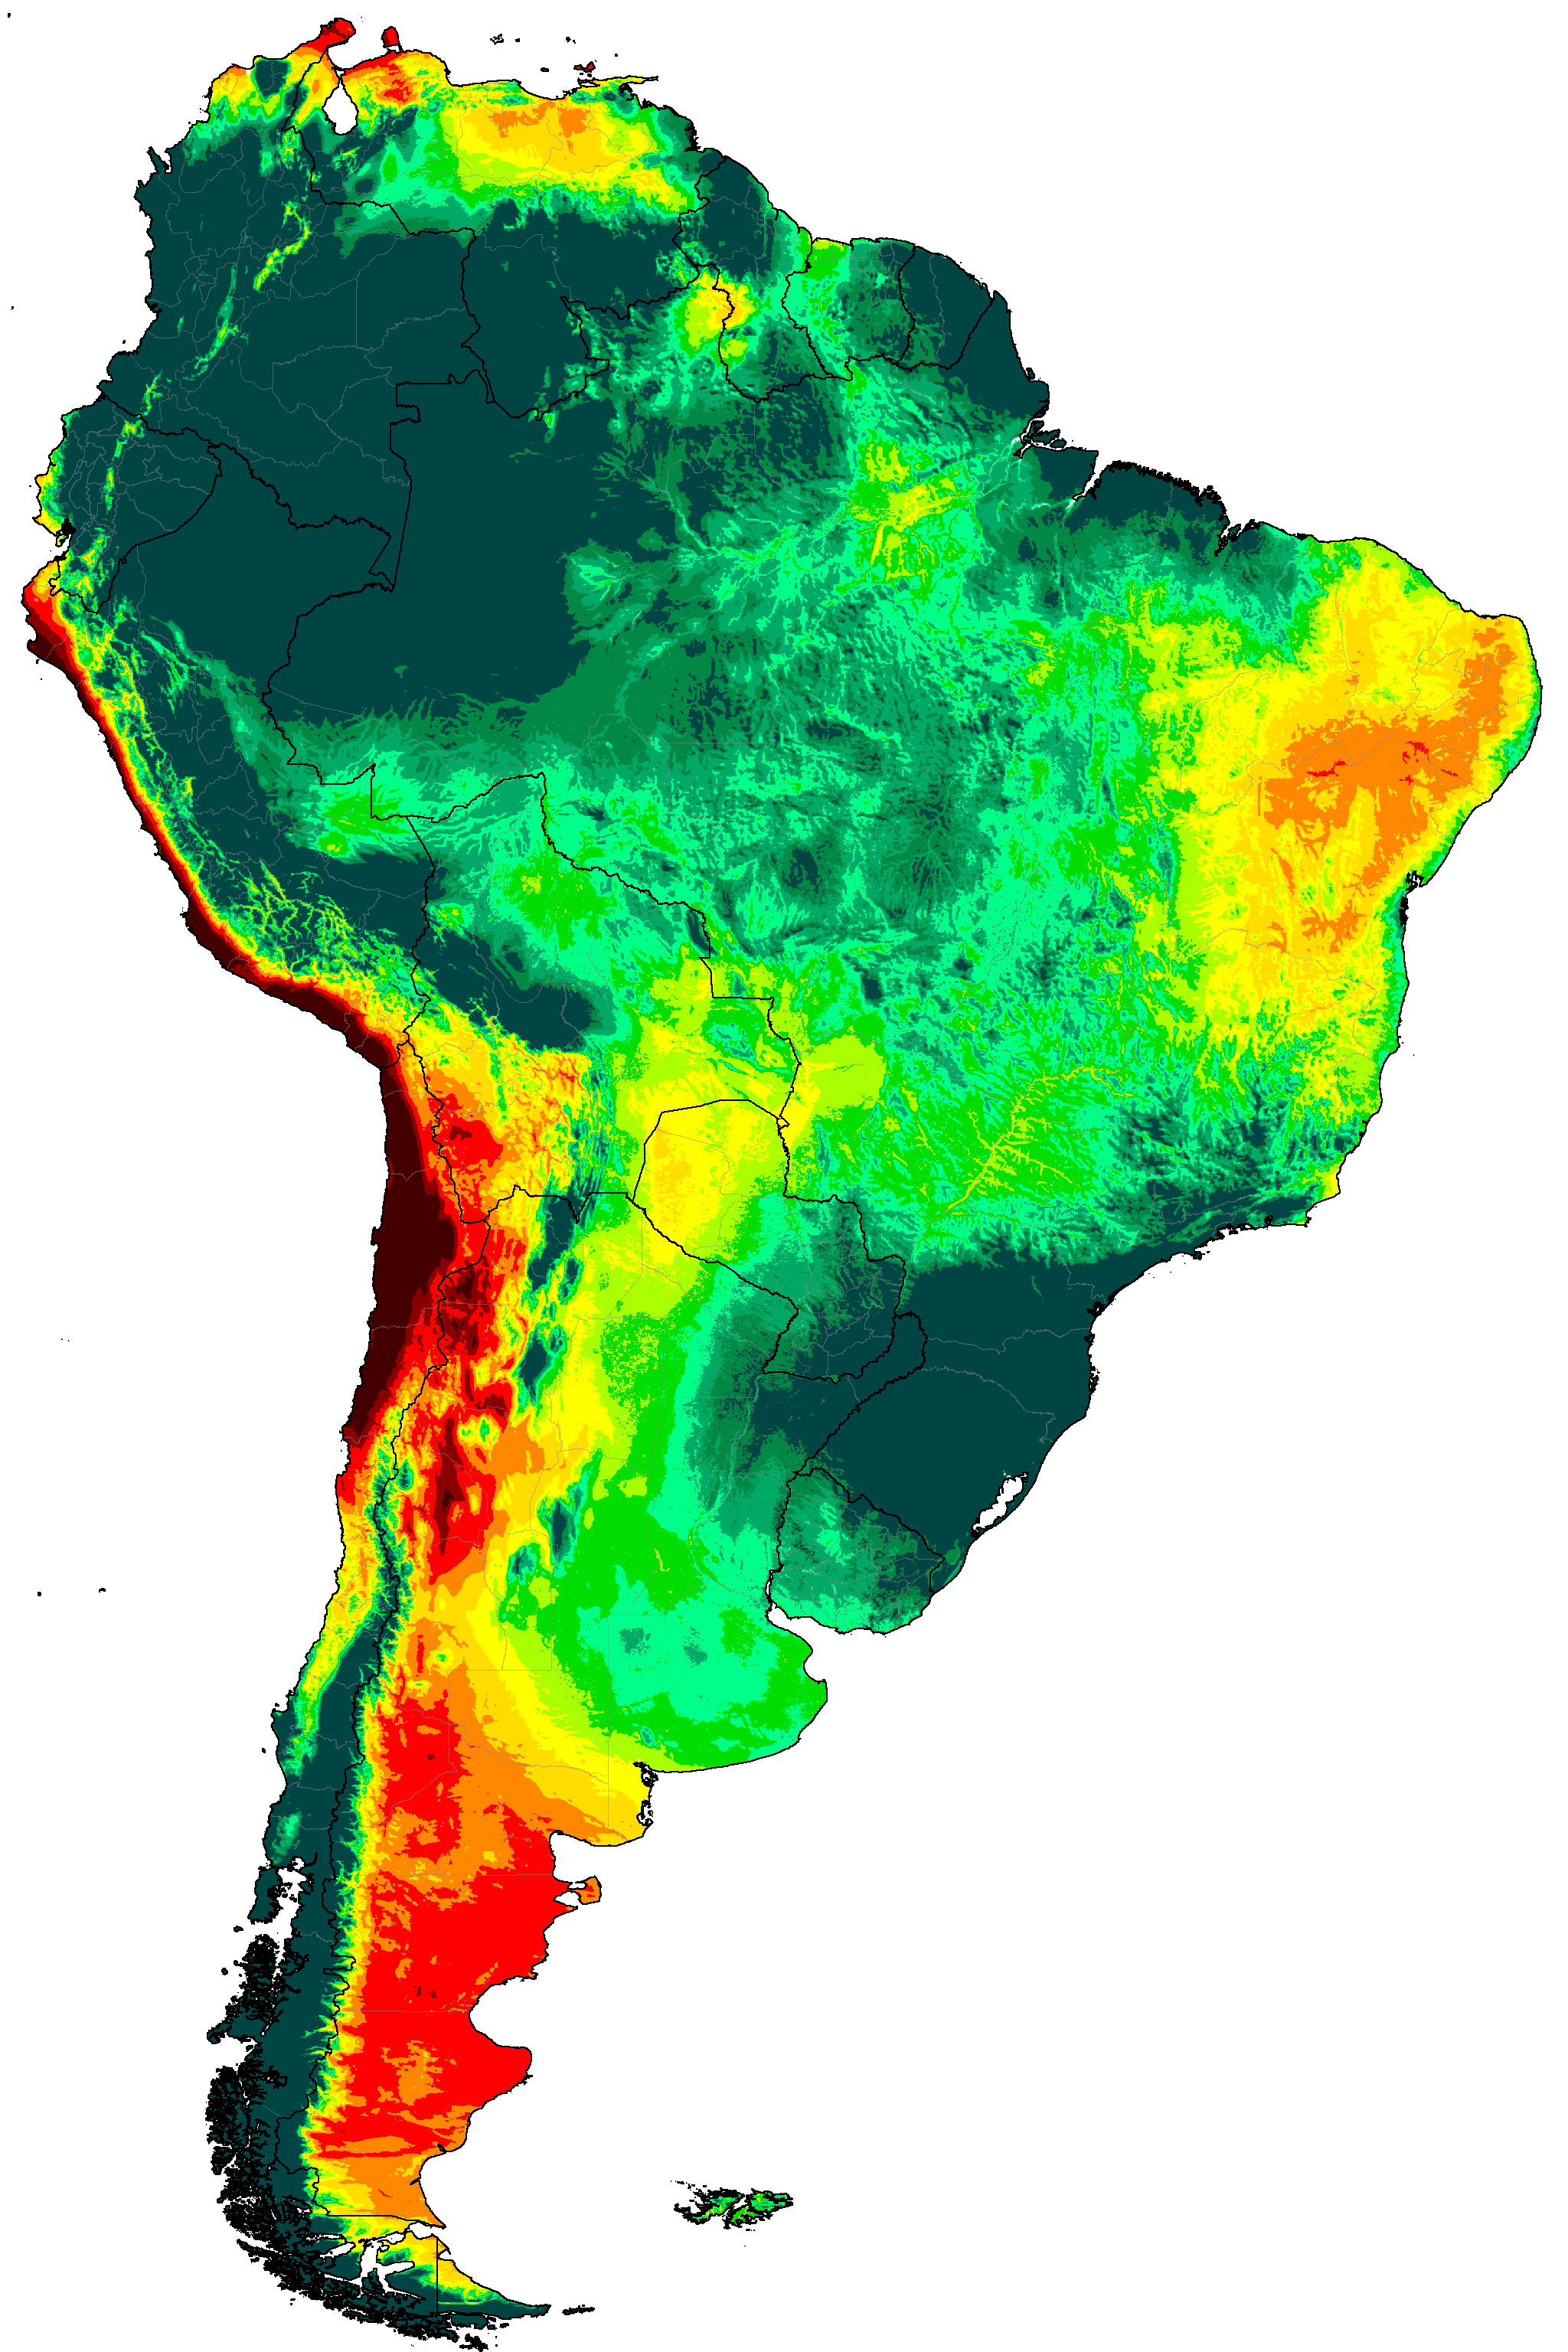
South America distribution of P/PET (projections are SSP5-8.5 high emissions normals)
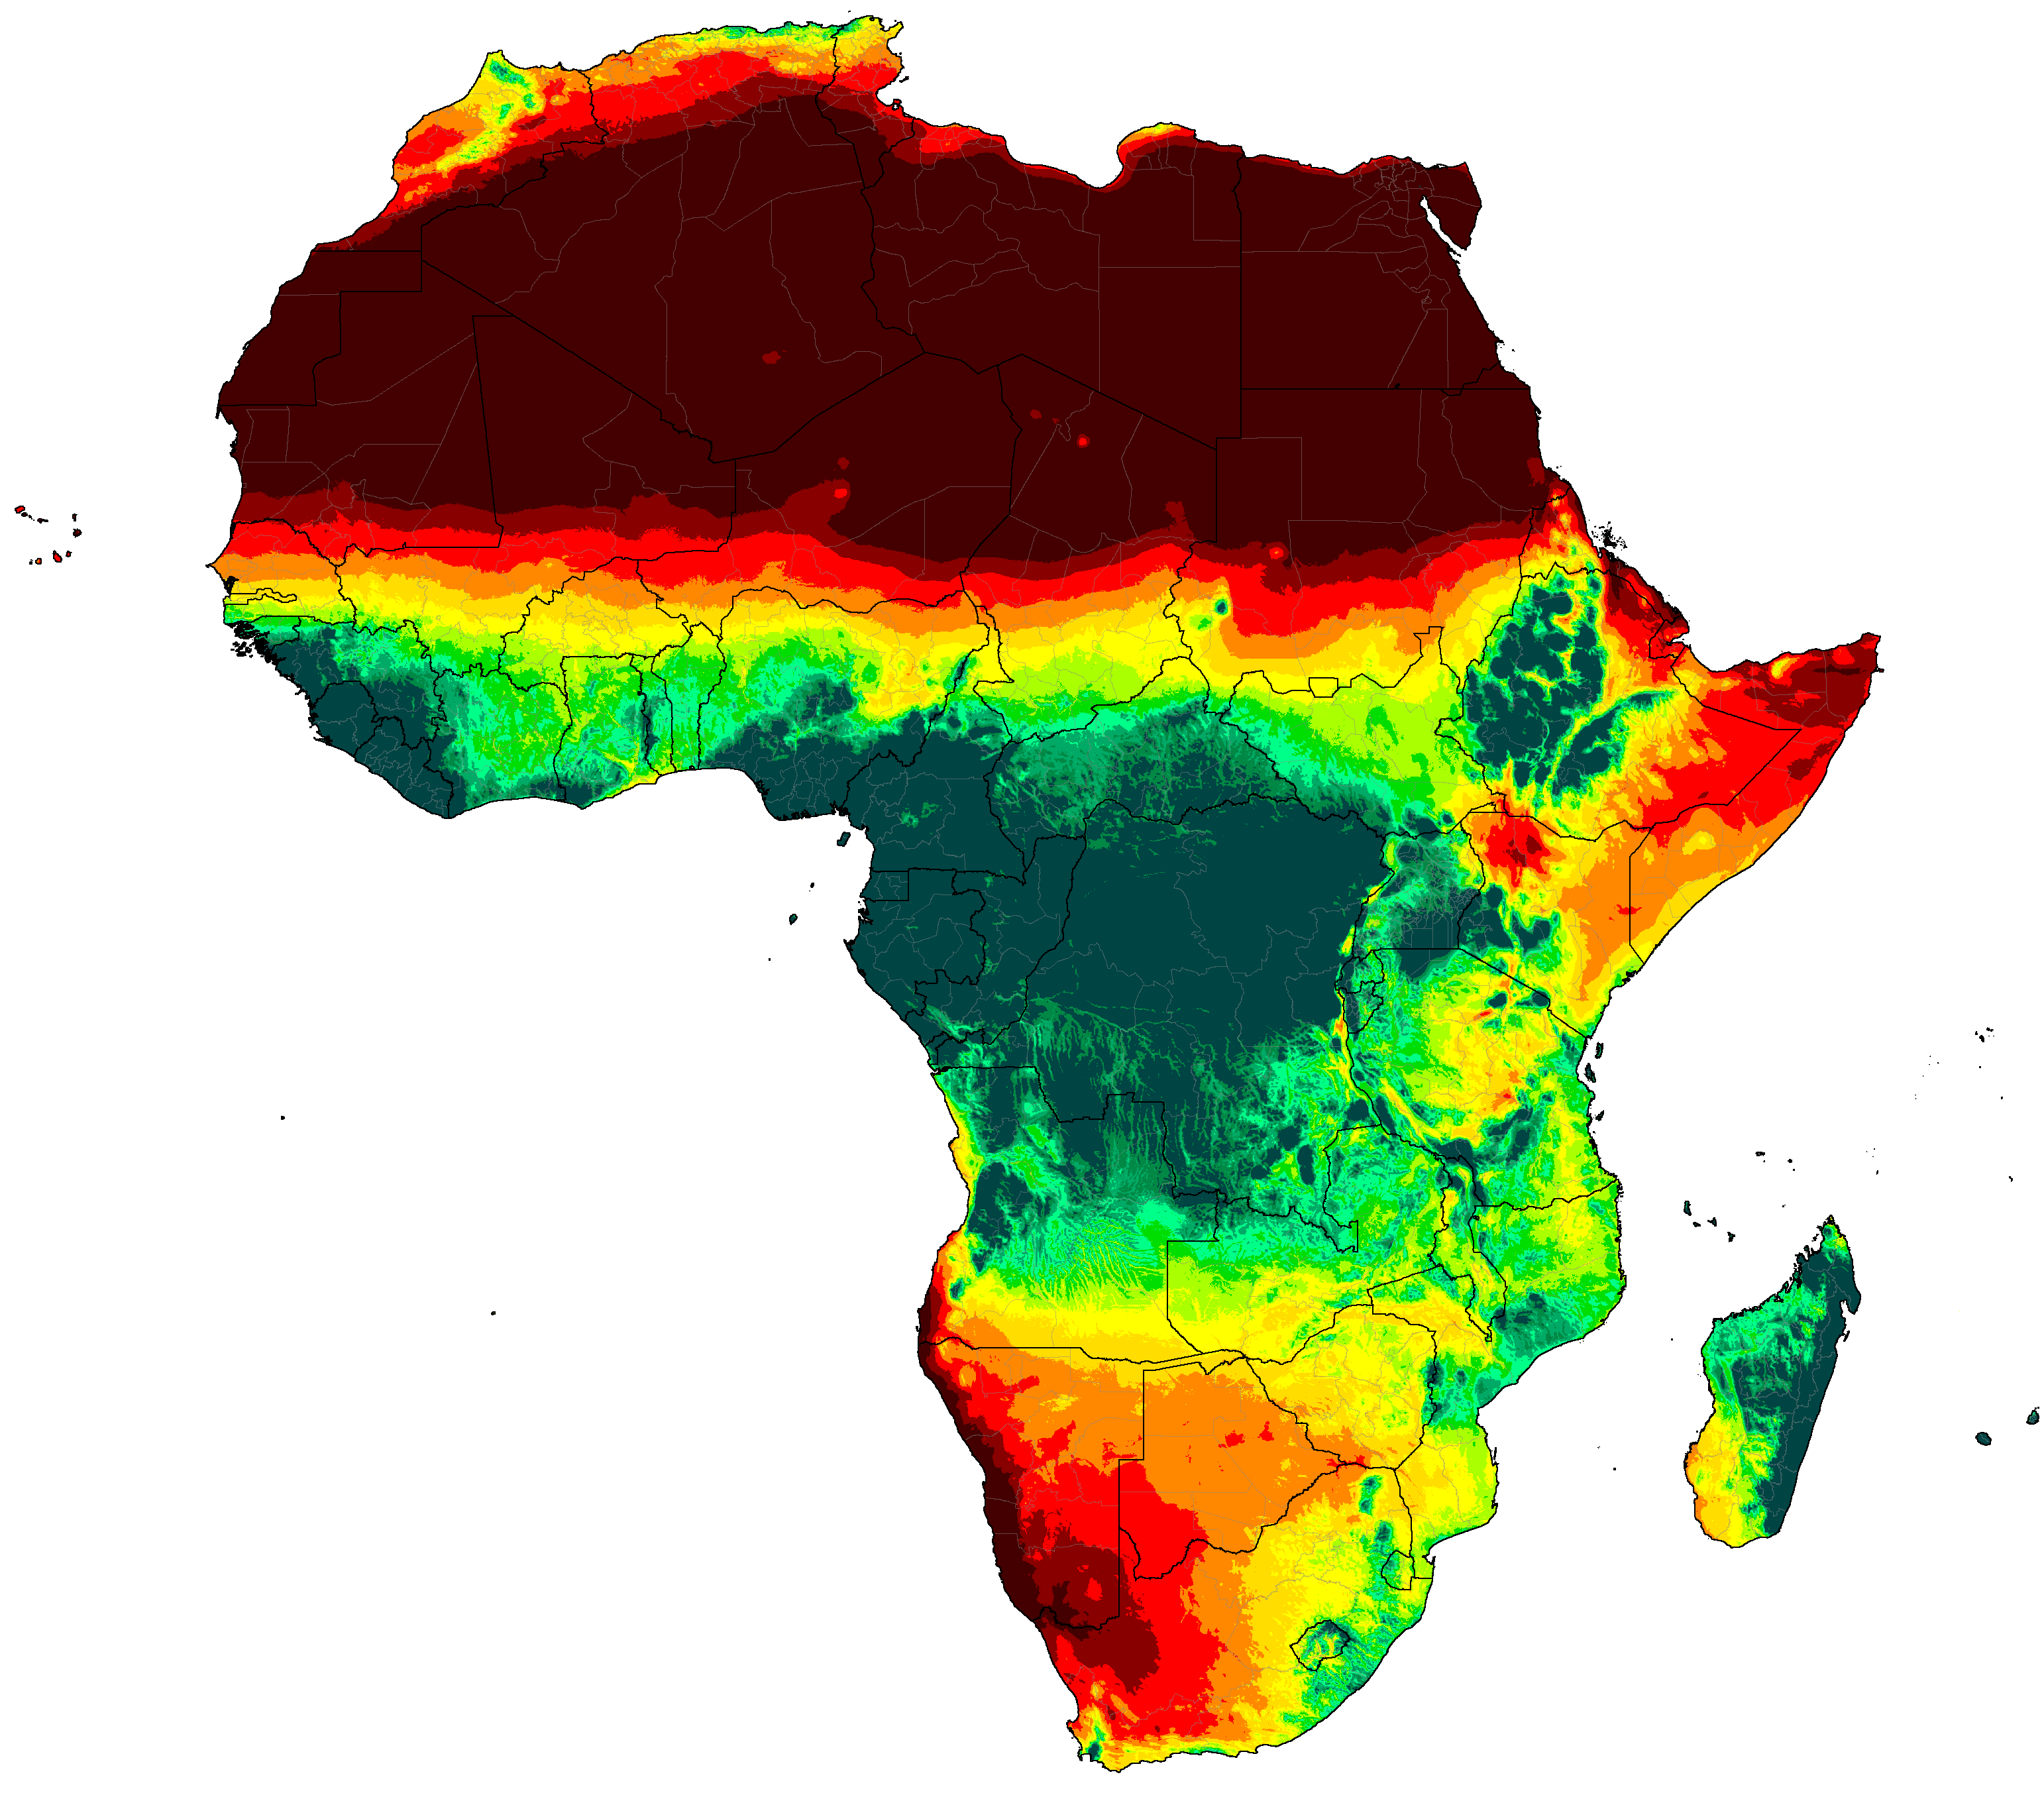
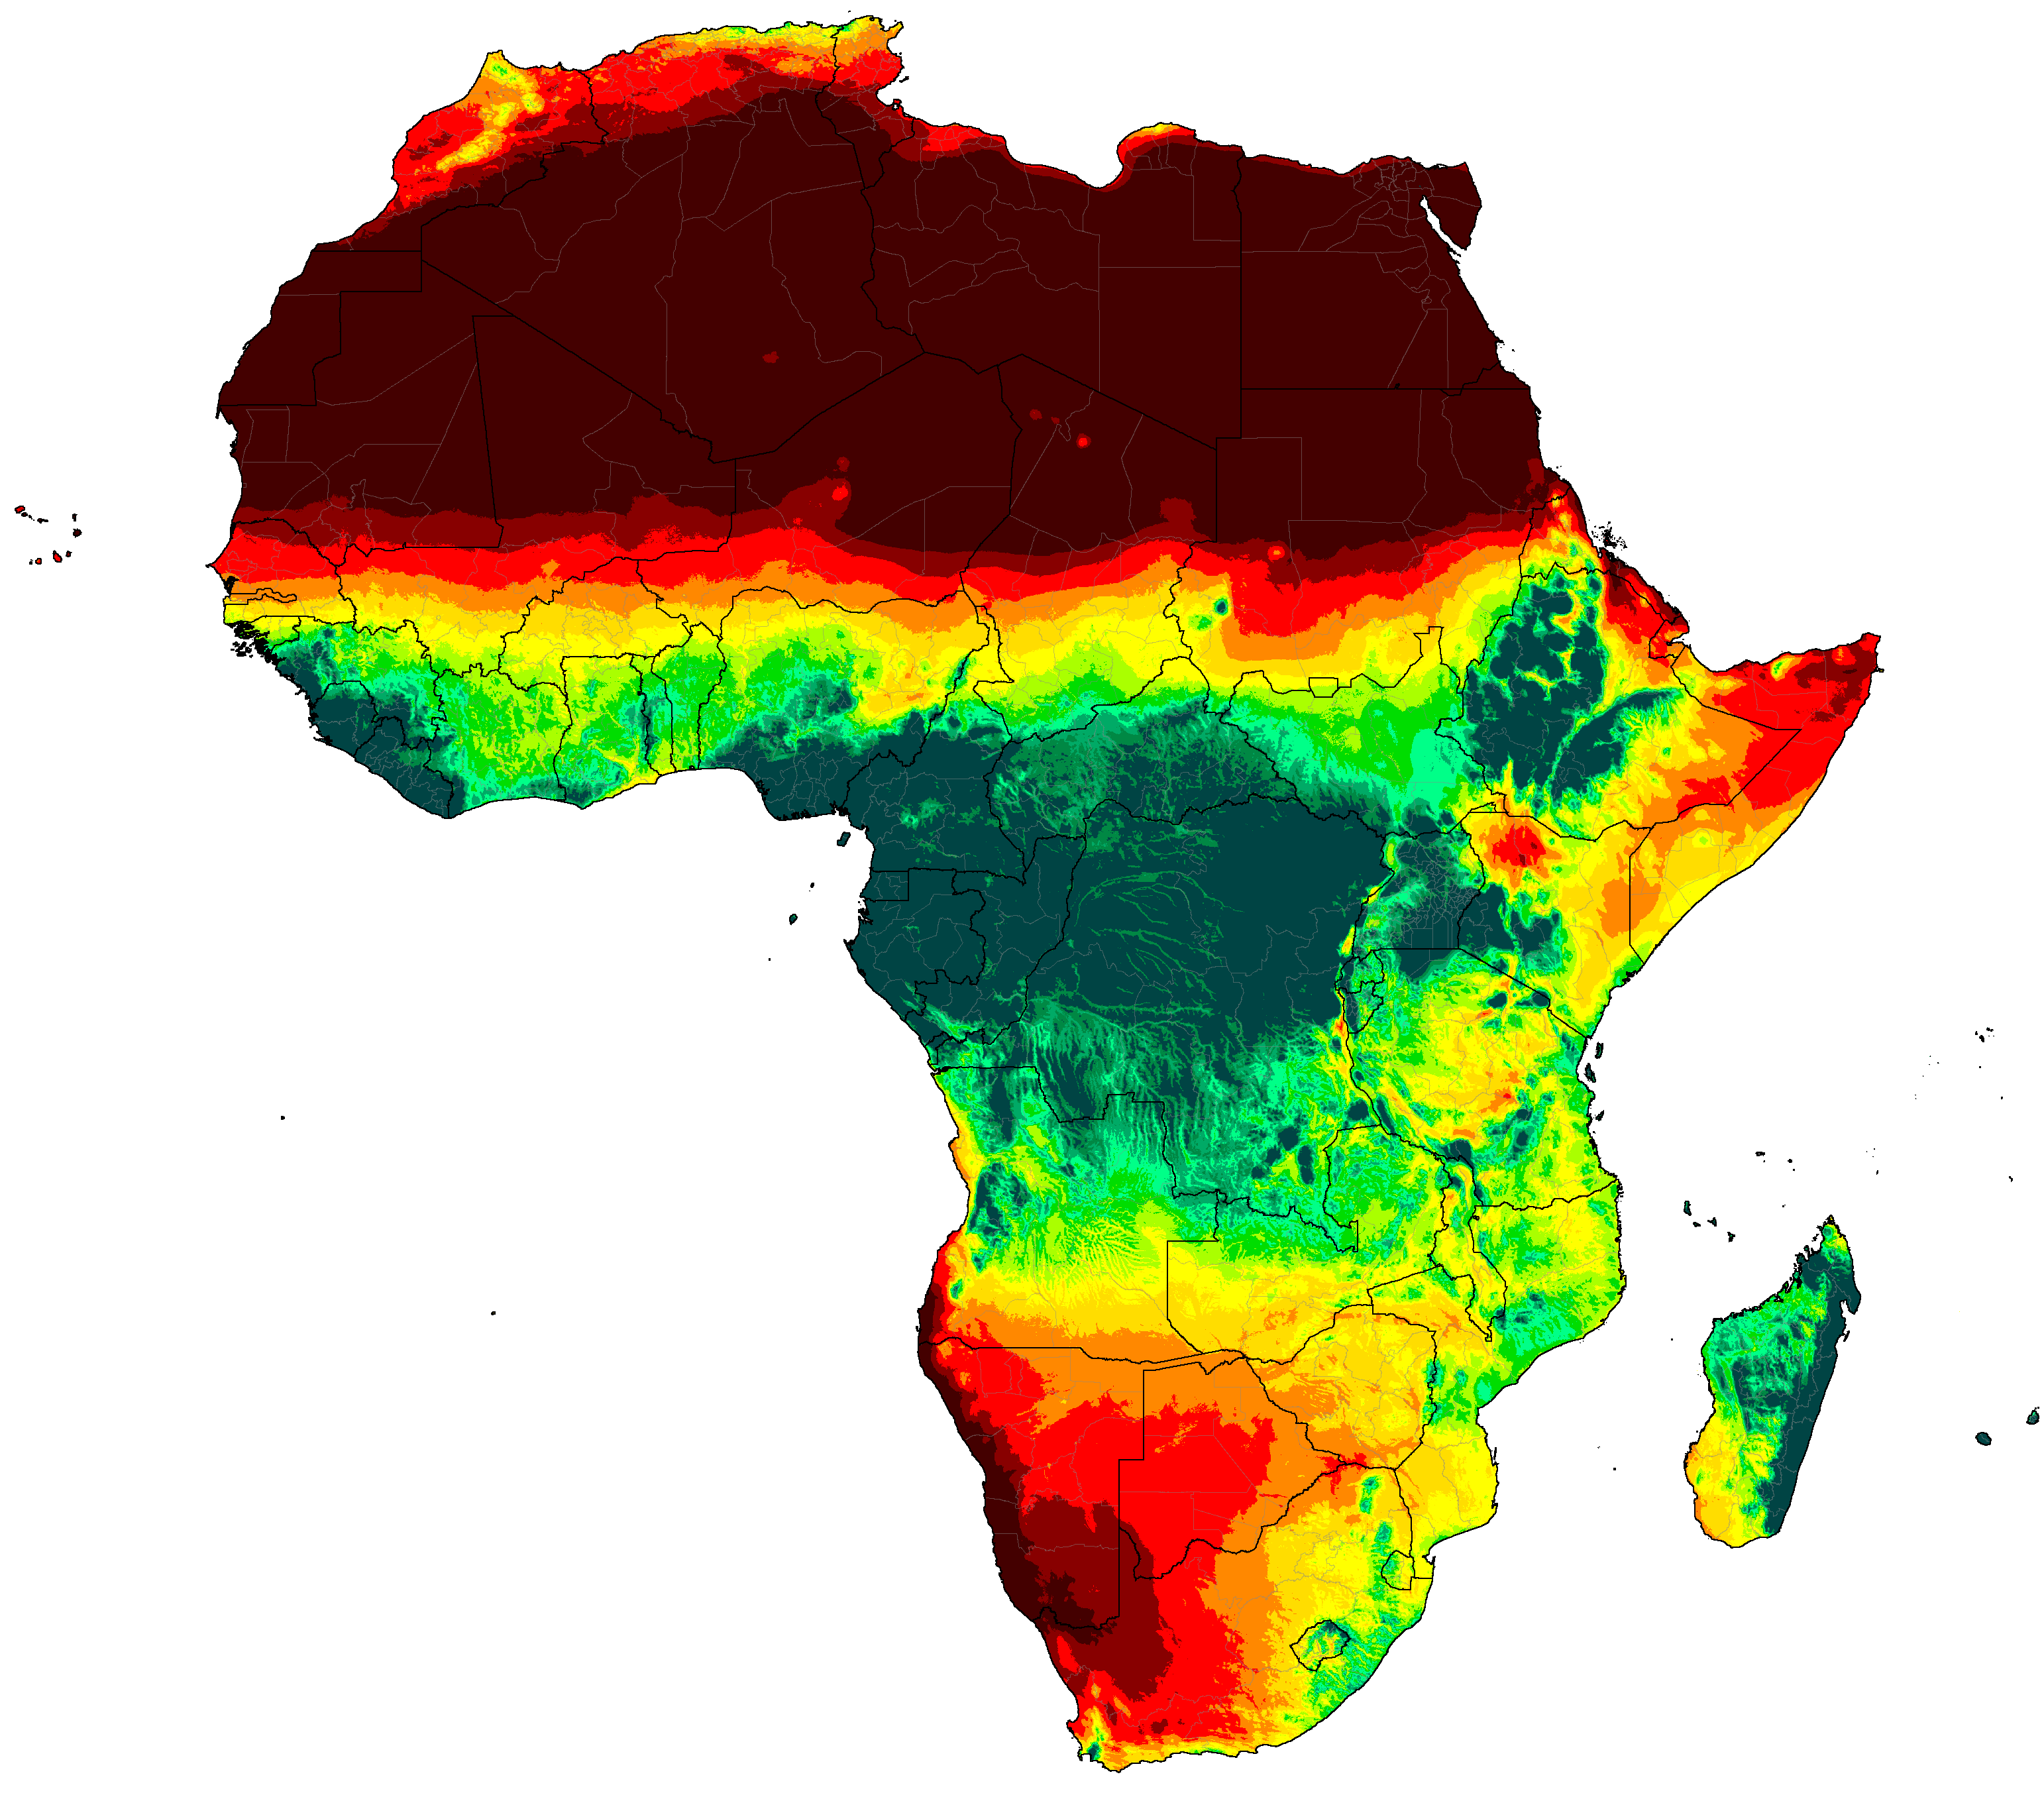
Africa distribution of P/PET (projections are SSP5-8.5 high emissions normals)
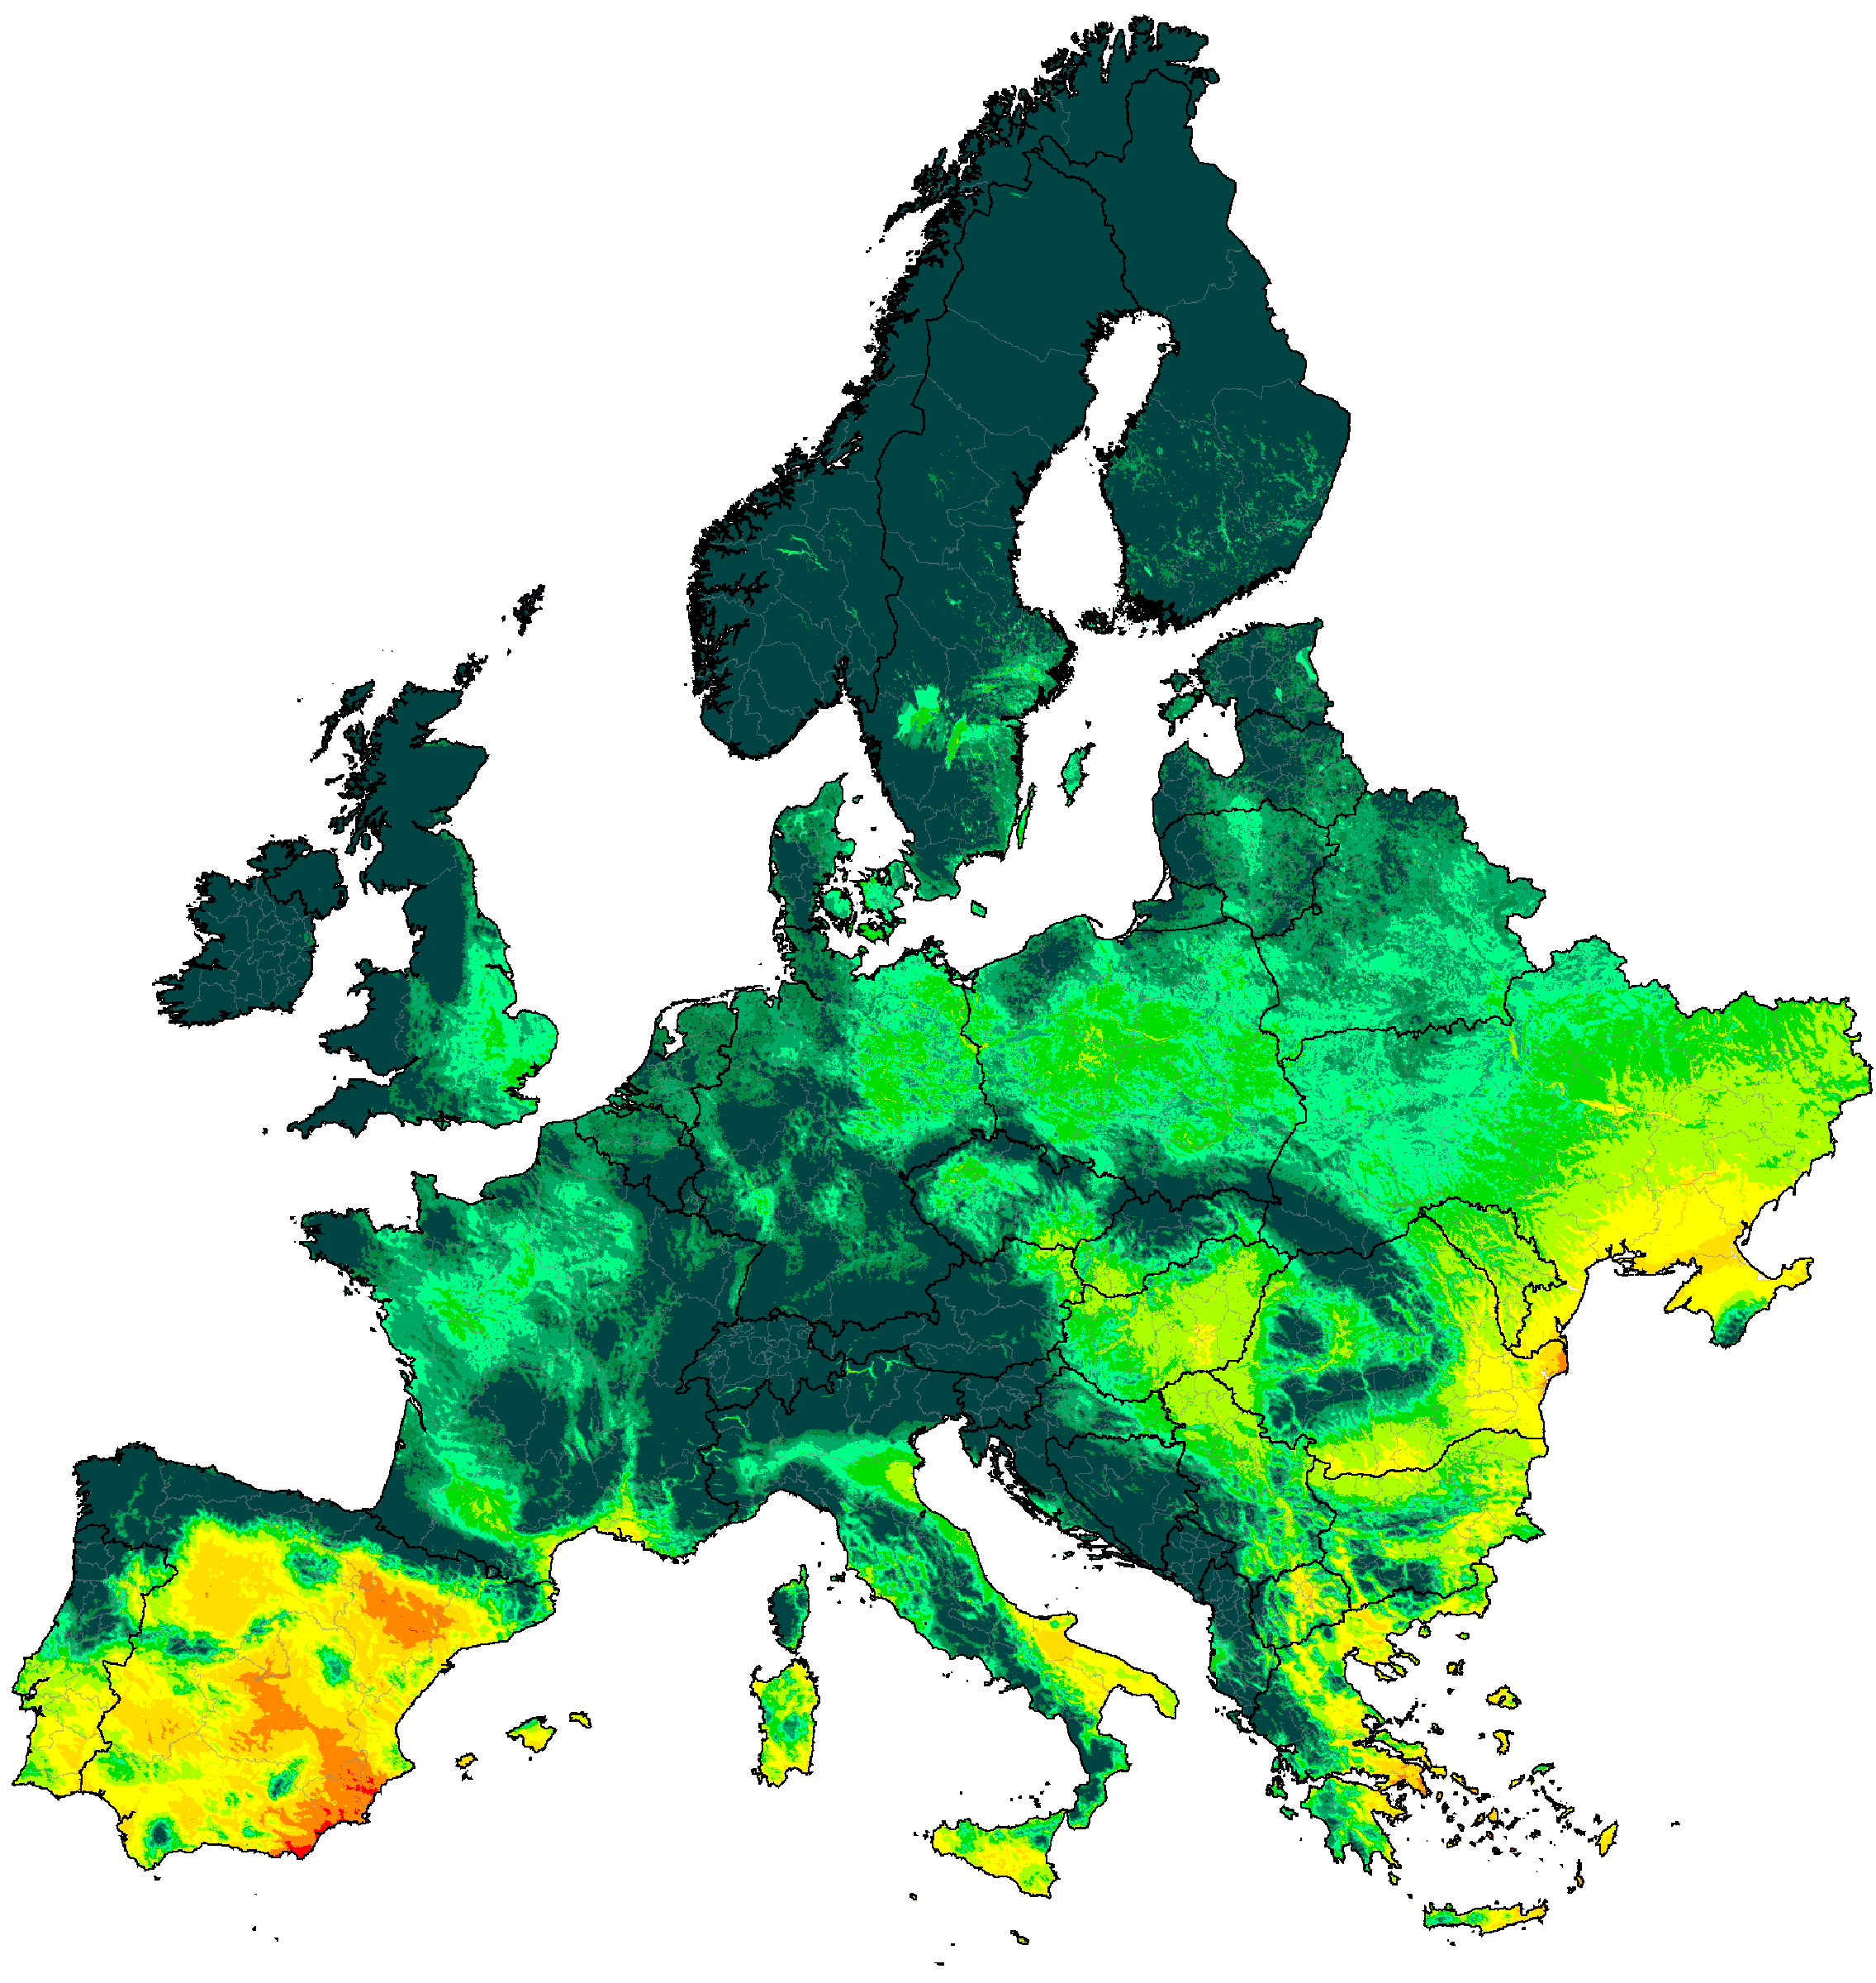
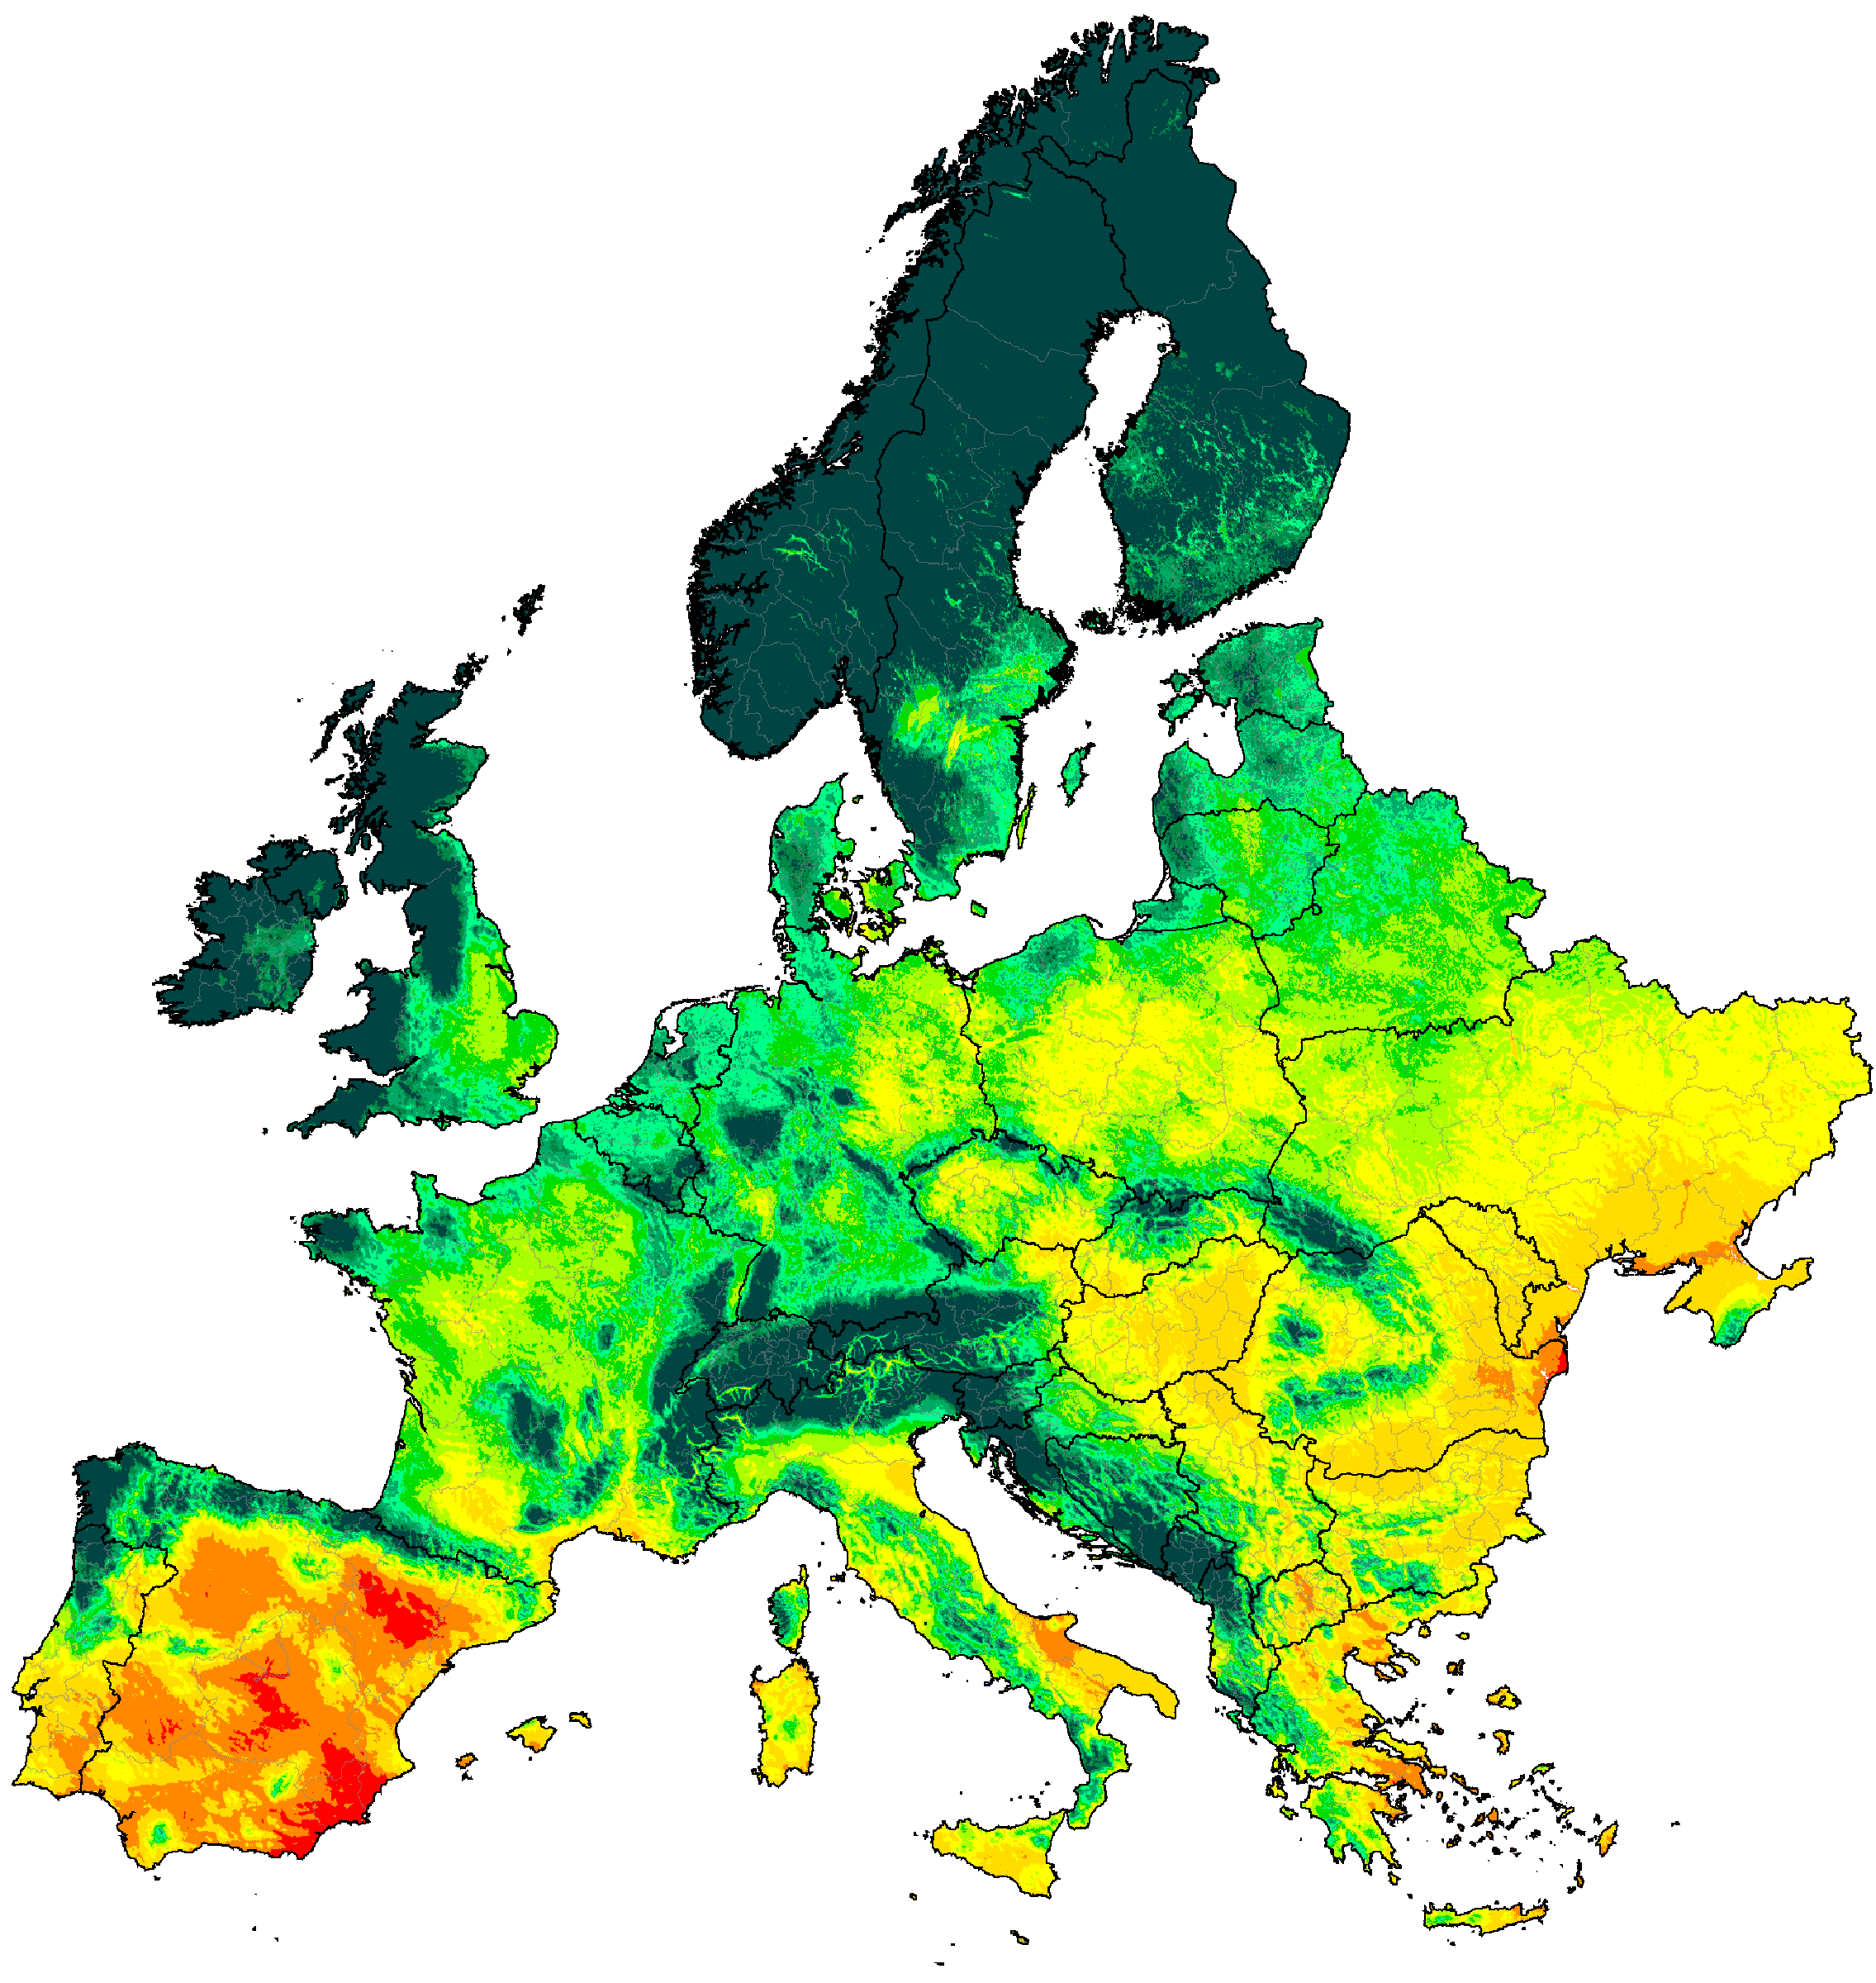
Europe distribution of P/PET (projections are SSP5-8.5 high emissions normals)
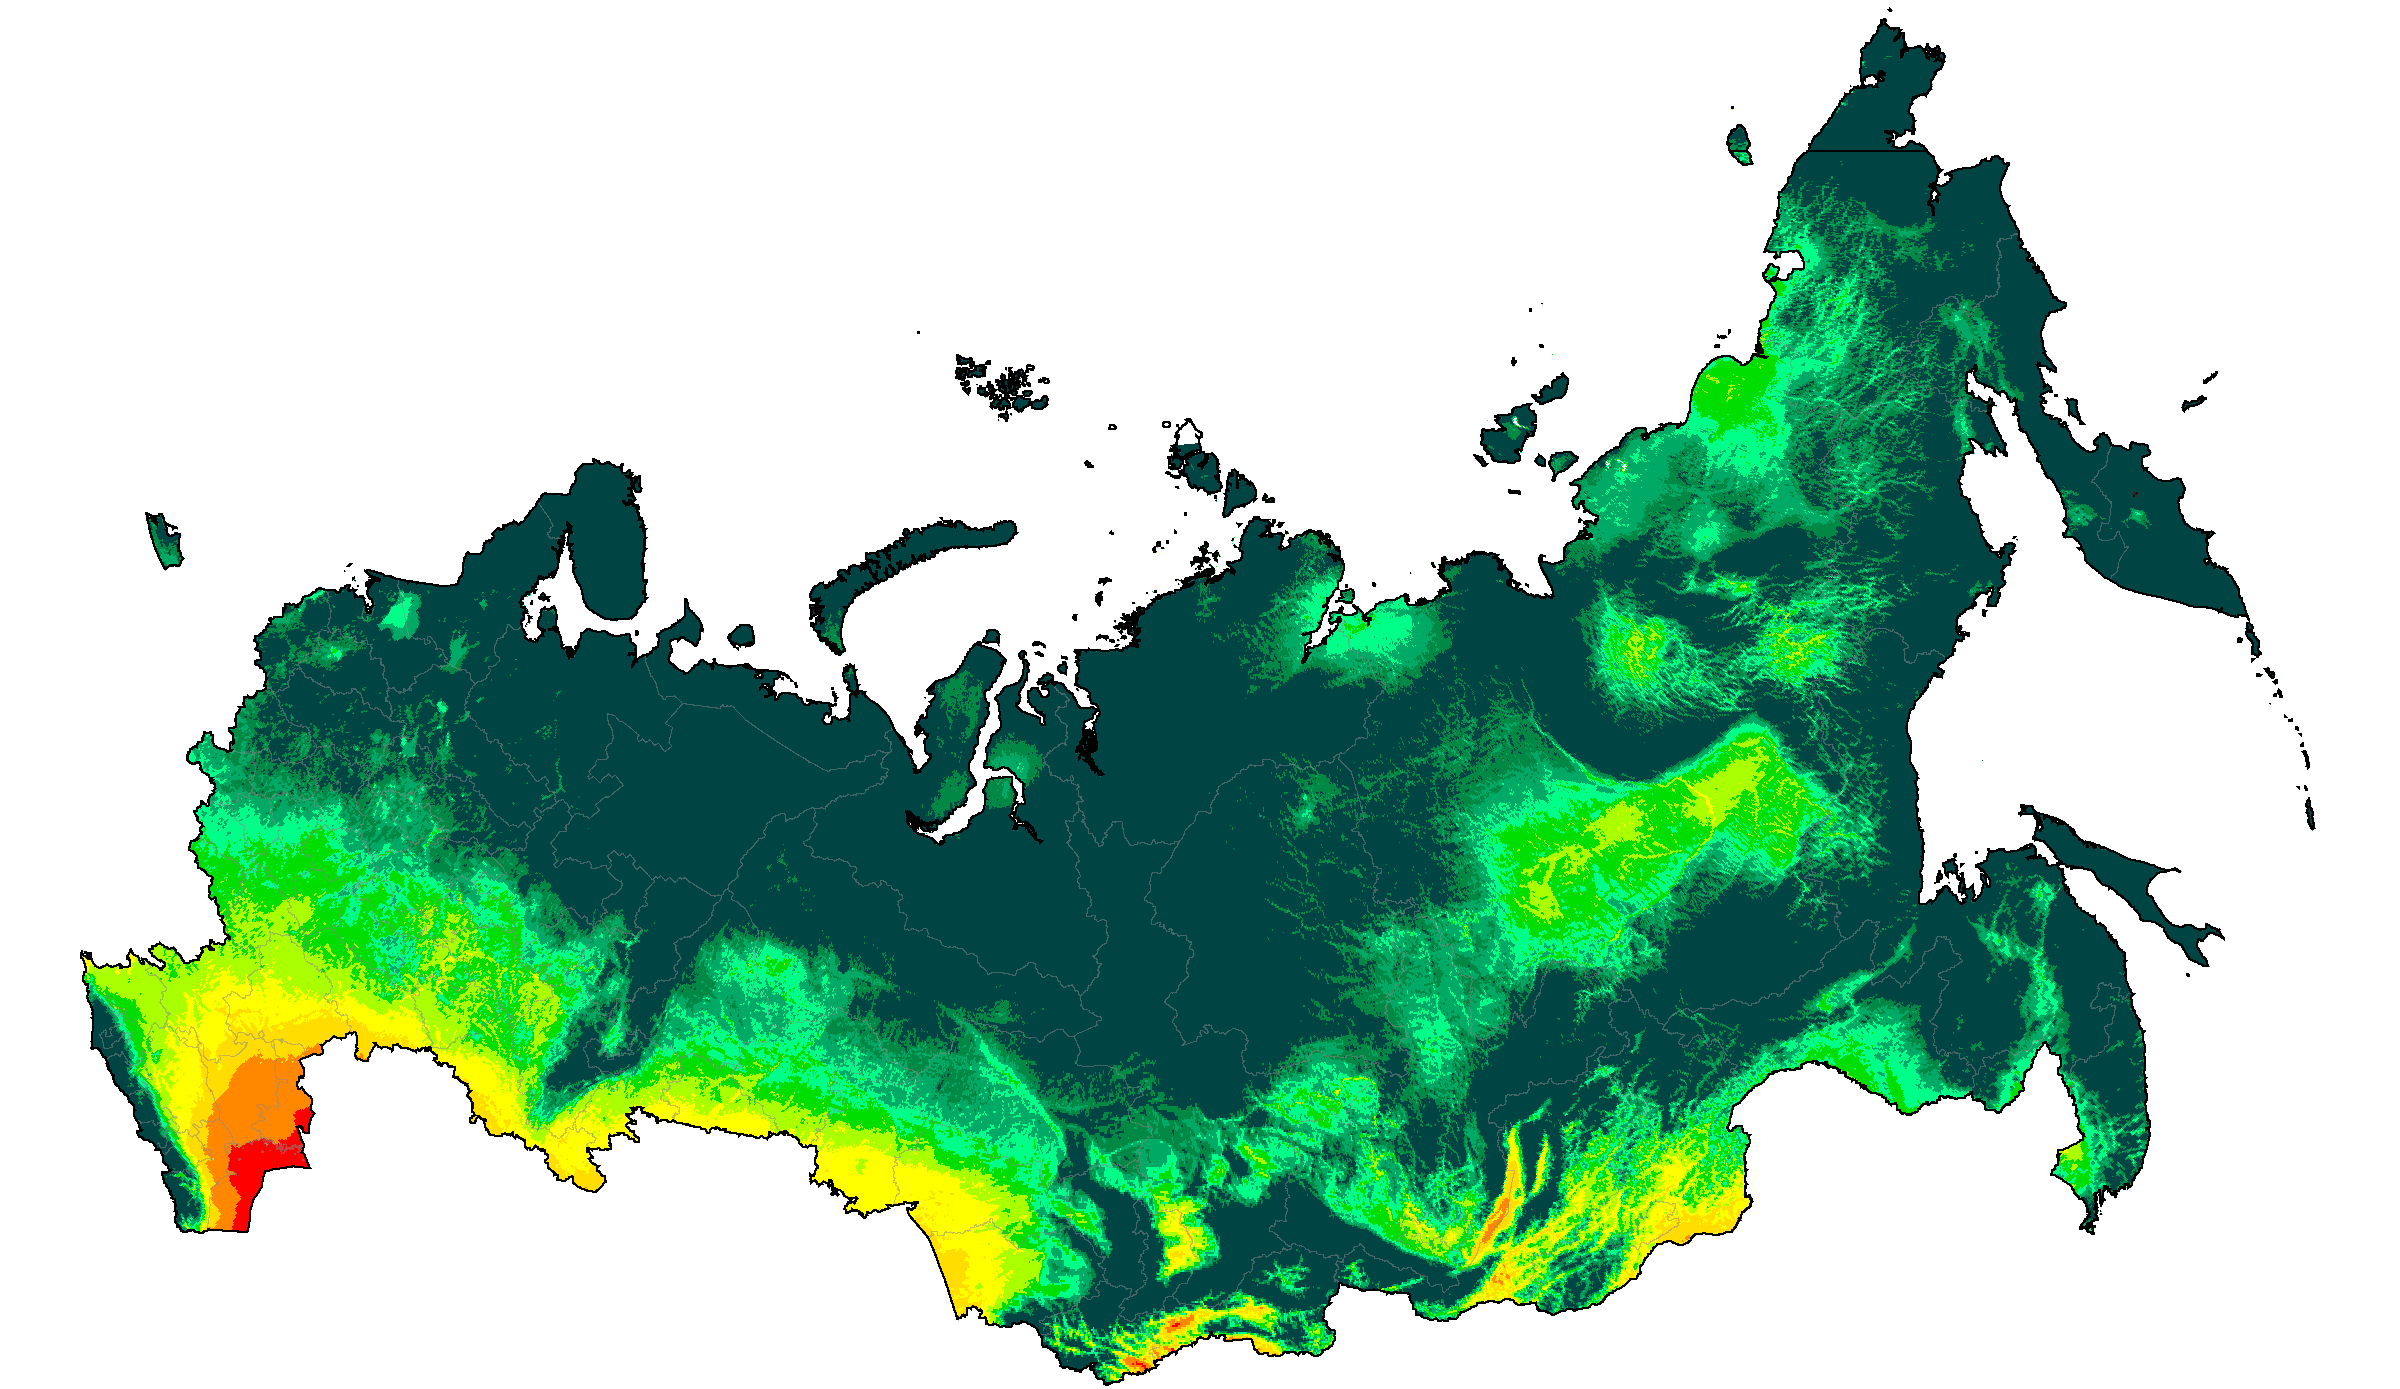
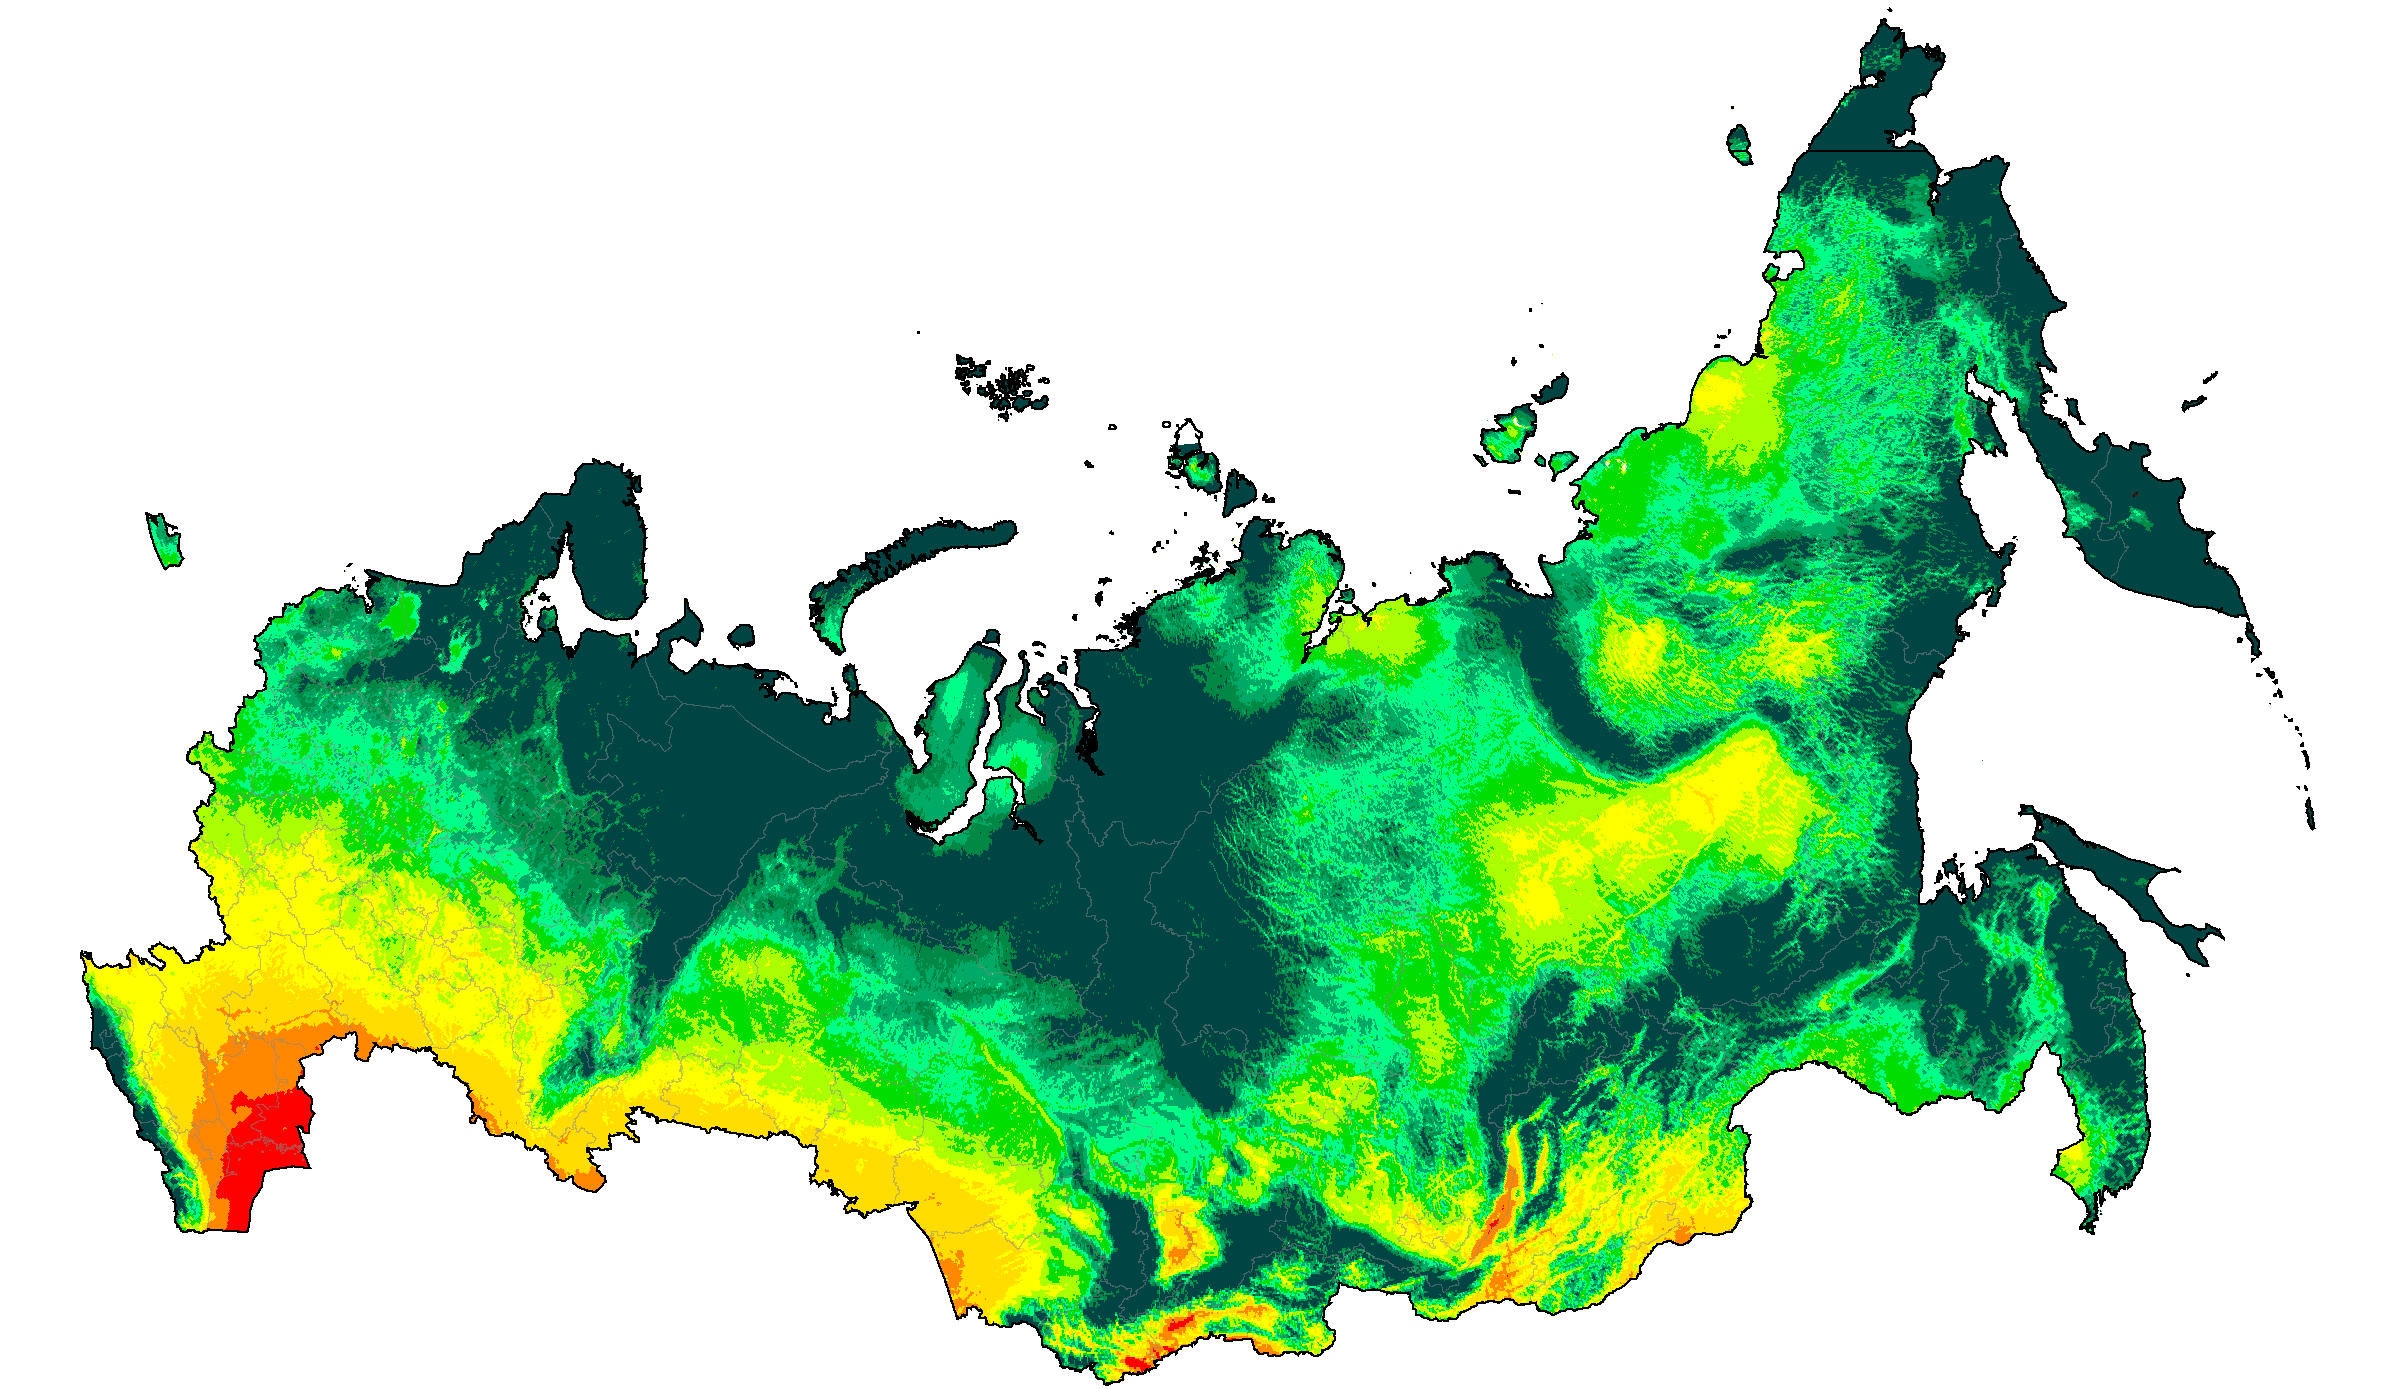
Russia distribution of P/PET (projections are SSP5-8.5 high emissions normals)
Note: The line visible in eastern Russia is a cartographic artifact of the International Date Line (180° meridian), not a political boundary.
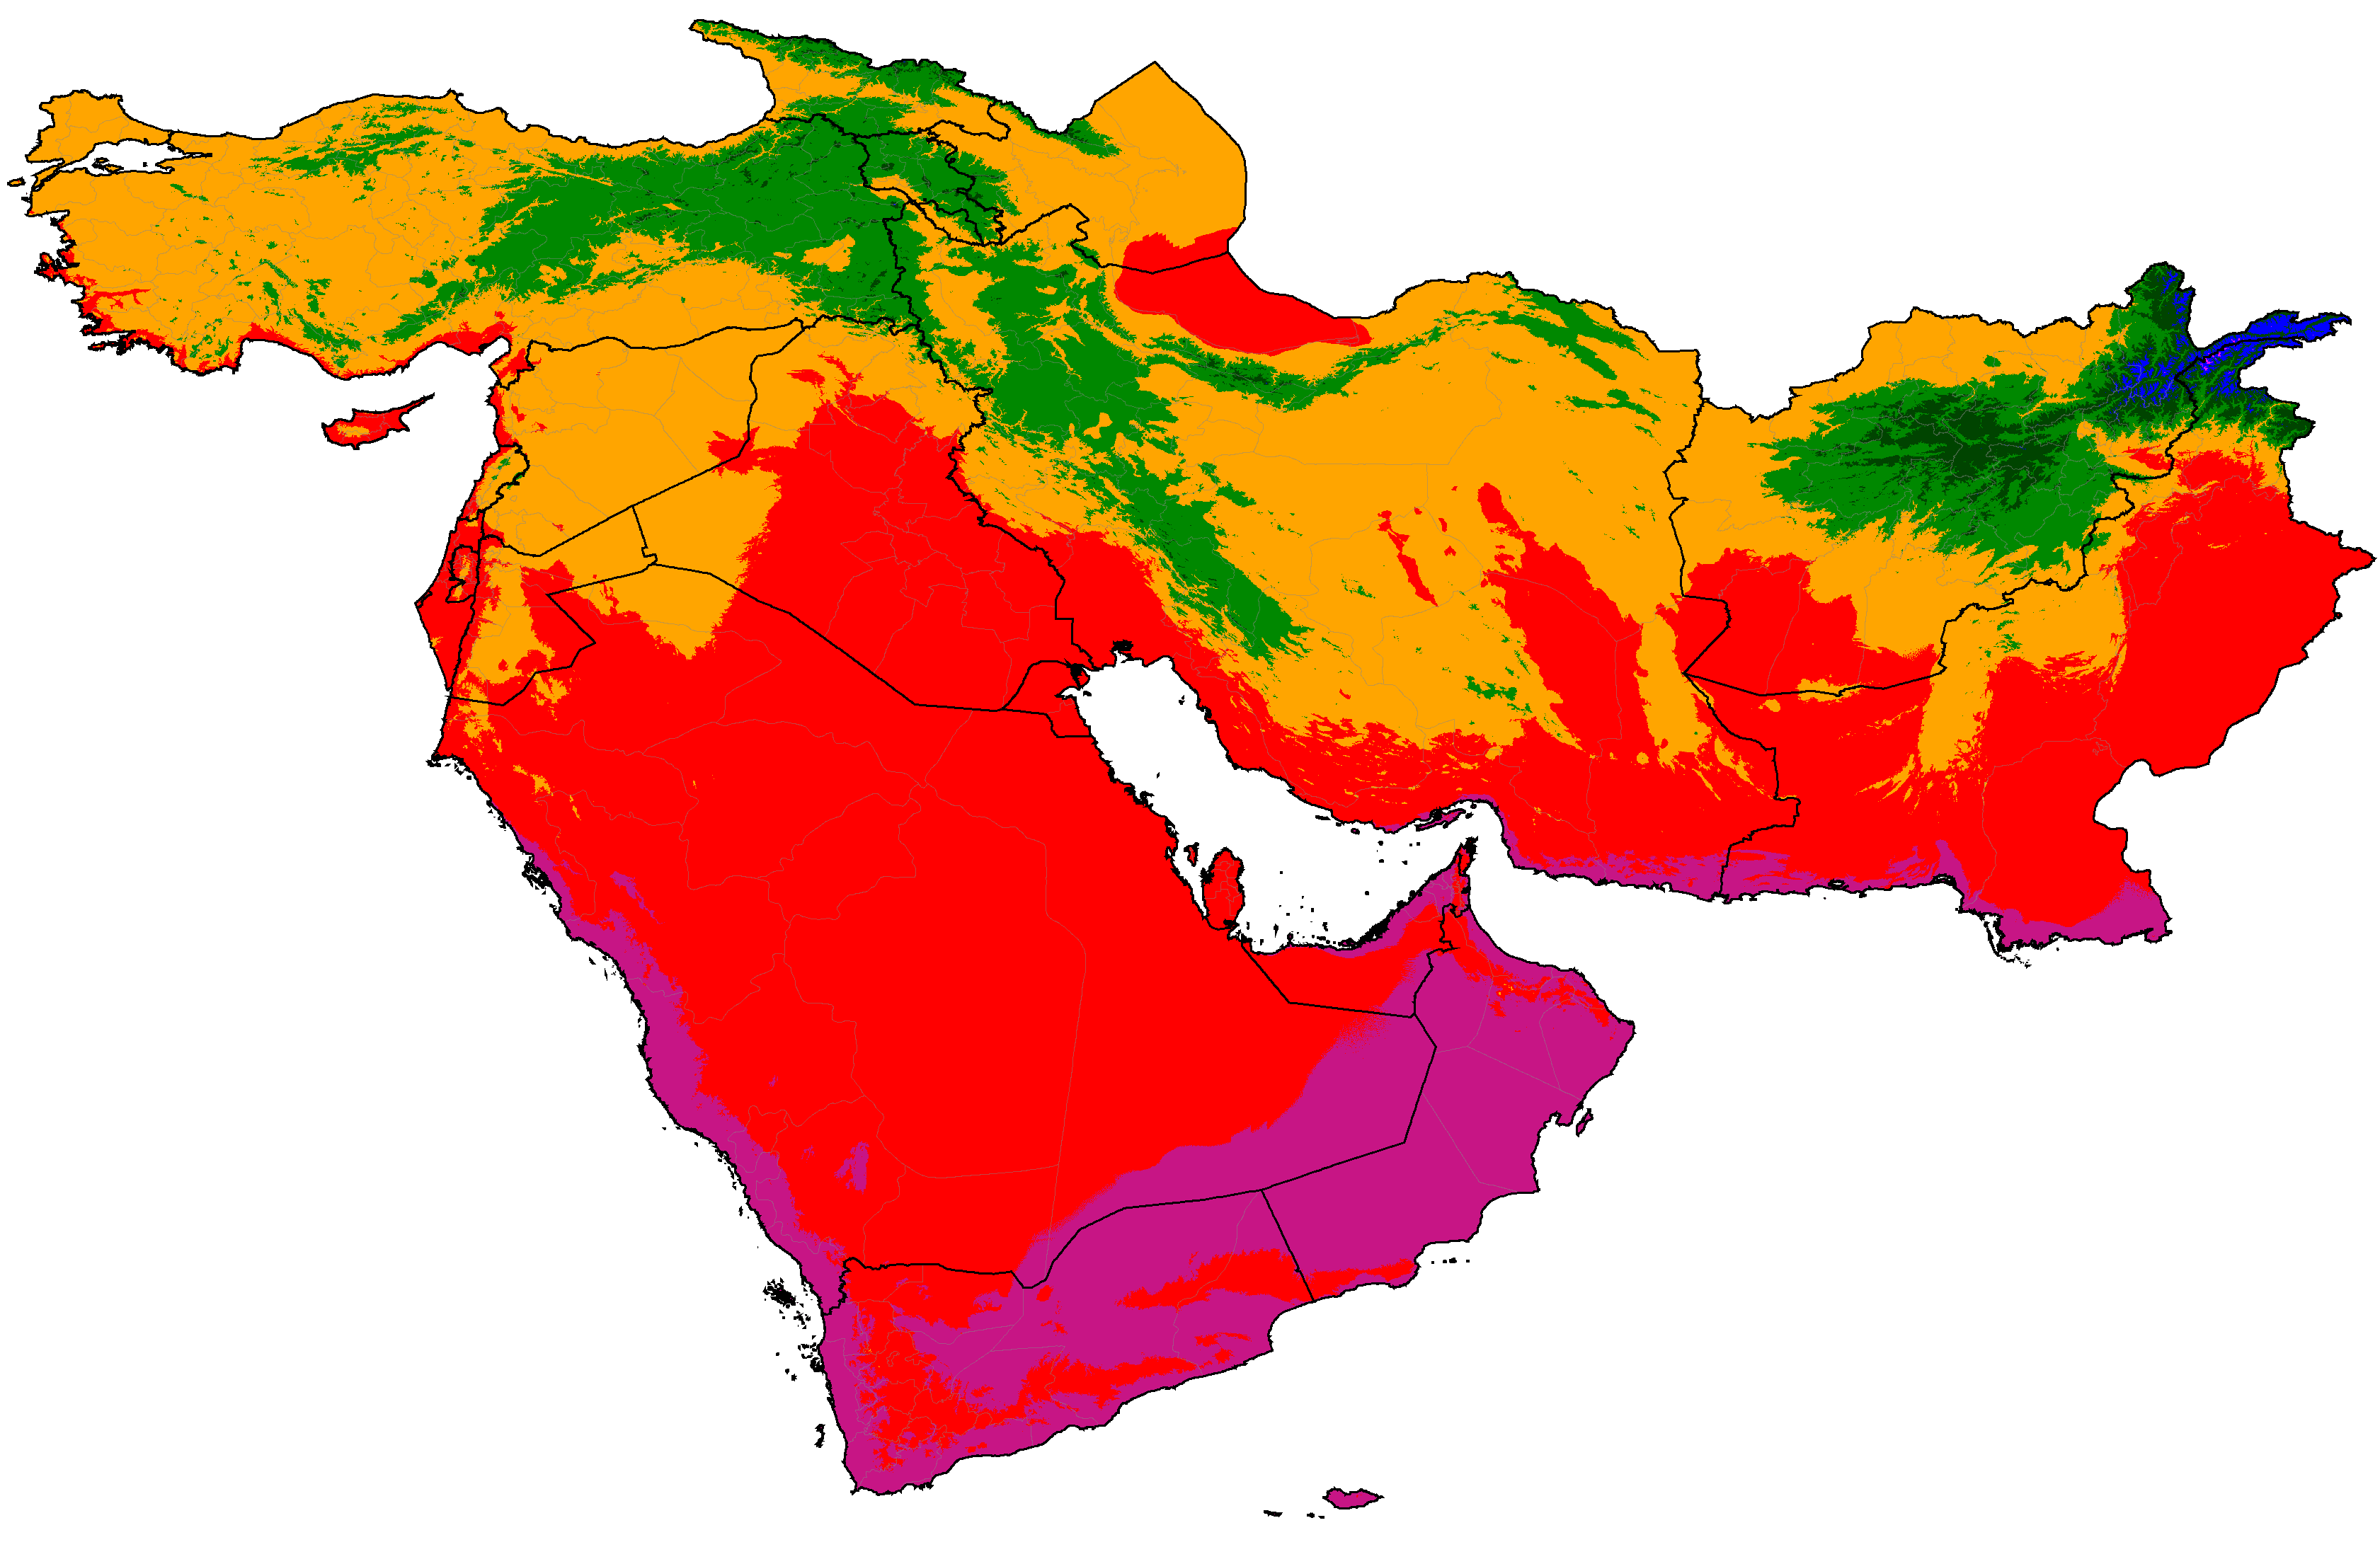
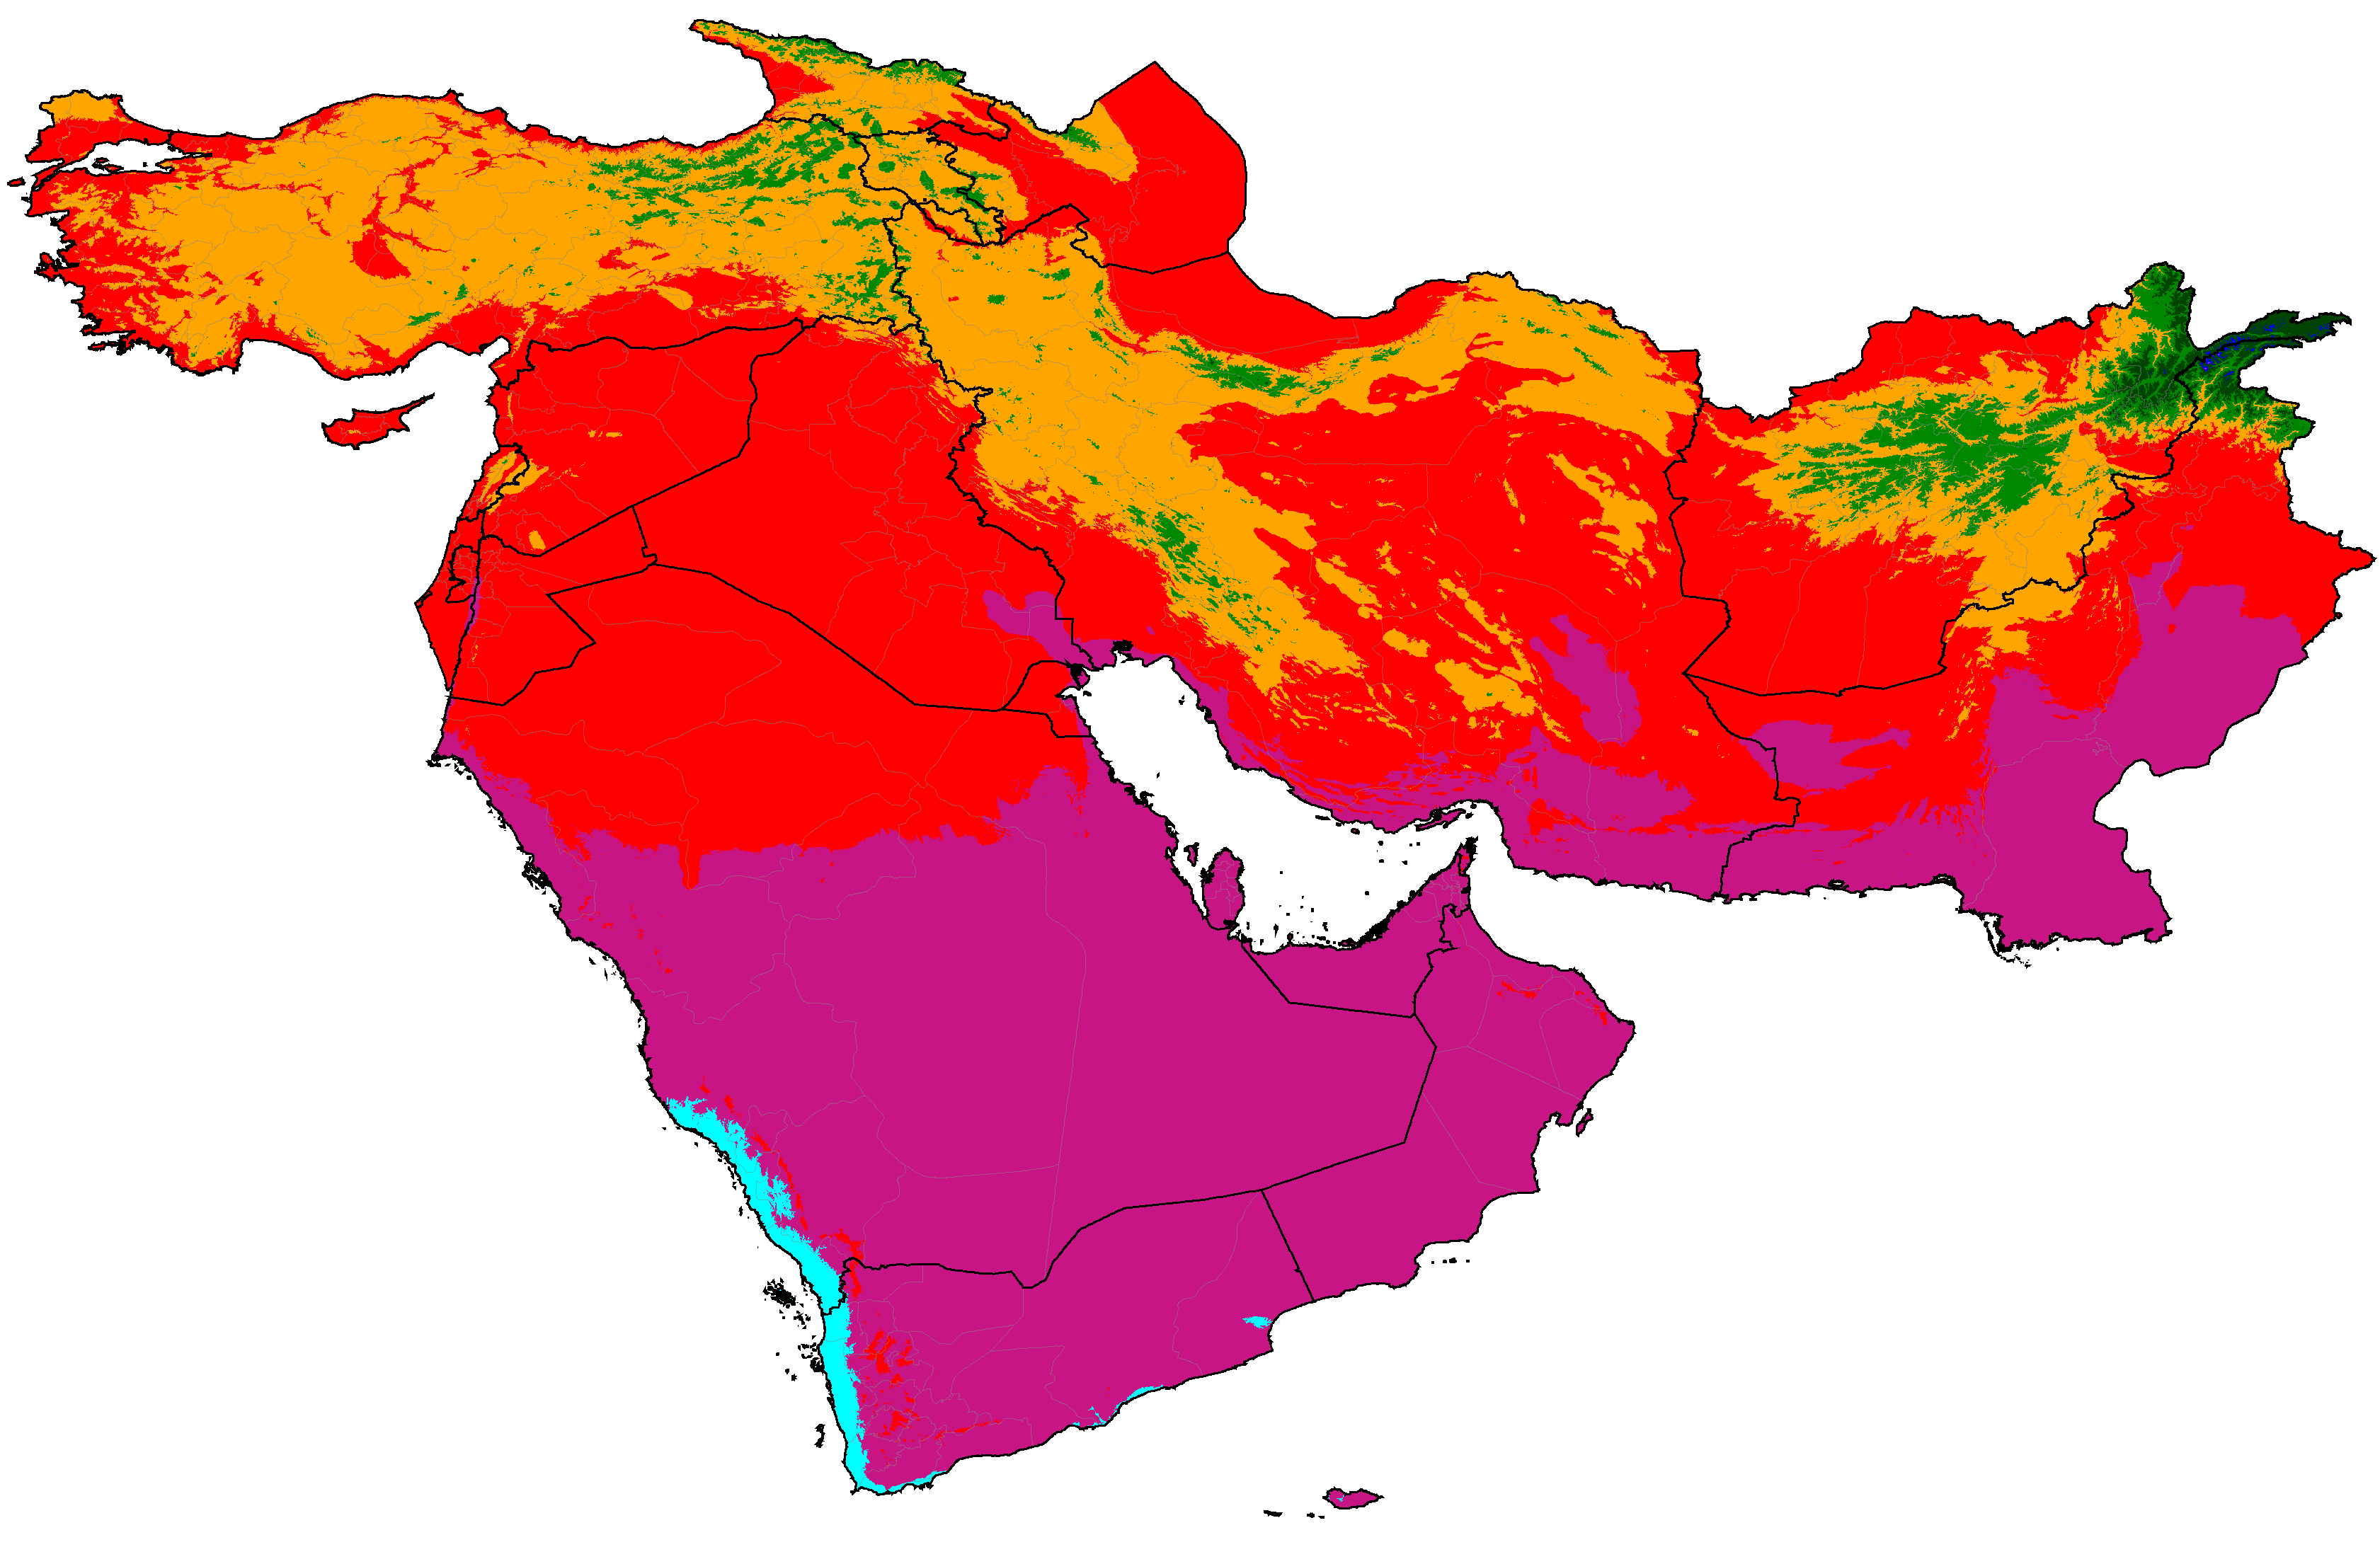
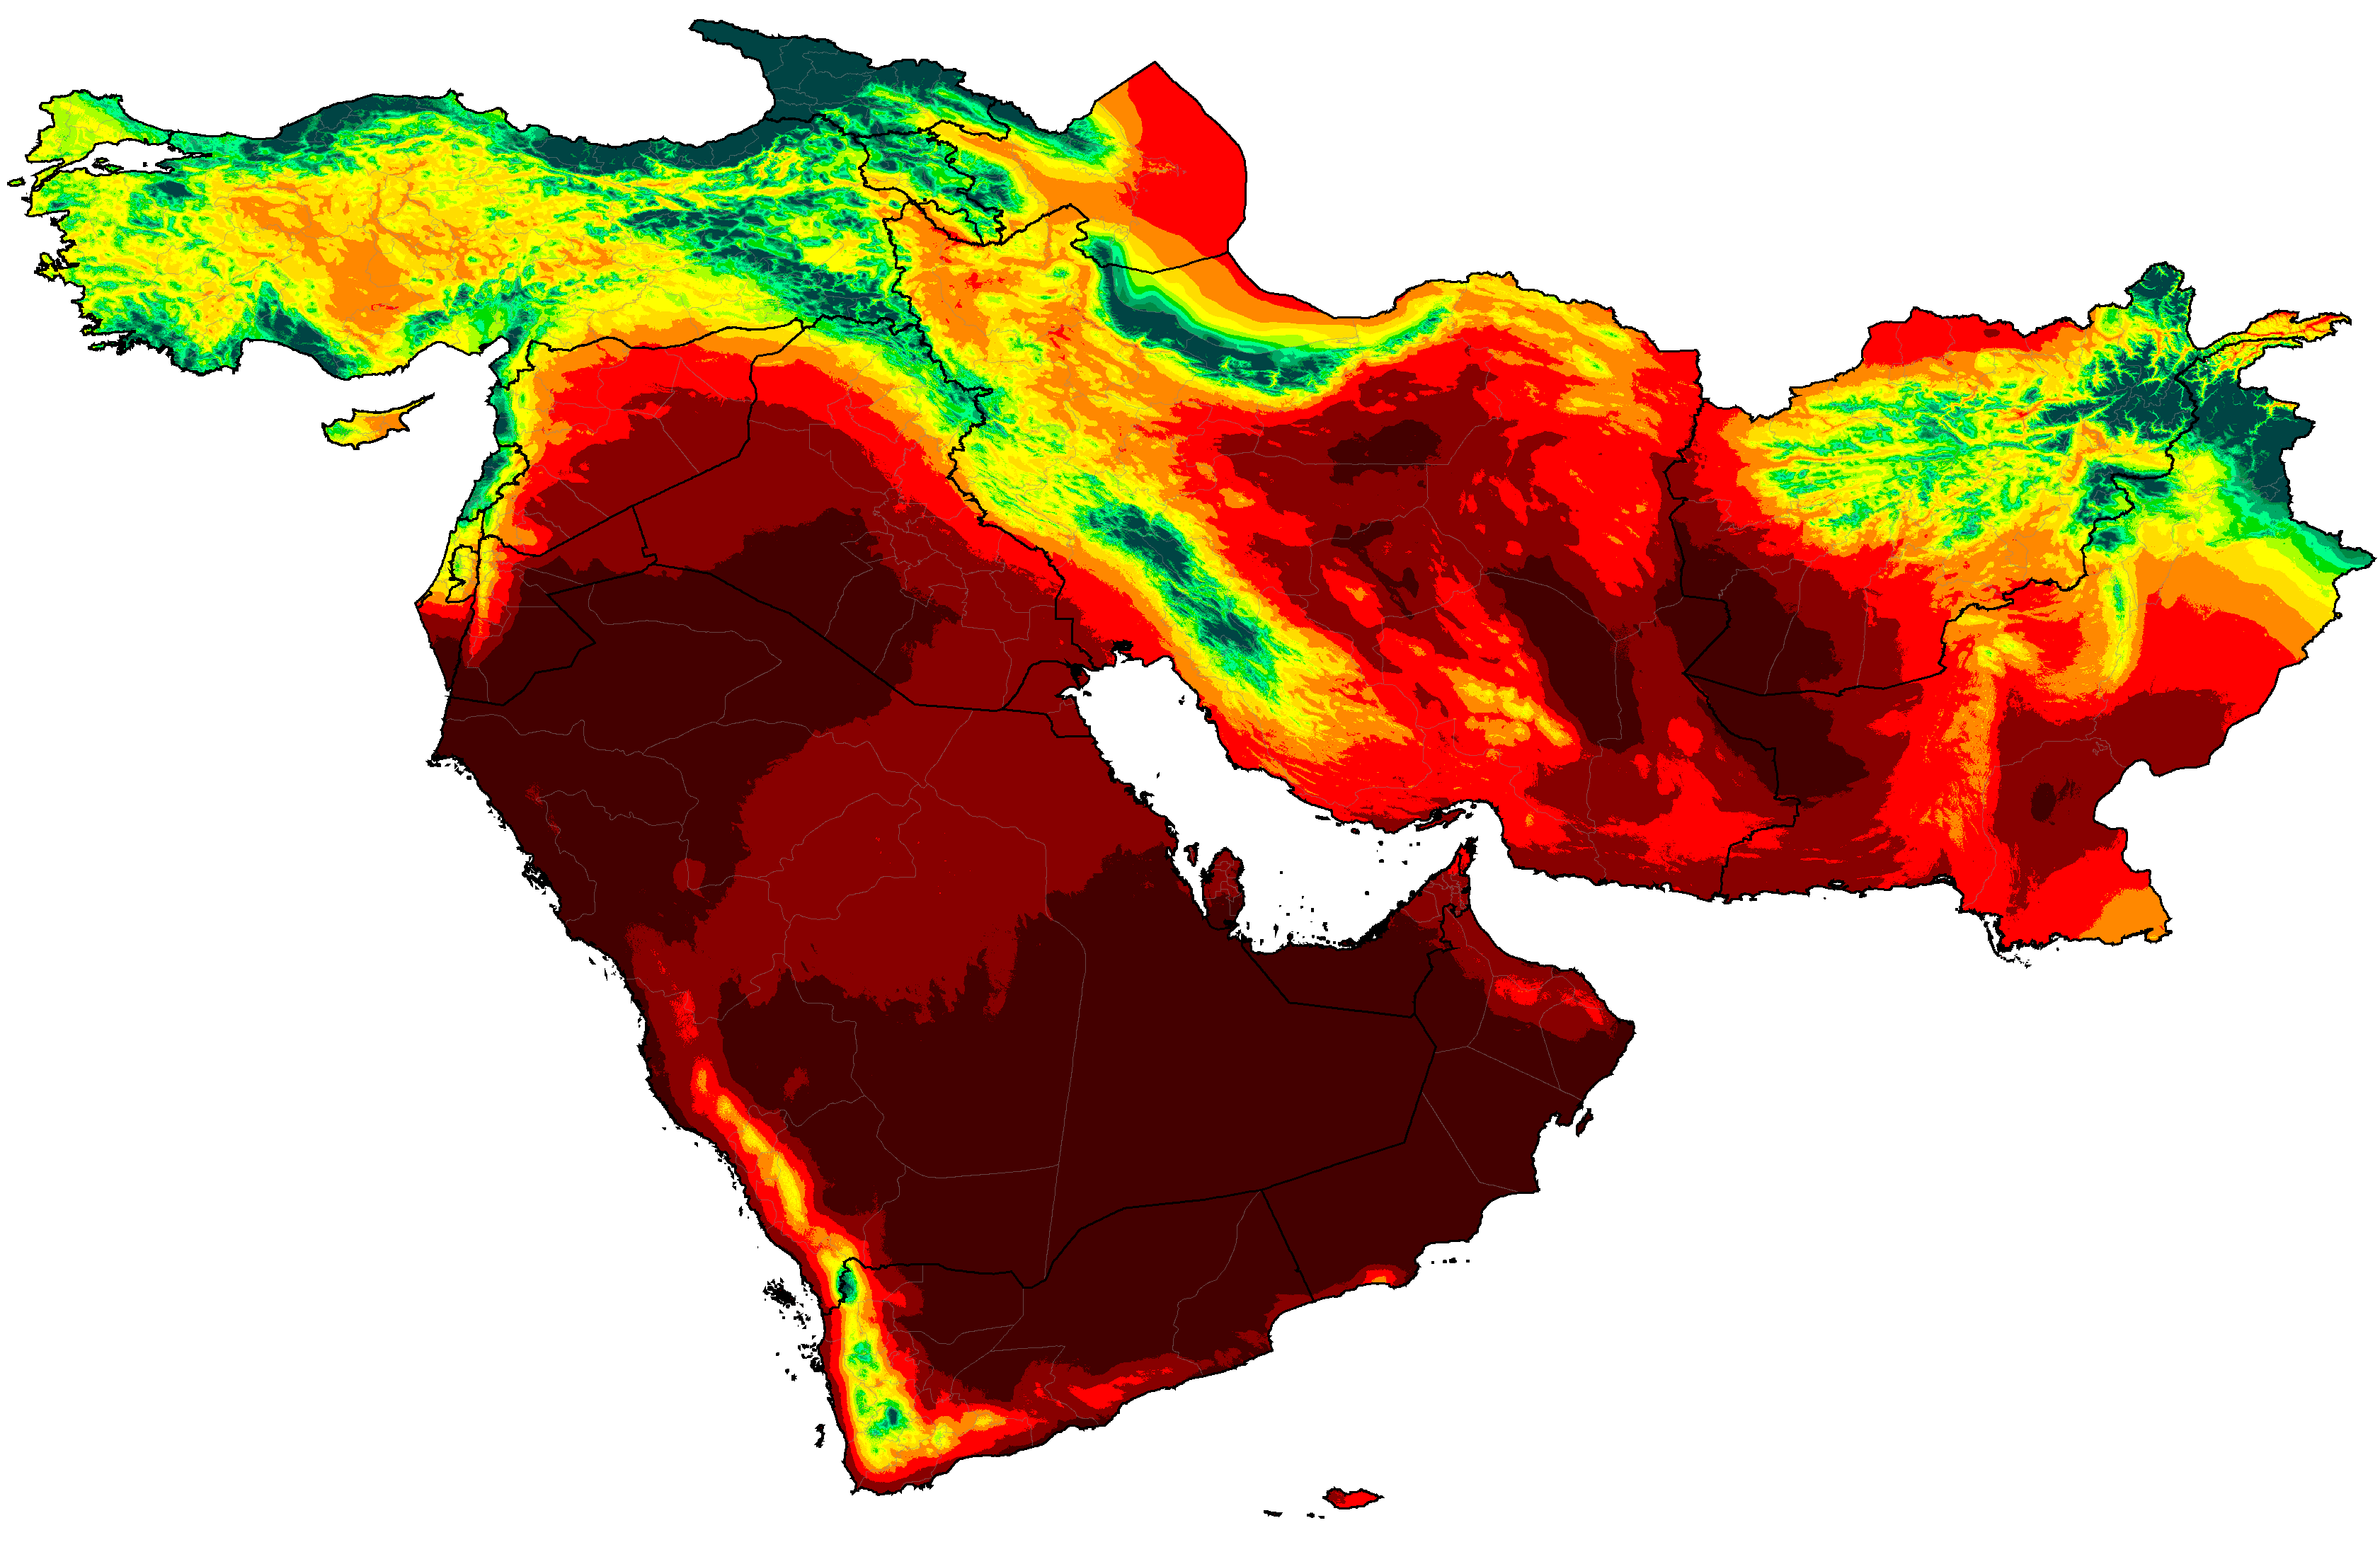
West Asia distribution of P/PET (projections are SSP5-8.5 high emissions normals)
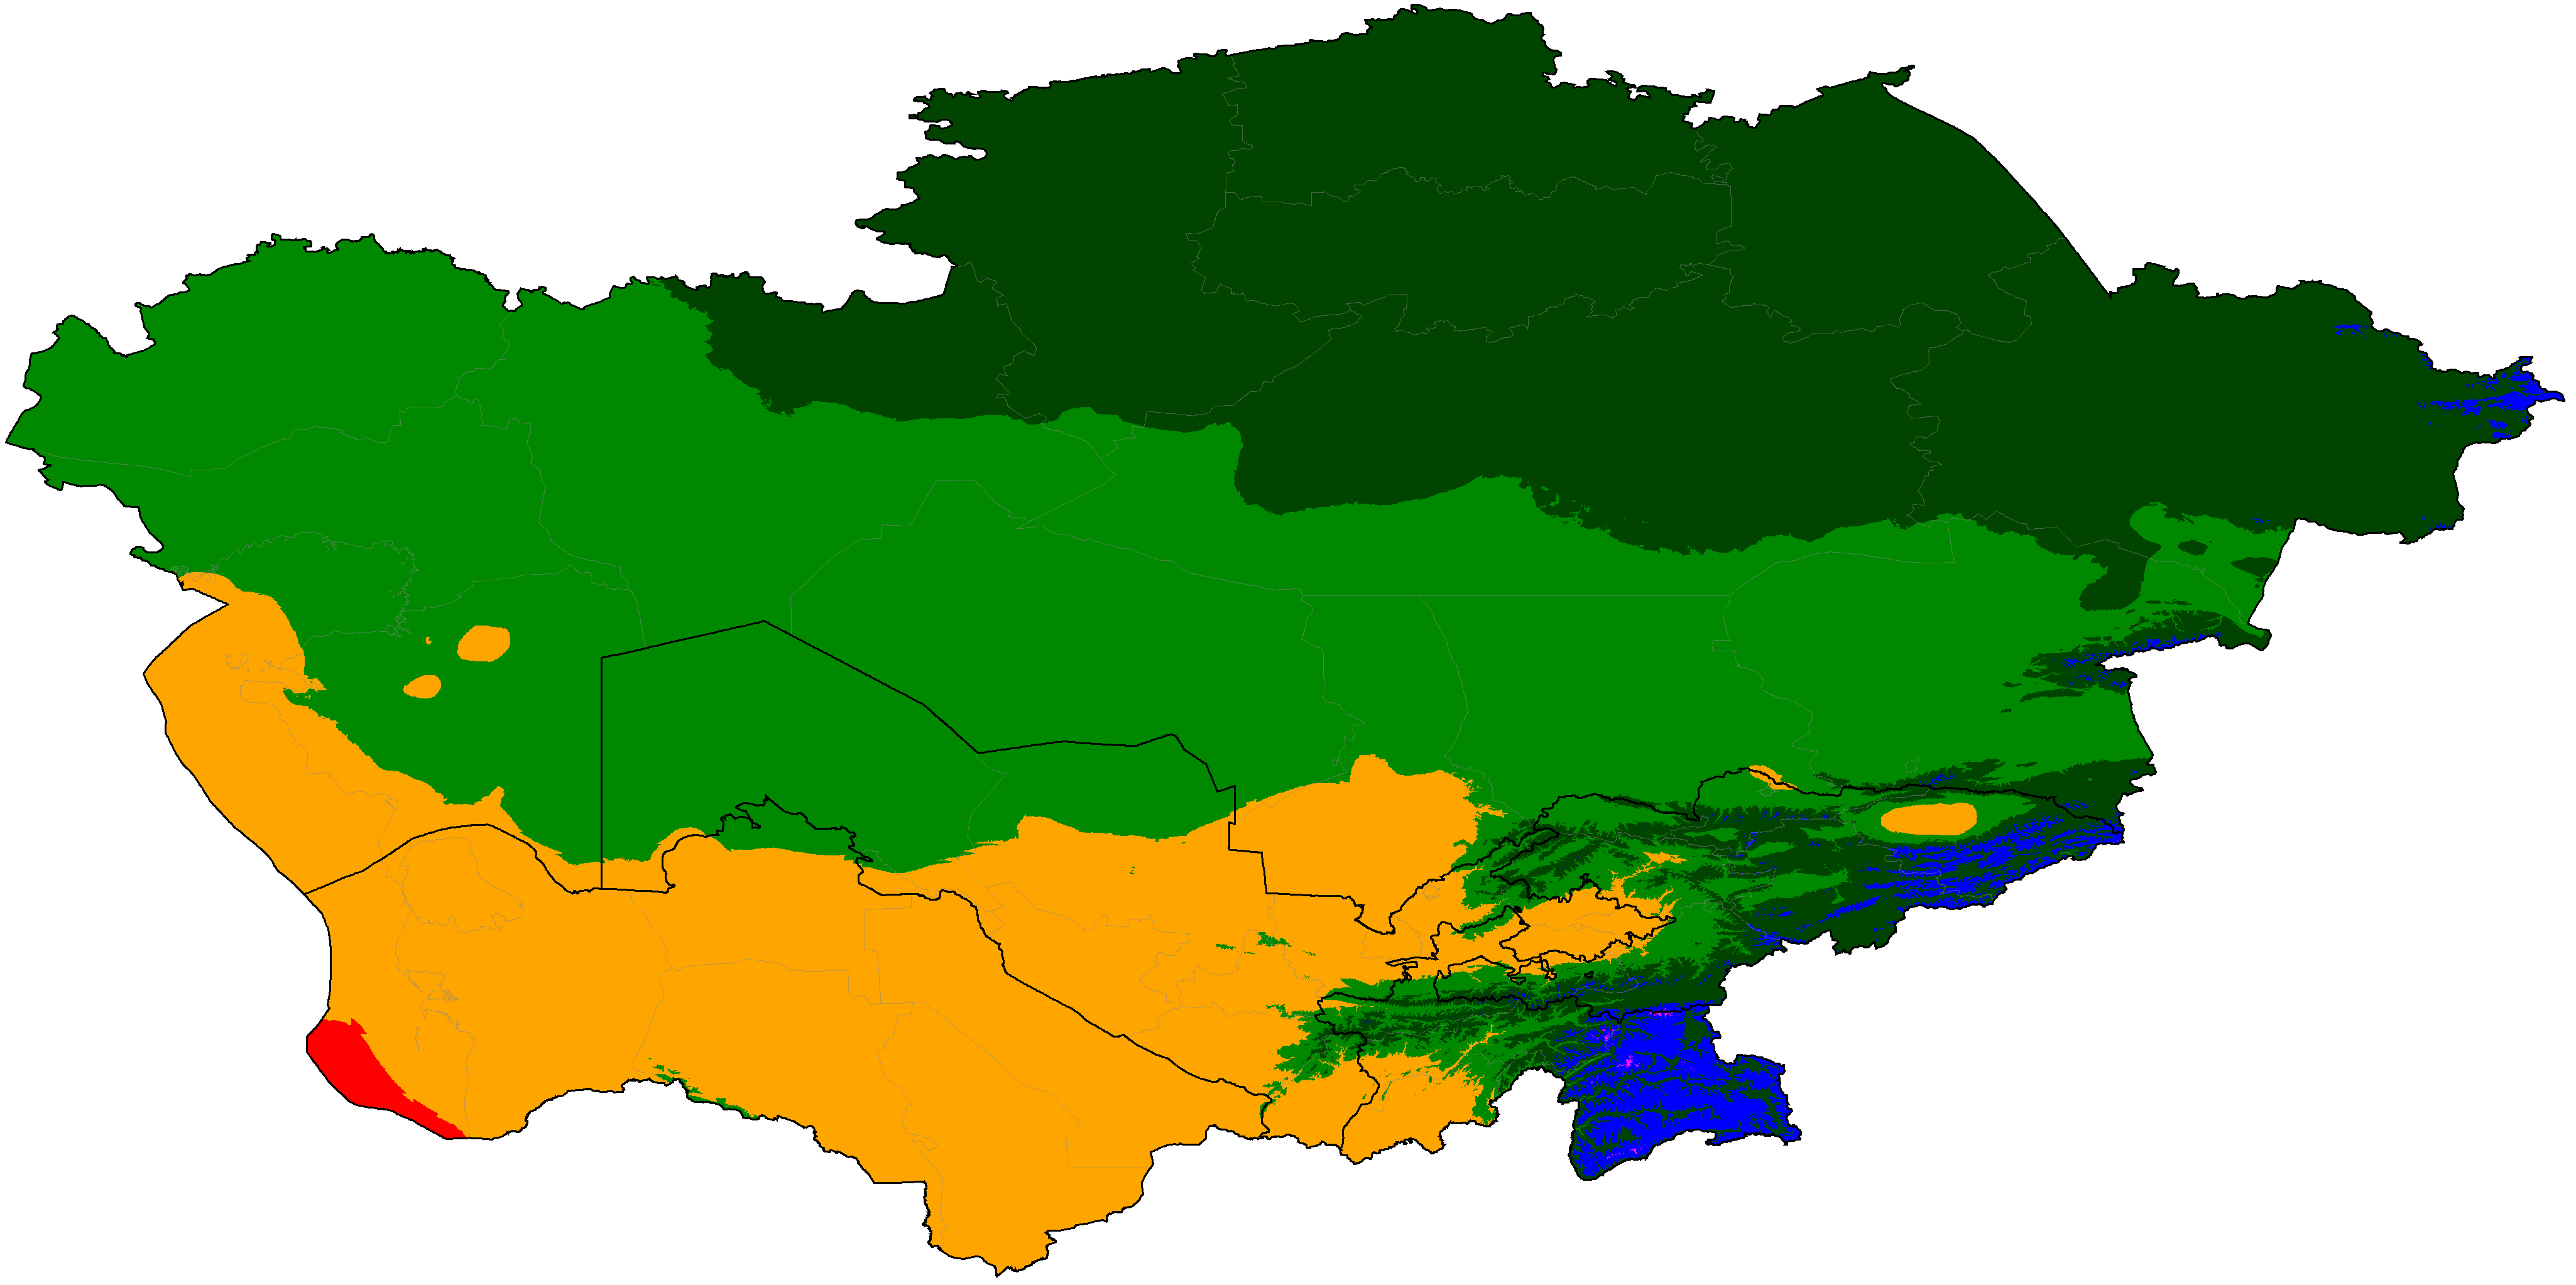
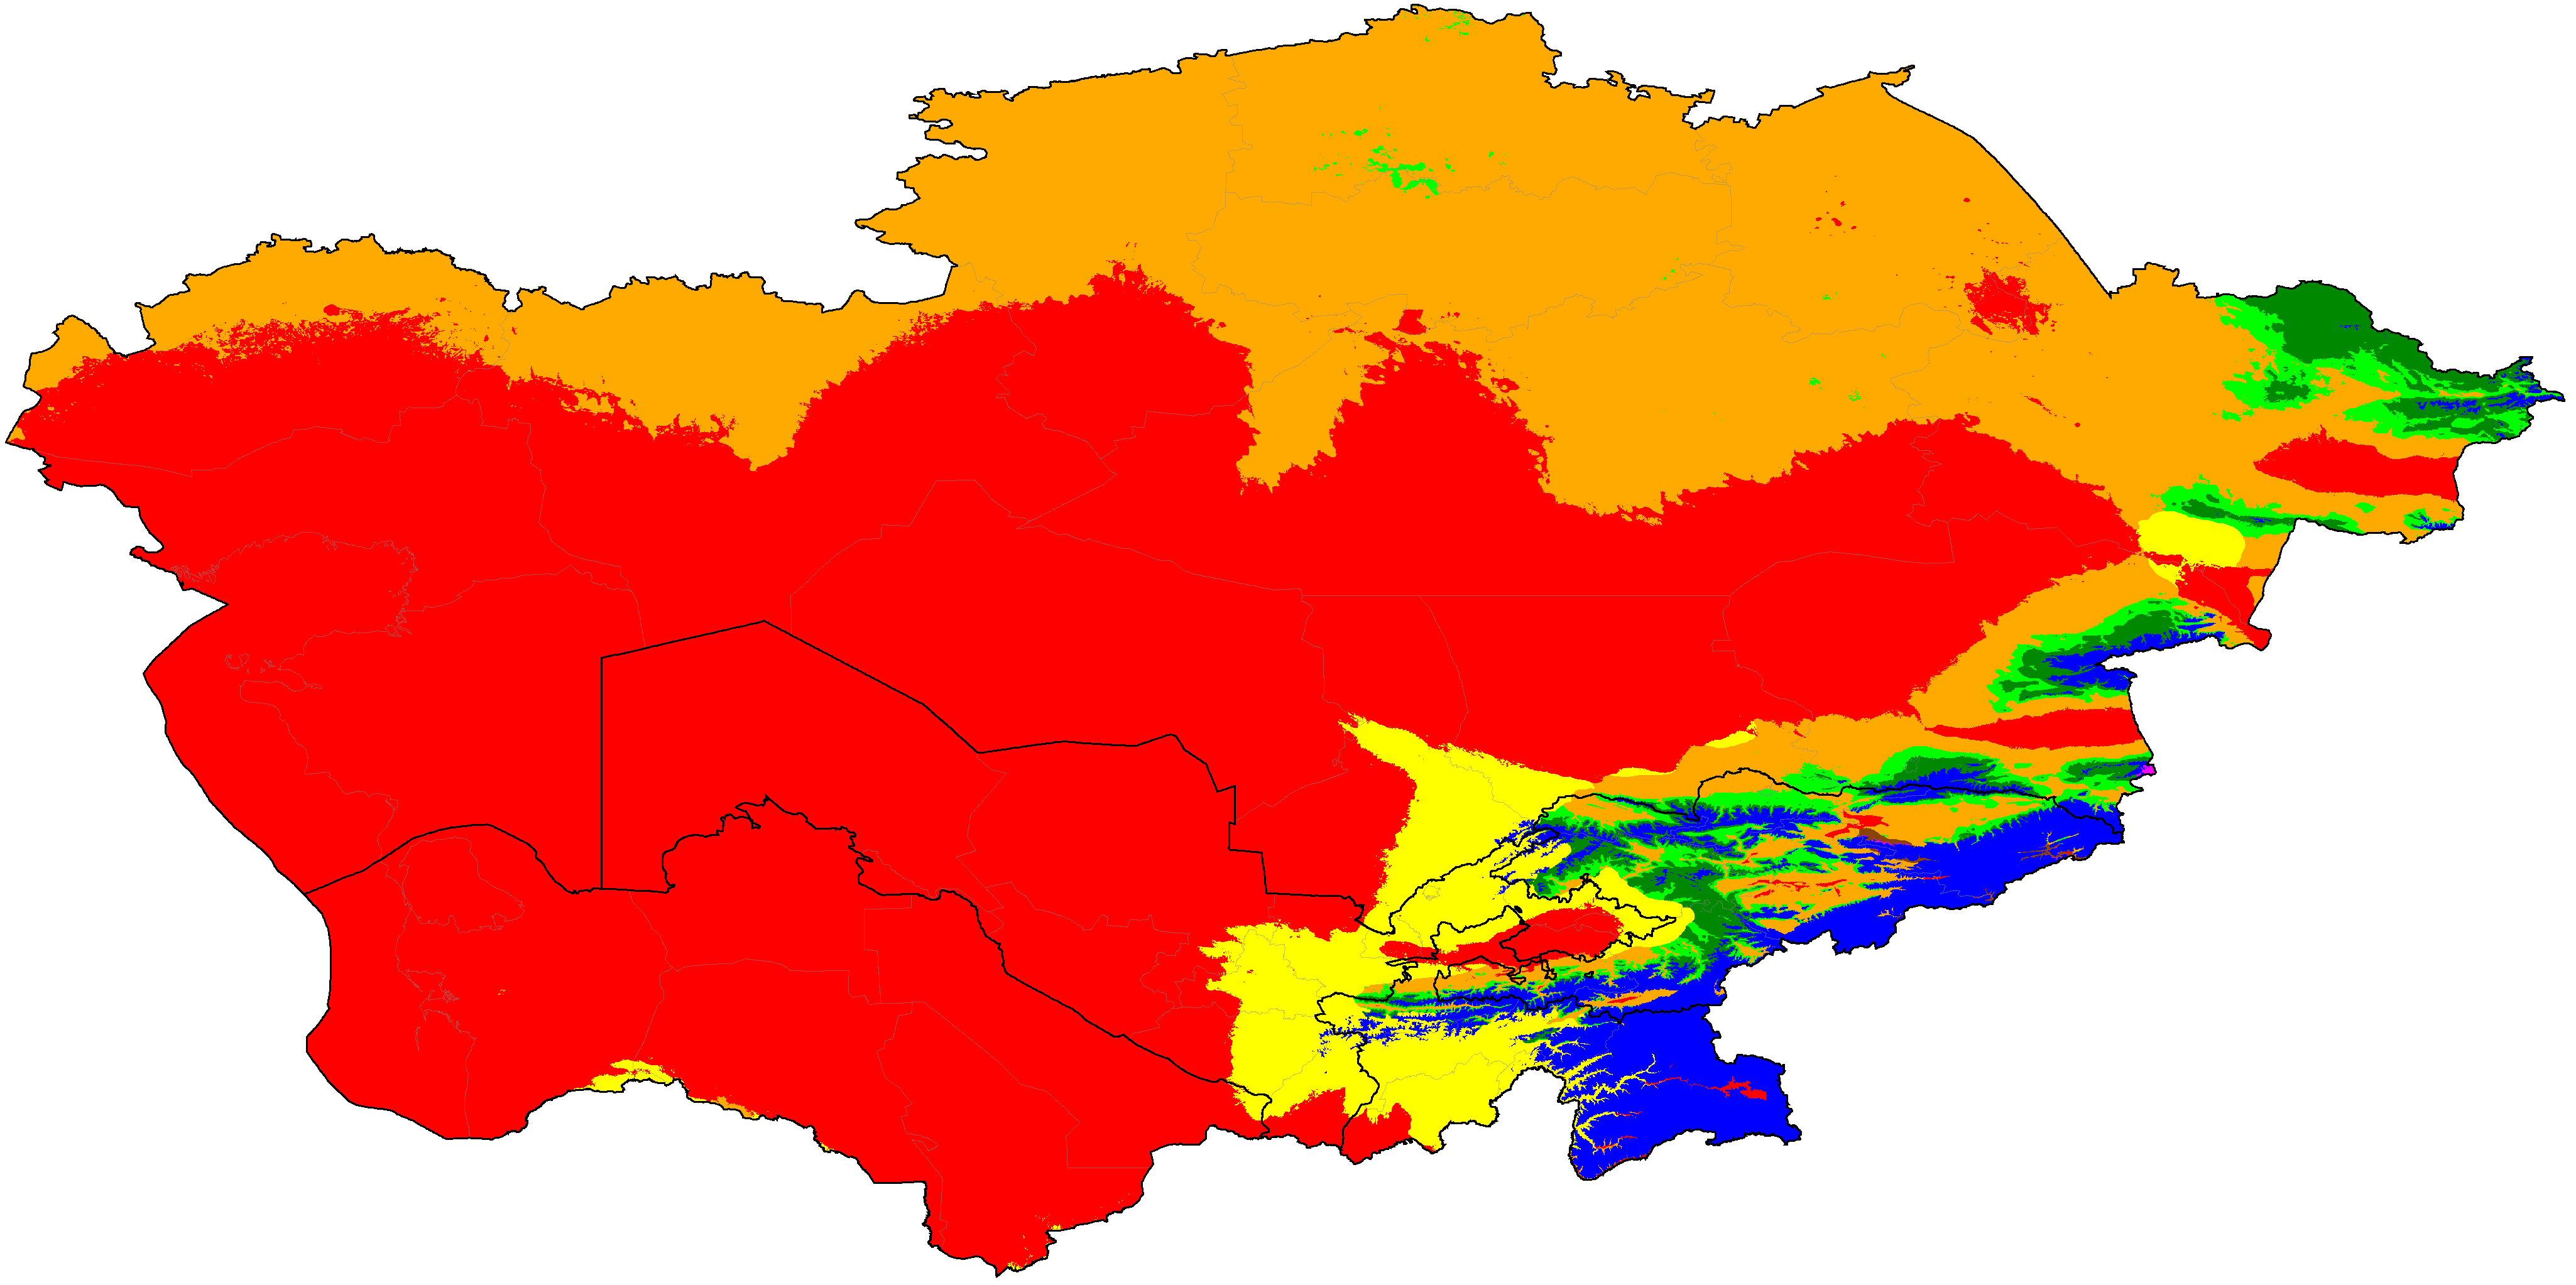
Central Asia distribution of P/PET (projections are SSP5-8.5 high emissions normals)
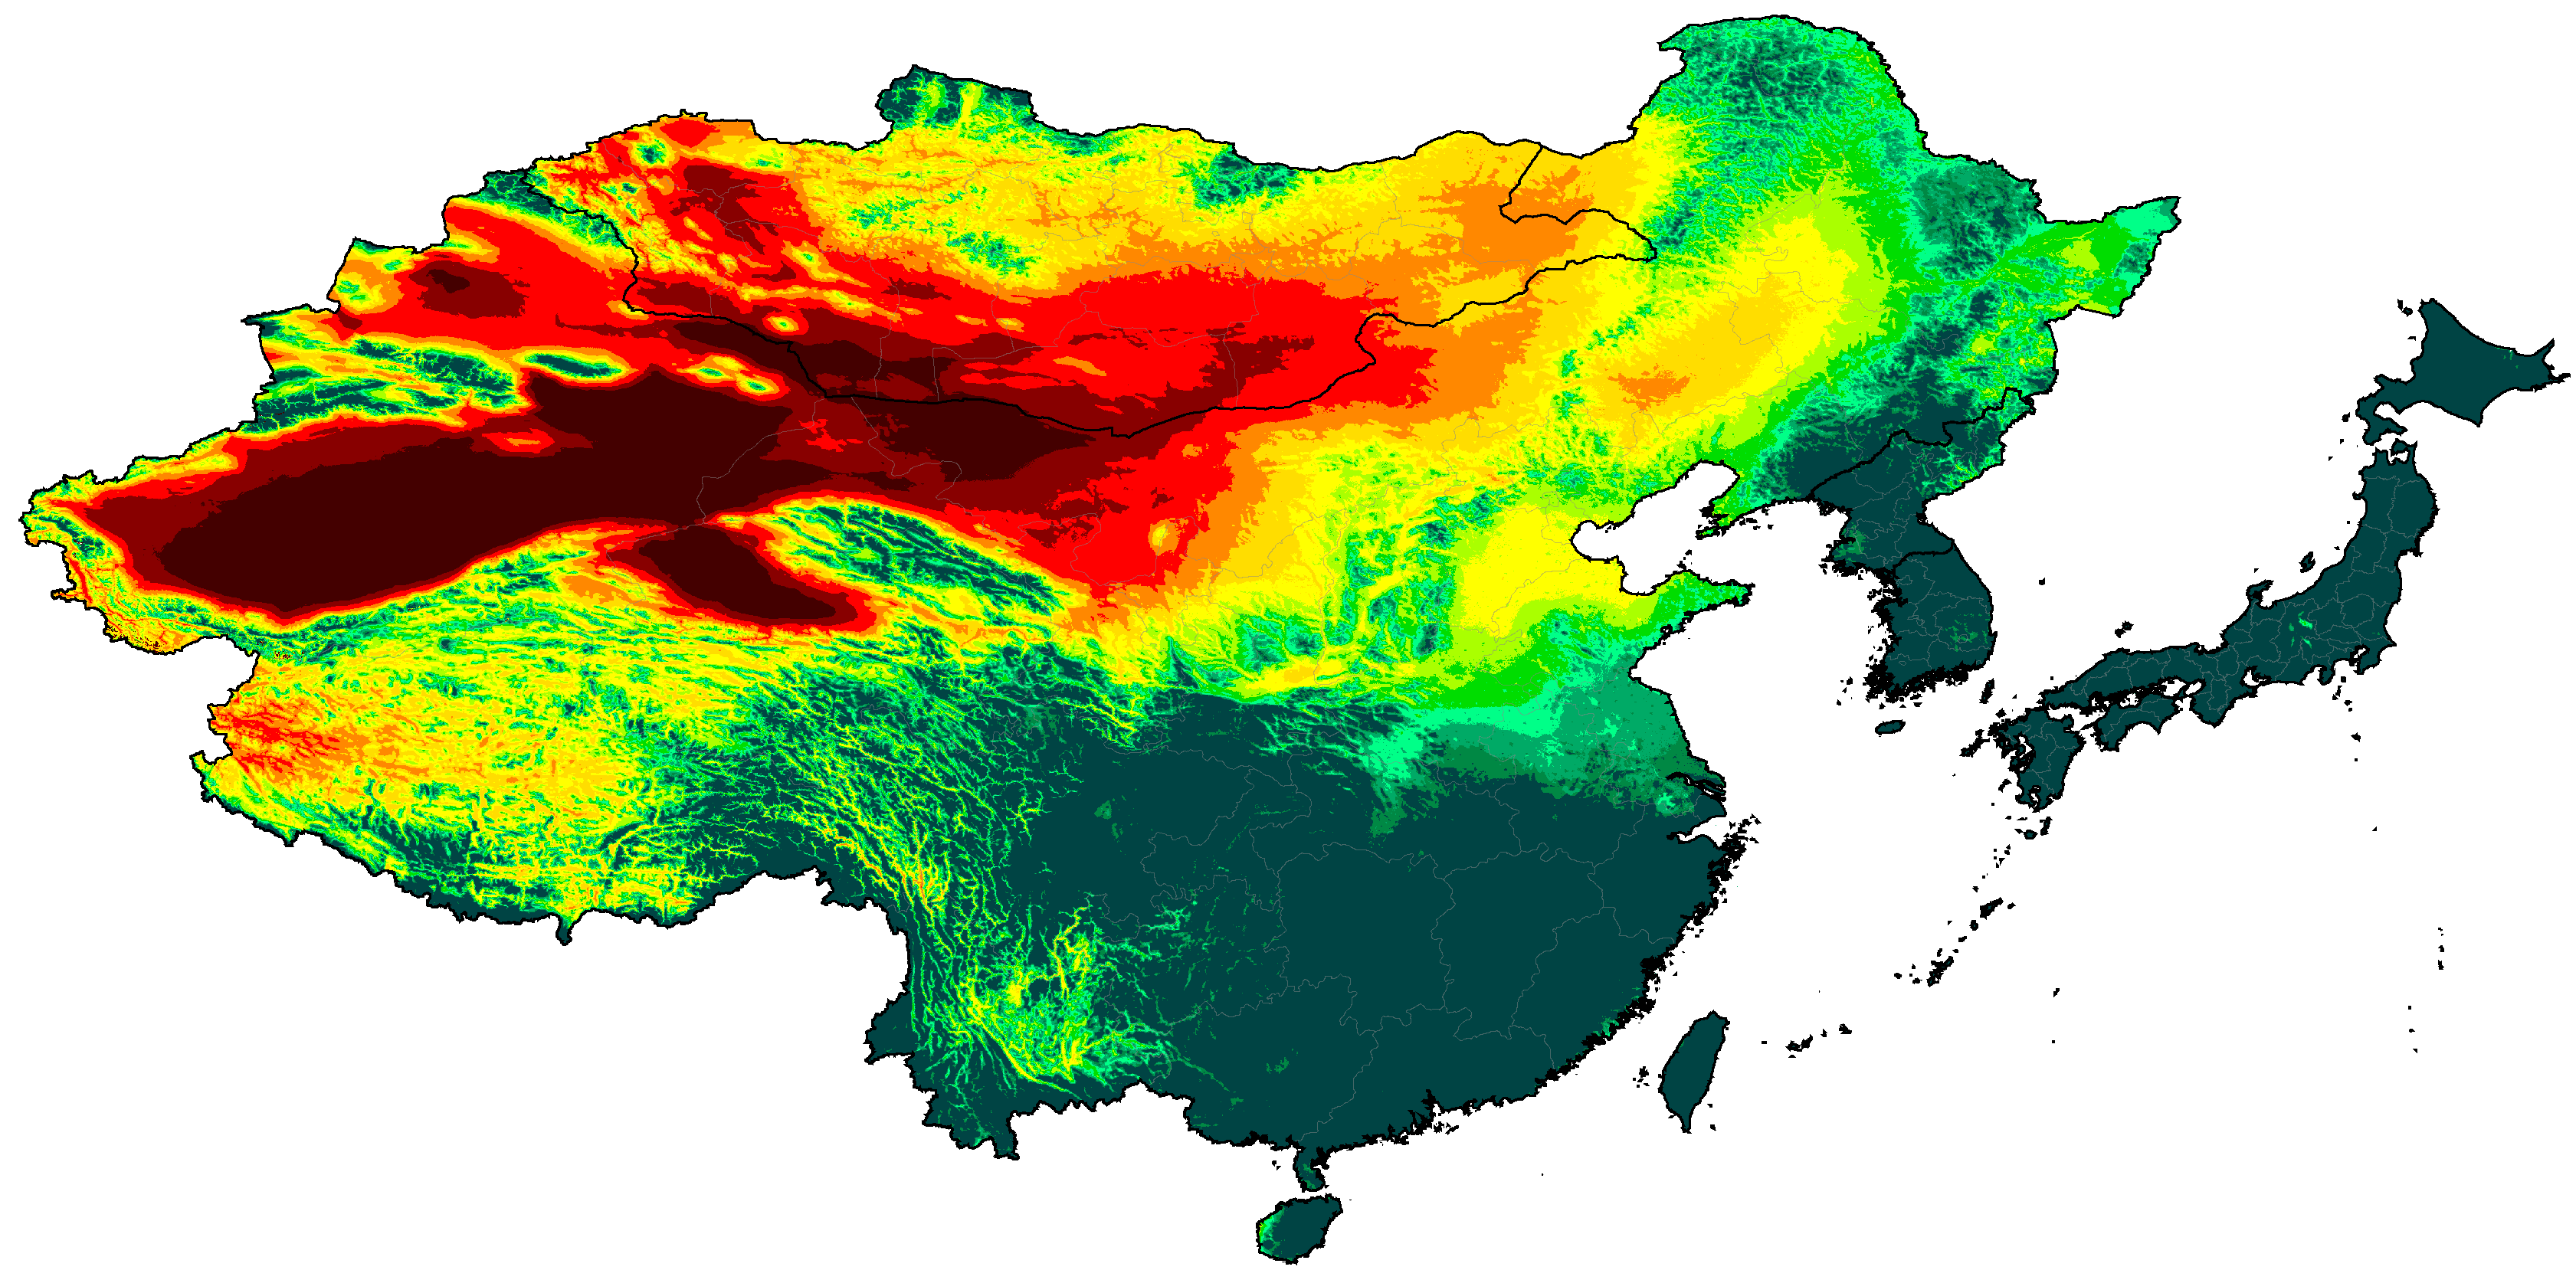
East Asia distribution of P/PET (projections are SSP5-8.5 high emissions normals)

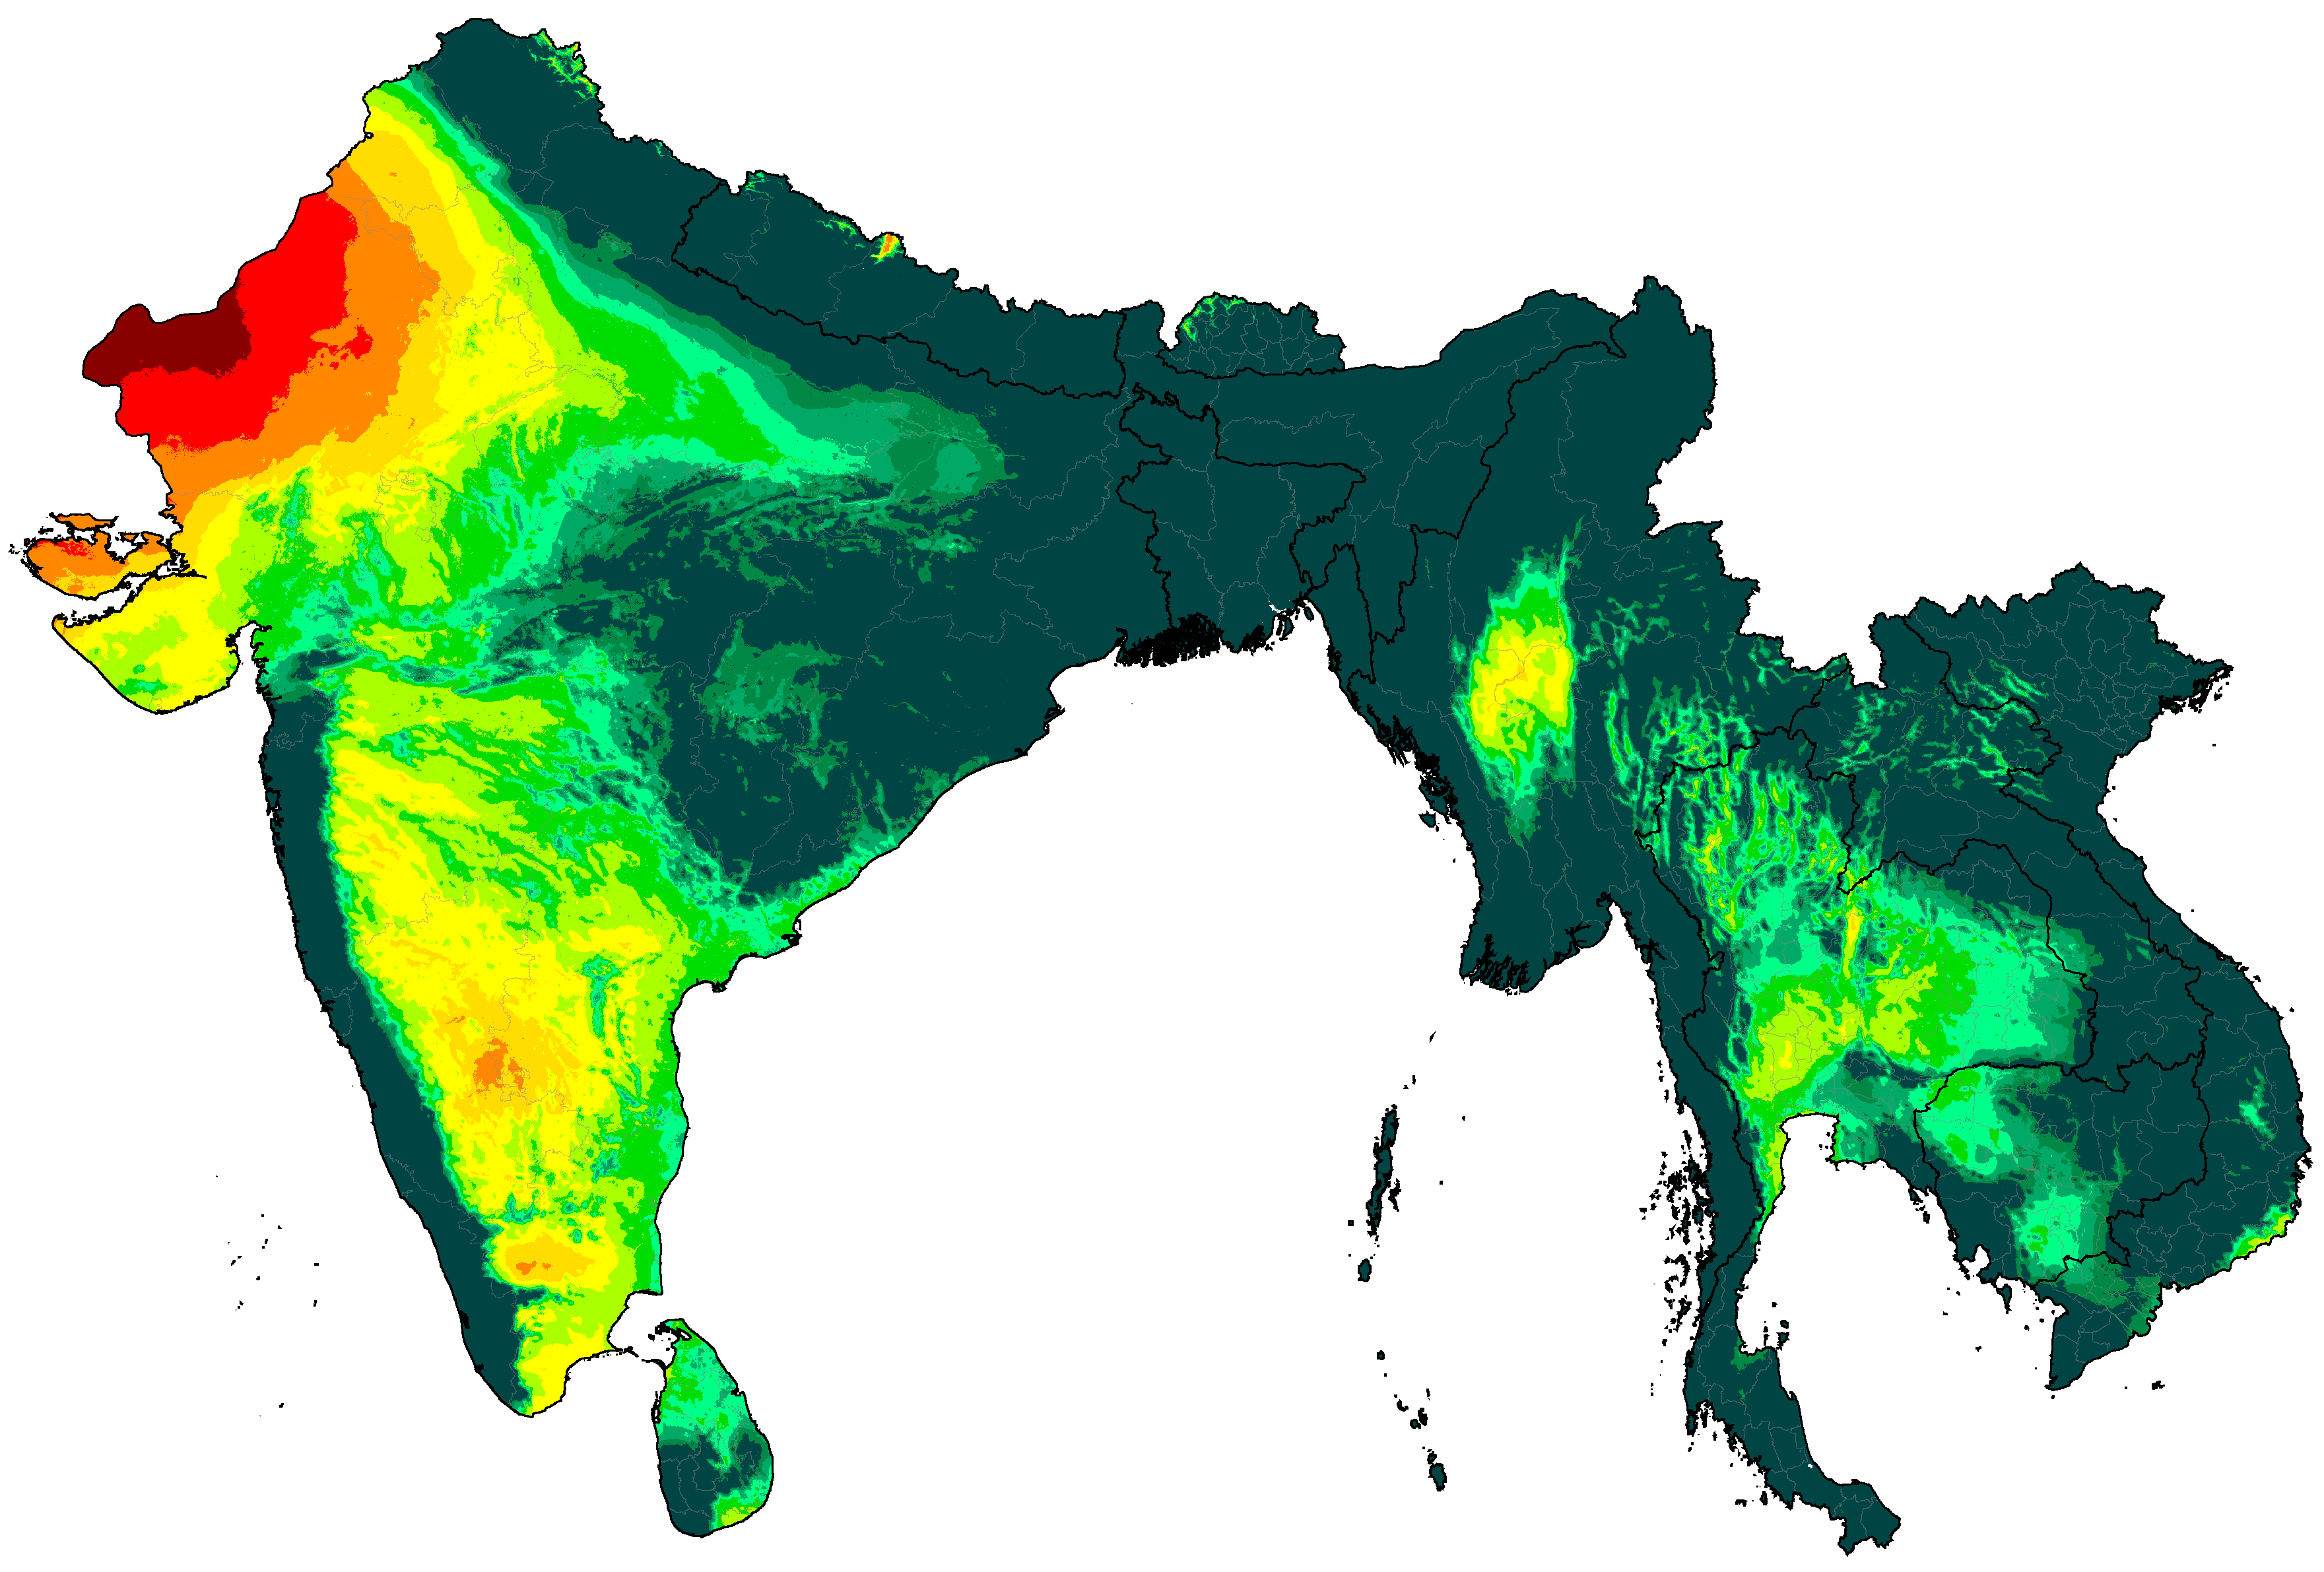
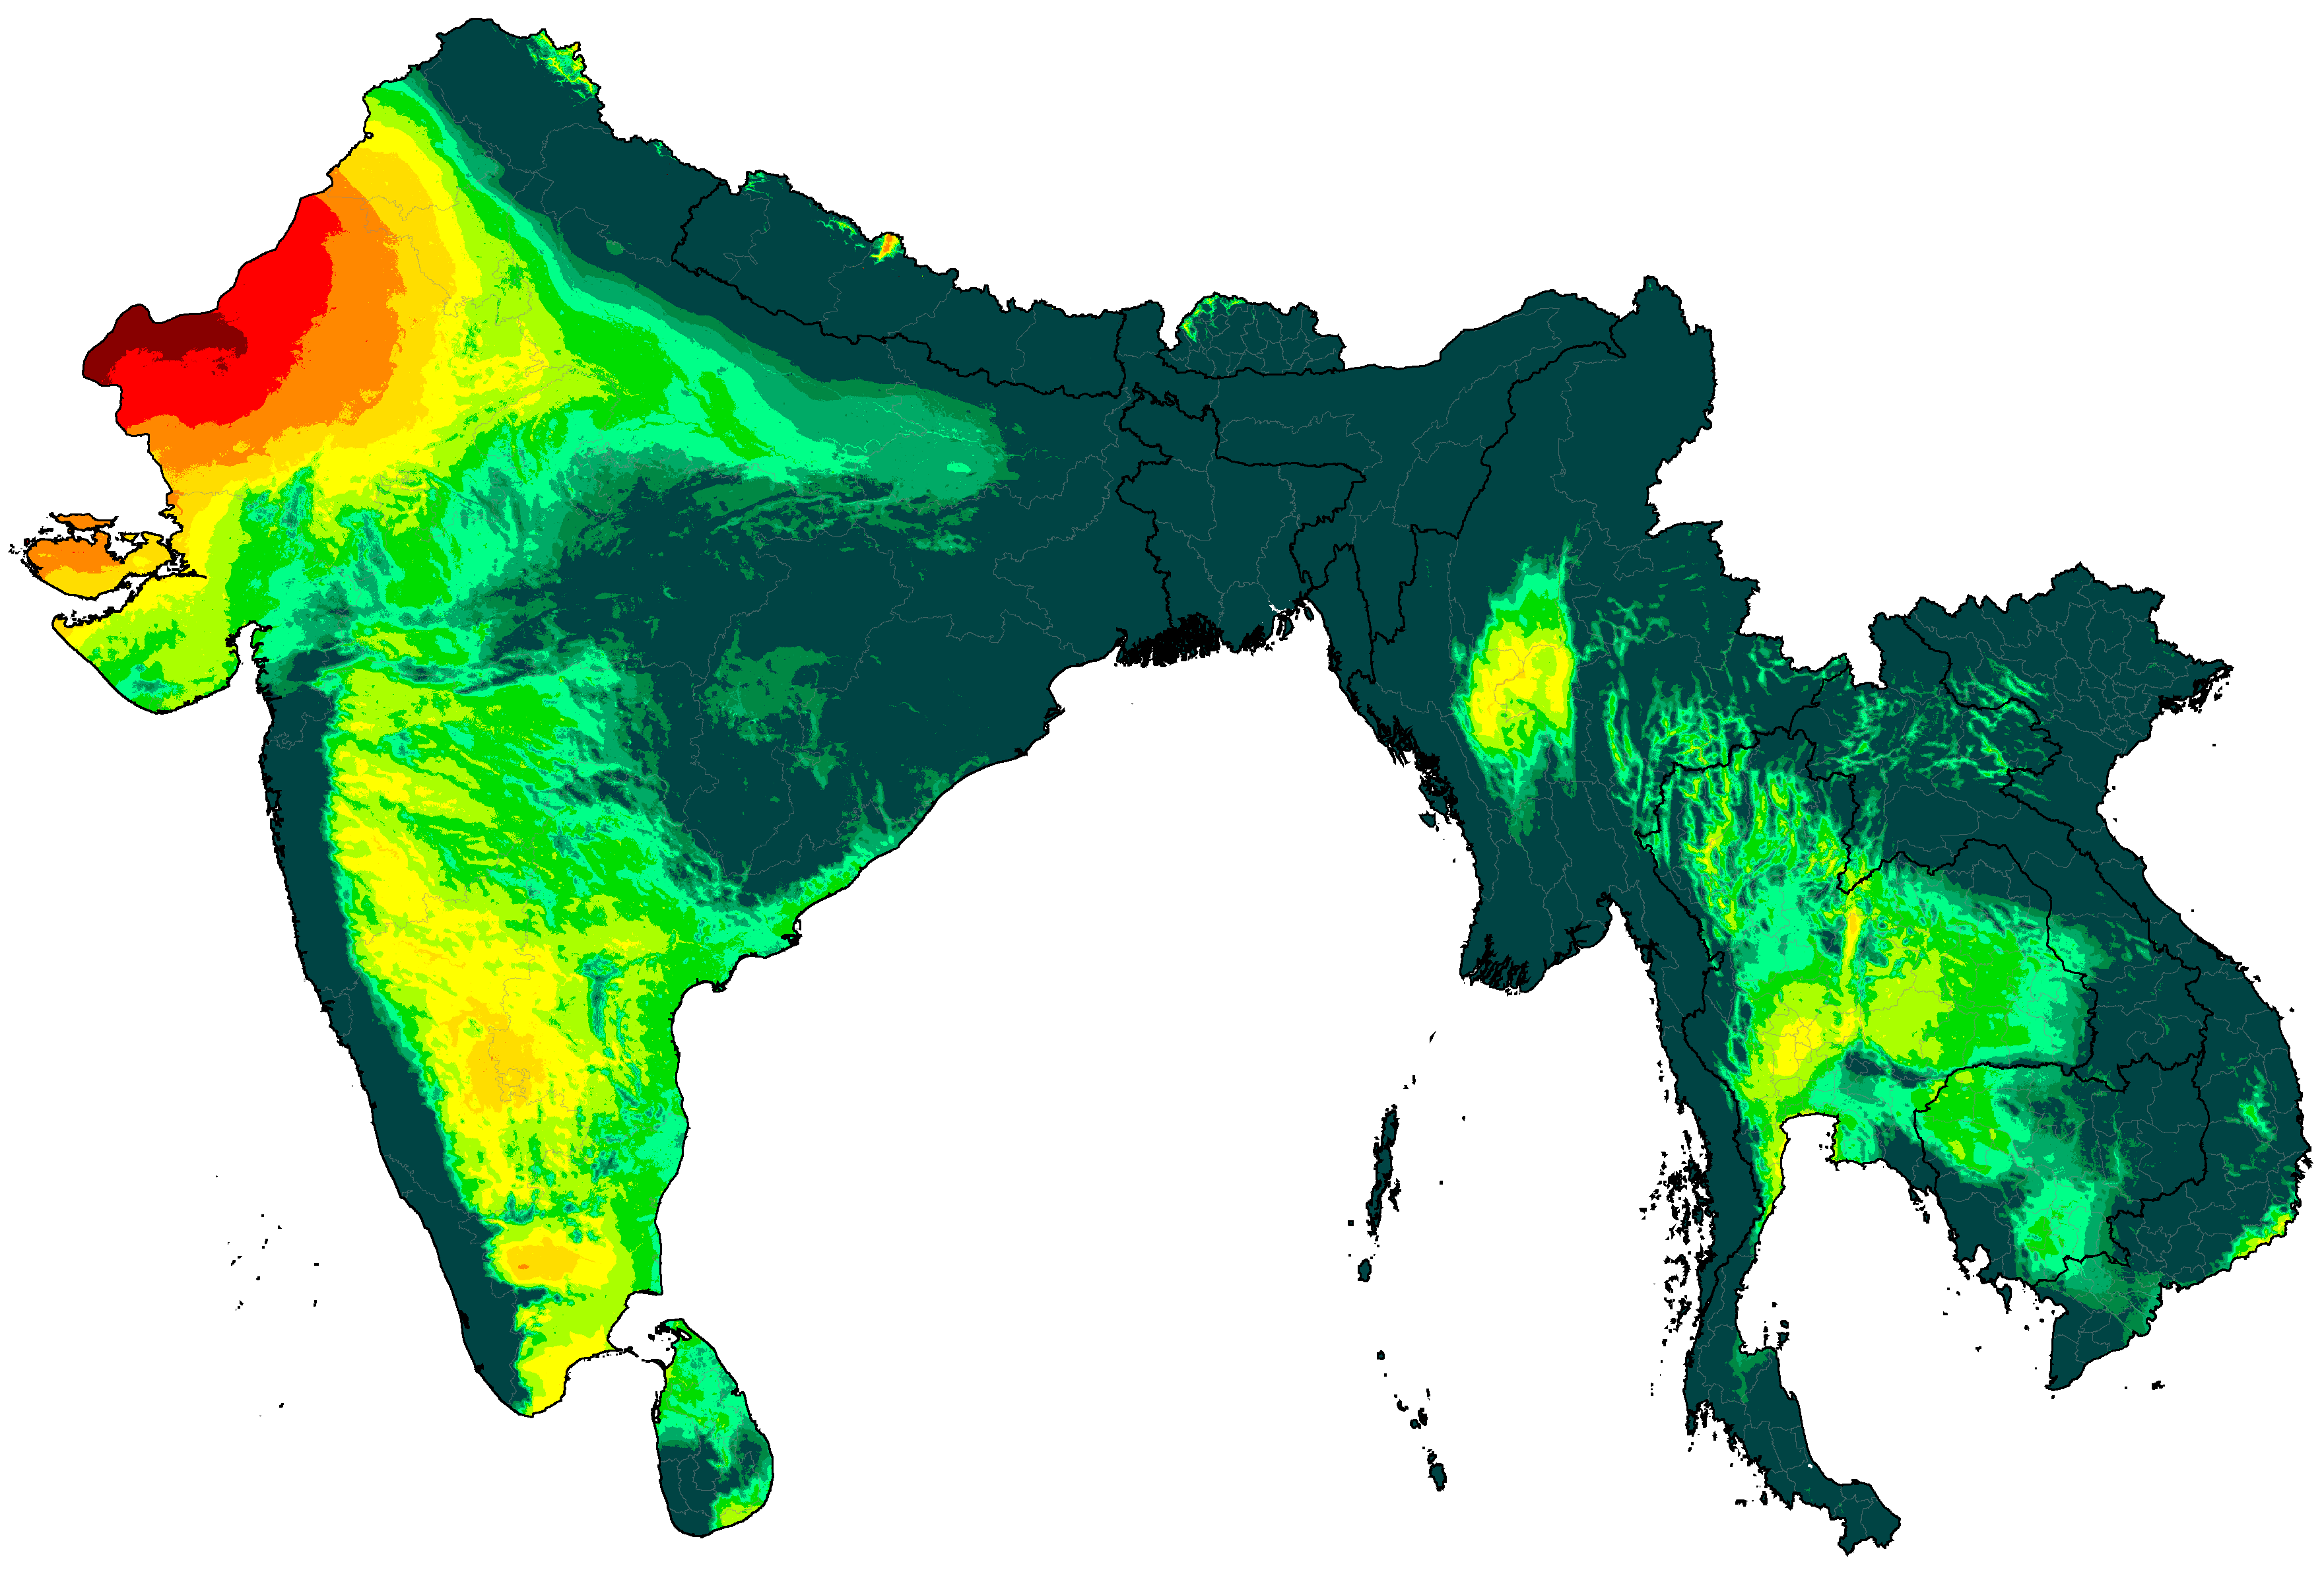
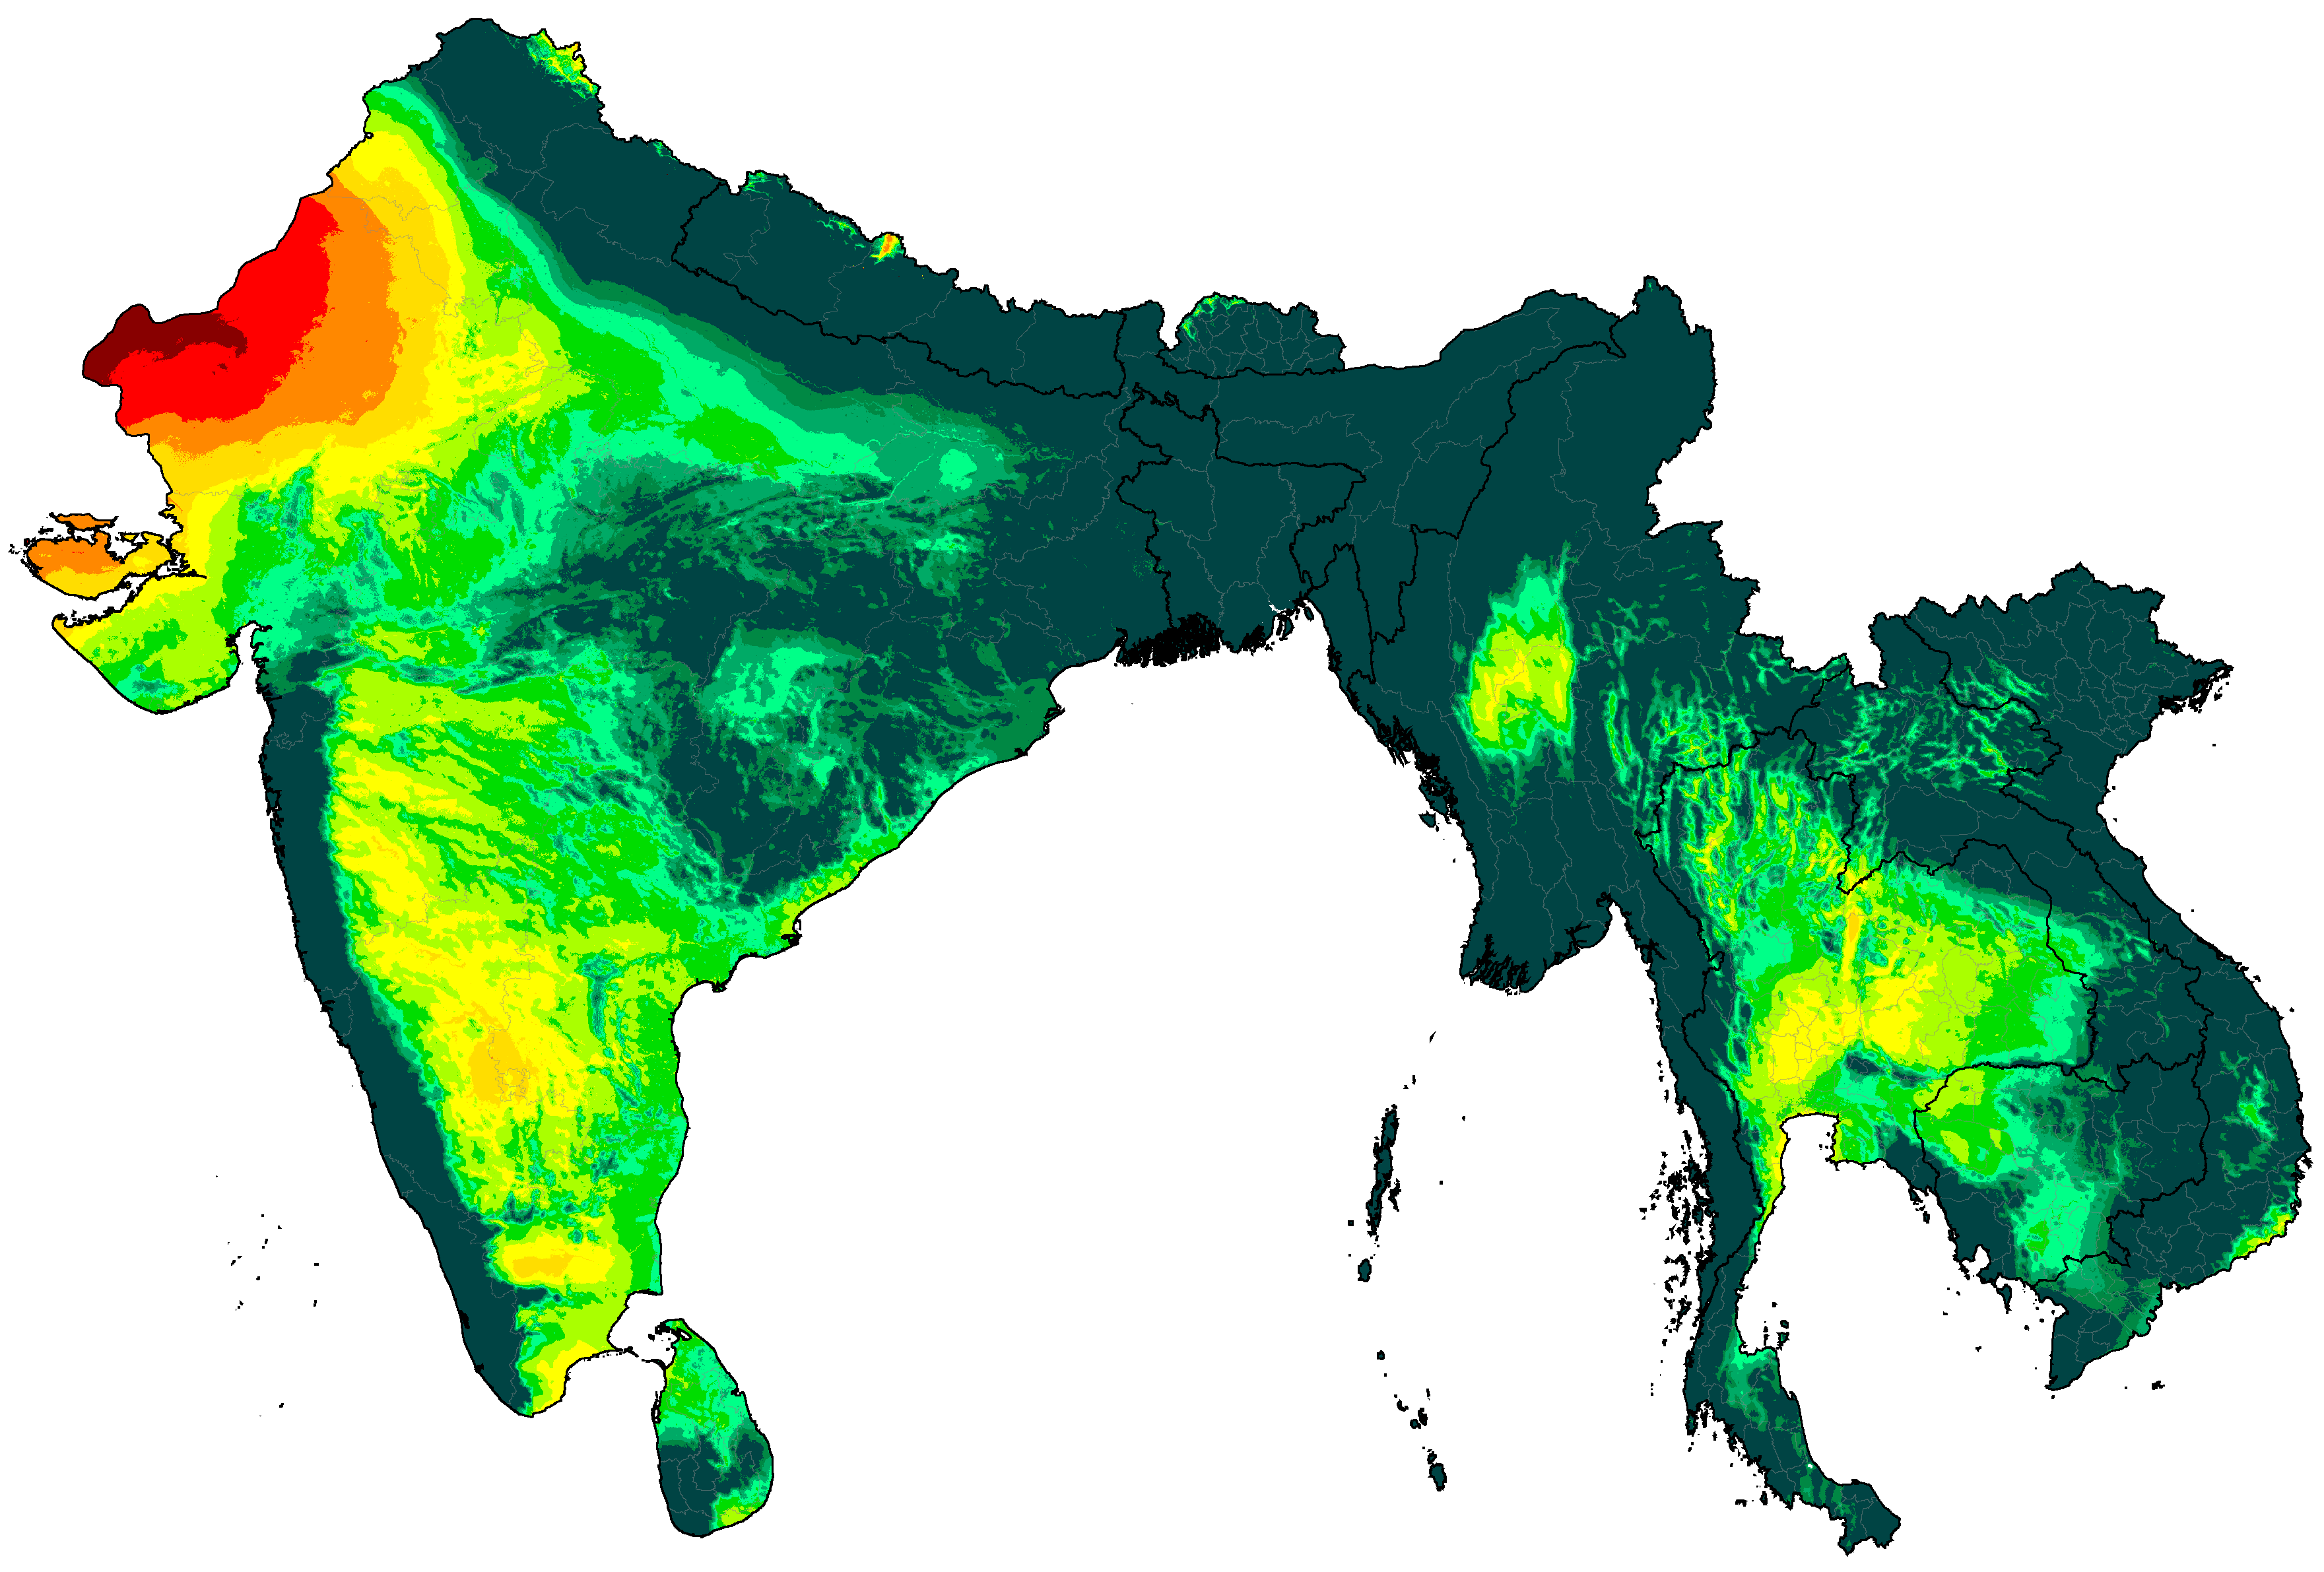
South Asia distribution of P/PET (projections are SSP5-8.5 high emissions normals)
Maritime Southeast Asia distribution of P/PET (projections are SSP5-8.5 high emissions normals)